Multispectral. imaging device. ADVANCED LIGHT ANALYSIS by. Most accurate homogeneity MeasureMent of spectral radiance. UMasterMS1 & UMasterMS2
|
|
|
- Alexandrina Watts
- 5 years ago
- Views:
Transcription


1 Multispectral imaging device Most accurate homogeneity MeasureMent of spectral radiance UMasterMS1 & UMasterMS2 ADVANCED LIGHT ANALYSIS by


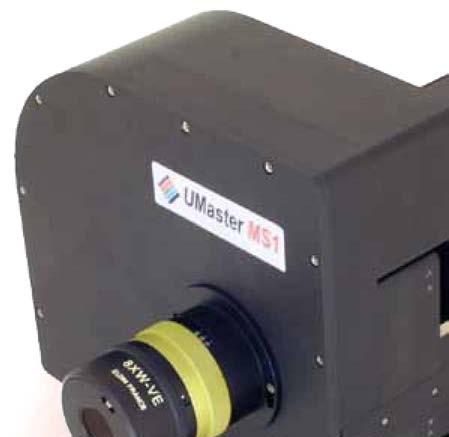
2 UMaster Ms Multispectral Imaging Device UMaster MS Description Multispectral imaging systems generate different images of the same object at different wavelengths. Compare to color imaging this technique is much more powerful avoiding metamerism problems and analyzing in depth the light emission properties of any object. Until now, this technology has been limited to select military, medical and scientific applications. Indeed, absolute measurements are quite difficult to obtain using most of these techniques. We present here a system that allows absolute multispectral measurements in the visible range with excellent accuracy. UMaster MS includes a true 16-bit Peltier cooled CCD camera, different filter wheels with band pass filters and imaging objective telecentric on sensor side. Colorimetry & Multispectral Photograph of Umaster MS High accuracy ELDIM is manufacturing on its own all the key components of its systems. The quality of the optics is optimum thanks to advanced technologies such as magneto-rheological polishing or stitching interferometry. Antireflective coatings and optical alignments are performed in house to reduce straight light. The imaging objective is telecentric on the sensor side which ensures same light collection efficiency at each distance and the same transmittance in all the imaging field for the band pass filters. High sensitivity Peltier cooled CCD sensor with true 16-bit analog digital converter allows optimum sensitivity for UMaster MS. Large size CCD versions can be used to detect very low light levels while maintaining a good resolution. High dynamic Additional neutral densities are available to allow measurements of very bright sources. Band pass filter wheel of UMaster MS high wavelength resolution & Nir UMaster MS uses high quality band pass filters. Two wavelength resolutions are available (10nm for MS1 and 20nm for MS2). All the visible wavelength range is covered ( nm). Near infrared filters up to 950nm can be available on request. A range of imaging objectives UMaster MS is available with an objective of 8 aperture. Additional optics for high spatial resolution are also available. Transmittance of 31 band pass filters 2


 Contrast ratio Data and graphs can be easily exported to other Windows applications.")
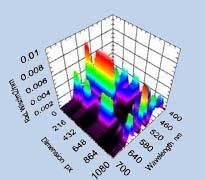
3 Multispectral Imaging Device UMaster Ms Data analysis and software Each UMaster system comes with a powerful, Windows-based software suite created by ELDIM. This software provides extensive instrument control, data acquisition and image analysis capabilities. The software provides also a simple, user-friendly interface to fully automated, pre-programmed capabilities. This enables each customer to perform sophisticated measurements and tests in a completely automated way with limited efforts. UMaster provides a number of tools to analyze completely the multispectral measurements. Luminance and color maps can be computed easily. Spectral information at any position on the image can be extracted and average on small zones is possible. Dedicated algorithms for display analysis are available such as contour extraction, Moiré removal and LED detection and integration. The captured images can be immediately analyzed with comprehensive, integrated graphs, charts and spreadsheets for: Radiance Luminance Color Illuminance Luminous Intensity Total Luminous Flux Irradiance Radiant Intensity Total Radiant Flux CIE Chromaticity Coordinates (x,y, u,v and a,b) Correlated Color Temperature (CCT) Contrast ratio Data and graphs can be easily exported to other Windows applications. Test Card color image on LCD Test Card luminance image on LCD Test Card radiance image on LCD Spectral data on 5 spots Spectral analysis of color checker Spectral data along horizontal Analysis with spot s 3


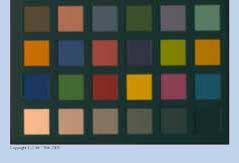
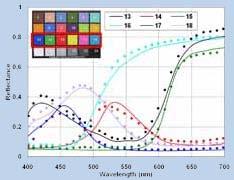
4 UMaster Ms Multispectral Imaging Device color checker color checker illuminated with white LED Spectral reflectance Absolute spectral reflectance is require in many situations. Combined with a stabilized white source UMaster MS can provide easily absolute spectral reflectance in the visible range of any object. Accuracy of the system has been checked using a color checker with 24 different zones of well controlled color and spectral reflectance. The measurement is made using a stabilized white LED illumination. The non-homogeneity of the illumination is corrected making the same measurement on a white reference. The spectral reflection of each zones is then computed taking white zone (19) as reference. Some results are reported hereafter compared to the theoretical spectral reflectance provided by the color checker constructor. Agreement is excellent is quasi all the cases. Spectral reflectance of the different zones (points) compared to theoretical spectra (lines): zone 19 (white) is taken as reference. Z value: 459.7nm Z value: 537.0nm Z value: 609.0nm Spectral reflectance at three different wavelengths 4


5 Multispectral Imaging Device UMaster Ms Radiance of blue LEDs at 459nm LEDWall analysis Due to statistic LED emission dispersion, all LEDWall tiles generally require a colorimetric calibration. This can done using color measurements of each type of LED (generally blue, green and red). Automated procedure have been developed for ELDIM UMaster videocolorimeter. UMaster MS allows more in depth analysis of LEDWall emission. Emission spectra of each LED can be measured directly and mean wavelength emission λ m and wavelength band pass Δλ m can be deduced. For the multispectral imaging measurement, each emission spectrum is extracted and adjusted using a Pearson VII law: M is a shape parameter that is fixed to 1.6 for LED emission spectra. Detailed emission properties of one LEDWall tile can be deduced. In addition to allow luminance and color correction spectral information are useful to understand and reduce the emission imperfections. Correlation between mean wavelength and wavelength band pass for the 1024 blue LEDs of a tile. Emission peak adjustment of blue LED using Pearson VII model Mean wavelength and wavelength band pass for all the blue LEDs of a tile 5


6 UMaster Ms Multispectral Imaging Device Reflective display & aspect UMaster MS can provide full spectral characterization of reflective displays. Global spectral reflectance homogeneity can be checked. The display image aspect can be also predicted under any illumination conditions. Color Measurement of blue state on Ipod display Homogeneity of reflectance at 523nm on IPod display Spectral reflectance homogeneity UMaster MS is capable to provide high spatial resolution spectral information and not only luminance and color measurements. On reflective displays and after normalization with a measurement on a white reference under the same illumination conditions, the spectral reflectance homogeneity can be checked. Diffusion defects can be also easily detected. Image aspect under various illuminants Absolute spectral reflectance for a given image using the reflective display can be measured. Then the display aspect with this image and any type of illumination can be calculated and predicted. 450nm Original image Resulting color image under D65 illumination 550nm Resulting color image under A illumination 650nm Normalized reflectance image for each wavelength Spectral image & selection zone 6

7 Multispectral Imaging Device UMaster Ms UMaster MS comes with a complete software solution for measurement and data analysis. Some characteristics of the EZCom 6 software package for UMaster MS Features Measurement Capacities Data analysis Data export Programming capacities Imaging Radiance Color & Luminance computation Details Color unit: xy, u v, Lu*v* or La*b* Color intensity, Color Difference, Color Dispersion, Color Triangle, Color Temperature, Equivalent Wavelength Cross section (Horizontal, Vertical and free), Isocurves, False Color representation, 3D representation, Smoothing Filtering, Rotation, Clipping, R.O.I. extraction, Averaging, Contour extraction, Moiré removal Spectral reflectance calculation and color computation for any illuminant Average and extraction on rectangular or circular zones Copy to clipboard Save in text and excel format Multi-spots statistics All features can be controlled by OCX interface Examples of automated measurements and analysis provided 7

8 UMaster Ms Multispectral Imaging Device Major specifications of UMaster MS1 & MS2 Common specifications MS1 MS2 Options Imaging lens Front entrance iris Telecentric on sensor Motorized focusing Diameter Other diameters Max 8 Software adjustment 6mm from 2mm to 10mm Additional optics For high spatial resolution (only available for 1.6M pixel sensor) x1 x2 x4 Radiance Band pass Flters from 400 to 700nm Additional NIR filters Densities To add on the imaging objective From ND1 to ND4 Sensor configuration Monochrome Peltier cooled CCD grade x1000 or 1.6M pixels 2000x2000 or 4M pixels Radiance Range Accuracy Repeatability Radiance Luminance Chromaticity (x,y) RMS Radiance Luminance Chromaticity to 500Cd/m 2 up to Cd/m 2 with ND filters ±3% (*1) ±3% for any color stimulus (*2) ±0.003 for A type illuminant (*2) ±0.005 for any color stimulus (*2) ±0.5% for full resolution (*1*3) ±0.5% for full resolution (*1*3) for full resolution (*1*3) Measurement time Radiance <3mn (*4) <90s (*4) Using conditions Temperature range Humidity range 0 to 40 C 0-85% non condensing Interface Compute controlled by OCX components USB 2.0 Power Independent Power Supply AC adapter ( V 50/60Hz) Current consumption 90W Weight 9Kg (*1) For a radiance level higher than 10mW/Sr/m 2 / nm (*2) The accuracy is guarantied for any type of color stimuli in contrast to competitors that generally guaranty only reference white. (*3) The repeatability is given for full resolution. When a binning level N is used it is divided by a factor of N 2. With standard CCD sensor and for a resolution of 375x250 the radiance repeatability is only ±0.03%! (*4) Measurement times are highly dependent on the target and on the conditions. Given times are for a source with a radiance level higher than 10mW/Sr/m 2 /nm at all the wavelengths and already determined optimized exposure times for all the filters. Outer dimension (unit mm) RA-025 V1.0 09/2009 ELDIM S.A. 8 POLYTEC GmbH Polytec-Platz 1-7 D Waldbronn GERMANY Tel: +49 (72 43) Fax: +49 (72 43) osm@polytec.de
Imaging Photometer and Colorimeter
 W E B R I N G Q U A L I T Y T O L I G H T. /XPL&DP Imaging Photometer and Colorimeter Two models available (photometer and colorimetry camera) 1280 x 1000 pixels resolution Measuring range 0.02 to 200,000
ISS-30-VA. Product tags: Integrating Sphere Source. https://www.gigahertz-optik.de/en-us/product/iss-30-va. Gigahertz-Optik GmbH 1/5
 ISS-30-VA https://www.gigahertz-optik.de/en-us/product/iss-30-va Product tags: Integrating Sphere Source Gigahertz-Optik GmbH 1/5 Description standards for spectral radiance Spectroradiometers and other
High spatial resolution imaging colorimeter and gloss-meter for measurements of small parts
 High spatial resolution imaging colorimeter and gloss-meter for measurements of small parts Pierre BOHER, Thierry LEROUX, Thibault BIGNON, ELDIM, 1185 rue d Epron, 94200 Hérouville St Clair (France), Lionel
Spectroradiometer specbos 1201
 Spectroradiometer specbos 1201 specbos 1201 is a precise and compact VIS spectroradiometer. It can be used in laboratory as well as production environment to measure the following quantities: Luminance,
SPECTRAL SCANNER. Recycling
 SPECTRAL SCANNER The Spectral Scanner, produced on an original project of DV s.r.l., is an instrument to acquire with extreme simplicity the spectral distribution of the different wavelengths (spectral
Miniaturized Spectroradiometer
 Miniaturized Spectroradiometer Thomas Morgenstern, Gudrun Bornhoeft, Steffen Goerlich JETI Technische Instrumente GmbH, Jena, Germany Abstract This paper describes the basics of spectroradiometric instruments
Spectroradiometer CS-2000/2000A. The world's top-level capability spectroradiometers make further advances with addition of second model to lineup.
 Spectroradiometer /000A The world's top-level capability spectroradiometers make further advances with addition of second model to lineup. World's top level capability to detect extremely low luminance
Achieving 100,000 : 1 contrast measurement
 NEW Spectroradiometer Highly precise spectral radiance/chromaticity measurement possible from 0.003 cd/m 2 Achieving 100,000 : 1 contrast measurement World's top level capability to detect extremely low
Broadbandradiometer specbos 1211
 Broadbandradiometer specbos 1211 specbos 1211 is a broadband and fast spectroradiometer which can be used in laboratory as well as production environment to measure the following quantities: Luminance,
CS-2000/2000A. Spectroradiometer NEW
 Spectroradiometer NEW CS-000/000A The world's top-level capability spectroradiometers make further advances with addition of second model to lineup. World's top level capability to detect extremely low
We bring quality to light. MAS 40 Mini-Array Spectrometer
 MAS 40 Mini-Array Spectrometer Features at a glance Cost-effective and robust CCD spectrometer technology Standard USB interface Compatible with all Instrument Systems measuring adapters Different models
Spectroradiometer CS-2000/2000A. The world's top-level capability spectroradiometers make further advances with addition of second model to lineup.
 Spectroradiometer CS-000/000A The world's top-level capability spectroradiometers make further advances with addition of second model to lineup. 15 World's top level capability to detect extremely low
NEAR EYE DISPLAY (NED) SPECTRORADIOMETER SYSTEMS DATASHEET
 SPECTRORADIOMETER SYSTEMS DATASHEET") REPLACE NEAR EYE DISPLAY (NED) SPECTRORADIOMETER SYSTEMS DATASHEET 9925 Carroll Canyon Road San Diego, CA 92131 (800) 637-2758 (858) 279-8034 Fax (858) 576-9286 www.gamma-sci.com About Gamma Scientific:
REPLACE NEAR EYE DISPLAY (NED) SPECTRORADIOMETER SYSTEMS DATASHEET 9925 Carroll Canyon Road San Diego, CA 92131 (800) 637-2758 (858) 279-8034 Fax (858) 576-9286 www.gamma-sci.com About Gamma Scientific:
Unprecedented Resolution and Accuracy For Camera & Image Sensor Calibration
 SpectralLED RS-7-1-VIS Benchtop Uniform Light Source For the ultimate in resolution and accuracy, the SpectralLED Tunable VIS source incorporates 35 discrete wavelengths for synthesis of commercially available
JETI Specbos Instruments
 Spectral measuring instruments for various applications JETI Specbos Instruments The new Specbos family offers compact, spectrometric instruments, designed to measure the color coordinates, spectral characteristics
Ideal for display mura (nonuniformity) evaluation and inspection on smartphones and tablet PCs.
 evaluation and inspection on smartphones and tablet PCs.") 2D Color Analyzer 8 Ideal for display mura (nonuniformity) evaluation and inspection on smartphones and tablet PCs. Accurately and easily measures the distribution of luminance and chromaticity. Advanced
2D Color Analyzer 8 Ideal for display mura (nonuniformity) evaluation and inspection on smartphones and tablet PCs. Accurately and easily measures the distribution of luminance and chromaticity. Advanced
Novel Approach for LED Luminous Intensity Measurement
 Novel Approach for LED Luminous Intensity Measurement Ron Rykowski Hubert Kostal, Ph.D. * Radiant Imaging, Inc., 15321 Main Street NE, Duvall, WA, 98019 ABSTRACT Light emitting diodes (LEDs) are being
POTENTIAL OF MULTISPECTRAL TECHNIQUES FOR MEASURING COLOR IN THE AUTOMOTIVE SECTOR
 POTENTIAL OF MULTISPECTRAL TECHNIQUES FOR MEASURING COLOR IN THE AUTOMOTIVE SECTOR Meritxell Vilaseca, Francisco J. Burgos, Jaume Pujol 1 Technological innovation center established in 1997 with the aim
INNOVATIVE CAMERA CHARACTERIZATION BASED ON LED LIGHT SOURCE
 Image Engineering imagequalitytools INNOVATIVE CAMERA CHARACTERIZATION BASED ON LED LIGHT SOURCE Image Engineering Relative Power ILLUMINATION DEVICES imagequalitytools The most flexible LED-based light
NFMS THEORY LIGHT AND COLOR MEASUREMENTS AND THE CCD-BASED GONIOPHOTOMETER. Presented by: January, 2015 S E E T H E D I F F E R E N C E
 NFMS THEORY LIGHT AND COLOR MEASUREMENTS AND THE CCD-BASED GONIOPHOTOMETER Presented by: January, 2015 1 NFMS THEORY AND OVERVIEW Contents Light and Color Theory Light, Spectral Power Distributions, and
Ideal for display mura (nonuniformity) evaluation and inspection on smartphones and tablet PCs.
 evaluation and inspection on smartphones and tablet PCs.") 2D Color Analyzer Ideal for display mura (nonuniformity) evaluation and inspection on smartphones and tablet PCs. Accurately and easily measures the distribution of luminance and chromaticity. The included
2D Color Analyzer Ideal for display mura (nonuniformity) evaluation and inspection on smartphones and tablet PCs. Accurately and easily measures the distribution of luminance and chromaticity. The included
DEFINING A SPARKLE MEASUREMENT STANDARD FOR QUALITY CONTROL OF ANTI-GLARE DISPLAYS Presented By Matt Scholz April 3, 2018
 DEFINING A SPARKLE MEASUREMENT STANDARD FOR QUALITY CONTROL OF ANTI-GLARE DISPLAYS Presented By Matt Scholz April 3, 2018 Light & Color Automated Visual Inspection Global Support TODAY S AGENDA Anti-Glare
A High-Speed Imaging Colorimeter LumiCol 1900 for Display Measurements
 A High-Speed Imaging Colorimeter LumiCol 19 for Display Measurements Shigeto OMORI, Yutaka MAEDA, Takehiro YASHIRO, Jürgen NEUMEIER, Christof THALHAMMER, Martin WOLF Abstract We present a novel high-speed
Solid State Luminance Standards
 Solid State Luminance Standards Color and luminance correction of: - Imaging colorimeters - Luminance meters - Imaging spectrometers Compact and Robust for Production Environments Correct for instrument
Gamma Scientific Display Measurement Systems
 Gamma Scientific Display Measurement Systems 9925 Carroll Canyon Road San Diego, CA 92131 858-279-8034 contact@gamma-sci.com www.gamma-sci.com Since 1961 Gamma Scientific has produced LED, display and
WHITE PAPER. Methods for Measuring Flat Panel Display Defects and Mura as Correlated to Human Visual Perception
 Methods for Measuring Flat Panel Display Defects and Mura as Correlated to Human Visual Perception Methods for Measuring Flat Panel Display Defects and Mura as Correlated to Human Visual Perception Abstract
pco.edge 4.2 LT 0.8 electrons 2048 x 2048 pixel 40 fps up to :1 up to 82 % pco. low noise high resolution high speed high dynamic range
 edge 4.2 LT scientific CMOS camera high resolution 2048 x 2048 pixel low noise 0.8 electrons USB 3.0 small form factor high dynamic range up to 37 500:1 high speed 40 fps high quantum efficiency up to
IMAGE SENSOR SOLUTIONS. KAC-96-1/5" Lens Kit. KODAK KAC-96-1/5" Lens Kit. for use with the KODAK CMOS Image Sensors. November 2004 Revision 2
 KODAK for use with the KODAK CMOS Image Sensors November 2004 Revision 2 1.1 Introduction Choosing the right lens is a critical aspect of designing an imaging system. Typically the trade off between image
GCMS-3 GONIOSPECTROPHOTOMETER SYSTEM
 MURAKAMI Color Research Laboratory 11-3 Kachidoki 3-Chome Chuo-Ku Tokyo 104 Japan Tel: +81 3 3532 3011 Fax: +81 3 3532 2056 GCMS-3 GONIOSPECTROPHOTOMETER SYSTEM GSP-1 Main System Overview The colour and
idonus UV-LED exposure system for photolithography
 idonus UV-LED exposure system for photolithography UV-LED technology is an attractive alternative to traditional arc lamp illumination. The benefits of UV-LEDs are manyfold and significant for photolithography.
Improving the Collection Efficiency of Raman Scattering
 PERFORMANCE Unparalleled signal-to-noise ratio with diffraction-limited spectral and imaging resolution Deep-cooled CCD with excelon sensor technology Aberration-free optical design for uniform high resolution
WP640 Imaging Colorimeter. Backlit Graphics Panel Analysis
 Westboro Photonics 1505 Carling Ave, Suite 301 Ottawa, ON K1V 3L7 Wphotonics.com WP640 Imaging Colorimeter Backlit Graphics Panel Analysis Issued: May 5, 2014 Table of Contents 1.0 WP600 SERIES IMAGING
BioSpectrum Imaging System
 BioSpectrum Imaging System Imaging Made Easy for Chemiluminescence Bioluminescence Colorimetric Fluorescence MegaCam 810 Camera OptiChemi 610 Camera BioChemi 510 Camera GelCam 310 Camera 8.1 megapixel
Estimation of spectral response of a consumer grade digital still camera and its application for temperature measurement
 Indian Journal of Pure & Applied Physics Vol. 47, October 2009, pp. 703-707 Estimation of spectral response of a consumer grade digital still camera and its application for temperature measurement Anagha
We bring quality to light. LumiCam 1300 Imaging Photometer/Colorimeter
 We bring quality to light. LumiCam 1300 Imaging Photometer/Colorimeter Technical Overview Functionality Applications Specifications Key features at a glance Three models: Mono, Color, Advanced 1370 x 1020
pco.1300 solar cooled digital 12bit CCD camera system
 pco.1300 solar cooled digital 12bit CCD camera system designed for electroluminescence (EL) applications quantum efficiency of up to 13 % @ 880 nm superior low noise of typ. 6 e - rms @ 10 MHz resolution
MS260i 1/4 M IMAGING SPECTROGRAPHS
 MS260i 1/4 M IMAGING SPECTROGRAPHS ENTRANCE EXIT MS260i Spectrograph with 3 Track Fiber on input and InstaSpec IV CCD on output. Fig. 1 OPTICAL CONFIGURATION High resolution Up to three gratings, with
PHOTO RESEARCH, INC. PR-730 / PR-735 and PR-740 / PR-745 SpectraScan
 PHOTO RESEARCH, INC. PR-730 / PR-735 and PR-740 / PR-745 SpectraScan 0.000005 fl 0.0001 fl Polarization Error - Under 0.20% Introduction We have taken our decades of experience and built it into the ultimate
Why select a BOS zoom lens over a COTS lens?
 Introduction The Beck Optronic Solutions (BOS) range of zoom lenses are sometimes compared to apparently equivalent commercial-off-the-shelf (or COTS) products available from the large commercial lens
Optical basics for machine vision systems. Lars Fermum Chief instructor STEMMER IMAGING GmbH
 Optical basics for machine vision systems Lars Fermum Chief instructor STEMMER IMAGING GmbH www.stemmer-imaging.de AN INTERNATIONAL CONCEPT STEMMER IMAGING customers in UK Germany France Switzerland Sweden
specification display & lighting hera spectrometer
 specification display & lighting hera spectrometer Contents 1 Hera: cost effective spectrometer... 3 2 Highlights... 3 3 Speed & ease of use... 4 1 General specification Hera... 4 2 Hera series specifications...
Company synopsis. MSU series
 MSU series 1 2 Company synopsis Majantys, part of Pleiades Group along with Pleiades Instruments, is an optoelectronic system maker, designing and manufacturing for specific systems such as photometric
WaveMaster IOL. Fast and accurate intraocular lens tester
 WaveMaster IOL Fast and accurate intraocular lens tester INTRAOCULAR LENS TESTER WaveMaster IOL Fast and accurate intraocular lens tester WaveMaster IOL is a new instrument providing real time analysis
Difrotec Product & Services. Ultra high accuracy interferometry & custom optical solutions
 Difrotec Product & Services Ultra high accuracy interferometry & custom optical solutions Content 1. Overview 2. Interferometer D7 3. Benefits 4. Measurements 5. Specifications 6. Applications 7. Cases
A simulation tool for evaluating digital camera image quality
 A simulation tool for evaluating digital camera image quality Joyce Farrell ab, Feng Xiao b, Peter Catrysse b, Brian Wandell b a ImagEval Consulting LLC, P.O. Box 1648, Palo Alto, CA 94302-1648 b Stanford
Luminous Flux (lumens) System LM-ISP-XXXX
 System LM-ISP-XXXX") Company Profile Taiwan Optimum Optoelectrics Co., Ltd. is Taiwan's the first of photometric and colorimetric measurement equipments and professional supplier of calibration services in Taiwan. In particular,
Company Profile Taiwan Optimum Optoelectrics Co., Ltd. is Taiwan's the first of photometric and colorimetric measurement equipments and professional supplier of calibration services in Taiwan. In particular,
Spectral Analysis of the LUND/DMI Earthshine Telescope and Filters
 Spectral Analysis of the LUND/DMI Earthshine Telescope and Filters 12 August 2011-08-12 Ahmad Darudi & Rodrigo Badínez A1 1. Spectral Analysis of the telescope and Filters This section reports the characterization
Dual-FL. World's Fastest Fluorometer. Measure absorbance spectra and fluorescence simultaneously FLUORESCENCE
 Dual-FL World's Fastest Fluorometer Measure absorbance spectra and fluorescence simultaneously FLUORESCENCE 100 Times Faster Data Collection The only simultaneous absorbance and fluorescence system available
High-Accuracy Luminance & Chromaticity Measurement Comparable to Many Spectroradiometers
 New Auto Mode increases accuracy at low luminance levels CHROMA METER CS-200 Suitable for measurement of optical devices such as LCDs, PDPs, organic ELs, FEDs and LEDs. 1.0 0.5 380 400 500 600 700 (nm)
LED Lighting Flux and Color Measurement System (LFC)
") LED Lighting Flux and Color Measurement System (LFC) Fast, accurate and complete System for research and production LFC System is a high cost efficiency light measurement system. The system is designed
LED Lighting Flux and Color Measurement System (LFC) Fast, accurate and complete System for research and production LFC System is a high cost efficiency light measurement system. The system is designed
Full Spectrum. Full Calibration. Full Testing. Collimated Optics, Software and Uniform Source Solutions
 Full Spectrum. Full Calibration. Full Testing. Collimated Optics, Software and Uniform Source Solutions Combining the Expertise of Two Industry Leaders to Give You An Immense Range of Complete Electro-Optical
Automated Imaging Technology to Simplify Your Workflow!
 Automated Imaging Technology to Simplify Your Workflow! BioSpectrum Imaging System Imaging Made Easy for Chemiluminescence Bioluminescence Colorimetric Fluorescence MegaCam 810 Camera OptiChemi 600 Camera
Digital Image Processing
 Digital Image Processing Lecture # 3 Digital Image Fundamentals ALI JAVED Lecturer SOFTWARE ENGINEERING DEPARTMENT U.E.T TAXILA Email:: ali.javed@uettaxila.edu.pk Office Room #:: 7 Presentation Outline
The Art of Light Measurement. Avantes BV Apeldoorn, The Netherlands
 The Art of Light Measurement Avantes BV Apeldoorn, The Netherlands Who am I? Ger Loop Product Manager Avantes BV Oude Apeldoornseweg 28 7333 NS APELDOORN The Netherlands Phone: (+31) 313 670170 Fax: (+31)
Aqualog. CDOM Measurements Made Easy PARTICLE CHARACTERIZATION ELEMENTAL ANALYSIS FLUORESCENCE GRATINGS & OEM SPECTROMETERS OPTICAL COMPONENTS RAMAN
 Aqualog CDOM Measurements Made Easy ELEMENTAL ANALYSIS FLUORESCENCE GRATINGS & OEM SPECTROMETERS OPTICAL COMPONENTS PARTICLE CHARACTERIZATION RAMAN SPECTROSCOPIC ELLIPSOMETRY SPR IMAGING CDOM measurements
Specifications. Offers the best spatial resolution for multi-stripe spectroscopy. Provides the user the choice of either high accuracy slit mechanism
 SpectraPro Series Monochromators and Spectrographs The PI/Acton SpectraPro Series imaging spectrographs and monochromators represent the latest advance in the industry-standard SpectraPro family. The SpectraPro
LED Tester BTS256-LED
 1 LED Tester BTS256-LED The BTS256-LED tester is one of the most compact light measurement devices with integrated integrating sphere for high accuracy measurement of luminous flux, spectral and color
Product tags: VIS, Spectral Data, Color Temperature, CRI, Bilirubin, PAR, Scotopic, Luminous Color, Photometry, General lighting
 MSC15 http://www.gigahertz-optik.de/en-us/product/msc15 Product tags: VIS, Spectral Data, Color Temperature, CRI, Bilirubin, PAR, Scotopic, Luminous Color, Photometry, General lighting Gigahertz-Optik
Instruction manual for Ocean Optics USB4000 and QE65 Pro spectroradiometers
 Aalto University School of Electrical Engineering Metrology Research Institute Hans Baumgartner Instruction manual for Version 1.0 24/11/2016 Page 2 (9) 1. Table of contents 1. Table of contents... 2 2.
MICRO SPECTRAL SCANNER
 MICRO SPECTRAL SCANNER The OEM μspectral Scanner is a components kit that can be interfaced to existing microscope ready to accept cameras with Cmount to obtain an hyper-spectral imaging system. With OEM
Microscope-Spectrometer
 20 Micro-spectrometer ToupTek s spectrometer is applicable for spectral detection within the wavelength range between 200nm and 1100nm. Due to their high stability and performance, these portable instruments
The only simultaneous absorbance and f uorescence system for water quality analysis! Aqualog
 The only simultaneous absorbance and fluorescence system for water quality analysis! Aqualog CDOM measurements made easy. The only simultaneous absorbance and fluorescence system for water quality analysis!
BTS2048-VL-CP-ILED-B-IS-1.0-HL
 BTS2048-VL-CP-ILED-B-IS-1.0-HL https://www.gigahertz-optik.de/en-us/product/bts2048-vl-cp-iled-b-is-1.0-hl Product tags: VIS, NIR, Spectral Data, LED Binning, CIE 127, ILED-B, LED Gigahertz-Optik GmbH
MUSKY: Multispectral UV Sky camera. Valentina Caricato, Andrea Egidi, Marco Pisani and Massimo Zucco, INRIM
 MUSKY: Multispectral UV Sky camera Valentina Caricato, Andrea Egidi, Marco Pisani and Massimo Zucco, INRIM Outline Purpose of the instrument Required specs Hyperspectral or multispectral? Optical design
pco.1600 cooled digital 14bit CCD camera system
 pco.1600 cooled digital 14bit CCD camera system n excellent resolution (1600 1200 pixel) n 14 bit dynamic range n frame rate of 30 fps at full resolution n image memory in camera (camram up to 4 GB) n
Camera Overview. Digital Microscope Cameras for Material Science: Clear Images, Precise Analysis. Digital Cameras for Microscopy
 Digital Cameras for Microscopy Camera Overview For Materials Science Microscopes Digital Microscope Cameras for Material Science: Clear Images, Precise Analysis Passionate about Imaging: Olympus Digital
12/02/2017. From light to colour spaces. Electromagnetic spectrum. Colour. Correlated colour temperature. Black body radiation.
 From light to colour spaces Light and colour Advanced Graphics Rafal Mantiuk Computer Laboratory, University of Cambridge 1 2 Electromagnetic spectrum Visible light Electromagnetic waves of wavelength
FPM(L)-NIR(1100) Content PRODUCT SPECIFICATION
-NIR(1100) Content PRODUCT SPECIFICATION") LC-Tec Displays AB FPM(L)-NIR(1100) product specification February, 2016 FPM(L)-NIR(1100) PRODUCT SPECIFICATION Content 1. Revision history... 2 2. Product description... 2 3. Ordering information... 2
LC-Tec Displays AB FPM(L)-NIR(1100) product specification February, 2016 FPM(L)-NIR(1100) PRODUCT SPECIFICATION Content 1. Revision history... 2 2. Product description... 2 3. Ordering information... 2
A Spectral Database of Commonly Used Cine Lighting Andreas Karge, Jan Fröhlich, Bernd Eberhardt Stuttgart Media University
 A Spectral Database of Commonly Used Cine Lighting Andreas Karge, Jan Fröhlich, Bernd Eberhardt Stuttgart Media University Slide 1 Outline Motivation: Why there is a need of a spectral database of cine
Ultimate and Versatile 2D Spectroradiometer is finally released!
 N E W Ultimate and Versatile 2D Spectroradiometer is finally released! 2D Spectroradiometer / World First Absolute 2D Spectroradiometer with Luminance & Chromaticity Accuracy Guarantee! The convertible
INTERFEROMETER VI-direct
 Universal Interferometers for Quality Control Ideal for Production and Quality Control INTERFEROMETER VI-direct Typical Applications Interferometers are an indispensable measurement tool for optical production
"SIMPLE MEASUREMENT, ADVANCED RESULTS"
 "SIMPLE MEASUREMENT, ADVANCED RESULTS" 1 Phasics offers the most innovative solutions for lens and objectives quality control in R&D and production. Relying on a unique wavefront technology, the quadriwave
Camera Overview. Digital Microscope Cameras for Material Science: Clear Images, Precise Analysis. Digital Cameras for Microscopy
 Digital Cameras for Microscopy Camera Overview For Materials Science Microscopes Digital Microscope Cameras for Material Science: Clear Images, Precise Analysis Passionate about Imaging: Olympus Digital
RGB Laser Meter TM6102, RGB Laser Luminance Meter TM6103, Optical Power Meter TM6104
 1 RGB Laser Meter TM6102, RGB Laser Luminance Meter TM6103, Optical Power Meter TM6104 Abstract The TM6102, TM6103, and TM6104 accurately measure the optical characteristics of laser displays (characteristics
REPLICATING HUMAN VISION FOR ACCURATE TESTING OF AR/VR DISPLAYS Presented By Eric Eisenberg February 22, 2018
 REPLICATING HUMAN VISION FOR ACCURATE TESTING OF AR/VR DISPLAYS Presented By Eric Eisenberg February 22, 2018 Light & Color Automated Visual Inspection Global Support TODAY S AGENDA Challenges in Near-Eye
In sum the named factors cause differences for multicolor LEDs visible with the human eye, which can be compensated with color sensors.
 APPLICATION REPORT 1. Introduction As a result of the numerous amounts of technical, economical, environmental and design advantages of LEDs versus conventional light sources, LEDs are located in more
Instructions for the Experiment
 Instructions for the Experiment Excitonic States in Atomically Thin Semiconductors 1. Introduction Alongside with electrical measurements, optical measurements are an indispensable tool for the study of
QE65000 Spectrometer. Scientific-Grade Spectroscopy in a Small Footprint. now with. Spectrometers
 QE65000 Spectrometer Scientific-Grade Spectroscopy in a Small Footprint QE65000 The QE65000 Spectrometer is the most sensitive spectrometer we ve developed. Its Hamamatsu FFT-CCD detector provides 90%
Optical In-line Control of Web Coating Processes
 AIMCAL Europe 2012 Peter Lamparter Web Coating Conference Carl Zeiss MicroImaging GmbH 11-13 June / Prague, Czech Republic Carl-Zeiss-Promenade 10 07745 Jena, Germany p.lamparter@zeiss.de +49 3641 642221
Morris Products 53 Carey Road, Queensbury, NY 12804
 Catalog Number 72662 UPC Number 60198672662 Description 8" Recessed Downlight 25 Watt Features Phillips LUMILED LUXEON 3030 LED's Can be installed in most 8" Downlights Aluminum Housing/Trim - paintable
Quantitative Hyperspectral Imaging Technique for Condition Assessment and Monitoring of Historical Documents
 bernard j. aalderink, marvin e. klein, roberto padoan, gerrit de bruin, and ted a. g. steemers Quantitative Hyperspectral Imaging Technique for Condition Assessment and Monitoring of Historical Documents
LED Lighting for Machine Vision
 LED Lighting for Machine Vision Catalog 2011 LAT elektronik AB Member of the Polytec Organization www.latab.net LED lighting for machine vision About LATAB LAT elektronik AB (LED Array Technology) was
WHITE PAPER. Guide to CCD-Based Imaging Colorimeters
 Guide to CCD-Based Imaging Colorimeters How to choose the best imaging colorimeter CCD-based instruments offer many advantages for measuring light and color. When configured effectively, CCD imaging systems
ELEC Dr Reji Mathew Electrical Engineering UNSW
 ELEC 4622 Dr Reji Mathew Electrical Engineering UNSW Filter Design Circularly symmetric 2-D low-pass filter Pass-band radial frequency: ω p Stop-band radial frequency: ω s 1 δ p Pass-band tolerances: δ
Lumen lm 1 lm= 1cd 1sr The luminous flux emitted into unit solid angle (1 sr) by an isotropic point source having a luminous intensity of 1 candela
 by an isotropic point source having a luminous intensity of 1 candela") WORD BANK Light Measurement Units UNIT Abbreviation Equation Definition Candela cd 1 cd= 1(lm/sr) The SI unit of luminous intensity. One candela is the luminous intensity, in a given direction, of a source
WORD BANK Light Measurement Units UNIT Abbreviation Equation Definition Candela cd 1 cd= 1(lm/sr) The SI unit of luminous intensity. One candela is the luminous intensity, in a given direction, of a source
Oriel MS260i TM 1/4 m Imaging Spectrograph
 Oriel MS260i TM 1/4 m Imaging Spectrograph MS260i Spectrograph with 3 Track Fiber on input and InstaSpec CCD on output. The MS260i 1 4 m Imaging Spectrographs are economical, fully automated, multi-grating
LATAB Industrial LED Lighting
 LED Lighting for Machine Vision Catalog 2011 LAT elektronik AB Member of the Polytec Organization www.latab.net LED lighting for machine vision About LAT elektronik AB (LED Array Technology) was founded
Color appearance in image displays
 Rochester Institute of Technology RIT Scholar Works Presentations and other scholarship 1-18-25 Color appearance in image displays Mark Fairchild Follow this and additional works at: http://scholarworks.rit.edu/other
Specifications Summary 1. Array Size (pixels) Pixel Size. Sensor Size. Pixel Well Depth (typical) 95,000 e - 89,000 e -
 Pixel Size. Sensor Size. Pixel Well Depth (typical) 95,000 e - 89,000 e -") Apogee Alta Series System Features 1 High Resolution Sensor 1.0 Megapixel sensor with 13 mm pixels delivers a large field of view with high resolution. Programmable TE cooling down to 50 o C below ambient
Apogee Alta Series System Features 1 High Resolution Sensor 1.0 Megapixel sensor with 13 mm pixels delivers a large field of view with high resolution. Programmable TE cooling down to 50 o C below ambient
Properties of LED considering museum lighting
 Properties of LED considering museum lighting Carsten Dam-Hansen, DTU Fotonik Contents Solid State Lighting (SSL) i.e. LED based lighting is a new lighting technology that may offer many advantages for
GL spectis 1.0 Touch The world s first smart spectrometer.
 TM Touch the technology GL spectis 1.0 Touch The world s first smart spectrometer. Enter the world of smart spectrometers GL Optic offers a complete line of measuring instruments using the latest smart
Camera Requirements For Precision Agriculture
 Camera Requirements For Precision Agriculture Radiometric analysis such as NDVI requires careful acquisition and handling of the imagery to provide reliable values. In this guide, we explain how Pix4Dmapper
TOP 200. Telescopic Optical Probe for Radiance and Luminance Measurements. Two Global Leaders. One Complete Solution.
 TOP 200 Telescopic Optical Probe for Radiance and Luminance Measurements Two Global Leaders. One Complete Solution. Our story Two Global Leaders. One Complete Solution. Konica Minolta Sensing Americas
CAMAG TLC VISUALIZER 2
 CAMAG TLC VISUALIZER 2 Professional Imaging and Documentation System for TLC/HPTLC Chromatograms with a new Digital CCD Camera, connected by USB 3.0 WORLD LEADER IN PLANAR CHROMATOGRAPHY Visualization,
Chameleon Spectroradiometer
 Chameleon Spectroradiometer SPEED / STABILITY / ACCURACY The Chameleon Series is designed to measure the absolute spectral of power, of the light under test. Adding optical probes and absolute calibration
Laser Speckle Reducer LSR-3000 Series
 Datasheet: LSR-3000 Series Update: 06.08.2012 Copyright 2012 Optotune Laser Speckle Reducer LSR-3000 Series Speckle noise from a laser-based system is reduced by dynamically diffusing the laser beam. A
Color and Image Characterization of a Three CCD Seven Band Spectral Camera
 Color and Image Characterization of a Three CCD Seven Band Spectral Camera Ana Gebejes, Joni Orava, Niko Penttinen, Ville Heikkinen, Jouni Hiltunen, and Markku Hauta-Kasari University of Eastern Finland,
X-ray generation by femtosecond laser pulses and its application to soft X-ray imaging microscope
 X-ray generation by femtosecond laser pulses and its application to soft X-ray imaging microscope Kenichi Ikeda 1, Hideyuki Kotaki 1 ' 2 and Kazuhisa Nakajima 1 ' 2 ' 3 1 Graduate University for Advanced
X-SCOPE Ultra large FOV micro video colorimeter
 To obtain more information on any of the products below go to our new newsletter page on the website and follow the links, send an email to sales@alrad.co.uk or call 01635 30345. As this is our last newsletter
Lecture 2. Electromagnetic radiation principles. Units, image resolutions.
 NRMT 2270, Photogrammetry/Remote Sensing Lecture 2 Electromagnetic radiation principles. Units, image resolutions. Tomislav Sapic GIS Technologist Faculty of Natural Resources Management Lakehead University