INFORMATION DASHBOARD DESIGN DJOHN PETERSON MAY 7, 2015
|
|
|
- Jeffery Palmer
- 6 years ago
- Views:
Transcription

1 INFORMATION DASHBOARD DESIGN DJOHN PETERSON MAY 7, 2015

2 Presentation Slide Deck on Copyright 2015 Senturus, Inc. All Rights Reserved 2
3 Agenda Introduction Why Dashboards Challenges, Opportunities & Human factors What is a Dashboard Really 13 Tips & Recommendations Additional Resources Q&A Copyright 2015 Senturus, Inc. All Rights Reserved 3

4 INTRODUCTION: TODAY S PRESENTER 4 John Peterson CEO & Co-Founder Senturus Copyright 2015 Senturus, Inc. All Rights Reserved
5 PREFACE: COMMON QUESTIONS HOT TOPICS
6 MOST COMMON QUESTIONS 1. We want to implement Self-Service BI, how? 2. We need to develop a Dashboard, what should? 3. Do we really need a Data Warehouse? 4. What s the Right tool for the job? Copyright 2015 Senturus, Inc. All Rights Reserved 6
7 POLL: YOUR PERSPECTIVE DO YOU PROVIDE DASHBOARDS TO FOLKS? DO YOU USE A DASHBOARD YOURSELF?
8 RESOURCES IN ADVANCE
9 A FEW RESOURCES TO START THINGS OFF Edward Tufte Stephen Few (Perceptual Edge) Nathan Yau (Flowing Data) Andy Kirk (Visualisingdata.com) New York Times Infographics Kaplan & Norton (Balanced Scorecard) Copyright 2015 Senturus, Inc. All Rights Reserved 9
10 THE PROBLEM CHALLENGES, OPPORTUNITIES & HUMAN FACTORS

11 TODAY S RECIPE FOR DECISION MAKING SUPPORT Business Requirements WIDTH = RELATIVE TIME AND ENERGY PUT INTO TRANSFORMATION Display & Visualization Raw Data Copyright 2015 Senturus, Inc. All Rights Reserved 11

12 RECIPE FOR BETTER DECISION MAKING Business Requirements WIDTH = RELATIVE TIME AND ENERGY PUT INTO TRANSFORMATION Display & Visualization Raw Data Copyright 2015 Senturus, Inc. All Rights Reserved 12


13 CONSIDER THIS In the journey of the data from the sources to the information consumer/user, how much time & energy have you really focused on the final 24 inches? Copyright 2015 Senturus, Inc. All Rights Reserved. 13

14 THE VISION THING When our eyes are open, our vision accounts for two-thirds of the electrical activity of the brain a full 2 billion of the 3 billion firings per second, and 50% of our neural tissue is directly or indirectly related to vision (Source: Neuroanatomist R.S. Fixot, 1957) More of our neurons are dedicated to vision than the other four senses combined, and olfactory cortex is losing ground to the visual cortex - about 60 percent of our smell-related genes have been permanently damaged in this neural arbitrage (Source: John Medina, Brain Rules, 2015) Copyright 2015 Senturus, Inc. All Rights Reserved. 14

15 Copyright 2015 Senturus, Inc. All Rights Reserved. 15

16 Copyright 2015 Senturus, Inc. All Rights Reserved. 16
17 EXAMPLE 1: PREATTENTIVE ATTRIBUTES Form Orientation Line Length Line Width Size Shape Curvature Added Marks Enclosure Color Spatial Position Intensity Hue 2-D Position *Source: Stephen Few, Tapping the Power of Visual Perception, 2004 Copyright 2015 Senturus, Inc. All Rights Reserved. 17
18 EXAMPLE 2: MEMORY TYPES Sensory Memory: < 1 second Ultra-short-term memory and decays or degrades very quickly, typically in the region of milliseconds (1/5-1/2 second) after the perception of an item Short-Term (Working) Memory: < 1 minute Holds a small amount of information (typically around 7 items or even less) in mind in an active, readilyavailable state for a short period of time (typically from 10 to 15 seconds, or sometimes up to a minute). Long-Term Memory: life-time Decays very little, but requires more effort to store & retrieve Copyright 2015 Senturus, Inc. All Rights Reserved. 18
19 IMPLICATIONS Information display methods matter A LOT Color Shape Layout Page size Contrast & Context Etc. Tapping into your brain s innate capabilities will enhance information delivery efficacy Copyright 2015 Senturus, Inc. All Rights Reserved. 19
 I chalked a big 6 on the floor, and then passed along without another word. When the night shift came in they saw the 6 and asked about it.")
20 AND WHAT GETS MEASURED What gets measured gets managed. (Source: Peter Drucker, 1954) "If you can not measure it, you can not improve it. (Source: Lord Kelvin, 1883) I chalked a big 6 on the floor, and then passed along without another word. When the night shift came in they saw the 6 and asked about it. (Source: Charles Schwab, US Steel, 1917) Metrics don t just report results, they drive strategy. (Source: Kaplan & Norton, 1992) Copyright 2015 Senturus, Inc. All Rights Reserved. 20
21 SO WHAT? WHAT DOES THAT HAVE TO DO WITH DASHBOARDS?

22 SO WHAT IS A DASHBOARD? Copyright 2015 Senturus, Inc. All Rights Reserved. 22

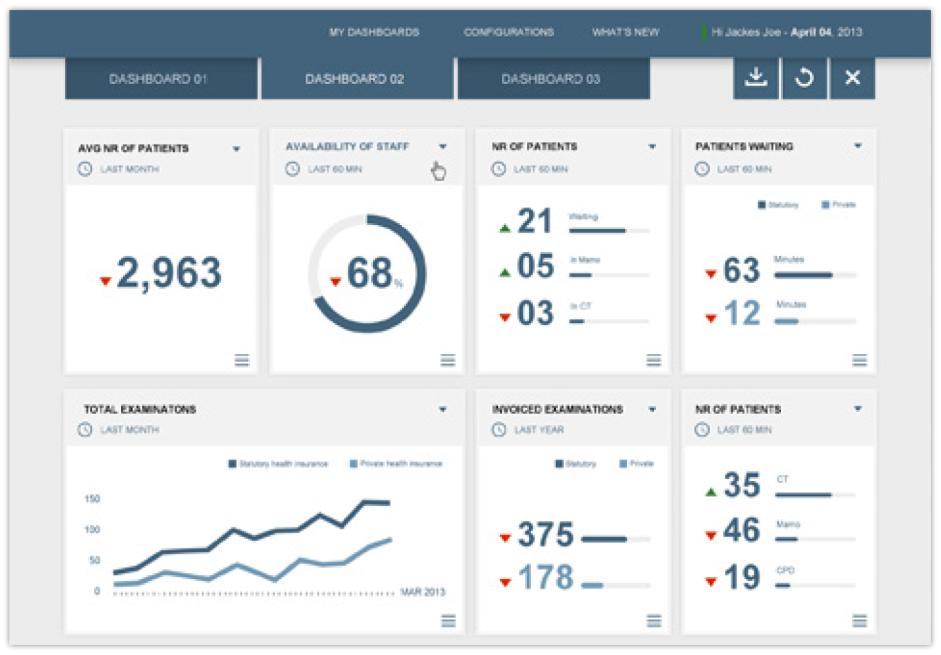


23 OK WHAT IS AN INFORMATION DASHBOARD? Examples Copyright 2015 Senturus, Inc. All Rights Reserved. 23
24 DEFINITION Stephen Few (revised 2015) A dashboard is an information display that people use to rapidly monitor current conditions that potentially require a immediate response to fulfill a specific role. *Source: Stephen Few, 2015 Copyright 2015 Senturus, Inc. All Rights Reserved. 24
25 DASHBOARDS DISPLAY INFORMATION THAT matters is updated frequently requires a timely response *Source: Stephen Few, 2015 Copyright 2015 Senturus, Inc. All Rights Reserved. 25

26 OTHER DISPLAY TYPES* Lookup Report, for lookup Explanatory Report, for narrative Infographic, for narrative Live Presentation, for narrative Dashboard, for monitoring Analytical Application, for guided data analysis EDA Tool, for exploratory data analysis Predictive Model, for predictive analysis *Source: Stephen Few, 2015 Copyright 2015 Senturus, Inc. All Rights Reserved. 26
27 MORE IMPLICATIONS A person s role REALLY matters One size fits all dashboards are suboptimal Business requirements drive design/layout Layout matters Particularly if it exceeds one page Efficient use of space is critical Filtering, interactivity state changes actually reduce dashboard effectiveness Choice of what to display is crucial But so is how you display it! Copyright 2015 Senturus, Inc. All Rights Reserved. 27
28 PUTTING IT ALL TOGETHER DO S AND DON TS
29 SUMMARY OF TIPS 1. Consider role-specific dashboards 2. Don t waste space stick to one screen 3. Simple and clean is best 4. Be very careful with color 5. Avoid gratuitous graph types 6. Focus on Leading (vs. Lagging) indicators 7. Integrate Context 8. Add ratios and trends 9. Provide drill-to-detail interactivity 10. Consider your delivery platform(s) e.g. mobile 11. Beware of mockups, but 12. Prototype early and often 13. Beware of the levels of management rework problem 14. Good news & Go forth and visualize Copyright 2015 Senturus, Inc. All Rights Reserved 29
30 DIFFERENT STROKES FOR DIFFERENT FOLKS Consider role-specific dashboards Example: Store Dashboard vs. District Dashboard Who exactly is the audience? What specific decisions do managers need to make with the data? One size fits all rarely fits anyone well Filtering (especially when not persistent and obvious) destroys situation awareness Consider modular approach, but beware of lack of Maintainability, consistency, company priority Copyright 2015 Senturus, Inc. All Rights Reserved 30


31 DON T WASTE SPACE Use appropriate graph types and layout versus *Source: Stephen Few, 2007 Copyright 2015 Senturus, Inc. All Rights Reserved 31
 Real-life example from US Patent & Trademark Office versus")
32 DON T WASTE SPACE (CONT.) Real-life example from US Patent & Trademark Office versus Copyright 2015 Senturus, Inc. All Rights Reserved 32
33 DON T WASTE SPACE (CONT.) AWARD WINNING DASHBOARD (PERCEPTUAL EDGE, 2012) Copyright 2015 Senturus, Inc. All Rights Reserved. 33
34 CLEAN AND SIMPLE WATCH YOUR DATA-INK (OR DATA-PIXEL) RATIO versus Copyright 2015 Senturus, Inc. All Rights Reserved. 34


35 BE VERY CAREFUL WITH COLOR Powerful but dangerous versus Copyright 2015 Senturus, Inc. All Rights Reserved 35


36 AVOID GRATUITOUS GRAPH TYPES Nice eye-candy but not good information Beware of vendor provided templates Copyright 2015 Senturus, Inc. All Rights Reserved 36


37 STRESS LEADING INDICATORS, NOT LAGGING Don t drive via the rear view mirror Unique visitors vs. past financials s opened New customers signed up Events attended Samples requested Contracts in process Etc. Copyright 2015 Senturus, Inc. All Rights Reserved 37

38 INTEGRATE CONTEXT Relative to what? Metrics Vs. Last Year Vs. Plan Vs. Forecast Vs. Rolling average Vs. Competition Vs. Industry averages/standards Etc. Copyright 2015 Senturus, Inc. All Rights Reserved 38

39 USE RATIOS, VARIANCES, MOVING AVGS AND TRENDS Help identify the issues Revenue: $641,879 versus Copyright 2015 Senturus, Inc. All Rights Reserved 39

40 PROVIDE DRILL-TO-DETAIL And conditional formatting Try NOT to click on the negative variance cells! Copyright 2015 Senturus, Inc. All Rights Reserved 40
")


41 CONSIDER YOUR DELIVERY PLATFORM(S) Pixels matter! Write once, publish many is a Myth Screen real estate differs dramatically And so do usage patterns Copyright 2015 Senturus, Inc. All Rights Reserved 41


42 BEWARE OF MOCKUPS Requirements tend to harden Watch out for amateurs acting like pros Focus on core requirements instead Metrics and measures Dimensionality Copyright 2015 Senturus, Inc. All Rights Reserved 42


43 PROTOTYPE EARLY AND OFTEN Clay vs. steel Explore the data Unearth requirements Test preferences Test tools Sell the concept All before major development Copyright 2015 Senturus, Inc. All Rights Reserved 43

44 JP S MANAGEMENT LEVEL REWORK THEOREM Beware of copious, often contradictory, feedback Number of rework iterations = Number of levels of management in the review loop Corollary: Cost and duration of project is directly proportional to levels of management involved Copyright 2015 Senturus, Inc. All Rights Reserved 44
45 THE GOOD NEWS Parting Thoughts The tools are better than ever: More powerful More flexible More built-in (best practices) More modular The need for good information is more pressing than ever There are now some (but not lots of) good examples in use Go Forth and Visualize! Copyright 2015 Senturus, Inc. All Rights Reserved 45
46 RELECTIONS WOULD YOU CHANGE THE WAY YOU PROVIDE DASHBOARDS TO FOLKS? HOW WOULD YOU CREATE YOUR OWN DASHBOARD?

47 ADDITIONAL RESOURCES 47
48 Additional Resources Books: Information Dashboard Design (2 nd edition) by Stephen Few The Visual Display of Quantitative Information by Edward Tufte Visualize This by Nathan Yau The Balanced Scorecard by Robert Kaplan & David Norton JP s Library (just call me) Other: Graph Selection Matrix (Perceptual Edge) New York Times Infographics Copyright 2015 Senturus, Inc. All Rights Reserved 48
49 Resources on Copyright 2015 Senturus, Inc. All Rights Reserved 49

50 Cognos Training Options *Custom, tailored training also available* Copyright 2015 Senturus, Inc. All Rights Reserved 50


51 Q & A


52 Thank You! Copyright 2015 by Senturus, Inc. This entire presentation is copyrighted and may not be reused or distributed without the written consent of Senturus, Inc.

53 THANK YOU
HIGHWAY SAFETY RESEARCH GROUP
 1. Why use data visualization? 2. Why we perceive data visualizations better than tabular data? 3. How do we choose the proper visualization to display our data? 4. What are the Dos and Don ts of creating
Using Color in Scientific Visualization
 Using Color in Scientific Visualization Mike Bailey The often scant benefits derived from coloring data indicate that even putting a good color in a good place is a complex matter. Indeed, so difficult
Insider s Blueprint to Raising Money StartLaunchGrow.com
 Insider s Blueprint to Raising Money A FOUNDER S We all know that external capital can turbocharge your startup s growth. But you may not know exactly how to go about doing it. This Blueprint is here to
HOW TO GET STARTED WITH GAME DESIGN
 HOW TO GET STARTED WITH GAME DESIGN By Sharon Boller, president Bottom-Line Performance, Inc. Me! Author, game-lover(!), learner, instructional designer, game designer, dog-lover, Mom, wife, cyclist, hiker,
You re in! Welcome to the Power of Pinning the most efficient and effective way to put the power of Pinterest to work for your business.
 P.O.P. Welcome Email Subject line: [POP] Congratulations & Welcome to the Program! Dear [FIRST NAME], You re in! Welcome to the Power of Pinning the most efficient and effective way to put the power of
Navigating the AI Adoption Minefield Pitfalls, best practices, and developing your own AI roadmap April 11
 Navigating the AI Adoption Minefield Pitfalls, best practices, and developing your own AI roadmap April 11 Presenter: Cosmin Laslau, Director of Research Products, Lux Research Agenda 1 2 3 Why you yes,
Marketing experts tell ya to publish content that grows your blog and business. But how can you actually know what works?
 What gets measured gets managed. Peter Drucker Marketing experts tell ya to publish content that grows your blog and business. But how can you actually know what works? What are your marketing goals? 1.
Eastern Bank Challenges the Status Quo in Bank Lending by Implementing the DocuSign esignature API to Digitize Processes
 Eastern Bank Challenges the Status Quo in Bank Lending by Implementing the DocuSign esignature API to Digitize Processes Implementing a digital transaction strategy was a huge win for Eastern Bank. It
Tell your Public Data Stories
 Welcome # T C 1 8 Tell your Public Data Stories Jonni Walker Senior Data Artist Email: jwalker@tableau.com Twitter: @jonni_walker Florian Ramseger Senior Product Specialist, Tableau Public EMEA Email:
Why visualize library data? Why invest
 Sarah Anne Murphy How data visualization supports academic library assessment Three examples from The Ohio State University Libraries using Tableau When we represent quantitative information in visual
Earn money with your knowledge!
 Earn money with your knowledge! The world s first block chain based game in which your win depends on your knowledge Table Of Contents What Is Coinquiztador And Why You Should Play... 4 Why Coinquiztador?...4
Object Perception. 23 August PSY Object & Scene 1
 Object Perception Perceiving an object involves many cognitive processes, including recognition (memory), attention, learning, expertise. The first step is feature extraction, the second is feature grouping
BIG IDEAS. Personal design choices require self-exploration, collaboration, and evaluation and refinement of skills. Learning Standards
 Area of Learning: APPLIED DESIGN, SKILLS, AND TECHNOLOGIES BIG IDEAS The design cycle is an ongoing reflective process. Personal design choices require self-exploration, collaboration, and evaluation and
TELLING STORIES OF VALUE WITH IOT DATA
 TELLING STORIES OF VALUE WITH IOT DATA VISUALIZATION BAREND BOTHA VIDEO TRANSCRIPT Tell me a little bit about yourself and your background in IoT. I came from a web development and design background and
Esri and Autodesk What s Next?
 AN ESRI VISION PAPER JANUARY 2018 Esri and Autodesk What s Next? Copyright 2018 Esri All rights reserved. Printed in the United States of America. The information contained in this document is the exclusive
Using VR and simulation to enable agile processes for safety-critical environments
 Using VR and simulation to enable agile processes for safety-critical environments Michael N. Louka Department Head, VR & AR IFE Digital Systems Virtual Reality Virtual Reality: A computer system used
Project Lead the Way: Robotics Grades 9-12
 Bemidji High School Industrial Standards Project Lead the Way: Robotics Grades 1.J 1.K 1.L 1.M 2.W 2.X 2.Z 2.AA 2.BB 2.CC 2.EE 2.FF 3.G 3.H 3.I 3.J characteristics and scope characteristics and scope characteristics
USE OF THE PATENT COOPERATION TREATY
 Chapter 5 USE OF THE PATENT COOPERATION TREATY A substantial proportion of the demand for patent rights is requested via the Patent Cooperation Treaty. The statistics in this chapter display the shares
IBM Research Your future is our concern IBM Corporation
 Your future is our concern A call for action 3.7 billion lost hours 8.7 billion liters of gas Annual impact of congested roadways in the U.S. alone An IBM Research answer 20% less traffic Traffic system:
The simplest time management tool. 6 list Writing in the Verb Noun - Purpose format Applying this
 The simplest time management tool 6 list Writing in the Verb Noun - Purpose format Applying this 6 list The simplest and most effective time management tool there is There are various versions of this
Section 3 Correlation and Regression - Worksheet
 The data are from the paper: Exploring Relationships in Body Dimensions Grete Heinz and Louis J. Peterson San José State University Roger W. Johnson and Carter J. Kerk South Dakota School of Mines and
3 things you should be doing with your survey results. Get the most out of your survey data.
 3 things you should be doing with your survey results Get the most out of your survey data. Your survey is done. Now what? Congratulations you finished running your survey! You ve analyzed all your data,
towerswatson.com Transforming Life Medtronic aligns global total rewards with EVP
 towerswatson.com Transforming Life Medtronic aligns global total rewards with EVP Transforming Life Medtronic aligns global total rewards with EVP By Lucie P. Lawrence In 1949, in a 600-square-foot garage
Novel laser power sensor improves process control
 Novel laser power sensor improves process control A dramatic technological advancement from Coherent has yielded a completely new type of fast response power detector. The high response speed is particularly
Infographics at CDC for a nonscientific audience
 Infographics at CDC for a nonscientific audience A Standards Guide for creating successful infographics Centers for Disease Control and Prevention Office of the Associate Director for Communication 03/14/2012;
Prof. Feng Liu. Winter /09/2017
 Prof. Feng Liu Winter 2017 http://www.cs.pdx.edu/~fliu/courses/cs410/ 01/09/2017 Today Course overview Computer vision Admin. Info Visual Computing at PSU Image representation Color 2 Big Picture: Visual
Board/Authority Authorized Course Framework Template
 Board/Authority Authorized Course Framework Template School District/Independent School Authority Name: Okanagan Skaha School District 67 Developed by: Fiona Bickell and Caroline Goodjohn School Name:
Adapted from the Slides by Dr. Mike Bailey at Oregon State University
 Colors in Visualization Adapted from the Slides by Dr. Mike Bailey at Oregon State University The often scant benefits derived from coloring data indicate that even putting a good color in a good place
Sizing & Profiling esports' Popularity Free Data Report Featuring High-level Results of Newzoo s Consumer Research APRIL 2014
 Sizing & Profiling esports' Popularity Free Data Report Featuring High-level Results of Newzoo s Consumer Research APRIL 2014 Image courtesy of Turtle Entertainment /ESL Sizing & Profiling esports Popularity
Findings of a User Study of Automatically Generated Personas
 Findings of a User Study of Automatically Generated Personas Joni Salminen Qatar Computing Research Institute, Hamad Bin Khalifa University and Turku School of Economics jsalminen@hbku.edu.qa Soon-Gyo
Accenture Technology Vision 2015 Delivering Public Service for the Future Five digital trends: A public service outlook
 Accenture Technology Vision 2015 Delivering Public Service for the Future Five digital trends: A public service outlook INFOGRAPHIC Digital government is about using innovative technologies to improve
MODULE 7 WHY AM I NOT MAKING MONEY?
 MODULE 7 WHY AM I NOT MAKING MONEY? Introduction Hi, this is Stefan, and welcome to Module 7, Why am I Not Making Money? Answer These Questions There are many reasons why you may not be making money yet.
What is exhibition design?
 What is exhibition design? good exhibit design creates rich experiences in real time utilizing space, movement and memory to facilitate multi-layered communication. visual and spatial forms should make
Project Lead the Way: Civil Engineering and Architecture, (CEA) Grades 9-12
 Grades 9-12") 1. Students will develop an understanding of the J The nature and development of technological knowledge and processes are functions of the setting. characteristics and scope of M Most development of technologies
1. Students will develop an understanding of the J The nature and development of technological knowledge and processes are functions of the setting. characteristics and scope of M Most development of technologies
Lecture Topic Projects 1 Intro, schedule, and logistics 2 Applications of visual analytics, data types 3 Basic tasks Project 1 out 4 Data preparation
 Lecture Topic Projects 1 Intro, schedule, and logistics 2 Applications of visual analytics, data types 3 Basic tasks Project 1 out 4 Data preparation and representation 5 Data reduction, notion of similarity
WHAT CLICKS? THE MUSEUM DIRECTORY
 WHAT CLICKS? THE MUSEUM DIRECTORY Background The Minneapolis Institute of Arts provides visitors who enter the building with stationary electronic directories to orient them and provide answers to common
JD Edwards UX One. Solution Overview. January Copyright 2017, Oracle and/or its affiliates. All rights reserved.
 JD Edwards UX One Solution Overview January 2017 Safe Harbor Statement The following is intended to outline our general product direction. It is intended for information purposes only, and may not be incorporated
Human Systems Integration (HSI) and DevOps
 and DevOps") Copyright 2018 by Frank Lacson. Permission granted to INCOSE to publish and use. Human Systems Integration (HSI) and DevOps Applying Agile Systems Engineering in DoD Systems Acquisition Frank C. Lacson,
Copyright 2018 by Frank Lacson. Permission granted to INCOSE to publish and use. Human Systems Integration (HSI) and DevOps Applying Agile Systems Engineering in DoD Systems Acquisition Frank C. Lacson,
LIVESTREAM CHALLENGE CHECKLIST + GUIDE
 LIVESTREAM CHALLENGE CHECKLIST + GUIDE make your dreams a priority until they become your reality. - Daria Zest Hi, Gorgeous! DARIA ZEST INFO@DARIAZEST.COM WWW.DARIAZEST.COM 1 So happy you re here! I ve
What can Photoshop's Bridge do for me?
 What can Photoshop's Bridge do for me? Here is a question that comes up fairly often. What can Photoshop's Bridge do for me? Now this sounds rather like that part in the Monty Python film The Life of Brian
Mobile Education Game Development. Michael & Gabriel
 Mobile Education Game Development Michael & Gabriel AGENDA Roles within a game company Process for developing games Trends Value of user feedback What Hyper Hippo looks for when hiring How to get started
Chapter 4 PSY 100 Dr. Rick Grieve Western Kentucky University
 Chapter 4 Sensation and Perception PSY 100 Dr. Rick Grieve Western Kentucky University Copyright 1999 by The McGraw-Hill Companies, Inc. Sensation and Perception Sensation The process of stimulating the
Advanced Engineering Statistics. Jay Liu Dept. Chemical Engineering PKNU
 Advanced Engineering Statistics Jay Liu Dept. Chemical Engineering PKNU Statistical Process Control (A.K.A Process Monitoring) What we will cover Reading: Textbook Ch.? ~? 2012-06-27 Adv. Eng. Stat., Jay
2019 Marketing Planning Guide
 2019 Marketing Planning Guide As the end of 2018 is beginning to approach, many businesses are starting to look ahead and plan for 2019. What marketing initiatives will you use during the coming year?
Big Data Analytics in Science and Research: New Drivers for Growth and Global Challenges
 Big Data Analytics in Science and Research: New Drivers for Growth and Global Challenges Richard A. Johnson CEO, Global Helix LLC and BLS, National Academy of Sciences ICCP Foresight Forum Big Data Analytics
Computer Graphics Si Lu Fall /27/2016
 Computer Graphics Si Lu Fall 2017 09/27/2016 Announcement Class mailing list https://groups.google.com/d/forum/cs447-fall-2016 2 Demo Time The Making of Hallelujah with Lytro Immerge https://vimeo.com/213266879
Empowering Intellectual Property
 Empowering Intellectual Property A New Approach for the Development of Technologies Delivered by: Marine Freychet, Steven L. Henning, Glenn D. Sacks +1 914 909 4900 info@opportunip.com 1 Agenda Intellectual
How to make your first ( $) million
 million") How to make your first ( $) million John Davies - CTO Incept5 Aarhus/Århus - 3rd October 2012 @jtdavies Wednesday, 3 October 12 We have 15 minutes I figured 10 minutes talking and 5 minutes for questions
How to make your first ( $) million John Davies - CTO Incept5 Aarhus/Århus - 3rd October 2012 @jtdavies Wednesday, 3 October 12 We have 15 minutes I figured 10 minutes talking and 5 minutes for questions
FOUR STEPS TO CREATING YOUR FIRST (OR NEXT) PASSIVE INCOME STREAM
 PASSIVE INCOME STREAM") FOUR STEPS TO CREATING YOUR FIRST (OR NEXT) PASSIVE INCOME STREAM It s time to scale your freelance business THE FREELANCE TO FREEDOM PROJECT So, you ve been thinking about creating something to help you
FOUR STEPS TO CREATING YOUR FIRST (OR NEXT) PASSIVE INCOME STREAM It s time to scale your freelance business THE FREELANCE TO FREEDOM PROJECT So, you ve been thinking about creating something to help you
EECS 473. Review etc.
 EECS 473 Review etc. Nice job folks Projects went well. Last groups demoed on Sunday. Due date issues Assignment 2 and the Final Report are both due today. There was some communication issues with due
THE U.S. SEMICONDUCTOR INDUSTRY:
 THE U.S. SEMICONDUCTOR INDUSTRY: KEY CONTRIBUTOR TO U.S. ECONOMIC GROWTH Matti Parpala 1 August 2014 The U.S. Semiconductor Industry: Key Contributor To U.S. Economic Growth August 2014 1 INTRO The U.S.
Face Perception. The Thatcher Illusion. The Thatcher Illusion. Can you recognize these upside-down faces? The Face Inversion Effect
 The Thatcher Illusion Face Perception Did you notice anything odd about the upside-down image of Margaret Thatcher that you saw before? Can you recognize these upside-down faces? The Thatcher Illusion
Why Affiliate Marketing Doesn t Work for You
 1 Why do people fail? Why Affiliate Marketing Doesn t Work for You Lots of people read certain books thinking they'll get that one big secret. We're always looking for it, but we fail to look behind the
Copyright 2015 Silicon Valley Digital Marketing Institute, All Rights Reserved
 If your business is hoping to expand their business reach with some new opportunities, then Tumblr is the tool you should be thinking about incorporating into your social media marketing strategy. If you
A Lesson in Probability and Statistics: Voyager/Scratch Coin Tossing Simulation
 A Lesson in Probability and Statistics: Voyager/Scratch Coin Tossing Simulation Introduction This lesson introduces students to a variety of probability and statistics concepts using PocketLab Voyager
Automated Test Summit 2005 Keynote
 1 Automated Test Summit 2005 Keynote Trends and Techniques Across the Development Cycle Welcome to the Automated Test Summit 2005. Thank you all for joining us. We have a very exciting day full of great
Visual Rules. Why are they necessary?
 Visual Rules Why are they necessary? Because the image on the retina has just two dimensions, a retinal image allows countless interpretations of a visual object in three dimensions. Underspecified Poverty
Einführung in die Erweiterte Realität. 5. Head-Mounted Displays
 Einführung in die Erweiterte Realität 5. Head-Mounted Displays Prof. Gudrun Klinker, Ph.D. Institut für Informatik,Technische Universität München klinker@in.tum.de Nov 30, 2004 Agenda 1. Technological
15 ideas to get more clients to your Chiropractic Office on a consistent basis
 15 ideas to get more clients to your Chiropractic Office on a consistent by Social Sonja Although everyone nowadays can see that their local businesses can only benefit from using social media and digital
Soft Proofing Page: 1
 Page: 1 The following instructions will help you understand the concept and practice of soft proofing as well as step you through how to soft proof through different applications. General Philosophy &
Introduction to Waterjet
 Introduction to Waterjet Fastest growing machining process One of the most versatile machining processes Compliments other technologies such as milling, laser, EDM, plasma and routers True cold cutting
Just-About-Right (JAR) Scales:
 Scales:") Just-About-Right (JAR) Scales: Design, Usage, Benefits and Risks Lori Rothman Merry Jo Parker Editors Just-About-Right JAR Scales: Design, Usage, Benefits, and Risks Lori Rothman and Merry Jo Parker ASTM
Just-About-Right (JAR) Scales: Design, Usage, Benefits and Risks Lori Rothman Merry Jo Parker Editors Just-About-Right JAR Scales: Design, Usage, Benefits, and Risks Lori Rothman and Merry Jo Parker ASTM
Accenture Digital Acceleration Center in Metro New York
 Accenture Digital Acceleration Center in Metro New York Helping Communications, Media and Technology Providers Accelerate Digital Transformation at Speed Anticipate, and transform for, the digital future
DEVELOPING MANUFACTURING CAPABILITY: RE-SHAPING THE ENTERPRISE
 Nathan W. Hartman, Ed.D. Dauch Family Professor of Advanced Manufacturing Director, Product Lifcycle Management Center DEVELOPING MANUFACTURING CAPABILITY: RE-SHAPING THE ENTERPRISE What drives manufacturing
Tapping Into a New Niche
 By Renee Changnon, rchangnon@nrha.org Tapping Into a New Niche How to Be a Destination for the Homebrewing Community A walk into the aptly named Brewer s True Value Hardware reveals an experience and some
Innovation Report: The Manufacturing World Will Change Dramatically in the Next 5 Years: Here s How. mic-tec.com
 Innovation Report: The Manufacturing World Will Change Dramatically in the Next 5 Years: Here s How mic-tec.com Innovation Study 02 The Manufacturing World - The Next 5 Years Contents Part I Part II Part
AP PSYCH Unit 4.2 Vision 1. How does the eye transform light energy into neural messages? 2. How does the brain process visual information? 3.
 AP PSYCH Unit 4.2 Vision 1. How does the eye transform light energy into neural messages? 2. How does the brain process visual information? 3. What theories help us understand color vision? 4. Is your
Federico Forti, Erdi Izgi, Varalika Rathore, Francesco Forti
 Basic Information Project Name Supervisor Kung-fu Plants Jakub Gemrot Annotation Kung-fu plants is a game where you can create your characters, train them and fight against the other chemical plants which
Prof. Feng Liu. Fall /02/2018
 Prof. Feng Liu Fall 2018 http://www.cs.pdx.edu/~fliu/courses/cs447/ 10/02/2018 1 Announcements Free Textbook: Linear Algebra By Jim Hefferon http://joshua.smcvt.edu/linalg.html/ Homework 1 due in class
Technology Engineering and Design Education
 Technology Engineering and Design Education Grade: Grade 6-8 Course: Technological Systems NCCTE.TE02 - Technological Systems NCCTE.TE02.01.00 - Technological Systems: How They Work NCCTE.TE02.02.00 -
Hackathons as a Source of Entrepreneurship in Corporations
 Hackathons as a Source of Entrepreneurship in Corporations Introduction In recent years, hackathons have emerged as a method for organizations and corporations to tap into volunteer entrepreneurial efforts
Marks + Channels. Large Data Visualization Torsten Möller. Munzner/Möller
 Marks + Channels Large Data Visualization Torsten Möller Overview Marks + channels Channel effectiveness Accuracy Discriminability Separability Popout Channel characteristics Spatial position Colour Size
The Hux Connect Portal
 Introduction to: The Hux Connect Portal The Hux Connect Portal is the primary tool that users have for viewing and understanding to information that Hux gathers about a site. The portal provides a broad
Insurance User Experiences by Design
 The Digital Insurer: Insurance User Experiences by Design Satisfying the needs of four major consumer segments New expectations for user experiences, driven by the everyday transactions of consumers, are
CAFE4DM. Enabling smart factories in the process sector: delivering Industry 4.0 for efficient manufacturing of formulated products
 Enabling smart factories in the process sector: delivering Industry 4.0 for efficient manufacturing of formulated products Prof. Philip Martin School of Chemical Engineering and Analytical Science University
Colors in Visualization. By Mike Bailey Oregon State University
 Colors in Visualization By Mike Bailey Oregon State University The often scant benefits derived from coloring data indicate that even putting a good color in a good place is a complex matter. Indeed, so
Tungsten Carbide Dies
 Tungsten Carbide Dies Experience the BI Competitive Edge Lowest Price Per Cost High Quality Raw-Material used by us reduces hidden costs associated with lower quality products. Precision Parts & Superior
Game On! An Industry s Journey. Vicarious Visions, Inc. Karthik Bala, CEO Guha Bala, President
 Game On! An Industry s Journey Vicarious Visions, Inc. Karthik Bala, CEO Guha Bala, President About Vicarious Visions A Leading developer of video games Headquartered in Albany, NY, with 140 employees
EHR Optimization: Why Is Meaningful Use So Difficult?
 EHR Optimization: Why Is Meaningful Use So Difficult? Tuesday, March 1, 2016, 8:30-9:30 Elizabeth A. Regan, Ph.D. Department Chair Integrated Information Technology Professor Health Information Technology
Implementing Logic with the Embedded Array
 Implementing Logic with the Embedded Array in FLEX 10K Devices May 2001, ver. 2.1 Product Information Bulletin 21 Introduction Altera s FLEX 10K devices are the first programmable logic devices (PLDs)
Hands On. 6 Here, three pieces of thermoplastic are cut to the designated die size. I make one layer of the die at a time.
 Hands On Jan s method of creating die forms is both effective and fascinating. Her demonstration includes essential information, such as constructing a well-made die, forming metal with the hydraulic press,
EE140: Lab 5, Project Week 2
 EE140: Lab 5, Project Week 2 VGA Op-amp Introduction For this lab, you will be developing the background and circuits that you will need to get your final project to work. You should do this with your
Colors in Scientific Visualization. Mike Bailey Oregon State University
 Colors in Scientific Visualization Mike Bailey Oregon State University The often scant benefits derived from coloring data indicate that even putting a good color in a good place is a complex matter. Indeed,
Automatic Gain Control (AGC) Use in Lighting Equipment
 Use in Lighting Equipment") Automatic Gain Control Use in Lighting Equipment SN3 Innovations, LLC Automatic Gain Control (AGC) Use in Lighting Equipment White Paper Date: August 2015 Acknowledgements Initiated and released by the
Automatic Gain Control Use in Lighting Equipment SN3 Innovations, LLC Automatic Gain Control (AGC) Use in Lighting Equipment White Paper Date: August 2015 Acknowledgements Initiated and released by the
PWM 180-Pin Probing Board Manual
 PWM 80-Pin Probing Board Manual an EZ-Extender product Revision.0, September 03 Part Number 8-000387-0 Analog Devices, Inc. One Technology Way Norwood, Mass. 006-906 a Copyright Information 03 Analog Devices,
3D Reality Documentation in Today s
 3D Reality Documentation in Today s Economy Malaysia BANDWORK GPS SOLUTIONS SB 1 AGENDA INTRODUCTION BACKGROUND FARO 3D TECHNOLOGIES FARO IN MALAYSIA CONCLUSION 2 INTRODUCTION About us 3 KEY INDUSTRY/
Objective Explain design concepts used to create digital graphics.
 Objective 102.01 Explain design concepts used to create digital graphics. PART 1: ELEMENTS OF DESIGN o Color o Line o Shape o Texture o Watch this video on Fundamentals of Design. 2 COLOR o Helps identify
Hands On. 6 Here, three pieces of thermoplastic are cut to the designated die size. I make one layer of the die at a time.
 Hands On Jan s method of creating die forms is both effective and fascinating. Her demonstration includes essential information, such as constructing a well-made die, forming metal with the hydraulic press,
Computing for Engineers in Python
 Computing for Engineers in Python Lecture 10: Signal (Image) Processing Autumn 2011-12 Some slides incorporated from Benny Chor s course 1 Lecture 9: Highlights Sorting, searching and time complexity Preprocessing
BodyKey App 2.0 User Guide (AMWAY -Organised and Self-Organised Challenge)
") BodyKey App 2.0 User Guide (AMWAY -Organised and Self-Organised Challenge) What s in this guide Getting Started 3 Introduction to BodyKey Challenge BodyKey Reward System Challenge Ranking Board AMWAY -Organised
BodyKey App 2.0 User Guide (AMWAY -Organised and Self-Organised Challenge) What s in this guide Getting Started 3 Introduction to BodyKey Challenge BodyKey Reward System Challenge Ranking Board AMWAY -Organised
How to Convert & Resize Images in Bulk
 How to Convert & Resize Images in Bulk By Ryan Dube If there is a single time-saving tip that I could ever offer to any writer, student, professional or anyone else that needs to produce documents with
200 Blog Post Ideas. When you get a little stuck trying to think of Blog Post Ideas here s 200 that just might get you going.
 200 Blog Post Ideas When you get a little stuck trying to think of Blog Post Ideas here s 200 that just might get you going. Blog Posts That Are Useful List Posts List things that you learned from a book
Color in Scientific Visualization
 Color in Scientific Visualization Mike Bailey, PhD San Diego Supercomputer Center and University of California at San Diego mjb@sdsc sdsc.edu 858-534-5142 The often scant benefits derived from coloring
Introduction to Visual Perception
 The Art and Science of Depiction Introduction to Visual Perception Fredo Durand and Julie Dorsey MIT- Lab for Computer Science Vision is not straightforward The complexity of the problem was completely
F=MA. W=F d = -F YOUTH GUIDE - APPENDICES YOUTH GUIDE 03
 W=F d F=MA F 12 = -F 21 YOUTH GUIDE - APPENDICES YOUTH GUIDE 03 APPENDIX A: CALCULATE IT (OPTIONAL ACTIVITY) Time required: 20 minutes If you have additional time or are interested in building quantitative
Defining analytics: a conceptual framework
 Image David Castillo Dominici 123rf.com Defining analytics: a conceptual framework Analytics rapid emergence a decade ago created a great deal of corporate interest, as well as confusion regarding its
LED Display Case Retrofit ET09SDGE0015
 LED Display Case Retrofit October 1, 2008 Prepared for: Prepared by: Managed by: Preface PROJECT TEAM This project is sponsored by San Diego Gas & Electric s (SDG&E ) Emerging Technologies Program (ETP)
9th International DAAAM Baltic Conference "INDUSTRIAL ENGINEERING" April 2014, Tallinn, Estonia
 9th International DAAAM Baltic Conference "INDUSTRIAL ENGINEERING" 24-26 April 2014, Tallinn, Estonia DEVELOPMENT OF THE INTELLIGENT FORECASTING MODEL FOR MANUFACTURING COST ESTIMATION IN POLYJET PROCESS
Computer Graphics. Si Lu. Fall er_graphics.htm 10/02/2015
 Computer Graphics Si Lu Fall 2017 http://www.cs.pdx.edu/~lusi/cs447/cs447_547_comput er_graphics.htm 10/02/2015 1 Announcements Free Textbook: Linear Algebra By Jim Hefferon http://joshua.smcvt.edu/linalg.html/
Name of Customer Representative: n/a (program was funded by Rockwell Collins) Phone Number:
 Phone Number:") Phase I Submission Name of Program: Synthetic Vision System for Head-Up Display Name of Program Leader: Jean J. Pollari Phone Number: (319) 295-8219 Email: jjpollar@rockwellcollins.com Postage Address:
Phase I Submission Name of Program: Synthetic Vision System for Head-Up Display Name of Program Leader: Jean J. Pollari Phone Number: (319) 295-8219 Email: jjpollar@rockwellcollins.com Postage Address: