( ) = V s ( jω ) = 2 kω, a = 4, R s. = 500 nf Draw a Bode diagram of the magnitude and phase of the frequency. Let R p. response H jω. V in.
|
|
|
- Clemence Stone
- 6 years ago
- Views:
Transcription
 ( jω ).")
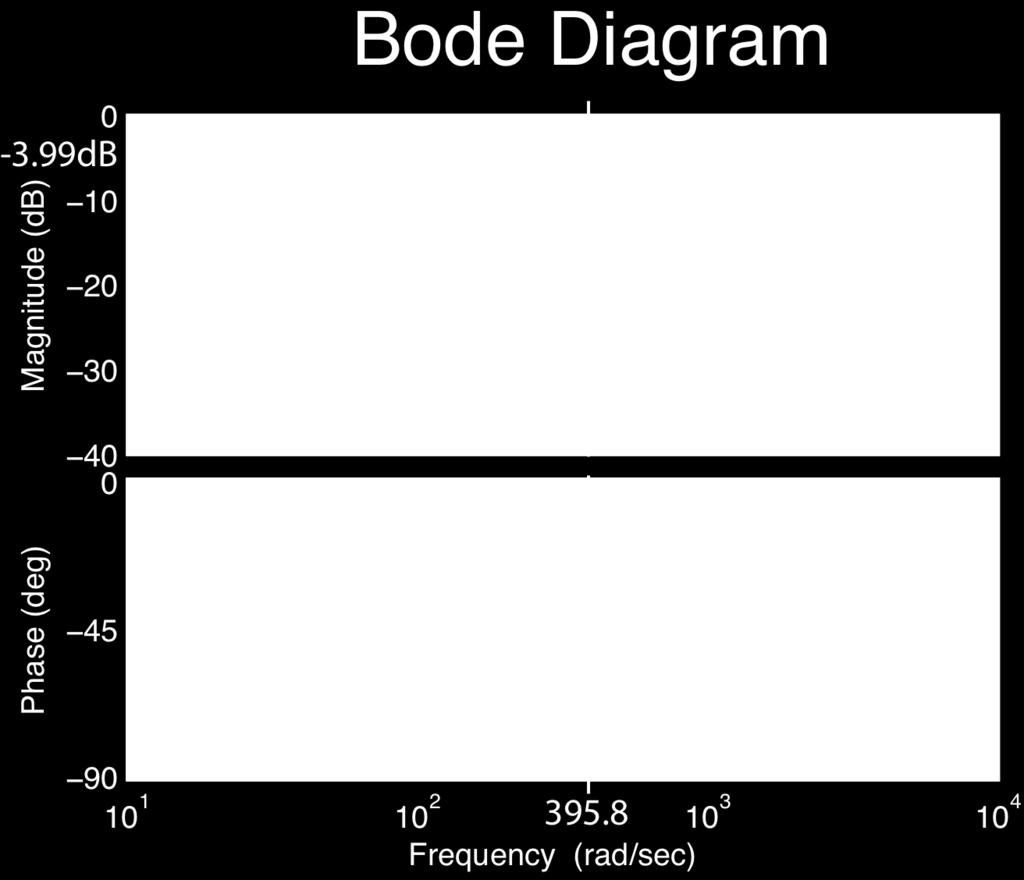
1 Let R p = 2 kω, a = 4, = 6 kω, = 500 nf Draw a Bode diagram of the magnitude and phase of the frequency response H jω = V s ( jω ) ( jω ). V in The secondary impedance is Z s ( jω ) = R / jω s = +/ jω jω +.
2 The secondary impedance reflects through the ideal transformer to an equivalent primary impedance of Z p V p ( jω ) = Z s ( jω ) / a 2 = ( jω ) = = Z p ( jω ) R p + Z p ( jω ) V in jω / a 2 / a 2. The primary voltage is then jω + = jω R p + R p + / a 2 / a 2 jω + R R p + s / a 2 jω + V in jω V in ( jω )
3 V p V s ( jω ) == / a 2 V in jω jω R p + R p + / a 2 ( jω ) = av p ( jω ) V s ( jω ) = H( jω ) = / a jω R p + R p + / a 2 / a V in jω jω R p + R p + / a 2 = ar p jω + R + R / p s a2 R p
4 Putting the frequency response into a form that illustrates the simple system components, H( jω ) = ar p jω + R + R / p s a2 R p = R = s ar p + / a jω Frequency Independent R + R / p s a2 Gain R p C s Single-Real-Pole System. The single real pole is at jω = jω 395.8
5
6 Let C = 20 nf, R = 20 kω, C 2 = 00 nf, R 2 = 5 kω and K = 8. Draw a Bode diagram of the magnitude and phase of the frequency response H jω = V out ( jω ) ( jω ) V in of this Sallen-Key bandpass filter.
7 R +/ jωc + jωc 2 + G 2 V out ( jω ) = KV x jω V x ( jω ) + ( jωc 2 + G 2 ) ( jωc 2 + G 2 ) R +/ jωc K R +/ jωc V in V x V out ( jω ) ( jω ) ( jω ) ( jωc 2 + G 2 )V out ( jω ) = 0 = R +/ jωc V in 0 ( jω )
8 = V out ( jω ) ( jω ) = H jω V in + ( jωc 2 + G 2 ) R +/ jωc R +/ jωc K 0 + ( jωc R +/ jωc 2 + G 2 ) ( jωc 2 + G 2 ) K
9 H( jω ) = H( jω ) = R C 2 K R +/ jωc + ( jωc 2 + G 2 ) K ( jωc 2 + G 2 ) R +/ jωc jωk / K ( jω ) 2 + jω / R C 2 ( K ) +/ R 2 C 2 +/ R C +/ R R 2 C C 2
10 H( jω ) = R C 2 jωk / K ( jω ) 2 + jω / R C 2 ( K ) +/ R 2 C 2 +/ R C +/ R R C C 2 2 Substituting in numerical values H( jω ) = 57.4 jω ( jω ) jω Poles at s = ± j Underdamped
11
12 A signal generator generates a constant-amplitude, variablefrequency analog sinusoid that is sampled at a rate of khz to form the input signal for this bandpass digital filter. Find the frequency of the signal generator that corresponds to the center frequency of the filter. Also find the effective -3dB bandwidth of the filter by finding the signal frequencies at which the power of the output signal is half of its value at the center frequency.
13 This filter's block diagram is drawn in Direct Form II so the transfer function is H( z) = 2.38z z z 4.989z z 2.675z response is H( e jω ) = and the frequency 2.38e j 4Ω 24.77e j 2Ω e j 4Ω.989e j 3Ω e j 2Ω.675e jω

14 Squared Magnitude of the Frequency Response.
15
16 The digital center frequency is Ω = radians/sample. That corresponds to a signal generator frequency of ω = 999 radians/second or 59 Hz. The -3dB points are at Ω = radians/sample Hz Ω =.24 radians/sample Hz for a half-power bandwidth of about 39. Hz.
17 A signal x( t) = 4 cos( 2000πt)cos( 200πt) is sampled at its Nyquist rate. What is the signal power of the resultant discrete-time signal x[ n]? The Nyquist rate is 2200 samples/second. Therefore x[ n] = 4 cos( 2π ( 5 /)n)cos( 2π ( / 22)n) = 2 cos 2π ( 9 / 22)n = N 0 = 2 = 2 x[ n] 2 = 4 22 n= N 0 n= 22 n= 22 cos 2 ( 2π ( 9 / 22)n) + cos 2 πn + cos πn 2 cos 2π ( 9 / 22)n + 2cos 2π 9 / 22 + cos πn ( n)cos πn cos 2 ( 2π ( 9 / 22)n) + cos 2 ( πn) + 2 cos( 2π ( 9 / 22)n)cos( πn) n= 22 n= 22 =0 n= 22 { } = 6 = 2 ( / 2 )
18 Alternate Solution: A signal x( t) = 4 cos( 2000πt)cos 200πt What is the signal power of the resultant discrete-time signal x[ n]? The Nyquist rate is 2200 samples/second. Therefore x[ n] = 4 cos( 2π ( 5 /)n)cos( 2π ( / 22)n) X F is sampled at its Nyquist rate. = δ ( F 5 /) + δ ( F + 5 /) δ ( F / 22 ) + δ ( F +/ 22 ) = δ ( F / 2) + δ ( F + 9 / 22) + δ ( F +/ 2) X F + δ F 9 / 22 =δ F+/2 = 2δ ( F / 2) + δ ( F 9 / 22) + δ ( F + 9 / 22) X F = = 6 =δ F /2
19 A signal x( t) = 4 cos( 2000πt)cos( 200πt) is sampled at twice its Nyquist rate. What is the signal power of the resultant discrete-time signal x[ n]? The Nyquist rate is 2200 samples/second. Therefore x[ n] = 4 cos( 2π ( 5 / 22)n)cos( 2π ( / 44)n) = 2 cos 2π ( 9 / 44)n = N 0 = = x[ n] 2 = 4 44 n= N 0 n= 44 n= 44 cos 2 ( 2π ( 9 / 44)n) + cos 2 πn / 2 + cos πn / 2 2 cos 2π ( 9 / 44)n + 2 cos 2π 9 / 44 + cos πn / 2 ( n)cos πn / 2 cos 2 ( 2π ( 9 / 44)n) + cos 2 ( πn / 2) + 2 cos( 2π ( 9 / 44)n)cos πn / 2 n= 44 n= 44 n= 44 = {( / 2 )44 + ( / 2 )44 } = 4 It can be shown that this answer is the same for any sampling rate that is greater than the Nyquist rate. Why is this signal power less than the previous signal power?
20 A signal x( t) = 4 cos( 2000πt)sin( 200πt) is sampled at twice its Nyquist rate. What is the signal power of the resultant discrete-time signal x[ n]? The Nyquist rate is 2200 samples/second. Therefore x[ n] = 4 cos( 2π ( 5 / 22)n)sin( 2π ( / 44)n) = 2 cos 2π ( 9 / 44)n = N 0 = = x[ n] 2 = 4 44 n= N 0 n= 44 n= 44 sin 2 ( 2π ( 9 / 44)n) + sin 2 πn / 2 + sin πn / 2 2 sin 2π ( 9 / 44)n + 2sin 2π 9 / 44 + sin πn / 2 ( n)sin πn / 2 sin 2 ( 2π ( 9 / 44)n) + sin 2 ( πn / 2) + 2 sin( 2π ( 9 / 44)n)sin πn / 2 n= 44 { } = 4 = ( / 2 )44 + ( / 2 )44 n= 44 n= 44 It can be shown that this answer is the same for any sampling rate that is greater than the Nyquist rate. This is the same as the previous signal power.
21 A signal x( t) = 4 cos( 2000πt)sin( 200πt) is sampled at its Nyquist rate. What is the signal power of the resultant discrete-time signal x[ n]? The Nyquist rate is 2200 samples/second. Therefore x[ n] = 4 cos( 2π ( 5 /)n)sin ( 2π ( / 22)n) = 2 sin 2π ( 9 / 22)n = N 0 = 2 x[ n] 2 = 4 22 n= N 0 n= 22 sin 2 2π ( 9 / 22)n = 2 n= 22 + sin πn sin 2π ( 9 / 22)n + sin πn Why is this signal power less than the previous two signal powers? =0 2
Frequency Responses and Active Filter Circuits
 Frequency Responses and Active Filter Circuits Compensation capacitors and parasitic capacitors will influence the frequency response Capacitors are also purposely added to create certain functions; e.g.
Experiment 8 Frequency Response
 Experiment 8 Frequency Response W.T. Yeung, R.A. Cortina, and R.T. Howe UC Berkeley EE 105 Spring 2005 1.0 Objective This lab will introduce the student to frequency response of circuits. The student will
EECS40 RLC Lab guide
 EECS40 RLC Lab guide Introduction Second-Order Circuits Second order circuits have both inductor and capacitor components, which produce one or more resonant frequencies, ω0. In general, a differential
EE 230 Lab Lab nf C 2. A. Low-Q low-pass active filters. (a) 10 k! Figure 1. (a) First-order low-pass. (b) Second-order low-pass.
 10 k! Figure 1. (a) First-order low-pass. (b) Second-order low-pass.") Second-order filter circuits This time, we measure frequency response plots for second-order filters. We start by examining a simple 2nd-order low-pass filter. The we look at the various arrangements of
Second-order filter circuits This time, we measure frequency response plots for second-order filters. We start by examining a simple 2nd-order low-pass filter. The we look at the various arrangements of
Spectrogram Review The Sampling Problem: 2π Ambiguity Fourier Series. Lecture 6: Sampling. ECE 401: Signal and Image Analysis. University of Illinois
 Lecture 6: Sampling ECE 401: Signal and Image Analysis University of Illinois 2/7/2017 1 Spectrogram Review 2 The Sampling Problem: 2π Ambiguity 3 Fourier Series Outline 1 Spectrogram Review 2 The Sampling
Syllabus Cosines Sampled Signals. Lecture 1: Cosines. ECE 401: Signal and Image Analysis. University of Illinois 1/19/2017
 Lecture 1: Cosines ECE 401: Signal and Image Analysis University of Illinois 1/19/2017 1 Syllabus 2 Cosines 3 Sampled Signals Outline 1 Syllabus 2 Cosines 3 Sampled Signals Who should take this course?
EE105 Fall 2015 Microelectronic Devices and Circuits. Amplifier Gain
 EE05 Fall 205 Microelectronic Devices and Circuits Prof. Ming C. Wu wu@eecs.berkeley.edu 5 Sutardja Dai Hall (SDH) 2- Amplifier Gain Voltage Gain: Current Gain: Power Gain: Note: A v v O v I A i i O i
Lecture 2 Analog circuits. IR detection
 Seeing the light.. Lecture Analog circuits I t IR light V 9V V Q OP805 RL IR detection Noise sources: Electrical (60Hz, 0Hz, 80Hz.) Other electrical IR from lights IR from cameras (autofocus) Visible light
PHYSICS 330 LAB Operational Amplifier Frequency Response
 PHYSICS 330 LAB Operational Amplifier Frequency Response Objectives: To measure and plot the frequency response of an operational amplifier circuit. History: Operational amplifiers are among the most widely
Assist Lecturer: Marwa Maki. Active Filters
 Active Filters In past lecture we noticed that the main disadvantage of Passive Filters is that the amplitude of the output signals is less than that of the input signals, i.e., the gain is never greater
Homework Assignment 01
 Homework Assignment 01 In this homework set students review some basic circuit analysis techniques, as well as review how to analyze ideal op-amp circuits. Numerical answers must be supplied using engineering
An active filters means using amplifiers to improve the filter. An acive second-order RC low-pass filter still has two RC components in series.
 Active Filters An active filters means using amplifiers to improve the filter. An acive second-order low-pass filter still has two components in series. Hjω ( ) -------------------------- 2 = = ----------------------------------------------------------
Oscillator Principles
 Oscillators Introduction Oscillators are circuits that generates a repetitive waveform of fixed amplitude and frequency without any external input signal. The function of an oscillator is to generate alternating
( ) D. An information signal x( t) = 5cos( 1000πt) LSSB modulates a carrier with amplitude A c
 D. An information signal x( t) = 5cos( 1000πt) LSSB modulates a carrier with amplitude A c") An inormation signal x( t) 5cos( 1000πt) LSSB modulates a carrier with amplitude A c 1. This signal is transmitted through a channel with 30 db loss. It is demodulated using a synchronous demodulator.
An inormation signal x( t) 5cos( 1000πt) LSSB modulates a carrier with amplitude A c 1. This signal is transmitted through a channel with 30 db loss. It is demodulated using a synchronous demodulator.
EE 221 CIRCUITS II. Chapter 12 Three-Phase Circuit
 EE 221 CRCUTS Chapter 12 Three-Phase Circuit 1 THREE-PHASE CRCUTS CHAPTER 12 12.1 What is a Three-Phase Circuit? 12.2 Balanced Three-Phase oltages 12.3 Balanced Three-Phase Connection 12.4 Power in a Balanced
Digital Processing of Continuous-Time Signals
 Chapter 4 Digital Processing of Continuous-Time Signals 清大電機系林嘉文 cwlin@ee.nthu.edu.tw 03-5731152 Original PowerPoint slides prepared by S. K. Mitra 4-1-1 Digital Processing of Continuous-Time Signals Digital
Homework Assignment 12
 Homework Assignment 12 Question 1 Shown the is Bode plot of the magnitude of the gain transfer function of a constant GBP amplifier. By how much will the amplifier delay a sine wave with the following
Homework Assignment 11
 Homework Assignment 11 Question 1 (Short Takes) Two points each unless otherwise indicated. 1. What is the 3-dB bandwidth of the amplifier shown below if r π = 2.5K, r o = 100K, g m = 40 ms, and C L =
Digital Processing of
 Chapter 4 Digital Processing of Continuous-Time Signals 清大電機系林嘉文 cwlin@ee.nthu.edu.tw 03-5731152 Original PowerPoint slides prepared by S. K. Mitra 4-1-1 Digital Processing of Continuous-Time Signals Digital
3.2 Measuring Frequency Response Of Low-Pass Filter :
 2.5 Filter Band-Width : In ideal Band-Pass Filters, the band-width is the frequency range in Hz where the magnitude response is at is maximum (or the attenuation is at its minimum) and constant and equal
CHAPTER 6 Frequency Response, Bode. Plots, and Resonance
 CHAPTER 6 Frequency Response, Bode Plots, and Resonance CHAPTER 6 Frequency Response, Bode Plots, and Resonance 1. State the fundamental concepts of Fourier analysis. 2. Determine the output of a filter
, answer the next six questions.
 Frequency Response Problems Conceptual Questions 1) T/F Given f(t) = A cos (ωt + θ): The amplitude of the output in sinusoidal steady-state increases as K increases and decreases as ω increases. 2) T/F
Designing Information Devices and Systems II Fall 2018 Elad Alon and Miki Lustig Homework 4
 EECS 16B Designing Information Devices and Systems II Fall 2018 Elad Alon and Miki Lustig Homework 4 This homework is solely for your own practice. However, everything on it is in scope for midterm 1,
EELE 4310: Digital Signal Processing (DSP)
") EELE 4310: Digital Signal Processing (DSP) Chapter # 10 : Digital Filter Design (Part One) Spring, 2012/2013 EELE 4310: Digital Signal Processing (DSP) - Ch.10 Dr. Musbah Shaat 1 / 19 Outline 1 Introduction
EELE 4310: Digital Signal Processing (DSP) Chapter # 10 : Digital Filter Design (Part One) Spring, 2012/2013 EELE 4310: Digital Signal Processing (DSP) - Ch.10 Dr. Musbah Shaat 1 / 19 Outline 1 Introduction
Designing Information Devices and Systems II Fall 2018 Elad Alon and Miki Lustig Homework 4
 EECS 6B Designing Information Devices and Systems II Fall 208 Elad Alon and Miki Lustig Homework 4 This homework is solely for your own practice. However, everything on it is in scope for midterm, and
The above figure represents a two stage circuit. Recall, the transfer function relates. Vout
 LABORATORY 12: Bode plots/second Order Filters Material covered: Multistage circuits Bode plots Design problem Overview Notes: Two stage circuits: Vin1 H1(s) Vout1 Vin2 H2(s) Vout2 The above figure represents
EE-2302 Passive Filters and Frequency Response
 EE2302 Passive Filters and Frequency esponse Objective he student should become acquainted with simple passive filters for performing highpass, lowpass, and bandpass operations. he experimental tasks also
DSP Laboratory (EELE 4110) Lab#10 Finite Impulse Response (FIR) Filters
 Lab#10 Finite Impulse Response (FIR) Filters") Islamic University of Gaza OBJECTIVES: Faculty of Engineering Electrical Engineering Department Spring-2011 DSP Laboratory (EELE 4110) Lab#10 Finite Impulse Response (FIR) Filters To demonstrate the concept
Islamic University of Gaza OBJECTIVES: Faculty of Engineering Electrical Engineering Department Spring-2011 DSP Laboratory (EELE 4110) Lab#10 Finite Impulse Response (FIR) Filters To demonstrate the concept
Discrete-time Signals & Systems
 Discrete-time Signals & Systems S Wongsa Dept. of Control Systems and Instrumentation Engineering, KMU JAN, 2010 1 Overview Signals & Systems Continuous & Discrete ime Sampling Sampling in Frequency Domain
Fourier Transform Analysis of Signals and Systems
 Fourier Transform Analysis of Signals and Systems Ideal Filters Filters separate what is desired from what is not desired In the signals and systems context a filter separates signals in one frequency
Outline. Discrete time signals. Impulse sampling z-transform Frequency response Stability INF4420. Jørgen Andreas Michaelsen Spring / 37 2 / 37
 INF4420 Discrete time signals Jørgen Andreas Michaelsen Spring 2013 1 / 37 Outline Impulse sampling z-transform Frequency response Stability Spring 2013 Discrete time signals 2 2 / 37 Introduction More
Electronics basics for MEMS and Microsensors course
 Electronics basics for course, a.a. 2017/2018, M.Sc. in Electronics Engineering Transfer function 2 X(s) T(s) Y(s) T S = Y s X(s) The transfer function of a linear time-invariant (LTI) system is the function
EXPERIMENT 4: RC, RL and RD CIRCUITs
 EXPERIMENT 4: RC, RL and RD CIRCUITs Equipment List An assortment of resistor, one each of (330, 1k,1.5k, 10k,100k,1000k) Function Generator Oscilloscope 0.F Ceramic Capacitor 100H Inductor LED and 1N4001
CHAPTER 14. Introduction to Frequency Selective Circuits
 CHAPTER 14 Introduction to Frequency Selective Circuits Frequency-selective circuits Varying source frequency on circuit voltages and currents. The result of this analysis is the frequency response of
CS3291: Digital Signal Processing
 CS39 Exam Jan 005 //08 /BMGC University of Manchester Department of Computer Science First Semester Year 3 Examination Paper CS39: Digital Signal Processing Date of Examination: January 005 Answer THREE
Fig. 1. NI Elvis System
 Lab 2: Introduction to I Elvis Environment. Objectives: The purpose of this laboratory is to provide an introduction to the NI Elvis design and prototyping environment. Basic operations provided by Elvis
Frequency Response Analysis
 Frequency Response Analysis Continuous Time * M. J. Roberts - All Rights Reserved 2 Frequency Response * M. J. Roberts - All Rights Reserved 3 Lowpass Filter H( s) = ω c s + ω c H( jω ) = ω c jω + ω c
Non-ideal Behavior of Electronic Components at High Frequencies and Associated Measurement Problems
 Nonideal Behavior of Electronic Components at High Frequencies and Associated Measurement Problems Matthew Beckler beck0778@umn.edu EE30 Lab Section 008 October 27, 2006 Abstract In the world of electronics,
Downloaded from
 VI SEMESTER FINAL EXAMINATION 2003 Attempt ALL questions. Q. [1] [a] What is filter? Why it is required? Define half power points, rolloff and centre frequency. [3] [b] Plot the magnitude and phase response
BJT Circuits (MCQs of Moderate Complexity)
") BJT Circuits (MCQs of Moderate Complexity) 1. The current ib through base of a silicon npn transistor is 1+0.1 cos (1000πt) ma. At 300K, the rπ in the small signal model of the transistor is i b B C r
BJT Circuits (MCQs of Moderate Complexity) 1. The current ib through base of a silicon npn transistor is 1+0.1 cos (1000πt) ma. At 300K, the rπ in the small signal model of the transistor is i b B C r
FREQUENCY RESPONSE AND PASSIVE FILTERS LABORATORY
 FREQUENCY RESPONSE AND PASSIVE FILTERS LABORATORY In this experiment we will analytically determine and measure the frequency response of networks containing resistors, AC source/sources, and energy storage
Sampling and Signal Processing
 Sampling and Signal Processing Sampling Methods Sampling is most commonly done with two devices, the sample-and-hold (S/H) and the analog-to-digital-converter (ADC) The S/H acquires a continuous-time signal
CHAPTER 6: ALTERNATING CURRENT
 CHAPTER 6: ALTERNATING CURRENT PSPM II 2005/2006 NO. 12(C) 12. (c) An ac generator with rms voltage 240 V is connected to a RC circuit. The rms current in the circuit is 1.5 A and leads the voltage by
Modulation is the process of impressing a low-frequency information signal (baseband signal) onto a higher frequency carrier signal
 onto a higher frequency carrier signal") Modulation is the process of impressing a low-frequency information signal (baseband signal) onto a higher frequency carrier signal Modulation is a process of mixing a signal with a sinusoid to produce
Modulation is the process of impressing a low-frequency information signal (baseband signal) onto a higher frequency carrier signal Modulation is a process of mixing a signal with a sinusoid to produce
Passive Component Analysis. OMICRON Lab Webinar Nov. 2015
 Passive Component Analysis OMICRON Lab Webinar Nov. 2015 Webinar Hints Activate the chat function Please mute your microphones to avoid echoes Feel free to post questions anytime using the chat function
Homework Assignment 06
 Question 1 (2 points each unless noted otherwise) Homework Assignment 06 1. True or false: when transforming a circuit s diagram to a diagram of its small-signal model, we replace dc constant current sources
v(t) = V p sin(2π ft +φ) = V p cos(2π ft +φ + π 2 )
 = V p sin(2π ft +φ) = V p cos(2π ft +φ + π 2 )") 1 Let us revisit sine and cosine waves. A sine wave can be completely defined with three parameters Vp, the peak voltage (or amplitude), its frequency w in radians/second or f in cycles/second (Hz), and
1 Let us revisit sine and cosine waves. A sine wave can be completely defined with three parameters Vp, the peak voltage (or amplitude), its frequency w in radians/second or f in cycles/second (Hz), and
EMT212 Analog Electronic II. Chapter 4. Oscillator
 EMT Analog Electronic II Chapter 4 Oscillator Objectives Describe the basic concept of an oscillator Discuss the basic principles of operation of an oscillator Analyze the operation of RC, LC and crystal
Digital Signal Processing
 Digital Signal Processing Lecture 9 Discrete-Time Processing of Continuous-Time Signals Alp Ertürk alp.erturk@kocaeli.edu.tr Analog to Digital Conversion Most real life signals are analog signals These
ECE-342 Test 1: Sep 27, :00-8:00, Closed Book. Name : SOLUTION
 ECE-342 Test 1: Sep 27, 2011 6:00-8:00, Closed Book Name : SOLUTION All solutions must provide units as appropriate. Use the physical constants and data as provided on the formula sheet the last page of
Signals and Systems Lecture 6: Fourier Applications
 Signals and Systems Lecture 6: Fourier Applications Farzaneh Abdollahi Department of Electrical Engineering Amirkabir University of Technology Winter 2012 arzaneh Abdollahi Signal and Systems Lecture 6
Spring 2000 EE361: MIDTERM EXAM 1
 NAME: STUDENT NUMBER: Spring 2000 EE361: MIDTERM EXAM 1 This exam is open book and closed notes. Assume f=60 hz and use the constant µ o =4π 10-7 wherever necessary. Be sure to show all work clearly. 1.
EXPERIMENT 4: RC, RL and RD CIRCUITs
 EXPERIMENT 4: RC, RL and RD CIRCUITs Equipment List Resistor, one each of o 330 o 1k o 1.5k o 10k o 100k o 1000k 0.F Ceramic Capacitor 4700H Inductor LED and 1N4004 Diode. Introduction We have studied
Lecture 5: RC Filters. Series Resonance and Quality Factor. Matching. Soldering.
 Whites, EE 322 Lecture 5 Page of 2 Lecture 5: C Filters. Series esonance and Quality Factor. Matching. Soldering. eview the following sections in your text:. Section 3. Complex Numbers. 2. Section 3.2
Butterworth Active Bandpass Filter using Sallen-Key Topology
 Butterworth Active Bandpass Filter using Sallen-Key Topology Technical Report 5 Milwaukee School of Engineering ET-3100 Electronic Circuit Design Submitted By: Alex Kremnitzer Date: 05-11-2011 Date Performed:
4 Experiment 4: DC Motor Voltage to Speed Transfer Function Estimation by Step Response and Frequency Response (Part 2)
") 4 Experiment 4: DC Motor Voltage to Speed Transfer Function Estimation by Step Response and Frequency Response (Part 2) 4.1 Introduction This lab introduces new methods for estimating the transfer function
4 Experiment 4: DC Motor Voltage to Speed Transfer Function Estimation by Step Response and Frequency Response (Part 2) 4.1 Introduction This lab introduces new methods for estimating the transfer function
y(n)= Aa n u(n)+bu(n) b m sin(2πmt)= b 1 sin(2πt)+b 2 sin(4πt)+b 3 sin(6πt)+ m=1 x(t)= x = 2 ( b b b b
= Aa n u(n)+bu(n) b m sin(2πmt)= b 1 sin(2πt)+b 2 sin(4πt)+b 3 sin(6πt)+ m=1 x(t)= x = 2 ( b b b b") Exam 1 February 3, 006 Each subquestion is worth 10 points. 1. Consider a periodic sawtooth waveform x(t) with period T 0 = 1 sec shown below: (c) x(n)= u(n). In this case, show that the output has the
Exam 1 February 3, 006 Each subquestion is worth 10 points. 1. Consider a periodic sawtooth waveform x(t) with period T 0 = 1 sec shown below: (c) x(n)= u(n). In this case, show that the output has the
Chapter 5 Window Functions. periodic with a period of N (number of samples). This is observed in table (3.1).
. This is observed in table (3.1).") Chapter 5 Window Functions 5.1 Introduction As discussed in section (3.7.5), the DTFS assumes that the input waveform is periodic with a period of N (number of samples). This is observed in table (3.1).
Chapter 5 Window Functions 5.1 Introduction As discussed in section (3.7.5), the DTFS assumes that the input waveform is periodic with a period of N (number of samples). This is observed in table (3.1).
Homework Assignment 13
 Question 1 Short Takes 2 points each. Homework Assignment 13 1. Classify the type of feedback uses in the circuit below (i.e., shunt-shunt, series-shunt, ) Answer: Series-shunt. 2. True or false: an engineer
Real Analog - Circuits 1 Chapter 11: Lab Projects
 Real Analog - Circuits 1 Chapter 11: Lab Projects 11.2.1: Signals with Multiple Frequency Components Overview: In this lab project, we will calculate the magnitude response of an electrical circuit and
Test Your Understanding
 074 Part 2 Analog Electronics EXEISE POBLEM Ex 5.3: For the switched-capacitor circuit in Figure 5.3b), the parameters are: = 30 pf, 2 = 5pF, and F = 2 pf. The clock frequency is 00 khz. Determine the
Electronics II. 3. measurement : Tuned circuits
 Electronics II. 3. measurement : Tuned circuits This laboratory session involves circuits which contain a double-t (or TT), a passive RC circuit: Figure 1. Double T passive RC circuit module The upper
Q Multiplication in the Wien-bridge Oscillator
 Multiplication in the Wien-bridge Oscillator The Wien-bridge oscillator earns its name from the typical bridge arrangement of the feedbac loops (fig.). This configuration is capable of delivering a clean
AC Magnitude and Phase
 AC Magnitude and Phase Objectives: oday's experiment provides practical experience with the meaning of magnitude and phase in a linear circuits and the use of phasor algebra to predict the response of
Electrochemical Impedance Spectroscopy and Harmonic Distortion Analysis
 Electrochemical Impedance Spectroscopy and Harmonic Distortion Analysis Bernd Eichberger, Institute of Electronic Sensor Systems, University of Technology, Graz, Austria bernd.eichberger@tugraz.at 1 Electrochemical
Analog Filters D R. T A R E K T U T U N J I P H I L A D E L P H I A U N I V E R S I T Y, J O R D A N
 Analog Filters D. T A E K T U T U N J I P H I L A D E L P H I A U N I V E S I T Y, J O D A N 2 0 4 Introduction Electrical filters are deigned to eliminate unwanted frequencies Filters can be classified
The diodes keep the output waveform from getting too large.
 Wien Bridge Oscillat CIRCUIT: The Wien bridge oscillat, see Fig., consists of two voltage dividers. It oscillates (approximately) sinusoidally at the frequency that produces the same voltage out of both
Signals and Systems Lecture 6: Fourier Applications
 Signals and Systems Lecture 6: Fourier Applications Farzaneh Abdollahi Department of Electrical Engineering Amirkabir University of Technology Winter 2012 arzaneh Abdollahi Signal and Systems Lecture 6
Problem Sheet for Amplitude Modulation
 Problem heet for Amplitude Modulation Q1: For the sinusoidaly modulated DB/LC waveform shown in Fig. below. a Find the modulation index. b ketch a line spectrum. c Calculated the ratio of average power
Digital Signal Processing
 COMP ENG 4TL4: Digital Signal Processing Notes for Lecture #25 Wednesday, November 5, 23 Aliasing in the impulse invariance method: The impulse invariance method is only suitable for filters with a bandlimited
GEORGIA INSTITUTE OF TECHNOLOGY. SCHOOL of ELECTRICAL and COMPUTER ENGINEERING. ECE 2026 Summer 2018 Lab #8: Filter Design of FIR Filters
 GEORGIA INSTITUTE OF TECHNOLOGY SCHOOL of ELECTRICAL and COMPUTER ENGINEERING ECE 2026 Summer 2018 Lab #8: Filter Design of FIR Filters Date: 19. Jul 2018 Pre-Lab: You should read the Pre-Lab section of
ECE 556 BASICS OF DIGITAL SPEECH PROCESSING. Assıst.Prof.Dr. Selma ÖZAYDIN Spring Term-2017 Lecture 2
 ECE 556 BASICS OF DIGITAL SPEECH PROCESSING Assıst.Prof.Dr. Selma ÖZAYDIN Spring Term-2017 Lecture 2 Analog Sound to Digital Sound Characteristics of Sound Amplitude Wavelength (w) Frequency ( ) Timbre
Problems from the 3 rd edition
 (2.1-1) Find the energies of the signals: a) sin t, 0 t π b) sin t, 0 t π c) 2 sin t, 0 t π d) sin (t-2π), 2π t 4π Problems from the 3 rd edition Comment on the effect on energy of sign change, time shifting
ECE438 - Laboratory 7a: Digital Filter Design (Week 1) By Prof. Charles Bouman and Prof. Mireille Boutin Fall 2015
 By Prof. Charles Bouman and Prof. Mireille Boutin Fall 2015") Purdue University: ECE438 - Digital Signal Processing with Applications 1 ECE438 - Laboratory 7a: Digital Filter Design (Week 1) By Prof. Charles Bouman and Prof. Mireille Boutin Fall 2015 1 Introduction
Purdue University: ECE438 - Digital Signal Processing with Applications 1 ECE438 - Laboratory 7a: Digital Filter Design (Week 1) By Prof. Charles Bouman and Prof. Mireille Boutin Fall 2015 1 Introduction
Chapter 3 Data and Signals
 Chapter 3 Data and Signals 3.2 To be transmitted, data must be transformed to electromagnetic signals. 3-1 ANALOG AND DIGITAL Data can be analog or digital. The term analog data refers to information that
DIGITAL FILTERING AND THE DFT
 DIGITAL FILTERING AND THE DFT Digital Linear Filters in the Receiver Discrete-time Linear System Tidbits DFT Tidbits Filter Design Tidbits idealized system Software Receiver Design Johnson/Sethares/Klein
University of Michigan EECS 311: Electronic Circuits Fall 2008 LAB 2 ACTIVE FILTERS
 University of Michigan EECS 311: Electronic Circuits Fall 2008 LAB 2 ACTIVE FILTERS Issued 9/22/2008 Pre Lab Completed 9/29/2008 Lab Due in Lecture 10/6/2008 Introduction In this lab you will design a
Homework Assignment 03
 Homework Assignment 03 Question 1 (Short Takes), 2 points each unless otherwise noted. 1. Two 0.68 μf capacitors are connected in series across a 10 khz sine wave signal source. The total capacitive reactance
55:041 Electronic Circuits The University of Iowa Fall Exam 3. Question 1 Unless stated otherwise, each question below is 1 point.
 Exam 3 Name: Score /65 Question 1 Unless stated otherwise, each question below is 1 point. 1. An engineer designs a class-ab amplifier to deliver 2 W (sinusoidal) signal power to an resistive load. Ignoring
Chapter 1. Electronics and Semiconductors
 Chapter 1. Electronics and Semiconductors Tong In Oh 1 Objective Understanding electrical signals Thevenin and Norton representations of signal sources Representation of a signal as the sum of sine waves
Solution of ECE 342 Test 3 S12
 Solution of ECE 34 Test 3 S1 1 A random power signal has a mean of three and a standard deviation of five Find its numerical total average signal power Signal Power P = 3 + 5 = 34 A random energy signal
Class #16: Experiment Matlab and Data Analysis
 Class #16: Experiment Matlab and Data Analysis Purpose: The objective of this experiment is to add to our Matlab skill set so that data can be easily plotted and analyzed with simple tools. Background:
EK307 Active Filters and Steady State Frequency Response
 EK307 Active Filters and Steady State Frequency Response Laboratory Goal: To explore the properties of active signal-processing filters Learning Objectives: Active Filters, Op-Amp Filters, Bode plots Suggested
Chapter 4 Applications of the Fourier Series. Raja M. Taufika R. Ismail. September 29, 2017
 BEE2143 Signals & Networks Chapter 4 Applications of the Fourier Series Raja M. Taufika R. Ismail Universiti Malaysia Pahang September 29, 2017 Outline Circuit analysis Average power and rms values Spectrum
POLYTECHNIC UNIVERSITY Electrical Engineering Department. EE SOPHOMORE LABORATORY Experiment 5 RC Circuits Frequency Response
 POLYTECHNIC UNIVERSITY Electrical Engineering Department EE SOPHOMORE LORTORY Eperiment 5 RC Circuits Frequency Response Modified for Physics 18, rooklyn College I. Overview of Eperiment In this eperiment
Understanding Discrepancies in Vibration Amplitude Readings Between Different Instruments
 Understanding Discrepancies in Vibration Amplitude Readings Between Different Instruments Part of 2 Steve Sabin Editor, ORBIT magazine GE Energy steve.sabin@ge.com 8 ORBIT [Vol.25 No.2 25] Introduction
Frequency Division Multiplexing Spring 2011 Lecture #14. Sinusoids and LTI Systems. Periodic Sequences. x[n] = x[n + N]
![Frequency Division Multiplexing Spring 2011 Lecture #14. Sinusoids and LTI Systems. Periodic Sequences. x[n] = x[n + N]](/thumbs/88/116022205.jpg "Frequency Division Multiplexing Spring 2011 Lecture #14. Sinusoids and LTI Systems. Periodic Sequences. x[n] = x[n + N]") Frequency Division Multiplexing 6.02 Spring 20 Lecture #4 complex exponentials discrete-time Fourier series spectral coefficients band-limited signals To engineer the sharing of a channel through frequency
Frequency Division Multiplexing 6.02 Spring 20 Lecture #4 complex exponentials discrete-time Fourier series spectral coefficients band-limited signals To engineer the sharing of a channel through frequency
Calsytech, # 38 North Mada Street Nandambakkam, Chennai, Tamil Nadu. Discipline Electro-Technical Calibration Issue Date
 Last Amended on 23.11.2016 Page 1 of 7 SOURCE 1. DC VOLTAGE $ 1mV to 10 mv 10 mv to100 mv 100 mv to1000 V 0.43% to 0.05% 0.05% to 0.01% 0.01% to 0.004% Calibrator, Calibrator by DC VOLTAGE 1mV to 20 mv
Multirate Signal Processing Lecture 7, Sampling Gerald Schuller, TU Ilmenau
 Multirate Signal Processing Lecture 7, Sampling Gerald Schuller, TU Ilmenau (Also see: Lecture ADSP, Slides 06) In discrete, digital signal we use the normalized frequency, T = / f s =: it is without a
Lecture 16 Date: Frequency Response (Contd.)
") Lecture 16 Date: 03.10.2017 Frequency Response (Contd.) Bode Plot (contd.) Bode Plot (contd.) Bode Plot (contd.) not every transfer function has all seven factors. To sketch the Bode plots for a generic
Lecture 16 Date: 03.10.2017 Frequency Response (Contd.) Bode Plot (contd.) Bode Plot (contd.) Bode Plot (contd.) not every transfer function has all seven factors. To sketch the Bode plots for a generic
Circuit Analysis-II. Circuit Analysis-II Lecture # 2 Wednesday 28 th Mar, 18
 Circuit Analysis-II Angular Measurement Angular Measurement of a Sine Wave ü As we already know that a sinusoidal voltage can be produced by an ac generator. ü As the windings on the rotor of the ac generator
Filter Design, Active Filters & Review. EGR 220, Chapter 14.7, December 14, 2017
 Filter Design, Active Filters & Review EGR 220, Chapter 14.7, 14.11 December 14, 2017 Overview ² Passive filters (no op amps) ² Design examples ² Active filters (use op amps) ² Course review 2 Example:
VCC. Digital 16 Frequency Divider Digital-to-Analog Converter Butterworth Active Filter Sample-and-Hold Amplifier (part 2) Last Update: 03/19/14
 Last Update: 03/19/14") Digital 16 Frequency Divider Digital-to-Analog Converter Butterworth Active Filter Sample-and-Hold Amplifier (part 2) ECE3204 Lab 5 Objective The purpose of this lab is to design and test an active Butterworth
Digital 16 Frequency Divider Digital-to-Analog Converter Butterworth Active Filter Sample-and-Hold Amplifier (part 2) ECE3204 Lab 5 Objective The purpose of this lab is to design and test an active Butterworth
Lecture 2 Analog circuits...or How to detect the Alarm beacon
 Lecture 2 Analog circuits..or How to detect the Alarm beacon I t IR light generates collector current V1 9V +V I c Q1 OP805 IR detection Vout Noise sources: Electrical (60Hz, 120Hz, 180Hz.) Other electrical
Advanced Measurements
 Albaha University Faculty of Engineering Mechanical Engineering Department Lecture 9: Wheatstone Bridge and Filters Ossama Abouelatta o_abouelatta@yahoo.com Mechanical Engineering Department Faculty of
Figure Derive the transient response of RLC series circuit with sinusoidal input. [15]
![Figure Derive the transient response of RLC series circuit with sinusoidal input. [15]](/thumbs/84/91046828.jpg "Figure Derive the transient response of RLC series circuit with sinusoidal input. [15]") COURTESY IARE Code No: R09220205 R09 SET-1 B.Tech II Year - II Semester Examinations, December-2011 / January-2012 NETWORK THEORY (ELECTRICAL AND ELECTRONICS ENGINEERING) Time: 3 hours Max. Marks: 80 Answer
COURTESY IARE Code No: R09220205 R09 SET-1 B.Tech II Year - II Semester Examinations, December-2011 / January-2012 NETWORK THEORY (ELECTRICAL AND ELECTRONICS ENGINEERING) Time: 3 hours Max. Marks: 80 Answer
University of Illinois at Chicago Spring ECE 412 Introduction to Filter Synthesis Homework #2 Solutions. Problem 1
 Problem 1 (a) Magnitude (impedance) scale the circuit so that all resistors are 1kΩ. Solution: Since all of the resistors in the circuit are 1Ω, we need to magnitude scale by k m = 1000; therefore, we
Physics 132 Quiz # 23
 Name (please (please print) print) Physics 132 Quiz # 23 I. I. The The current in in an an ac ac circuit is is represented by by a phasor.the value of of the the current at at some time time t t is is
Computer Networks. Practice Set I. Dr. Hussein Al-Bahadili
 بسم االله الرحمن الرحيم Computer Networks Practice Set I Dr. Hussein Al-Bahadili (1/11) Q. Circle the right answer. 1. Before data can be transmitted, they must be transformed to. (a) Periodic signals
Course Outline. Time vs. Freq. Domain Analysis. Frequency Response. Amme 3500 : System Dynamics & Control. Design via Frequency Response
 Course Outline Amme 35 : System Dynamics & Control Design via Frequency Response Week Date Content Assignment Notes Mar Introduction 2 8 Mar Frequency Domain Modelling 3 5 Mar Transient Performance and