High Speed Characterization Report
|
|
|
- Moris Miles
- 5 years ago
- Views:
Transcription

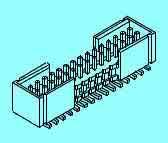
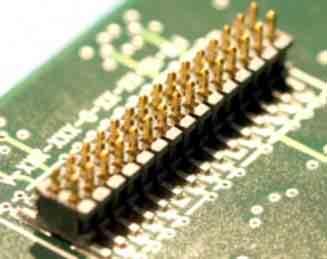
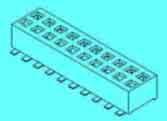
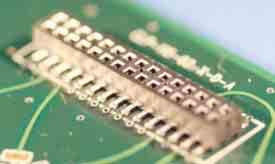
1 FTSH L-DV-A Mated With CLP L-D-A Description: Parallel Board-to-Board, [1.27mm] Pitch, 5.13mm (0.202 ) Stack Height Samtec, Inc All Rights Reserved
2 Table of Contents Connector Overview... 1 Connector System Speed Rating... 1 Frequency Domain Data Summary... 2 Table 1 - Single-Ended Connector System Performance... 2 Table 2 - Differential Connector System Bandwidth... 2 Time Domain Data Summary... 3 Table 3 - Single-Ended Impedance (Ω)... 3 Table 4 - Differential Impedance (Ω)... 3 Table 5 - Single-Ended Crosstalk (%)... 4 Table 6 - Differential Crosstalk (%)... 4 Table 7 - Propagation Delay (Mated Connector)... 4 Characterization Details... 5 Differential and Single-Ended Data... 5 Connector Signal to Ground Ratio... 5 Frequency Domain Data... 7 Time Domain Data... 7 Appendix A Frequency Domain Response Graphs... 9 Single-Ended Application Insertion Loss... 9 Single-Ended Application Return Loss... 9 Single-Ended Application NEXT Single-Ended Application FEXT Differential Application Insertion Loss Differential Application Return Loss Differential Application NEXT Differential Application FEXT Appendix B Time Domain Response Graphs Single-Ended Application Input Pulse Single-Ended Application Impedance Single-Ended Application Propagation Delay Single-Ended Application NEXT, Worst Case In Row Configuration Single-Ended Application FEXT, Worst Case In Row Configuration Single-Ended Application NEXT, Best Case In Row Configuration Single-Ended Application FEXT, Best Case In Row Configuration Single-Ended Application NEXT, Across Row Configuration Single-Ended Application FEXT, Across Row Configuration Differential Application Input Pulse Differential Application Impedance Differential Application Propagation Delay Differential Application NEXT, Worst Case In Row Configuration Samtec, Inc Page:ii All Rights Reserved
3 Differential Application FEXT, Worst Case In Row Configuration Differential Application NEXT, Best Case In Row Configuration Differential Application FEXT, Best Case In Row Configuration Differential Application NEXT, Across Row Configuration Differential Application FEXT, Across Row Configuration Appendix C Product and Test System Descriptions Product Description Test System Description Table 8 PCB Fixture Characterization & Termination Matrix Signal Conditioning, Calibration Standards And Signal Launch/Monitoring Appendix D Test and Measurement Setup Test Instruments Measurement Station Accessories Test Cables & Adapters Appendix E - Frequency and Time Domain Measurements Frequency (S-Parameter) Domain Procedures CSA8000 Setup Insertion Loss Return Loss Near-End Crosstalk (NEXT) Far-End Crosstalk (FEXT) Time Domain Procedures Impedance Propagation Delay Crosstalk Appendix F Glossary of Terms Samtec, Inc Page:iii All Rights Reserved
4 Connector Overview Micro 1.27mm (.050 ) pitch socket and terminal strip interfaces (CLP/FTSH Series ) are available with up to 50 contacts per row and board-to-board spacings of 5.13mm (0.202"), 5.18mm (0.204"), and 7.47mm (0.294) between boards. The data in this report is applicable only to the standard 5.13mm (0.202") board-to-board stack height version. Connector System Speed Rating FTSH/CLP Series, Parallel Board-to-Board, 1.27mm Pitch, 5.13mm (0.202") Stack Height Signaling Single-Ended: Differential: Speed Rating 7.0 GHz / 14 Gbps 8.5 GHz / 17 Gbps The Speed Rating is based on the -3 db insertion loss point of the connector system. The -3 db point can be used to estimate usable system bandwidth in a typical, two-level signaling environment. To calculate the Speed Rating, the measured -3 db point is rounded up to the nearest half-ghz level. The up-rounding corrects for a portion of the test board s trace loss, since trace losses are included in the loss data in this report. The resulting loss value is then doubled to determine the approximate maximum data rate in Gigabits per second (Gbps). For example, a connector with a -3 db point of 7.8 GHz would have a Speed Rating of 8 GHz/ 16 Gbps. A connector with a -3 db point of 7.2 GHz would have a Speed Rating of 7.5 GHz/ 15 Gbps. Samtec, Inc Page:1 All Rights Reserved
5 Frequency Domain Data Summary Table 1 - Single-Ended Connector System Performance Test Parameter Configuration Insertion Loss GSG 6.68 GHz Return Loss GSG -5dB to 6.68 GHz Near-End Crosstalk Far-End Crosstalk GAQG GAGQG Xrow, GAG to GQG GAQG GAGQG Xrow, GAG to GQG -8dB to 6.68 GHz -20dB to 6.68 GHz -10dB to 6.68 GHz -10dB to 6.68 GHz -12dB to 6.68 GHz -18dB to 6.68 GHz Table 2 - Differential Connector System Bandwidth Test Parameter Configuration Insertion Loss GSSG 8.18 GHz Return Loss GSSG -5dB to 8.18 GHz Near-End Crosstalk Far-End Crosstalk GAAQQG GAAGQQG Xrow, GAASS to GQQG GAAQQG GAAGQQG Xrow, GAASS to GQQG -15dB to 8.18 GHz -28dB to 8.18 GHz -15dB to 8.18 GHz -15dB to 8.18 GHz -25dB to 8.18 GHz -15dB to 8.18 GHz 1 PCB/Connector Test System Single Ended & Differential Signal Response CLP-02 / FTSH Insertion Loss (db) Differential Single Ended Frequency (GHz) Samtec, Inc Page:2 All Rights Reserved
6 Time Domain Data Summary Table 3 - Single-Ended Impedance (Ω) Signal Risetime 30±5ps 50 ps 100 ps 250 ps 500 ps 750 ps 1 ns Maximum Impedance Minimum Impedance Single-Ended Application Impedance vs. Risetime maximum minimum Ri seti me (psec) Table 4 - Differential Impedance (Ω) Signal Risetime 30±5ps 50 ps 100 ps 250 ps 500 ps 750 ps 1 ns Maximum Impedance Minimum Impedance Differential Application Impedance vs. Risetime Risetime (psec) maximum minimum Samtec, Inc Page:3 All Rights Reserved
7 Input (t r ) NEXT FEXT Table 5 - Single-Ended Crosstalk (%) 30±5ps 50 ps 100 ps 250 ps 500 ps 750 ps 1 ns GAQG GAGQG < 1.0 < 1.0 < 1.0 < 1.0 Xrow se < 1.0 < 1.0 GAQG < 1.0 < 1.0 < 1.0 GAGQG < 1.0 < 1.0 < 1.0 < 1.0 Xrow se < 1.0 < 1.0 < 1.0 < 1.0 Input (t r ) NEXT FEXT Table 6 - Differential Crosstalk (%) 30±5ps 50 ps 100 ps 250 ps 500 ps 750 ps 1 ns GAAQQSS < 1.0 < 1.0 < 1.0 GAAGQQG < 1.0 < 1.0 < 1.0 < 1.0 < 1.0 < 1.0 < 1.0 Xrow diff < 1.0 < 1.0 < 1.0 GAAQQSS < 1.0 < 1.0 < 1.0 < 1.0 < 1.0 GAAGQQG < 1.0 < 1.0 < 1.0 < 1.0 < 1.0 < 1.0 < 1.0 Xrow diff < 1.0 < 1.0 < 1.0 < 1.0 < 1.0 Table 7 - Propagation Delay (Mated Connector) Single-Ended 78ps Differential 72ps Samtec, Inc Page:4 All Rights Reserved
8 Characterization Details This report presents data which characterizes the signal integrity response of a connector pair in a controlled printed circuit board (PCB) environment. All efforts are made to reveal typical best-case responses inherent to the system under test (SUT). In this report, the SUT includes the test PCB from drive side probe tips to receive side probe tips. PCB effects are not removed or de-embedded from the test data. PCB designs with impedance mismatch, large losses, skew, cross talk, or similar impairments can have a significant impact on observed test data. Therefore, great design effort is put forth to limit these effects in the PCB utilized in these tests. Some board related effects, such as pad-to-ground capacitance and trace loss, are included in the data presented in this report. But other effects, such as via coupling or stub resonance, are not evaluated here. Such effects are addressed and characterized fully by the Samtec Final Inch products. Additionally, intermediate test signal connections can mask the connectors true performance. Such connection effects are minimized by using high performance test cables, adapters, and microwave probes. Where appropriate, calibration and deembedding routines are also used to reduce residual effects. Differential and Single-Ended Data Most Samtec connectors can be used successfully in both differential and single-ended applications. However, electrical performance will differ depending on the signal drive type. In this report, data is presented for both differential and single-ended drive scenarios. Connector Signal to Ground Ratio Samtec connectors are most often designed for generic applications, and can be implemented using various signal and ground pin assignments. In high speed systems, provisions must be made in the interconnect for signal return currents. Such paths are often referred to as ground. In some connectors, a ground plane or blade, or an outer shield is used as the signal return, while in others, connector pins are used as signal returns. Various combinations of signal pins, ground blades, and shields can also be utilized. Electrical performance can vary significantly depending upon the number and location of ground pins. In general, the more pins dedicated to ground, the better electrical performance will be. But dedicating pins to ground reduces signal density of a connector. So care must be taken when choosing signal/ground ratios in cost- or density-sensitive applications. Samtec, Inc Page:5 All Rights Reserved
9 For this connector, the following configurations were evaluated: Single-Ended Impedance: GSG (ground-signal-ground) Single-Ended Crosstalk: Electrical worst case : GAQG (ground-active-quiet-ground) Electrical best case : GAGQG (ground-active-ground-quiet-ground) Across row: Xrow se (from one row of terminals to the other row or across the ground blade when applicable) Differential Impedance: GSSG (Ground-positive signal-negative signal-ground) Differential Crosstalk: Electrical worst case : GAAQQG (ground-active-active-quiet-quiet-ground) Electrical best case : GAAGQQG (ground-active-active-ground-quiet-quietground) Across row:xrow diff (from one row of terminals to the other row or across the ground blade when applicable) (ground-active-active-static-static-ground) across the row of terminals to (ground-quiet-quiet-ground) In all cases where a center ground blade is present in the connector it is always grounded to the PCB. Only one single-ended signal or differential pair was driven for crosstalk measurements. Other configurations can be evaluated upon request. Please contact sig@samtec.com for more information. In a real system environment, active signals might be located at the outer edges of the signal contacts of concern, as opposed to the ground signals utilized in laboratory testing. For example, in a single-ended system, a pin-out of SSSS, or four adjacent single ended signals, might be encountered, as opposed to the GSG and GSSG configurations tested in the laboratory. Electrical characteristics in such applications could vary slightly from laboratory results. But in most applications, performance can safely be considered equivalent. Samtec, Inc Page:6 All Rights Reserved
10 Signal Edge Speed (Rise Time): In pulse signaling applications, the perceived performance of an interconnect can vary significantly depending on the edge rate or rise time of the exciting signal. For this report, the fastest rise time used was 30 +/-5 ps. Generally, this should demonstrate worst case performance. In many systems, the signal edge rate will be significantly slower at the connector than at the driver launch point. To estimate interconnect performance at other edge rates, data is provided for several rise times between 30 ps and 1.0 ns. For this report, rise times were measured at 10%-90% signal levels. Frequency Domain Data Frequency domain parameters are helpful in evaluating the connector system s signal loss and crosstalk characteristics across a range of sinusoidal frequencies. In this report, parameters presented in the frequency domain are insertion loss, return loss, and near-end and far-end crosstalk. Other parameters or formats, such as VSWR or S- parameters, may be available upon request. Please contact our Signal Integrity Group at sig@samtec.com for more information. Frequency performance characteristics for the SUT are generated from time domain measurements using Fourier Transform calculations. Procedures and methods used in generating the SUT s frequency domain data are provided in the frequency domain test procedures in Appendix E of this report. Time Domain Data Time Domain parameters indicate impedance mismatch versus length, signal propagation time, and crosstalk in a pulsed signal environment. Time Domain data is provided in Appendix E of this report. Parameters or formats not included in this report may be available upon request. Please contact our Signal Integrity Group at sig@samtec.com for more information. Reference plane impedance is 50 ohms for single-ended measurements and 100 ohms for differential measurements. The fastest risetime signal exciting the SUT is 30 ± 5 picoseconds. In this report, propagation delay is defined as the signal propagation time through the PCB connector pads and connector pair. It does not include PCB traces. Delay is measured at 30 ± 5 picoseconds signal risetime. Delay is calculated as the difference in time measured between the 50% amplitude levels of the input and output pulses. Samtec, Inc Page:7 All Rights Reserved
11 Crosstalk or coupled noise data is provided for various signal configurations. All measurements are single disturber. Crosstalk is calculated as a ratio of the input line voltage to the coupled line voltage. The input line is sometimes described as the active or drive line. The coupled line is sometimes described as the quiet or victim line. Crosstalk ratio is tabulated in this report as a percentage. Measurements are made at both the nearend and far-end of the SUT. Data for other configurations may be available. Please contact our Signal Integrity Group at sig@samtec.com for further information. As a rule of thumb, 10% crosstalk levels are often used as a general first pass limit for determining acceptable interconnect performance. But modern system crosstalk tolerance can vary greatly. For advice on connector suitability for specific applications, please contact our Signal Integrity Group at sig@samtec.com. Additional information concerning test conditions and procedures is located in the appendices of this report. Further information may be obtained by contacting our Signal Integrity Group at sig@samtec.com. Samtec, Inc Page:8 All Rights Reserved
12 Appendix A Frequency Domain Response Graphs Single-Ended Application Insertion Loss 1 PCB/Connector Test System Single Ended Application CLP-02 / FTSH Insertion Loss (db) Single Ended Frequency (GHz) Single-Ended Application Return Loss 0 PCB/Connector Test System Single Ended Application CLP-02 / FTSH Return Loss (db) Single Ended Frequency (GHz) Samtec, Inc Page:9 All Rights Reserved
13 Single-Ended Application NEXT 0 PCB/Connector Test System Single Ended Application CLP-02 / FTSH Near-End Crosstalk (db) ACROSS ROW Worst Case Best Case Frequency (GHz) Single-Ended Application FEXT 0 PCB/Connector Test System Single Ended Application CLP-02 / FTSH Far-End Crosstalk (db) Worst Case ACROSS ROW Best Case Frequency (GHz) Samtec, Inc Page:10 All Rights Reserved
14 Differential Application Insertion Loss 1 PCB/Connector Test System Differential Application CLP-02 / FTSH Insertion Loss (db) Differential Frequency (GHz) Differential Application Return Loss 0 PCB/Connector Test System Differential Application CLP-02 / FTSH Return Loss (db) Differential Frequency (GHz) Samtec, Inc Page:11 All Rights Reserved
15 Differential Application NEXT 0 PCB/Connector Test System Differential Application CLP-02 / FTSH Near-End Crosstalk (db) Best Case Worst Case ACROSS ROW Frequency (GHz) Differential Application FEXT 0 PCB/Connector Test System Differential Application CLP-02 / FTSH Far-End Crosstalk (db) ACROSS ROW Best Case Worst Case Frequency (GHz) Samtec, Inc Page:12 All Rights Reserved
16 Appendix B Time Domain Response Graphs Single-Ended Application Input Pulse Samtec, Inc Page:13 All Rights Reserved
17 Single-Ended Application Impedance Single-Ended Application Propagation Delay Samtec, Inc Page:14 All Rights Reserved
18 Single-Ended Application NEXT, Worst Case In Row Configuration Single-Ended Application FEXT, Worst Case In Row Configuration Samtec, Inc Page:15 All Rights Reserved

19 Single-Ended Application NEXT, Best Case In Row Configuration Single-Ended Application FEXT, Best Case In Row Configuration Samtec, Inc Page:16 All Rights Reserved
20 Single-Ended Application NEXT, Across Row Configuration Single-Ended Application FEXT, Across Row Configuration Samtec, Inc Page:17 All Rights Reserved
21 Differential Application Input Pulse Samtec, Inc Page:18 All Rights Reserved
22 Differential Application Impedance Differential Application Propagation Delay Samtec, Inc Page:19 All Rights Reserved
23 Differential Application NEXT, Worst Case In Row Configuration Differential Application FEXT, Worst Case In Row Configuration Samtec, Inc Page:20 All Rights Reserved
24 Differential Application NEXT, Best Case In Row Configuration Differential Application FEXT, Best Case In Row Configuration Samtec, Inc Page:21 All Rights Reserved
25 Differential Application NEXT, Across Row Configuration Differential Application FEXT, Across Row Configuration Samtec, Inc Page:22 All Rights Reserved

26 Appendix C Product and Test System Descriptions Product Description Product samples are the micro low profile socket strip CLP L-D-A and CLP L-D-A. The mating FTSH terminal strips headers are P/N FTSH L-D-A and FTSH L-D-A respectively. When mated a 5.13mm (.202 ) stack height exists between PC boards Each connector structure consists of 2 rows of 15 or 25 surface mount terminal positions mounted into a plastic housing. The contacts are evenly spaced at a 1.27mm (.050 ) pitch. Test System Description The test fixtures are composed of a 4-layer FR-4 material with 50Ω and100ω signal trace and pad configurations designed for the electrical characterization of Samtec hispeed connector products. The pictured fixtures are specific to the CLP/FTSH surface mount series connector and are identified by Samtec P/N PCB TST-01 and P/N PCB TST-02 (Figure 1) Figure 1 Mated PCB Test Fixture with Mounted Test Connectors PCB TST-01 (Figure 1, bottom PCB) is designated as the test signal launch board and contains the two CLP socket series connectors. The 15 signals/row connector (right) is used in characterizing single ended (GSG) test signals and the 25 signals/row connector (left) is used to characterize differential test signals(gssg). PCB TST-02 provides the reference plane and/or calibration standards used in generating time delay and s-parameter information. Test fixture PCB TST-02 contains the mating FTSH terminal connectors (Figure 1, top pcb) and is the main signal Samtec, Inc Page:23 All Rights Reserved
27 monitoring section of the fixture. When the two board fixtures are mated the labeled probe points coordinate to create continuous electrical transmission paths between the signal launch pads and monitoring junctions. Both the single-ended and differential fixtures J number represents each signal terminal s designated position within the connector. Signals can also be launched from the terminal side of the connector but the response may not necessarily correlate with a socket side launch All data and waveforms presented in the report are results from a socket side signal launch. Table 8 below identifies the launch, monitoring and adjacent line termination points used in generating characterization data for this report. Table 8 PCB Fixture Characterization & Termination Matrix Single Ended Differential Launch Monitor 50Ω to Gnd. Termination Launch Monitor 100Ω Across Signal Pair Termination USE PCB TST-01 TST-02 TST-01 TST-02 TST-01 TST-02 TST-01 TST-02 IL, RL Z, PD J-7 J_7 J-3 J-8 J_3 J8 J43_45 J43-45 J38_40 J37_39 J37-38 J38-40 USE PCB TST-01 TST-01 TST-01 TST-02 TST-01 TST-01 TST-01 TST-02 NEXT(worst) J-25 J-23 J_23 J25 J9_11 J5_7 J5-7 J9-11 NEXT(best) J-7 J-3 J-8 J_3 J_7 J8 J43_45 J37_39 J38_40 J37-39 J38-40 J43-45 NEXT(xrow) J-7 J-8 J-3 J_3 J_7 J8 J38_40 J37_39 J43_45 J37-39 J38-40 J43-45 USE PCB TST-01 TST-02 TST-01 TST-02 TST-01 TST-02 TST-01 TST-02 FEXT(worst) J-25 J_23 J-23 J25 J9_11 J5-7 J5_7 J9-11 FEXT(best) J-7 J_3 J-3 J-8 J_7 J8 J43_45 J37-39 J37_39 J38_40 J43-45 J38-40 FEXT(xrow) J-7 J8 J-3 J-8 J_3 J_7 J38_40 J37-39 J43_45 J37_39 J38-40 J43-45 Samtec, Inc Page:24 All Rights Reserved

28 Signal Conditioning, Calibration Standards And Signal Launch/Monitoring Figure 2 represents the layout of the footprint, connector, and signal trace transitions where test signal configuration conditions can be determined. In general these GSG or GSSG conditions are spelled out in the characterization details section of the report. Be aware that the geometry or signal conditioning adjacent to active or monitored test points may have aggressive or response changing behaviors and should be terminated to the SUT s characteristic impedance as specified in Table 8. Figure 2 Signal Conditioning, Calibration Standards And Signal Launch/Monitoring Map Samtec, Inc Page:25 All Rights Reserved

29 Appendix D Test and Measurement Setup Test instruments are a Tektronix CSA8000 Communication Signal Analyzer Mainframe and the Agilent 8720ES Vector Network Analyzer. Four bays of the CSA8000 are occupied with three Tektronix 80E04 TDR/Sampling Heads and one Tektronix 80E03 Sampling Head. For this series of tests, four of the eight TDR/Sampling Head capability is used (Figure 3). The 8720ES serves as a supporting test instrument for verification or troubleshooting results obtained from the TDA Systems IConnect Software package. IConnect is a TDR based measurement software tool used in generating frequency domain related responses from high speed interconnects. The probe stations illuminated video microscopy system, microprobe positioners, and 40GHz capable probes provide both the mechanical properties and electrical characteristics for obtaining the precise signal launch and calibrations that are critical in obtaining accurate high speed measurements. The 450 micron pitch probes are located to PCB launch points with 25X to 175X magnification and XYZ fine positioning adjustments available from both the probe table and micro-probe positioners. Electrically the microwave probes rate a < 1.0 db insertion loss, a < 18 db return loss, and an isolation of 38 db to 40 GHz (Figure 4). Test cables and interconnect adapters are high quality and insure high-bandwidth and low parasitic measurements. Figure 3 Probe Station Measurements Capability Samtec, Inc Page:26 All Rights Reserved
 Probe Station 4 GTL Micro-Probe Positioners 2 Picoprobe by GGB Ind.")
30 Test Instruments QTY Description 1 Tektronix CSA8000 Communication Signal Analyzer 3 Tektronix 80E04 Dual Channel 20 GHz TDR Sampling Module 1 Tektronix 80E03 Dual Channel 20 GHz Sampling Module 2 Tektronix Meter Module Extender Measurement Station Accessories QTY Description 1 GigaTest Labs Model (GTL3030) Probe Station 4 GTL Micro-Probe Positioners 2 Picoprobe by GGB Ind. Model 40A GSG (single ended applications) 2 Picoprobe by GGB Ind. Dual Model 40A GSG-GSG (differential applications) 1 Keyence VH-5910 High Resolution Video Microscope 1 Keyence VH-W100 Fixed Magnification Lens 100 X 1 Keyence VH-Z25 Standard Zoom Lens 25X-175X Test Cables & Adapters QTY Description 4 Pasternack.086 Semi Rigid Cable Assembly 6 SMA Male to SMA Male 26.5 GHz 2 Huber-Suhner Cable Assembly 36 SMA Female to SMA Female 26.5 GHz (IL = GHz) 4 Pasternack Precision Adapters, 3.5 mm Male to 2.9(K) Male, Max.VSWR 34GHz Samtec, Inc Page:27 All Rights Reserved
31 Appendix E - Frequency and Time Domain Measurements It is important to note before gathering measurement data that TDA Systems IConnect measurements and CSA8000 measurements are virtually the same measurements with diverse formats. This means that the operator, being extremely aware, can obtain SI time and frequency characteristics in an almost simultaneous fashion. Since IConnect setup procedures are specific to the frequency information sought, it is mandatory that the sample preparation and CSA8000 functional setups be consistent throughout the waveform gathering process. If the operators test equipment permits recall sequencing between the various test parameter setups, it insures IConnect functional setups remain consistent with the TDR/TDT waveforms previously recorded. Related time and frequency test parameter data recorded for this report were gathered simultaneously. Frequency (S-Parameter) Domain Procedures Frequency data extraction involves two steps that first measure the frequency related time domain waveform followed by post-processing of the time domain waveforms into loss and crosstalk response parameters versus frequency. The first step utilizes the Tektronix CSA8000 time based instrument to capture frequency related single-ended or differential signal types propagating through an appropriately prepared SUT. The second step involves a correlation of the time based waveforms using the TDA Systems IConnect software tool to post-process these waveforms into frequency response parameters. TDA Systems labels these frequency related waveform relationships as the Step and DUT reference. This report establishes the setup procedures for defining the Step and DUT reference for frequency parameters of interest. Once established, the Step and DUT references are post-processed in IConnect s S-parameter computations window. CSA8000 Setup Listed below are the CSA 8000 functional menu setups used for single-ended and differential frequency response extractions. Both signal types utilize I-Connect software tools to generate S-parameter upper and lower frequency boundaries along with the step frequency. These frequency boundaries are determined by a time domain instruments functional settings such as window length, number of points and averaging capability. Once window length, number of points and averaging functions are set, maintain the same instrument settings throughout the extraction process. Samtec, Inc Page:28 All Rights Reserved
32 Single-Ended Signal Differential Signal Vertical Scale: 100 mv/ Div: 100 mv/ Div: Offset: Default / Scroll Default / Scroll Horizontal Scale: 1nSec/ Div = 20 MHz step frequency 1nSec/ Div = 20 MHz step frequency Max. Record Length: 4000 = Min. Resolution 4000 = Min. Resolution Averages: Insertion Loss SUT Preparation - For signal launch and monitoring path guidelines reference table 8. Terminate all the suggested active or adjacent signal lines at the impedance values recommended in the table. Signal trace locations and configurations can be verified using figure 2. Step Reference - Establish this waveform by making a TDT transmission measurement that includes all cables, adapters, and probes connected in the test systems transmission path. The transmission path is completed by inserting a negligible length of transmission standard between the microwave probes. (Note: Use the split-cal1 standard in TDT mode located on Samtec PCB TST-02 fixture). DUT Reference - Establish these waveforms by making an active TDT transmission measurement that includes all cables, adapters, and probes connected in the test systems transmission path. Insert the SUT between the probes in place of the transmission standard and record the measurement. Return Loss SUT Preparation For signal launch and monitoring path guidelines reference table 8. Terminate all the suggested active or adjacent signal lines at the impedance values recommended in the table. Signal trace locations and configurations can be verified using figure 2. Step Reference - Establish the waveform by making an active TDR reflection measurement that includes all cables, adapters, and probes connected in the test systems electrical path up to and including an open standard. (Note: Use split-cal1 standard in TDR mode located on Samtec PCB TST-02 fixture). DUT Reference Retain same signal paths and test setup used in obtaining insertion loss waveforms. Establish these waveforms by making a TDT (matched) reflection measurement that includes all cables, adapters, and probes connected in the test systems transmission path. For this condition the quality cables and adapters located on Samtec, Inc Page:29 All Rights Reserved
33 the far-end of the inserted SUT serves as the resistive load impedance closely matching the test system input impedance of 50Ω single-ended and100ω differential. Near-End Crosstalk (NEXT) SUT Preparation For signal launch and monitoring path guidelines reference table 8. Terminate all the suggested active or adjacent signal lines at the impedance values recommended in the table. Signal trace locations and configurations can be verified using figure 2. Step Reference - Establish these waveforms by making an active measurement that includes all cables, adapters, and probes connected in the test systems electrical path up to and including an open standard. (Note: Use split-cal1 standard in TDR mode located on Samtec PCB TST-02 fixture). DUT Reference - Establish these waveforms by driving the suggested signal line and monitoring the TDR coupled energy at the adjacent near-end signal line. Establish {6} measurement waveforms of worst case, best case and across row (xrow) coupling conditions for both signal types. Far-End Crosstalk (FEXT) SUT Preparation - For signal launch and monitoring path guidelines reference table 8. Terminate all the suggested active or adjacent signal lines at the impedance values recommended in the table. Signal trace locations and configurations can be verified using figure 2. Step Reference - Establish these waveforms by making a TDT transmission measurement that includes all cables, adapters, and probes connected in the test systems transmission path. The transmission path is completed by inserting a negligible length of transmission standard (Note: Use the split-cal1 standard in TDT mode located on Samtec PCB TST-02 fixture). DUT Reference - Establish these waveforms by driving the suggested signal line and monitoring the TDR coupled energy at the adjacent near-end signal line. Establish {6} measurement waveforms of worst case, best case and across row (xrow) coupling conditions for both signal types. Samtec, Inc Page:30 All Rights Reserved
34 Time Domain Procedures Measurements involving digital type pulses are performed utilizing either Time Domain Reflectometer (TDR) or Time Domain Transmission (TDT) methods. For this series of tests, TDR methods are employed for the impedance and propagation delay measurements. Crosstalk measurements utilize TDT methods. The Tektronix 80E04 TDR/ Sampling Head provide both the signaling type and sampling capability necessary to accurately and fully characterize the SUT. Impedance The signal line(s) of the SUT s signal configuration is energized with a TDR pulse. The far-end of the energized signal line is terminated in the test systems characteristic impedance (e.g.; 50Ω or 100Ω terminations). By terminating the adjacent signal lines in the test systems characteristic impedance, the effects on the resultant impedance shape of the waveform is limited. For signal launch and monitoring path guidelines reference table 8. Propagation Delay This connector series uses the fastest edge rate (30ps) of the TDR impedance waveform to measure propagation delay.. Differential or single ended signal delay is the measured difference of propagation between the known signal trace length delay (reference PCB TST-02 for each mated connectors referenced signal trace length). and the combined delay through the input signal traces and output signal traces of the mated SUT. The measurement is a one-way propagation result. Termination of the adjacent signal lines into the test systems characteristic impedance eliminate alternate current paths providing for better measurement accuracy. For signal launch and monitoring path guidelines reference table 8. Crosstalk An active pulsed waveform is transmitted through a selected SUT signal line. The adjacent quiet signal lines are monitored for the coupled energy at the near-end and far-end. Active and quiet lines not being monitored are terminated in the test systems characteristic impedance. Signal lines adjacent to the quiet lines remain terminated on both ends throughout the test sequence. Failing to terminate the active near or far end, quiet lines, or in some cases, signal lines adjacent to the quiet line may have an effect on amplitude and shape of the coupled energy. For signal launch and monitoring path guidelines reference table 8. Samtec, Inc Page:31 All Rights Reserved
35 Appendix F Glossary of Terms BC Best Case crosstalk configuration DP Differential Pair signal configuration DUT Device under test; TDA IConnect reference waveform FEXT Far-End Crosstalk GSG Ground Signal-Ground; geometric configuration NEXT Near-End Crosstalk PCB Printed Circuit Board SE Single-Ended SI Signal Integrity SUT System under test TDR Time Domain Reflectometry TDT Time Domain Transmission WC Worst Case crosstalk configuration Xrow se Cross ground/ power bar crosstalk, single-ended signal Xrow diff Cross ground/ power bar crosstalk, differential signal Z Impedance (expressed in ohms) Static (S) connector terminals with no connection to PCB ground Samtec, Inc Page:32 All Rights Reserved
High Speed Characterization Report
 TMMH-115-05-L-DV-A Mated With CLT-115-02-L-D-A Description: Micro Surface Mount, Board-to Board, 2.0mm (.0787 ) Pitch, 4.77mm (0.188 ) Stack Height Samtec, Inc. 2005 All Rights Reserved Table of Contents
High Speed Characterization Report
 QTE-020-02-L-D-A Mated With QSE-020-01-L-D-A Description: Parallel Board-to-Board, 0.8mm Pitch, 8mm (0.315 ) Stack Height Samtec, Inc. 2005 All Rights Reserved Table of Contents Connector Overview... 1
High Speed Characterization Report
 MEC1-150-02-L-D-RA1 Description: Mini Edge-Card Socket Right Angle Surface Mount, 1.0mm (.03937 ) Pitch Samtec, Inc. 2005 All Rights Reserved Table of Contents Connector Overview... 1 Connector System
High Speed Characterization Report. Contact Plating Effects on Signal Integrity Gold on Post / Gold on Tail vs. Gold on Post / Matte Tin on Tail
 Contact Plating Effects on Signal Integrity Gold on Post / Gold on Tail vs. Gold on Post / Matte Tin on Tail QTE-028-01-L-D-DP-A Mated With QSE-028-01-L-D-DP-A Description: Parallel Board-to-Board, Q Pair,
High Speed Characterization Report
 SSW-1XX-22-X-D-VS Mates with TSM-1XX-1-X-DV-X Description: Surface Mount Terminal Strip,.1 [2.54mm] Pitch, 13.59mm (.535 ) Stack Height Samtec, Inc. 25 All Rights Reserved Table of Contents Connector Overview...
High Speed Characterization Report
 QTH-030-01-L-D-A Mates with QSH-030-01-L-D-A Description: High Speed Ground Plane Header Board-to-Board, 0.5mm (.0197 ) Pitch, 5mm (.1969 ) Stack Height Samtec, Inc. 2005 All Rights Reserved Table of Contents
High Speed Characterization Report
 LSHM-150-06.0-L-DV-A Mates with LSHM-150-06.0-L-DV-A Description: High Speed Hermaphroditic Strip Vertical Surface Mount, 0.5mm (.0197") Centerline, 12.0mm Board-to-Board Stack Height Samtec, Inc. 2005
High Speed Characterization Report
 ERCD_020_XX_TTR_TED_1_D Mated with: ERF8-020-05.0-S-DV-L Description: 0.8mm Edge Rate High Speed Coax Cable Assembly Samtec, Inc. 2005 All Rights Reserved Table of Contents Cable Assembly Overview... 1
High Speed Characterization Report
 ESCA-XX-XX-XX.XX-1-3 Mated with: SEAF8-XX-05.0-X-XX-2-K SEAM8-XX-S02.0-X-XX-2-K Description: 0.80 mm SEARAY High-Speed/High-Density Array Cable Assembly, 34 AWG Samtec, Inc. 2005 All Rights Reserved Table
High Speed Characterization Report
 ECDP-16-XX-L1-L2-2-2 Mated with: HSEC8-125-XX-XX-DV-X-XX Description: High-Speed 85Ω Differential Edge Card Cable Assembly, 30 AWG ACCELERATE TM Twinax Cable Samtec, Inc. 2005 All Rights Reserved Table
High Speed Characterization Report
 PCRF-064-XXXX-EC-SMA-P-1 Mated with: PCIE-XXX-02-X-D-TH Description: PCI Express Cable Assembly, Low Loss Microwave Cable Samtec, Inc. 2005 All Rights Reserved Table of Contents Cable Assembly Overview...
High Speed Characterization Report
 HLCD-20-XX-TD-BD-2 Mated with: LSHM-120-XX.X-X-DV-A Description: 0.50 mm Razor Beam High Speed Hermaphroditic Coax Cable Assembly Samtec, Inc. 2005 All Rights Reserved Table of Contents Cable Assembly
High Speed Characterization Report
 PCIEC-XXX-XXXX-EC-EM-P Mated with: PCIE-XXX-02-X-D-TH Description: 1.00 mm PCI Express Internal Cable Assembly, 30 AWG Twinax Ribbon Cable Samtec, Inc. 2005 All Rights Reserved Table of Contents Cable
High Speed Characterization Report
 TCDL2-10-T-05.00-DP and TCDL2-10-T-10.00-DP Mated with: TMMH-110-04-X-DV and CLT-110-02-X-D Description: 2-mm Pitch Micro Flex Data Link Samtec, Inc. 2005 All Rights Reserved Table of Contents Introduction...1
High Data Rate Characterization Report
 High Data Rate Characterization Report ERDP-013-39.37-TTR-STL-1-D Mated with: ERF8-013-05.0-S-DV-DL-L and ERM8-013-05.0-S-DV-DS-L Description: Edge Rate Twin-Ax Cable Assembly, 0.8mm Pitch Samtec, Inc.
High Data Rate Characterization Report
 High Data Rate Characterization Report EQRF-020-1000-T-L-SMA-P-1 Mated with: QSE-xxx-01-x-D-A and SMA-J-P-x-ST-TH1 Description: Cable Assembly, High Speed Coax, 0.8 mm Pitch Samtec, Inc. 2005 All Rights
Report. Description: High Phone: Samtec Inc. New Albany. IN USA. All Rights Reserved
 Characterization Report SIBF-2X-F-S-AD Description: High Speed One Piecee Interface Board-to-Board, 1.27mm (.050 ) Pitch, 3mmm Stack Height Report Revision: 5/ /8/2013 Table of Contents Connector Overview...
High Data Rate Characterization Report
 High Data Rate Characterization Report EQCD-020-39.37-STR-TTL-1 EQCD-020-39.37-STR-TEU-2 Mated with: QTE-020-01-X-D-A and QSE-020-01-X-D-A Description: 0.8mm High-Speed Coax Cable Assembly Samtec, Inc.
High Speed Characterization Report
 PCRF-064-1000-SMA-P-1 Mated with: PCIE-XXX-02-X-D-TH and SMA-J-P-X-ST-TH1 Description: Cable Assembly, Low Loss Microwave Coax, PCI Express Breakout Samtec, Inc. 2005 All Rights Reserved Table of Contents
High Data Rate Characterization Report
 High Data Rate Characterization Report VPSTP-016-1000-01 Mated with: VRDPC-50-01-M-RA and VRDPC-50-01-M-RA Description: Plug Shielded Twisted Pair Cable Assembly, 0.8mm Pitch Samtec, Inc. 2005 All Rights
High Speed Characterization Report
 High Speed Characterization Report HDR-108449-01-HHSC HDR-108449-02-HHSC HDR-108449-03-HHSC HDR-108449-04-HHSC FILE: HDR108449-01-04-HHSC.pdf DATE: 03-29-04 Table of Contents Introduction. 1 Product Description.
High Speed Characterization Report MEC8-1XX-02-X-DV-A
 MEC8-1XX-02-X-DV-A Description: Mini Edge Card Vertical Socket, 0.8mm (0.0315") Pitch, Mates with 1.60mm (0.062'') thick cards WWW.SAMTEC.COM Table of Contents High Speed Connector Overview... 1 Connector
High Speed Characterization Report
 HDLSP-035-2.00 Mated with: HDI6-035-01-RA-TR/HDC-035-01 Description: High Density/High Speed IO Cable Assembly Samtec, Inc. 2005 All Rights Reserved Table of Contents Introduction...1 Product Description...1
High Speed Competitive Comparison Report. Samtec MMCX-J-P-H-ST-TH1 Mated With MMCX-P-P-H-ST-TH1 Competitor A (Mated Set) Competitor B (Mated Set)
 Competitor B (Mated Set)") High Speed Competitive Comparison Report Samtec MMCX-J-P-H-ST-TH1 Mated With MMCX-P-P-H-ST-TH1 Competitor A (Mated Set) Competitor B (Mated Set) REVISION DATE: January 6, 2005 TABLE OF CONTENTS Introduction...
High Speed Competitive Comparison Report Samtec MMCX-J-P-H-ST-TH1 Mated With MMCX-P-P-H-ST-TH1 Competitor A (Mated Set) Competitor B (Mated Set) REVISION DATE: January 6, 2005 TABLE OF CONTENTS Introduction...
High Speed Characterization Report
 High Speed Characterization Report MMCX-P-P-H-ST-TH1 mated with MMCX-J-P-H-ST-TH1 MMCX-P-P-H-ST-MT1 mated with MMCX-J-P-H-ST-MT1 MMCX-P-P-H-ST-SM1 mated with MMCX-J-P-H-ST-SM1 MMCX-P-P-H-ST-EM1 mated with
Validation Report Comparison of Eye Patterns Generated By Synopsys HSPICE and the Agilent PLTS
 Comparison of Eye Patterns Generated By Synopsys HSPICE and the Agilent PLTS Using: Final Inch Test/Eval Kit, Differential Pair - No Grounds Configuration, QTE-DP/QSE-DP, 5mm Stack Height (P/N FIK-QxE-04-01)
Shielding Effectiveness Report
 VRDPC-050-01-S-D-RA Mates with VPDP/VPLSP/VPSTP Description: Data Rate I/O Cable Assemblies Samtec, Inc. 2005 All Rights Reserved Table of Contents Product Overview... 1 Shielded Room Noise Floor Verification...
SPICE Model Validation Report
 HFEM-SE High Speed Flex Data Link Mated with: QTE-xxx-01-x-D-A QSE-xxx-01-x-D-A Description: Flex Data Link, High Speed, 0.8mm Pitch New Albany IN 47151-1147 USA SIG@samtec.com Report Revision: 9/13/2007
VHDM & VHDM-L Series. High Speed. Electrical Characterization
 VHDM & VHDM-L Series High Speed Electrical Characterization HDM, VHDM & VHDM-HSD are trademarks or registered trademarks of Teradyne, Inc. Date: 2/14/2003 SCOPE 1. The scope of this document is to define
High Speed Characterization Report
 SEAFP-XX-05.0-X-XX Mates with SEAMP-XX-02.0-X-XX Description: Open Pin Field Array, Press Fit, 1.27mm x 1.27mm Pitch 7 mm Stack Height WWW.SAMTEC.COM Table of Contents High Speed Connector Overview...
SIGNAL INTEGRITY ANALYSIS AND MODELING
 1.00mm Pitch BGA Socket Adapter System SIGNAL INTEGRITY ANALYSIS AND MODELING Rev. 2 www.advanced.com Signal Integrity Data Reporting At Advanced Interconnections Corporation, our Signal Integrity reporting
Shielding Effectiveness Report HQDP
 HQDP Mates with QSH-DP, QTH-DP Description: 0.50mm 100Ω Differential 30 AWG Twinax Cable Assembly Samtec, Inc. 2005 All Rights Reserved Table of Contents Product Overview... 1 Test Overview... 1 Shielded
Signal Integrity Tips and Techniques Using TDR, VNA and Modeling. Russ Kramer O.J. Danzy
 Signal Integrity Tips and Techniques Using TDR, VNA and Modeling Russ Kramer O.J. Danzy Simulation What is the Signal Integrity Challenge? Tx Rx Channel Asfiakhan Dreamstime.com - 3d People Communication
Aries Kapton CSP socket
 Aries Kapton CSP socket Measurement and Model Results prepared by Gert Hohenwarter 5/19/04 1 Table of Contents Table of Contents... 2 OBJECTIVE... 3 METHODOLOGY... 3 Test procedures... 4 Setup... 4 MEASUREMENTS...
Shielding Effectiveness Report HQCD
 HQCD Mates with QSH, QTH, QSH-EM Description: 0.50mm Q Strip High Speed Coax Cable Assembly Samtec, Inc. 2005 All Rights Reserved Table of Contents Product Overview... 1 Test Overview... 1 Shielded Room
High Speed Characterization Report
 SEAC-XXX-XX-XX.X-TU-TU-2 Mated with: SEAF-XX-05.0-X-XX-X-A-K-TR Description: 1.27 mm SEARAY High Speed High Density Array Cable Assembly, 32 AWG WWW.SAMTEC.COM Table of Contents High Speed Cable Assembly
Tektronix Inc. DisplayPort Standard. Revision Tektronix MOI for Cable Tests (DSA8200 based sampling instrument with IConnect software)
") DisplayPort Standard Revision 1.0 05-20-2008 DisplayPort Standard Tektronix MOI for Cable Tests (DSA8200 based sampling instrument with IConnect software) 1 Table of Contents: Modification Records... 4
DisplayPort Standard Revision 1.0 05-20-2008 DisplayPort Standard Tektronix MOI for Cable Tests (DSA8200 based sampling instrument with IConnect software) 1 Table of Contents: Modification Records... 4
Custom Interconnects Fuzz Button with Hardhat Test Socket/Interposer 1.00 mm pitch
 Custom Interconnects Fuzz Button with Hardhat Test Socket/Interposer 1.00 mm pitch Measurement and Model Results prepared by Gert Hohenwarter 12/14/2015 1 Table of Contents TABLE OF CONTENTS...2 OBJECTIVE...
T est POST OFFICE BOX 1927 CUPERTINO, CA TEL E P H ONE (408) FAX (408) ARIES ELECTRONICS
 FAX (408) ARIES ELECTRONICS") G iga T est L abs POST OFFICE BOX 1927 CUPERTINO, CA 95015 TEL E P H ONE (408) 524-2700 FAX (408) 524-2777 ARIES ELECTRONICS BGA SOCKET (0.80MM TEST CENTER PROBE CONTACT) Final Report Electrical Characterization
G iga T est L abs POST OFFICE BOX 1927 CUPERTINO, CA 95015 TEL E P H ONE (408) 524-2700 FAX (408) 524-2777 ARIES ELECTRONICS BGA SOCKET (0.80MM TEST CENTER PROBE CONTACT) Final Report Electrical Characterization
MICTOR. High-Speed Stacking Connector
 MICTOR High-Speed Stacking Connector Electrical Performance Report for the 0.260" (6.6-mm) Stack Height Connector.......... Connector With Typical Footprint................... Connector in a System Report
Keysight Technologies Signal Integrity Tips and Techniques Using TDR, VNA and Modeling
 Keysight Technologies Signal Integrity Tips and Techniques Using, VNA and Modeling Article Reprint This article first appeared in the March 216 edition of Microwave Journal. Reprinted with kind permission
High Speed Characterization Report
 Characterization SEAC-XXX-XX-XX.X-TU-TU Mated with: SEAF-XX-05.0-X-XX-X-A-K-TR Description: 1.27 mm SEARAY High Speed High Density Array Cable Assembly, 36 AWG WWW.SAMTEC.COM Table of Contents High Speed
Electrical Performance Report 85 ohm Reference Impedance
 ERM8-050-09.0-S-DV Mates with ERF8-050-07.0-S-DV Description: Edge Rate Strip Series, 0.8mm Centerline 16mm Stack Height Samtec, Inc. 2005 All Rights Reserved TABLE OF CONTENTS Connector Overview... 1
Characterization Methodology for High Density Microwave Fixtures. Dr. Brock J. LaMeres, Montana State University
 DesignCon 2008 Characterization Methodology for High Density Microwave Fixtures Dr. Brock J. LaMeres, Montana State University lameres@ece.montana.edu Brent Holcombe, Probing Technology, Inc brent.holcombe@probingtechnology.com
Optimization of Wafer Level Test Hardware using Signal Integrity Simulation
 June 7-10, 2009 San Diego, CA Optimization of Wafer Level Test Hardware using Signal Integrity Simulation Jason Mroczkowski Ryan Satrom Agenda Industry Drivers Wafer Scale Test Interface Simulation Simulation
Aries CSP microstrip socket Cycling test
 Aries CSP microstrip socket Cycling test RF Measurement Results prepared by Gert Hohenwarter 2/18/05 1 Table of Contents TABLE OF CONTENTS... 2 OBJECTIVE... 3 METHODOLOGY... 3 Test procedures... 6 Setup...
Aries QFP microstrip socket
 Aries QFP microstrip socket Measurement and Model Results prepared by Gert Hohenwarter 2/18/05 1 Table of Contents Table of Contents... 2 OBJECTIVE... 3 METHODOLOGY... 3 Test procedures... 4 Setup... 4
A Technical Discussion of TDR Techniques, S-parameters, RF Sockets, and Probing Techniques for High Speed Serial Data Designs
 A Technical Discussion of TDR Techniques, S-parameters, RF Sockets, and Probing Techniques for High Speed Serial Data Designs Presenter: Brian Shumaker DVT Solutions, LLC, 650-793-7083 b.shumaker@comcast.net
Aries Center probe CSP socket Cycling test
 Aries Center probe CSP socket Cycling test RF Measurement Results prepared by Gert Hohenwarter 10/27/04 1 Table of Contents TABLE OF CONTENTS... 2 OBJECTIVE... 3 METHODOLOGY... 3 Test procedures... 5 Setup...
RF Characterization Report
 SMA-J-P-H-ST-MT1 Mated with: RF316-01SP1-01BJ1-0305 Description: 50-Ω SMA Board Mount Jack, Mixed Technology Samtec, Inc. 2005 All Rights Reserved Table of Contents Introduction...1 Product Description...1
Aries Kapton CSP socket Cycling test
 Aries Kapton CSP socket Cycling test RF Measurement Results prepared by Gert Hohenwarter 10/21/04 1 Table of Contents TABLE OF CONTENTS... 2 OBJECTIVE... 3 METHODOLOGY... 3 Test procedures... 5 Setup...
Keysight Technologies Using the Time-Domain Reflectometer. Application Note S-Parameter Series
 Keysight Technologies Using the Time-Domain Reflectometer Application Note S-Parameter Series 02 Keysight S-parameter Series: Using the Time-Domain Reflectometer - Application Note Analysis of High-Speed
High Speed Digital Systems Require Advanced Probing Techniques for Logic Analyzer Debug
 JEDEX 2003 Memory Futures (Track 2) High Speed Digital Systems Require Advanced Probing Techniques for Logic Analyzer Debug Brock J. LaMeres Agilent Technologies Abstract Digital systems are turning out
Agilent Correlation between TDR oscilloscope and VNA generated time domain waveform
 Agilent Correlation between TDR oscilloscope and VNA generated time domain waveform Application Note Introduction Time domain analysis (TDA) is a common method for evaluating transmission lines and has
Logic Analyzer Probing Techniques for High-Speed Digital Systems
 DesignCon 2003 High-Performance System Design Conference Logic Analyzer Probing Techniques for High-Speed Digital Systems Brock J. LaMeres Agilent Technologies Abstract Digital systems are turning out
EQCD High Speed Characterization Summary
 EQCD High Speed Characterization Summary PRODUCT DESCRIPTION: A length of coaxial ribbon cable is terminated to a transition PCB break-out region onto which respective connectors are soldered. Three such
PCB Routing Guidelines for Signal Integrity and Power Integrity
 PCB Routing Guidelines for Signal Integrity and Power Integrity Presentation by Chris Heard Orange County chapter meeting November 18, 2015 1 Agenda Insertion Loss 101 PCB Design Guidelines For SI Simulation
The Challenges of Differential Bus Design
 The Challenges of Differential Bus Design February 20, 2002 presented by: Arthur Fraser TechKnowledge Page 1 Introduction Background Historically, differential interconnects were often twisted wire pairs
Bill Ham Martin Ogbuokiri. This clause specifies the electrical performance requirements for shielded and unshielded cables.
 098-219r2 Prepared by: Ed Armstrong Zane Daggett Bill Ham Martin Ogbuokiri Date: 07-24-98 Revised: 09-29-98 Revised again: 10-14-98 Revised again: 12-2-98 Revised again: 01-18-99 1. REQUIREMENTS FOR SPI-3
3M Shielded Controlled Impedance (SCI) Latch/Eject Header 2 mm Development Kit Instructions
 Latch/Eject Header 2 mm Development Kit Instructions") 3M Shielded Controlled Impedance (SCI) Latch/Eject Header 2 mm Development Kit Instructions Contents 1.0 Purpose....................................... 1 2.0 Development Kits..................................
3M Shielded Controlled Impedance (SCI) Latch/Eject Header 2 mm Development Kit Instructions Contents 1.0 Purpose....................................... 1 2.0 Development Kits..................................
LVDS Flow Through Evaluation Boards. LVDS47/48EVK Revision 1.0
 LVDS Flow Through Evaluation Boards LVDS47/48EVK Revision 1.0 January 2000 6.0.0 LVDS Flow Through Evaluation Boards 6.1.0 The Flow Through LVDS Evaluation Board The Flow Through LVDS Evaluation Board
FIBRE CHANNEL CONSORTIUM
 FIBRE CHANNEL CONSORTIUM FC-PI-2 Clause 9 Electrical Physical Layer Test Suite Version 0.21 Technical Document Last Updated: August 15, 2006 Fibre Channel Consortium Durham, NH 03824 Phone: +1-603-862-0701
Measuring Hot TDR and Eye Diagrams with an Vector Network Analyzer?
 Measuring Hot TDR and Eye Diagrams with an Vector Network Analyzer? Gustaaf Sutorius Application Engineer Agilent Technologies gustaaf_sutorius@agilent.com Page 1 #TDR fit in Typical Digital Development
Design and experimental realization of the chirped microstrip line
 Chapter 4 Design and experimental realization of the chirped microstrip line 4.1. Introduction In chapter 2 it has been shown that by using a microstrip line, uniform insertion losses A 0 (ω) and linear
Agilent E2695A SMA Probe Head for InfiniiMax 1130 Series Active Oscilloscope Probes. User s Guide
 User s Guide Publication Number E2695-92000 June 2003 Copyright Agilent Technologies 2003 All Rights Reserved. Agilent E2695A SMA Probe Head for InfiniiMax 1130 Series Active Oscilloscope Probes Agilent
Probing Techniques for Signal Performance Measurements in High Data Rate Testing
 Probing Techniques for Signal Performance Measurements in High Data Rate Testing K. Helmreich, A. Lechner Advantest Test Engineering Solutions GmbH Contents: 1 Introduction: High Data Rate Testing 2 Signal
The data rates of today s highspeed
 HIGH PERFORMANCE Measure specific parameters of an IEEE 1394 interface with Time Domain Reflectometry. Michael J. Resso, Hewlett-Packard and Michael Lee, Zayante Evaluating Signal Integrity of IEEE 1394
Advanced Signal Integrity Measurements of High- Speed Differential Channels
 Advanced Signal Integrity Measurements of High- Speed Differential Channels September 2004 presented by: Mike Resso Greg LeCheminant Copyright 2004 Agilent Technologies, Inc. What We Will Discuss Today
Keysight MOI for USB Type-C Connectors & Cable Assemblies Compliance Tests (Type-C to Legacy Cable Assemblies)
") Revision 01.01 Jan-21, 2016 Universal Serial Bus Type-C TM Specification Revision 1.1 Keysight Method of Implementation (MOI) for USB Type-C TM Connectors and Cables Assemblies Compliance Tests Using Keysight
Revision 01.01 Jan-21, 2016 Universal Serial Bus Type-C TM Specification Revision 1.1 Keysight Method of Implementation (MOI) for USB Type-C TM Connectors and Cables Assemblies Compliance Tests Using Keysight
Taking the Mystery out of Signal Integrity
 Slide - 1 Jan 2002 Taking the Mystery out of Signal Integrity Dr. Eric Bogatin, CTO, GigaTest Labs Signal Integrity Engineering and Training 134 S. Wolfe Rd Sunnyvale, CA 94086 408-524-2700 www.gigatest.com
PRODUCT SPECIFICATION
 ipass TM 0.8 mm PITCH I/O CONNECTOR REVISION: ECR/ECN INFORMATION: EC No: UCP200-137 DATE: 200 / 02 / 08 TITLE: 1 of 14 TABLE OF CONTENTS 1.0 SCOPE 3 2.0 PRODUCT DESCRIPTION 3 2.1 PRODUCT NAME AND SERIES
DP Array DPAM/DPAF Final Inch Designs in Serial ATA Generation 1 Applications 10mm Stack Height. REVISION DATE: January 11, 2005
 Application Note DP Array DPAM/DPAF Final Inch Designs in Serial ATA Generation 1 Applications 10mm Stack Height REVISION DATE: January 11, 2005 Copyrights and Trademarks Copyright 2005 Samtec, Inc. Developed
Microwave Metrology -ECE 684 Spring Lab Exercise T: TRL Calibration and Probe-Based Measurement
 ab Exercise T: TR Calibration and Probe-Based Measurement In this project, you will measure the full phase and magnitude S parameters of several surface mounted components. You will then develop circuit
Samtec MODS-LJ Series (LIFEJACK ) Category 5/5e Qualification
 Category 5/5e Qualification") Samtec MODS-LJ Series (LIFEJACK ) Category 5/5e Qualification J. Ferry, C. Arroyo Copyright 2008 Samtec, Inc Page 1 Summary LIFEJACK met or exceeded TIA/EIA-568-B.2-2001 Category 5e requirements for Insertion
Samtec MODS-LJ Series (LIFEJACK ) Category 5/5e Qualification J. Ferry, C. Arroyo Copyright 2008 Samtec, Inc Page 1 Summary LIFEJACK met or exceeded TIA/EIA-568-B.2-2001 Category 5e requirements for Insertion
Limitations And Accuracies Of Time And Frequency Domain Analysis Of Physical Layer Devices
 Limitations And Accuracies Of Time And Frequency Domain Analysis Of Physical Layer Devices Outline Short Overview Fundamental Differences between TDR & Instruments Calibration & Normalization Measurement
LoopBack Relay. GLB363 Series. With Built-in AC Bypass Capacitors / DC LoopBack Relay
 GLB363 Series With Built-in AC Bypass Capacitors / DC SERIES DESIGNATION GLB363 RELAY TYPE, Sensitive Coil, Surface Mount Ground Shield and Stub pins with AC Bypass Capacitors or No capacitor DESCRIPTION
Demystifying Vias in High-Speed PCB Design
 Demystifying Vias in High-Speed PCB Design Keysight HSD Seminar Mastering SI & PI Design db(s21) E H What is Via? Vertical Interconnect Access (VIA) An electrical connection between layers to pass a signal
Validation & Analysis of Complex Serial Bus Link Models
 Validation & Analysis of Complex Serial Bus Link Models Version 1.0 John Pickerd, Tektronix, Inc John.J.Pickerd@Tek.com 503-627-5122 Kan Tan, Tektronix, Inc Kan.Tan@Tektronix.com 503-627-2049 Abstract
Keysight MOI for USB Type-C Connectors & Cable Assemblies Compliance Tests (Type-C to Legacy Cable Assemblies)
") Revision 01.00 Nov-24, 2015 Universal Serial Bus Type-C TM Specification Revision 1.1 Keysight Method of Implementation (MOI) for USB Type-C TM Connectors and Cables Assemblies Compliance Tests Using Keysight
Revision 01.00 Nov-24, 2015 Universal Serial Bus Type-C TM Specification Revision 1.1 Keysight Method of Implementation (MOI) for USB Type-C TM Connectors and Cables Assemblies Compliance Tests Using Keysight
RiseUp RU8-DP-DV Series 19mm Stack Height Final Inch Designs in Serial ATA Generation 1 Applications. Revision Date: March 18, 2005
 RiseUp RU8-DP-DV Series 19mm Stack Height Final Inch Designs in Serial ATA Generation 1 Applications Revision Date: March 18, 2005 Copyrights and Trademarks Copyright 2005 Samtec, Inc. Developed in conjunction
Test ID 5-15 Utility Line Impedance Test Procedures Guide
 Test ID 5-15 Utility Line Impedance Test Procedures Guide Revision 1.1 Tektronix October 13, 2010 Page 2 of 18 Equipment Required Table 1 lists the equipment required to perform the Utility Line Impedance
Signal Integrity Testing with a Vector Network Analyzer. Neil Jarvis Applications Engineer
 Signal Integrity Testing with a Vector Network Analyzer Neil Jarvis Applications Engineer 1 Agenda RF Connectors A significant factor in repeatability and accuracy Selecting the best of several types for
Introduction to On-Wafer Characterization at Microwave Frequencies
 Introduction to On-Wafer Characterization at Microwave Frequencies Chinh Doan Graduate Student University of California, Berkeley Introduction to On-Wafer Characterization at Microwave Frequencies Dr.
AUTOMOTIVE ETHERNET CONSORTIUM
 AUTOMOTIVE ETHERNET CONSORTIUM Clause 96 100BASE-T1 Physical Medium Attachment Test Suite Version 1.0 Technical Document Last Updated: March 9, 2016 Automotive Ethernet Consortium 21 Madbury Rd, Suite
Probe Card Characterization in Time and Frequency Domain
 Gert Hohenwarter GateWave Northern, Inc. Probe Card Characterization in Time and Frequency Domain Company Logo 2007 San Diego, CA USA Objectives Illuminate differences between Time Domain (TD) and Frequency
Q2 QMS-DP/QFS-DP Series 11 mm Stack Height Final Inch Designs in Serial ATA Generation 1 Applications. Revision Date: February 22, 2005
 Q2 QMS-DP/QFS-DP Series 11 mm Stack Height Final Inch Designs in Serial ATA Generation 1 Applications Revision Date: February 22, 2005 Copyrights and Trademarks Copyright 2005 Samtec, Inc. Developed in
How to anticipate Signal Integrity Issues: Improve my Channel Simulation by using Electromagnetic based model
 How to anticipate Signal Integrity Issues: Improve my Channel Simulation by using Electromagnetic based model HSD Strategic Intent Provide the industry s premier HSD EDA software. Integration of premier
EE290C - Spring 2004 Advanced Topics in Circuit Design
 EE290C - Spring 2004 Advanced Topics in Circuit Design Lecture #3 Measurements with VNA and TDR Ben Chia Tu-Th 4 5:30pm 531 Cory Agenda Relationships between time domain and frequency domain TDR Time Domain
Circuit Characterization with the Agilent 8714 VNA
 Circuit Characterization with the Agilent 8714 VNA By: Larry Dunleavy Wireless and Microwave Instruments University of South Florida Objectives 1) To examine the concepts of reflection, phase shift, attenuation,
Application Note. Signal Integrity Modeling. SCSI Connector and Cable Modeling from TDR Measurements
 Application Note SCSI Connector and Cable Modeling from TDR Measurements Signal Integrity Modeling SCSI Connector and Cable Modeling from TDR Measurements Dima Smolyansky TDA Systems, Inc. http://www.tdasystems.com
QPairs QTE-DP/QSE-DP Final Inch Designs in Serial ATA Generation 1 Applications 5mm Stack Height. REVISION DATE: January 12, 2005
 Application Note QPairs QTE-DP/QSE-DP Final Inch Designs in Serial ATA Generation 1 Applications 5mm Stack Height REVISION DATE: January 12, 2005 Copyrights and Trademarks Copyright 2005 Samtec, Inc. Developed
PRODUCT SPECIFICATION
 i TM / i+ TM 0.8 mm PITCH I/O CONNECTOR SYSTEM of TABLE OF CONTENTS.0 SCOPE... 3.0 PRODUCT DESCRIPTION... 3. PRODUCT NAME AND SERIES NUMBER(S)... 3. DIMENSION, MATERIALS, PLATING AND MARKINGS... 3.3 SAFETY
Application Note 5525
 Using the Wafer Scale Packaged Detector in 2 to 6 GHz Applications Application Note 5525 Introduction The is a broadband directional coupler with integrated temperature compensated detector designed for
Measuring PCB, Cable and Interconnect Impedance, Dielectric Constants, Velocity Factor, and Lengths
 Measuring PCB, Cable and Interconnect Impedance, Dielectric Constants, Velocity Factor, and Lengths Controlled impedance printed circuit boards (PCBs) often include a measurement coupon, which typically
PRELIMINARY PRELIMINARY
 Impedance Discontinuities of Right Angle Bends 90 degree, chamfered, and radial Augusto Panella Molex Incorporated Scott McMorrow SiQual, Inc. Introduction The results presented below are a portion of
Challenges and Solutions for Removing Fixture Effects in Multi-port Measurements
 DesignCon 2008 Challenges and Solutions for Removing Fixture Effects in Multi-port Measurements Robert Schaefer, Agilent Technologies schaefer-public@agilent.com Abstract As data rates continue to rise
CONNECTING THE PROBE TO THE TEST INSTRUMENT
 2SHUDWLRQ 2SHUDWLRQ Caution The input circuits in the AP034 Active Differential Probe incorporate components that protect the probe from damage resulting from electrostatic discharge (ESD). Keep in mind
Characterizing Non-Standard Impedance Channels with 50 Ohm Instruments
 Characterizing Non-Standard Impedance Channels with 50 Ohm Instruments Julian Ferry, Jim Nadolny, Craig Rapp: Samtec Inc. Mike Resso, O.J. Danzy: Agilent Technologies Introduction Emerging systems are
University of New Hampshire InterOperability Laboratory Gigabit Ethernet Consortium
 University of New Hampshire InterOperability Laboratory Gigabit Ethernet Consortium As of June 18 th, 2003 the Gigabit Ethernet Consortium Clause 40 Physical Medium Attachment Conformance Test Suite Version
Agilent Technologies High-Definition Multimedia
 Agilent Technologies High-Definition Multimedia Interface (HDMI) Cable Assembly Compliance Test Test Solution Overview Using the Agilent E5071C ENA Option TDR Last Update 013/08/1 (TH) Purpose This slide