Chapter 8. Ultrasound Medical Diagnostic Instrumentation PART-I
|
|
|
- Cameron Stevens
- 5 years ago
- Views:
Transcription
1 Chapter 8 Ultrasound Medical Diagnostic Instrumentation PART-I ULTRASONAGRAPHY Ultrasonography is a technique by which ultrasonic energy is used to detect internal body organs. Bursts of ultrasound energy is transmitted from a transducer through the skin and into the internal anatomy. When the ultrasound energy strikes an interface between two tissues of different acoustical impedance, reflections are returned to the transducer. The transducer converts these reflections to an electrical signal. This electrical signal is amplified and displayed on an oscilloscope, each tissue interface appearing as a vertical deflection along the base line of the oscilloscope at a distance proportional to the depth of the interface. This ultrasonic technique is similar to the time domain reflectometry technique used to measure electrical cable length and the sonar technique used to detect objects under water. While the use of pulse-echo ultrasonic energy is somewhat similar to the use of X-ray, the results obtained differ from an X-ray picture, being a cross sectional projection or simply a linear projection rather than a profile of the area examined. ADVANTAGES OF ULTRASONOGRAPHY Also, in contrast to the X-ray, ultrasonography uses mechanical energy at a level which is not harmful to human tissue. Thus, it may be used with safety on pregnant subjects and for frequent examination. It can detect materials that are not radio-opaque, thus angiographic dyes are unnecessary. As commercial ultrasonic diagnostic instruments are easy to operate, ultrasonography is rapidly becoming a valuable technique. Among the applications of Ultrasound, medical diagnostics has been a very useful target area, which has been providing enormous scope for development during the past fifteen years. Today B-scan ultrasound machines are available with good imaging and Doppler flow measurement capabilities. Much of the work on the transducer part of the instrument is based on advanced sophisticated techniques of fabrication of the thin discs of transducer elements. Improved transducer arrays, linear and sector-scan multi element construction, possibility of varying the aperture, focusing and beam forming over two or three ranges of depths and signal detection on multiple elements with electronic delay elements are some of the contributions done recently. Further, high level signal processing and scan conversion have been incorporated into the machine using 253
2 254 A TEXTBOOK OF MEDICAL INSTRUMENTS fast digital processing methods with the present day high speed DSP hardware. With all these improvements, today s B-scan machine is somewhat clear in giving the images of internal organs better than before. Additionally, today s ultrasound technique also resorts to using the Doppler technique for combined information in the case of blood flow measurements particularly in echo-cardiography. While the basic function of ultrasonic diagnostic equipment is to measure distances between interfaces that separate body structures by timing the echoes produced by these interfaces, this timed echo information may be processed in various ways to produce different forms of display. The technique is often referred as pulse echo method. In this, the three commonly used display modes are employed: A-scan mode B-scan mode T-M-mode The simplest of all the above three types is the A scan, which does not actually produce an image in the usual sense of the word. By transmitting a short pulse of sound into an object and then recording the echoes as a function of time, one can determine both its range and size information about the scattering centers in the object. In this mode (Fig. 8.1.), one transmits pulses on a periodic basis into an object, and synchronizes an oscilloscope to the transmitted burst. The echoes will appear on the screen. The horizontal axis will yield range while the vertical axis yield echo amplitude. Because A scan trace gives only an one-dimensional spatial information, it is not traditionally thought of as an image. However, by combining the A scan concept with careful raster movement, one can generate two dimensional spatial information and obtain a terrace that is suitably termed as image. The block diagram of A scan Instrument is shown in Fig A scan Ultrasonography displays the amplified echo signal on the vertical channel of an oscilloscope with the horizontal channel being deflected by a conventional sweep generator. This sweep generator is triggered form the impulse signal and the time delay between the beginning of the sweep and the echo appearing on the CRT screen is proportional to tissue depth. A conventional sweep generator may be used for this purpose; otherwise, a sweep generator which is specifically calibrated in tissue depth (centimeters) rather than in time per division. A sweep speed of 100 µs per division would correspond to approximately 6.25 cm of tissue per division. Faster sweep speeds would give correspondingly greater resolution. The fastest usable sweep speed would probably be 2 µs per division which would correspond to 1.25 millimeters of tissue per division. This faster sweep speed would only be usable with 10MHz transducers. The most common usage of A scan ultrasonography is echo Echoencephalography. It detects brain midline position and possible displacement of this midline due to an abnormal space occupying mass within one side of the skull, such as a tumor. When performing an A scan with the transducer held against the side of the subjects s head, echos are received form the two halves of the brain as shown in figure-8.1b. The echo produced by the midline is termed the M echo and should be symmetrically placed between the echoes received from each side of the subject s skull. Two decades ago, A-scan of the skull was performed in diagnosing brain injuries in accidents in Neurology Clinics by noting the mid line shift. Today, it is done by CT and MRI scans very much better.
 per Div Fig. 8.1. (a) A-scan mode for finding the echo and showing a time plot. (b) A scan of brain tumor in echo encephalography.")
 provide two dimensional cross section image of the object that is scanned.")
. This scanning system provides signals proportional to the position and direction of the probe.")
3 ULTRASOUND MEDICAL DIAGNOSTIC INSTRUMENTATION 255 Transducer Brain Brain Brain Midline A typical instrument configuration 50 ms/div for A scan ultrasonic diagnosis = 3.1 cm tissue (Picker X-ray) per Div Fig (a) A-scan mode for finding the echo and showing a time plot. (b) A scan of brain tumor in echo encephalography. B-SCAN The B-Scan ultrasound technique is one that has become a versatile diagnostic tool and has been developed over the past two decades considerably. B-scanning (brightness mode scanning) provide two dimensional cross section image of the object that is scanned. In this mode, the echo signal is connected to the Z-axis (brightness modulating cathode) of a monitor to provide intensification, while the X and Y directional signals are derived from a mechanical scanning systems. (presently electronic scanning systems are employed). This scanning system provides signals proportional to the position and direction of the probe. The resulting picture gives a two - dimensional cross sectional presentation of part of the subject. As seen in Fig. 8.2a, with a transducer placed in each Internal organ Section through subject Transducer scanned across subject. Six instantaneous positions shown. X-Y scan intensified by transducer output. Each of the six instantaneous positions produce three intensified areas. These intensified are recorded on a scan-converter and linkage of the DOT produces an outline of the internal organ. Fig (a) Shows the Principle of B-scan image formation. (b) Shows the block diagram of B-scanner with scan converter unit.
4 256 A TEXTBOOK OF MEDICAL INSTRUMENTS of the six positions as shown, a series of intensified areas appear on the CRT scan view, where only six brightness dots would appear, but the transducer is slowly turned over the object and is producing repetitive echo patterns at a 500Hz rate; so the display appears continuous instead of several dots, as informally presumed. Since the transducer is pulsed repeatedly at 500 Hz while collecting the echo signals simultaneously with the movement the image appears as a steady pattern giving details of reflective objects inside the region of observation. PRF generator Pulse generator TGC generator R.F. amplifier Demodulator Video amplifier Coordinate generator Scan converter Video monitor Probe position and angle sensor Probe Transducer lead The principle of B-scan image formation is given in Fig. 8.2a. ULTRASOUND SCANNING MECHANICAL X-Y SCAN Ultrasound has been an useful tool for investigation in various fields in medicine, nondestructive testing and also in defence applications. Using ultrasound had its starting from the year 1930 and has grown over these 70 years. Piezo electric transducers are suitable for such applications. The operation of transducer at its resonance frequency produces an intense outgoing acoustical beam. Initially this work was applied in the field of oceanic research. Ultrasonography using the B mode technique is referred to as ultrasonic scanning. In this mode, the echo signal is connected to the Z -axis of a monitor to provide intensification as in the Time-Motion mode. However, the X and Y monitor input signals were derived from a
5 ULTRASOUND MEDICAL DIAGNOSTIC INSTRUMENTATION 257 mechanical scanning system (in early machines - today, by electronic scanning) and provide signals proportional to the position and direction of the probe to form part of a physical picture of the organs being examined. The result obtained is a two dimensional, cross- sectional presentation of part of the subject. Generally, the same transducer is used both to send and receive the acoustic signals. An electronic pulse excites a transducer, so that a short burst of ultrasound is generated. Acoustic signals reflected from objects in the acoustic path impinge on the transducer, are converted to electronic signals and processed for display (Fig. 8.2a). A fundamental feature of a B-scan is that one of the dimensions is inferred from the arrival time of echoes of a short acoustic pulse as they reflect from structures along a straight line path. Signals received form structures close to the transducer arrive earlier than signals received from structures far from it. The other (transverse) dimension is obtained by moving the transducer (either physically or by mechanical means or apparently by physical means) so that, a different straight line path is continued until the entire object in the region of interest is scanned. Some means of tracking the propagation through the object is required in order to define the image. It is common practice to increase the amplifier gain for further echoes in order to partially compensate for the attenuation. This is known as time gain compensation (TGC). The position and angular direction of the ultrasound beam are determined by position monitoring. This keeps a position reference for the image signals to be displayed. As the echoes are received by the transducer, they are amplified, rectified and filtered. The resulting signal is used to modulate the brightness of display. The early B-scan CT monitor used in conjunction with ultrasonic receiving systems was a bistable display type with a spot that was either on or off. A threshold control allowed the user to vary the value of a critical signal level above which all received echoes were shown as spots. With such a display, the resulting images were highly dependant on the threshold control and repeatability of images was difficult to achieve. In addition, since little more than contours were displayed, any interpretation of the images was subjective. In 1976, a digital B-scan converter based on microcomputer was first developed. This System was capable of completing a single echogram in less than 15 seconds. The display had a raster density of either or pixels. This may be compared with the present day scanner resolution whose pixel sizes far exceed this. Today, it is common to find CRT with a grid size of pixels and shades of gray levels. Today s scanners, offer flicker free operation, increased reliability and also offer capabilities for image processing by gray level adjustment. Even portable types of B-scanners offer somewhat similar capabilities. Time gain compensation is provided for the usual signals at large distances. This is a method of increasing the gain of the preamplifier with time and is set by a knob control or keypad control by the instrument user. Additionally a threshold control enables elimination of weak signals or reflections to improve contrast or detail of the imaging. Today s machines do not employ any manual articulation of the transducer over the region in order to do the scanning. Earlier instruments ten years ago employed position encoders. Today, scanning is accomplished by two methods: 1. Linear array transducer scanning 2. Sector scanning These two types of transducer are generally as shown in Fig. 8.3.
6 258 A TEXTBOOK OF MEDICAL INSTRUMENTS Line 3 Line 2 Line 1 Aperture Highly flexible cable Electromachanic motor Beam axis Beam axis Piazoelectric crystal Point of rotation Linear sequenced array Linear phased array Coupling interface Fig Shows the Linear array and sector scan transducers. The former employs an electronic method of scanning by exciting the various elements of the linear array in a phased manner so as to sweep the beam profile over the area under view. The latter has rotation (60 90 ) mechanically performed inside an oil filled probe enclosure so as to vary the field of insonation and thus provide a scanning effect. Presently, the mechanical types have been almost replaced by the sonar beam-formed linear phased array transducers. Sonar beam forming is a method of adjusting the delays between adjacent lines in pulsing, so that the beam divergence is reduced. A scan converter is the early machines was built of memory elements inside the C.R.T. The first digital scan converter was introduced by J. Ophir. Today digital signal storage and software enables fast scan conversion so as to view the image in the standard video format of 50 Hz frame sync, through actual scanning could take place at a much slower rate. ULTRASONIC SYSTEMS Ultrasonic energy for use in Ultrasonography is produced by exciting a piezoelectric crystal referred to as the ultrasonic transducer. These piezoelectric crystals normally have a self-resonant frequency of between 1 MHz and 10MHz; the most common types used for ultrasonography are having a self resonant frequency and produce a train of damped oscillations. Fig. 8.4a shows the input pulse used to excite a 2.5 MHz transducer and a reflected pulse detected by the same transducer. The amplitude of the input pulse of 200 volts with duration of 1 µ second. The transducer oscillates at 2.5 MHz, the damping factor being dependent on the transducer design and on the type of tissue in the transducer s path. As this transmitted damped oscillation reaches an interface between materials having different acoustical impedances, a reflection or echo is produced. By the time this echo has returned to the transducer, the transducer is passive and is then again excited by vibrations produced by this returning echo. This echo signal is then amplified and processed in a logarithmic amplifier and an envelope detector. This process is repeated at an approximate rate of 500 Hz. The time between the generation of the transducer exciting pulse and the detection of the received echo represents the time taken for the ultrasonic energy to travel form the transducer, to the interface, and thence from the interface back to the transducer. The velocity of sound waves, and thus of ultrasonic energy, in body tissue is about centimeters per microsecond. It is rarely necessary to know this velocity accurately as relative interface distances are more important
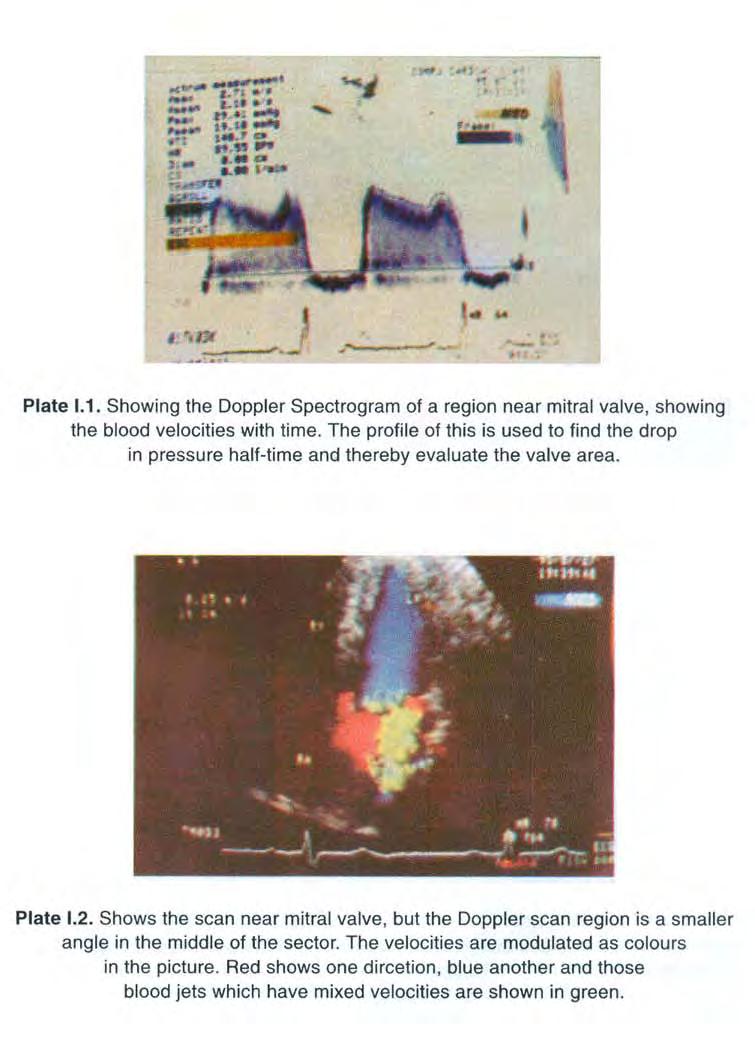
7 ULTRASOUND MEDICAL DIAGNOSTIC INSTRUMENTATION 259 than actual interface distance. If these actual distances are required, the system can be calibrated against a known tissue interface distance. Plate I.1. shows the block diagram of the Ultrasonic Diagnostic system. Fig Echo signal generation and block diagrams (T-M Mode and A-S Can) Plate I.2. shows the usual spectrogram display for a material valve insonation. The curves are drawn by operator to evaluate pressure halftime and thence valve area. DEPTH VERSUS RESOLUTION Depth and resolution of the system depend on the crystal s resonant frequency. A 1 MHz crystal provides low resolution; however, reflections can be detected for tissue 50 centimeters from the transducer. The commonly used 2.5 MHz crystal can be used to at least 20 cm; whereas a 10 MHz crystal provides excellent resolution, however, it can not be used above about 5 cm. Relating distance to velocity, a tissue interface 5cm from the transducer will produce a reflection 80 µs after the impulse. TRANSDUCER TISSUE-COUPLING It is important that the transducer be firmly held against the tissue (skin) as any air in the transducer s path will severely attenuate the ultrasonic energy. A sufficient transducer/tissue coupling is more important and this can be assured by using a liquid coupler such as water. In certain ultrasonic scanning systems it is impossible to locate the transducer against the tissue and a substantial depth of water is used as a coupling medium.
8 260 A TEXTBOOK OF MEDICAL INSTRUMENTS PROBES FOR ULTRASOUND A simple probe which has transmitter and receiver as separate parts as two semicircular discs was common in the early day ultrasound Doppler investigations. (This is even today in use in portable continuous wave Doppler vascular blood examination units). Today the transducer is a multi element array or group of such elements housed in an enclosure with oil filling. The basic properties of ultrasound are to be well understood if one has to infer the details of an ultrasound image properly. Unlike a light image the ultrasound image is poor in its resolution because of the problem of beam divergence. Linear transducer provides better lateral resolution at shorter distances. Frequency is a parameter, which also decides the resolution, higher frequencies limit their usefulness to short depths only. Usually for abdominal and general examinations the 3.5 MHz probe is useful. Special probes with small size are useful for endoscopic examinations. These ultrasound transducers generally have about 5 to 6 times better resolution in the axial than the lateral direction, mainly because of the large beam width in the ultrasound. Beam width depends on focusing as well as distance of the object from it. Axial Resolution and Lateral Resolution Fig. 8.5 gives the two definitions of resolutions which relate to (1) Axial and (2) Lateral as shown. Axial Resolution Lateral Resolution Fig Shows the two definitions of resolution which relate to (1) Axial and (2) Lateral as shown.
9 ULTRASOUND MEDICAL DIAGNOSTIC INSTRUMENTATION 261 Fine transducer elements of small width can provide a good lateral resolution but still this resolution ratio is not altered anyway. So all images in Ultrasound have very poor lateral resolution and even today the instruments costing several tens of lakhs do not have any improvement in this part incorporated into them because this is a basic problem of ultrasound imaging. As the AED (active aperture diameter) increases, beam width increases but width of the beam and also the region or zone of maximum sensitivity, allowing the transducer to the optimized for an application. Fig. 8.6 shows the Schematic illustration of an ultrasonic field, divided into three zones. By a curved surface the focusing improves, so a facing material has to be applied to make it flat for contacting (Fig. 8.7a). Different foci can be had by changing the diameter (Fig. 8.7b). Further to this, multiple matching layers can also be considered. Near region Ultrasonic transducer Lateral cross-section through the ultrasonic field Focal region Far region Lateral Spreading of an ultrasonic pulse Axial Fig Shows the Schematic illustration of an ultrasonic field, divided into three zones. Backing Epoxy face Peizoelecting ceramic Internal Focusing 4 m Focal zone 5 MHz 6 mm AED Short Focus 4 m Focal zone Backing Epoxy lens (face) Peizoelecting ceramic External Focusing 3.5 MHz 13 mm AED Long Focus 4 m Focal zone 3.5 MHz 19 mm AED Long Focus Backing W.A. Face Peizoelecting ceramic (a) Quarter Wave Length Focusing (b) Fig (a) showing a curvature of transducer surface, (b) Different foci obtainable.
10 262 A TEXTBOOK OF MEDICAL INSTRUMENTS When a ceramic element with an acoustic impedance of 30 is kept in contact with body tissue having a similar impedance of 1.6, there is so much mismatch that result in considerable loss of energy and hence a weak signal results; this is improved by attaching a matching impedance layer of quarter wavelength (λ/4) for increased transmission at the interface. Such a material, usually a plastic, is chosen at the interface in the construction (Fig. 8.8). Controlled focal characteristics can be obtained by using multiple matching layers also in a graded layer. LINEAR ARRAY TRANSDUCER Today most of the advanced ultrasound machines use a linear array or convex array transducer. Such an array comprises of several closely spaced rectangular elements arranged side by side along with inter-element damping material, shielding acoustic and RF focusing lens and plastic housing. If a single element beam can be characterized by the equation. F(θ) = sin k/k where k = πa sin θ/λ Fig Using a matching layer for contact at surface for a transducer. V = Vel. sound in matching layer. Fig Gives using a matching layer for contract at surface for a transducer. F = Field strength of ultrasound a = element width θ = angle at the point considered λ = sound wavelength in tissue. The pattern is shown in Fig But there are side lobes also. In practice, linear arrays are not pulsed individually because their small size results in low sensitivity and poor lateral resolution due to beam divergence. To overcome these, array elements are operated as multiple element groups. Generally more the number and smaller the size of the elements, the lower will be the side lobes. Additional effect of the grating type of construction called grating effects are also present, (Fig. 8.9a) which is reduced by subdicing (Fig. 8.9b).
11 ULTRASOUND MEDICAL DIAGNOSTIC INSTRUMENTATION 263 Fig. 8.9a. Shows the effect of width-size over the main lobe of radiation Main lobe Side lobes 0 db 60 db 60 db 0 db Fig. 8.9b. Shows the two-dimensional shape of the ultrasound signal showing main lobe and side lobes Main lobe Grating lobes x 1.5 mm Fig. 8.10a. Locating grating lobes of greater angles reduces artefacts ( X is chosen).
12 264 A TEXTBOOK OF MEDICAL INSTRUMENTS Sub-element Fig. 8.10b. Sub-dicing the elements of array transducer. Wavelet Wavefront Beam axis Beam formation A Wavelet Wavefront Beam axis Beam focusing B Wavelet Focus Wavefront C Wavelet Beam axis Beam steering D Wavefront Focus Beam axis Combination focusing and steering Linear phased Array (4 elements) SECTOR SCAN PROBES Fig. 8.10c. Beam formation, focusing, steering and combination. In a linear array the drawback lies in its size. It needs a very big acoustic window. It is not always possible to provide such window for all organs. In order to scan for a larger field of view with a small window the sector scan transducer is preferable. Three types are there: 1. Mechanical type 2. Electronic phased array 3. Radial Array
13
14
15
16 This page intentionally left blank
17 ULTRASOUND MEDICAL DIAGNOSTIC INSTRUMENTATION 265 In the mechanical type, an array consists of three or four transducers. All of them are fitted on the edge of a wheel. The array is mechanically rotated by a motor. This motor is activated electrically or magnetically in an isolated condition. The whole array set up is immersed in an oil bath container for achieving high speed with low friction. The oil-bath container has a thin plastic material, which is placed on its surface where the cross-sectional image is need. Each one of the transducers is activated while it comes near the window. The transducer of different focal length can be placed in the sector- scan assembly for acquiring a clear image at different depths. But in these mechanical types dynamic focusing is not feasible. Further there is a degradation in quality during the routine clinical use. Since the transducer is in motion while sending and receiving the signals there is a certain amount of uncertainty in the direction of the ultrasound signals. In the phased array type of sector-scan transducer, the moving part of transducer system is eliminated. It is very light in weight and easy to handle. The strip of elements of this transducer are wired up like the linear array transducer and they are activated electronically to achieve the direction of the propagation of the ultrasound signals. The time of delay determines the direction of the signal and it can be achieved accurately. The dynamics of focusing for transmission and reception is performed without any problems (Fig. 8.10c). This is done by DSP and is called sonar beam forming. Phased arrays are capable of electronic beam formation beam focusing, beam steering and any combination of these allowing dynamic focusing and steering (Fig. 8.10) Mechanical sector scanner Phased array Radial array Fig Shows the different type of sector-scan transducers. The problem with electronic phased array is the long delay times involved to trigger the transducer elements, while directing away the signal from the center of the field of view. This causes the image degradation like refraction errors due to the tissue inhomogeneity. In these types of arrays, grating lobe produces the degradation. The direction of such grating lobes is designed to be at a large angle. The transducer elements are all triggered at first time. If the direction of propagation has a small angle with the face of the transducer, then the grating lobe would be steered towards the face of the transducer itself. The radial array is an array of elements serially arranged along predefined arc with a specific radius of curvature. It has been incorporated with the important features of linear array without sacrificing access or beam steering and dynamic focusing. It has no moving parts or liquid medium. Due to the curved nature, only one group of transducer elements are triggered for a particular angle. So there is no long delay time and the grating lobe remains to be at the fixed angle with respect to the main lobe.
18 266 A TEXTBOOK OF MEDICAL INSTRUMENTS The effective aperture of a phased array transducer decrease is 70% at 45 scanning. This decrease does not occur with this radial array, since the face of the array slowly changes direction and also faces the direction of ultrasound beam. The most obvious advantage of the radial array is to achieve dynamic focusing which is not possible with the mechanical scanner in addition to its reliability for want of moving parts (Fig. 8.12) θ Fig Shows the effective aperture of the phased and radial array with increasing scan angle. FOREIGN OBJECT DETECTION USING ULTRASOUND A scan echoencephalography may also be used to detect foreign objects imbedded in a subject. Fig shows a typical A scan obtained when scanning an eye containing a foreign object with a 10MHz transducer. The response attributed to the foreign object can be verified by scanning the other eye and noting the lack of any response at this time position. Many manufacturers produce equipment suitable for A scan ultrasonography. A typical instrument configuration is shown in Fig. 8.13a. Shows A scan detection of a foreign object.

19 ULTRASOUND MEDICAL DIAGNOSTIC INSTRUMENTATION 267 Fig. 8.13b. Showing a typical ultrasound scanner machine. Fig. 8.13a; a Tektronix type 561B or 564B oscilloscope is used with a Tektronix type 2B67 timebase unit and a special vertical plug in unit, designed for echoencephalography, produced by the Picker- X-Ray corporation. Suitable probes are also produced by the Picker X-ray corporation. The complete instrument may be used in conjunction with w Tektronix scope-mobile cart and Tektronix trace-recording camera. TIME-MOTION (T-M) MODE ULTRASONAGRAPHY Considering A ulrasonography as discussed earlier, if an interface producing an echo was moving in relation to the transducers, the response obtained in the CRT would also move horizontally relative to the beginning of the sweep. If this A scan system was to be modified slightly by removing the echo signal from the vertical channel (Y) and connecting it to the identifying channel(z), am echo response would then appear as an intensified spot on the screen. Any motion in this echo response would appear as a horizontal motion of this spot between successive sweeps of the horizontal sweep generator. No vertical signal would be involved.
20 268 A TEXTBOOK OF MEDICAL INSTRUMENTS In time-motion or T-M mode ultrsonography, the above hypothetically modified A scan system is used with a slow sweep generator, moving the display vertically. Thus, any motion in the echo response is displayed in real time by the slow vertical sweep. This system is shown in Fig. 8.3, and a typical T-M mode ultrasonogram from motion of the mitral valve of the heart is shown below. This is the motion display mode. Here the reflections are shown as a time course indicating for instance, movements of cardiac chamber walls etc. The machine has a cursor called M-cursor. By positioning the cursor at the required point we can get the M-mode tracing of the heart at that point. This mode is useful for measurement of chamber dimensions during systole and diastole. (Fig. 8.14) Fig M-mode echo cardiograph (a) shows heart chamber and insonation direction (b) shows the Motion mode display. ULTRASOUND IN CARDIOGRAPHY Referring to Fig. 8.15, the motion of the mitral valve is clearly shown on the vertically-swept trace on the screen of the CRT. Fig. 8.15, also shows that the motion of the walls of the heart, however echos from other interfaces in the transducer s path have been gated out in this instance. This particular application, known as T-M mode cardiography is particularly valuable in the detection of mitral stenosis. Since the actual movement of the mitral valve is shown in centimeters in real time (vertical sweep), the velocity of movement of this valve can be determined from the slope of the trace obtained. In the example shown in Fig. 8.15, the maximum velocity of the mitral valve is 16 centimeters per second, the overall movement of the valve is 2.2 centimeters and the heart rate is 86 beats per minute.
21 ULTRASOUND MEDICAL DIAGNOSTIC INSTRUMENTATION 269 Fig Shows a typical T-M mode ultrasonogram from motion of the mitral valve of the heart. SIGNAL PROCESSING The generation of pulse signals and the gating of preamplifier to detect the echoes after the pulse are done with a microprocessor in the ultrasound machines. In a plain ultrasound machine the signal processing comprises of the various filters, time gain compensation of signals for deep weak echoes and the storage of data in memory. The scan converter converts the data into the standard CCIR video signal which is given to the instrument monitor is also output for recording in VCR. RECENT DEVELOPMENTS IN ULTRASOUND MACHNIES The recent B-scan machines available from USA, Germany and U.K., give a blend of technology employing the latest microprocessors in signal processing hardware as well as transducers. Most of these latest machines provide a number of features that facilitate every day work and present view very clearly and visibly. Physicians are looking for machines having both linear and sector
22 270 A TEXTBOOK OF MEDICAL INSTRUMENTS scan transducers. Probes specially made of Gynaecology / obstetrics, urology and cardiology have further eliminated errors in images considerably. Facility with keyboard to annotate an image for record is standard practice. Frequencies employed vary from 2 to 7 MHz. Linear and sector scan units have their own merits and demerits for their own examinations. For example, a fine microconvex probe of the sector type (Fig. 8.16a) with an internal angular change of 110 is ideally suitable for internal organs viewed between small costae. Linear transducers provide better lateral resolution for shorter distances for examination of shallow organs at 7.5 MHz. Most of the present machines have variable frequency probes enabling shallow to deep insonation, even without changing the probes. For example, the same probe can give better details in the near distances at 7.5 MHz and also clear interior details by switching to the 3.5MHz mode. In orthopaediatrics and pediatrics, the probe with a high frequency and a wide sector scan is useful. Special probes such as the transvaginal probe allows clear diagnosis in the pelvic cavity. (Figs. 8.16a, b, c) (a) Microconvex probe suitable for (b) Transaginal probe. observation through narrow electronic scanning is most suited for organs located. (c) Gestational week measurement. (d) Image of large ovarian cystoma. Fig. 8.16
23 ULTRASOUND MEDICAL DIAGNOSTIC INSTRUMENTATION 271 Display technology on CRT using high persistence phosphors have made possible high resolution pictures on small tubes. The microprocessor is used for transducer control, grey level adjustment, scan conversion, display of legends and storage of images in digital memory. Provision for multiple views (Fig. 8.17) in the two dimensional planes (transverse and sagittal) in one screen enables easy assessment of volume information. Additionally, some instruments provide for the measurement of length, area and volume (as in Fig. 8.15) by suitable built-in programs. The accuracy of such measurements depends on markings made by the doctor on the screen insitu with the cursor facility provided. As the poor lateral resolution of plain B-scan images do not ordinarily permit directly visible clear outline of organs, inferences of pathology depend on the clinical acumen of doctor or sonologist. These measurements would vary with actual sizes, to an extant of 50%. Fig Shows the dual image in B-mode to obtain areas of mitral valve in systole and diastole. (a) Measurement of femur length (b) Area/Circumference measurement
24 272 A TEXTBOOK OF MEDICAL INSTRUMENTS (c) Prostate gland showing volume measurement (d) Estimation of weight of fetus Most instruments have provision for recording the screen video in a video cassette recorder (VCR). Optionally an electrocardiography(ecg) amplifier with provision of ECG display is available. The machines used for echo-cardiography provide Doppler spectra display also on the screen. Such Doppler probes are dual frequency type which enable a Doppler-shift of the signals at a particular point in the image to be recorded. As the sector- transducer scans its path, say 90 or 110, the Doppler transducer is activated on a chosen line and the data is picked at a specific timeof flight, so that a limited region in the scanned transverse section. The flow of blood via the cardiac valve is covered. For this purpose, the transducer is exited with a pulse burst. Every scan repeats this process. Scan occurs every fifteenth of a second repetitively. The Fourier Transform processing of the demodulated Doppler shift audio frequency signal is displayed as a real time spectrogram on the same screen which shows the B-scan also in real time. The use of high speed digital signal processing hardware only has made this possible with these high end class ultrasonic scanner machines. The Zooming function in the region of interest have been provided by latest ultrasound machines, gives an effective diagnosis of early pregnancy and examination of the fetal heart as discussed earlier. Present day instruments have better magnification and clarity as given by: 1. Optimized line and pixel densities 2. Increased resolution by electronic focusing with linear arrays. 3. Increased frame rates with fast scanning 4. Increased image size with better cathode ray tubes. In surgery, the positional accuracy and clarity of B-scan images render a proper application of puncture and biopsy needles possible. Moreover, probes are specifically designed for endoscopic applications as well. The forceps position can be monitored during surgery by real time B-scan views and the same can be steered to move it in the right direction. ULTRASONOGRAPHIC APPLICATIONS Fig shows a typical B mode displays obtained with a compound scanning system. These displays are self-explanatory and indicate some of the potential advantages of ultrsonography.
25 ULTRASOUND MEDICAL DIAGNOSTIC INSTRUMENTATION 273 Neither of the three displays shown could have been obtained by conventional X-ray techniques as; for the fetus in vitro, fetal development is impaired by X-ray energy; for the breast cyst, such cyst tissue is not X-ray specific for the scan of the eye, resolution with X-ray techniques cannot be obtained if the X-ray plate cannot be located directly behind the region concerned. Fig Shows typical B mode display from a compound scanning system.
26 274 A TEXTBOOK OF MEDICAL INSTRUMENTS DOPPLER ULTRASOUND PART-II Continuous ultrasonic energy, rather than bursts of ultrasonic energy is used in ultrasonography. This is used to detect motion within a subject by the Doppler principle. When ultrasonic energy is reflected from a moving object, it is shifted slightly in frequency, the frequency shift being proportional to the speed of the object. In the living body there are numerous movements which reflect ultrasonic energy; blood flowing through arteries, the action of the heart, intestinal movement and passage of urine and gastric juices. The most common application of Doppler ultrasonics is in obstetrics to detect movement of the fetal heart and fetal blood flow; such fetal activity can be detected as early as the tenth week of gestation. Another major application for Doppler ultrasonics is in the detection of blood flow in the peripheral circulation of the body. DOPPLER SIGNALS FROM PROBE Today s machines have built-up Doppler processing of the echo signals. When an ultrasound signal strikes a moving target, the reflected echoes have a change of frequency (or Phase) corresponding the motion of the target given by the Doppler frequency shift. f D = f 0 2v cos θ/c (1) where f 0 is the ultrasound frequency, v is the velocity of the target and q the inclination and c is the tissue sound velocity (usw m/s) (Fig. 8.19) Fig Shows doppler relation for ultrasound signal in a blood vessel. While scanning takes place over a region by the linear or sector transducer, typical paths of the beam could be chosen to process the Doppler sampled volume inside the region. The velocity information in that region can be processed by using the shift of frequency and plotting the spectrogram. The received signal generally comprises of reflections from blood vessels, walls and signal from the blood flow in arteries. The former two are low frequency shifts, while the latter, attributed to Raleigh scattering of the beam by the moving particles of blood, is of a higher frequency varying from 2 to 16 KHz depending on the nature of blood flow, laminar or turbulent or jet. Echo cardiography analyses the pathology of valves and their narrowness in diseased or abnormal conditions by noting the velocity patterns during the systole and diastole in the heart beat cycle, which is usually accompanied with ECG waveform display also. Plate I.3b shows the
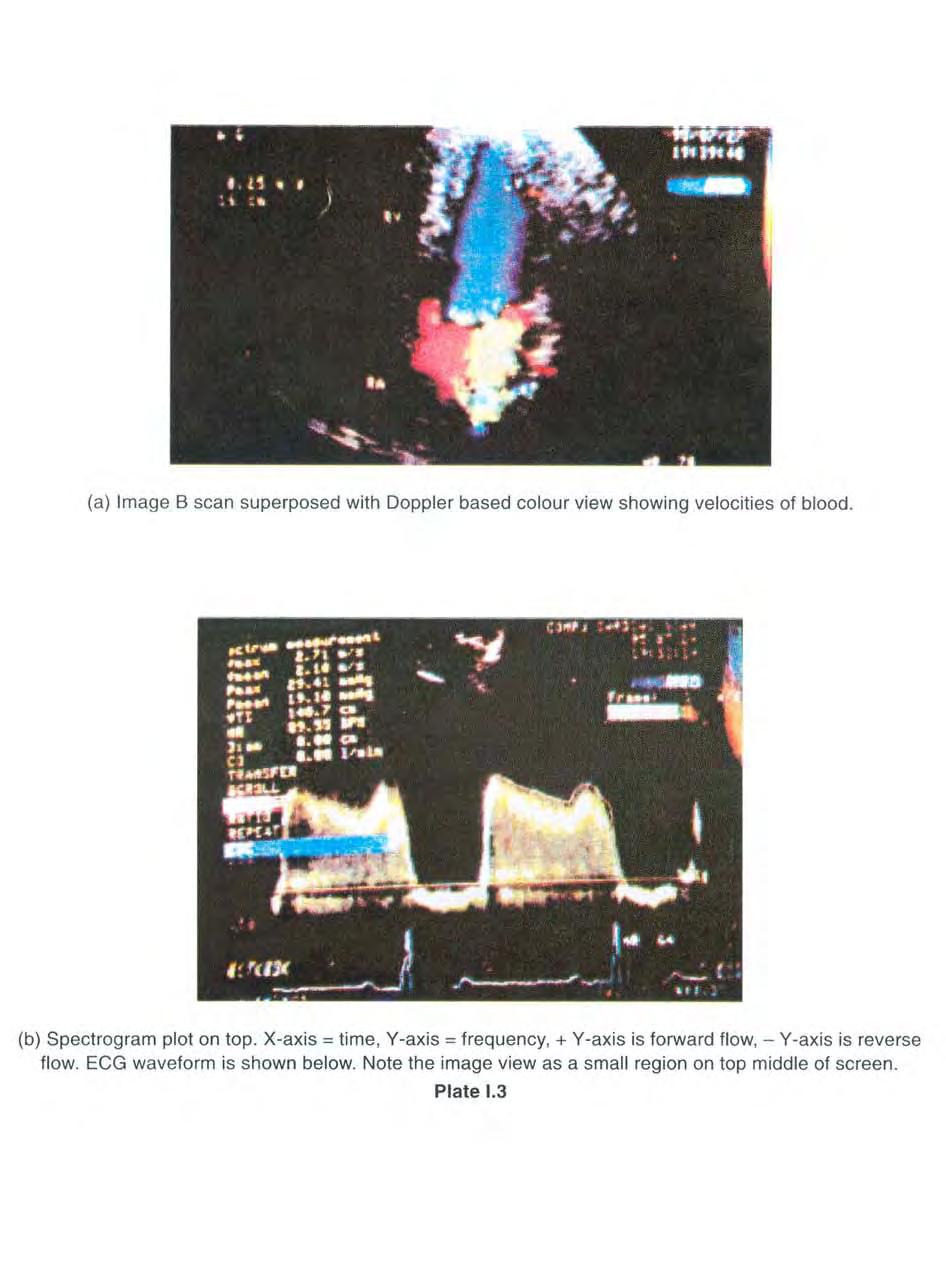
27 ULTRASOUND MEDICAL DIAGNOSTIC INSTRUMENTATION 275 usual spectrogram display given by a machine of a region of insonation under the mitral valve flow, giving forward high velocity flow patterns due to a narrowed (stenosed) valve. In some other pathologies there may be regurgitation also observable (negative frequencies), which would show high velocities in the spectrogram during the period when the valve closes. Plate 1.3b shows a colour Doppler view of the ventricular jet of blood flow. Doppler attachment in many machines provides additional circuits. The choice of sample volume for which the Doppler signals are collected is related to the scan time course. Hence, it is possible to pick up the pulse echoes during that scan angle and do the processing. Note that in Plate I.3a, the Doppler angle is less than the sector scan angle. Doppler processing is done usually with DSP hardware. Chirp-Z transform is performed using dedicated integrated circuits on the signals after demodulation. The RF demodulators separate the two components of the signals using phase sensitive demodulators using typical high frequency integrated circuits meant for the purpose. These two I and Q signals are in the audio frequency range and they can then be processed for the evaluation of the Complex Fourier Transform (Fig. 8.20). (Phase quadrature outputs) Fig Shows the phase quadrature scheme of doppler signal extraction. DOPPLER ULTRASOUND BASIC ASPECTS OF DOPPLER SYSTEMS The basis of most Doppler ultrasound systems is shown in the block diagram (Fig. 8.21). Also we know that the transmitter portion is responsible for excitation of the Doppler probe crystal. For a continuous wave (CW) system, the excitation signal is sinusoidal at a frequency range of 3 MHz to 8 MHz typically, as per probe choice. For a pulsed system, the transducer is excited by a high amplitude sinusoidal burst whose duration is typically several cycles on, and this is repeated at the pulse repetition rate, which is often around 10 khz. The received signal consists of reflected and scattered signals from fixed interfaces along with the Doppler signal from
28 276 A TEXTBOOK OF MEDICAL INSTRUMENTS vessel wall movement, and the much weaker Doppler signal arising from scattering by red blood cells. This composite signal from the receiving transducer is first amplified and then demodulated in order to extract the forward and reverse Doppler signals. The Doppler signal arising from blood generally contains the frequencies considerably higher than those arising form vessel wall movement. The function of the signal processor is to anlayse the Doppler signal by a method called real time Fourier analysis. Information from this analysis may be displayed along with the B-scan image so as to ensure probe position and insonation of the vessel. (See image on top middle of screen as a small picture in Plate I.3b) Fig Shows the general block diagram of Doppler system. The optimum frequency is a compromise between the increasing attenuation by tissue as the frequency is raised and the increased Doppler signal power. Specifically, the attenuation coefficient of most tissue is approximately proportional to the frequency, while the scattered power is proportional to the fourth power of the frequency. It can be shown (McLeod 1974) that the best signal to noise ratio is achieved when the frequency is given by 13 Fopt = R/cos θ MHz (2) where R is the total tissue path length from the transducer to the vessel expressed in centimeters. For example, if the vessel is 1.5cm from the skin surface and the probe to vessel angle is 60 then Fopt = 7.5 MHz. In practice, other factors are also important, e.g., the dependence of the ultrasound beam pattern on frequency, and the reduction in the Doppler frequency shift as the transmission frequency is decreased. For pulsed Doppler, the spatial resolution increases at higher frequencies but, on the other hand, in situations where frequency aliasing is significant (deep structures with high associated velocities) a higher transmit frequency will increase this problem. In spite of these limitations, eqn. (2) serves as a useful design guide for the best choice of transmission frequency. In systems that combine B-mode imaging with Doppler, the imaging frequency and the Doppler transmission frequency may vary. For example, 7.5 or 10 MHz may be used for imaging in order to achieve improved spatial resolution, while the Doppler transmission frequency could be 4MHz. This choice of frequencies allows the examination of vessels for which the ultrasound beam tissue path length is less than 5cm.
29 ULTRASOUND MEDICAL DIAGNOSTIC INSTRUMENTATION 277 TRANSDUCER DESIGN The transducer for a simple, CW system generally consist of two piezo-electric crystals; one for transmission and one for reception (Wells 1974). Some examples of the crystal arrangement are shown in Fig (a) Hemi-disk Rectangular probes structure Aligned Offset (b) Crystal Acoustic lens Transmitter Receiver Crystals Probe Focal zone Probe Crosssectional field profiles Near field Far field (c) Mechanically rocked imaging transducer Pulsed doppler probe Fluid coupling medium Thin membrane Skin Vessel Sector scan Dopler beam direction (Adjustable angle) Fig Example of doppler transducers. (a) End view of different CW probes using separate transmit and receive crystals. The crystals may be mounted at a small angle to one another to provide some degree of focusing. Beam profiles are shown for a simple disk transducer element similar to that used in some pulsed doppler systems. (b) Disk transducer probe with an acoustic lens. (c) Example of duplex transducer that uses separate imaging and doppler transducer crystals.
30 278 A TEXTBOOK OF MEDICAL INSTRUMENTS For pulsed Doppler, since the functions of transmission and reception are separated in time, a single crystal is normally used to perform both functions. Generally, the crystal consists of a disc of say, 5 mm in diameter as shown in Fig. 8.22b, a simple acoustic lens may be bonded to the front surface in order to reduce the beam diameter in the focal zone. In some duplex systems, the same transducer is used both for imaging and Doppler measurements. This is achieved by time sharing the crystal between the two modes (mixed mode operation). Although this approach may simplify the probe design and reduce its cost, there may be loss of performance. For pulsed Doppler systems, a primary aim may be to determine the flow velocity at points in the structure under examination and for this application the beam must have a small diameter. As illustrated in Fig. 8.23b, the length along the beam axis over which the Doppler signal is obtained is the axial resolution and is determined by both the duration of the transmitted sinusoidal burst and by the duration over which the returned Doppler signal is sampled. The product of the beam area and the axial resolution is the sample volume. In a well-designed 5 MHz pulsed Doppler probe, 90% of beam power may be confined to a cylinder of 2 mm diameter. However, it should be noted that the effective beam diameter depends on the frequency and somewhat on the range. For example, for 3 MHz Doppler a minimum volume of 3 mm has been reported, while for a 6.1 MHz probe, Hocks et al (1954) reported that at a range of 1.5 cm. Fig Shows the Doppler beam profiles in relation to a vessel. (a) CW beam : ideal profile in which the vessel is uniformly insonated ; practicalbeam profile. (b) Pulsed doppler beam and sample volume; long pulse sample volume in which the doppler signal is derived from a pencil-like intersection with the vessel; arrangement in which the doppler signal is obtained from a small volume within the vessel.
31 ULTRASOUND MEDICAL DIAGNOSTIC INSTRUMENTATION 279 DEMODULATION METHODS For both pulsed and CW Doppler systems, it is necessary to extract the Doppler signal from the amplified RF signal. This is normally achieved in directional-sensitive systems by an analog based phase-quadrature demodulator. A simple demodulator consists of a means of multiplying the RF signal at the transmission frequency, and then, by means of a filter, removing the RF components. For economy, simple hand held Doppler flow-meters often use this scheme. Such a simple Doppler probe system is described later in this chapter. To separate the forward and reverse flow Doppler signal components, the phase-quadrature scheme shown in Fig is generally employed. Fig Shows the block diagram of a typical phase-quadrature sound frequency demodulator and flow separator subsystems. By multiplying the received RF signal by an in-phase component and by a 90 out of phase (quadrature) component of the transmitted signal, it can be shown that two outputs contain the two directional Doppler components in a separable form. Specifically, by removing the RF components from the multiplier outputs (the low pass filters), each of the two outputs contains the forward and reverse Doppler signals, but in a phase - quadrature form. In addition, as shown in Fig. 8.24, high pass filters are normally employed to remove those Doppler signals that arise from a low velocity interfaces, such as vessel walls. Typically, the cut-off frequency of such a filter is in the range of Hz. To obtain separate forward and reverse Doppler output signals, it is necessary to perform a 90 phase shift (Hilbert transform) and then perform an addition and subtraction. The Doppler signals can be extracted through the use of straightforward digital processing methods, such as complex Fourier transform.
32 280 A TEXTBOOK OF MEDICAL INSTRUMENTS In modern Doppler systems, signal processing may be performed directly on the phase quadrature output; consequently, the flow separator is likely to be used just as a means of providing stereo audio feedback to the system operator. Recording of the Doppler signal is best achieved by recording the phase-quadrature output. THEORY OF DOPPLER SIGNAL TRANSFORMATION If the carrier ultrasound frequency is ωc and the Doppler Shift frequency is ωd, then the shift frequency is (ωc + ωd) and so if it is a cosine signal u = cos (ωc + ωd)t = cos ω c t cos ω d t sin ω c t sin ω d dt = I cos ω c t Q sin ω c t (3) where I and Q are the two quadrature components of the Doppler signal. The Doppler signal is essentially a single sideband signal, because, the carrier frequency of the ultrasound has only one side the frequency of the Doppler frequency. For example, if the probe is at 2.5MHz and the velocity of movement of the target is at a frequency increase by Doppler shift to 2.51 MHz, then the spectrum will be as shown: There is no negative frequency component at 2.49 MHz as would be seen in a simple amplitude modulated spectrum by a 0.01 MHz signal over the carrier. Hence it is a single sideband signal. As shown on the right of the above figure, there can be a spread of the Doppler frequencies and A denotes the upward shift spectrum and B denotes the downward shift spectrum. Thus, both sides of the carrier, there are single side band components. After we get the synchronously detected signals in phase and quadrature to the carrier frequency as I + j Q, we can use it for finding the complex Fourier transform. The complex F.T. will give the two components A and B at the negative and positive frequency parts accordingly, as shown below. Each of these will have both real and imaginary parts, corresponding to the Cosine and Sine part of the Doppler frequencies (phase information).
33 ULTRASOUND MEDICAL DIAGNOSTIC INSTRUMENTATION 281 PULSED DOPPLER SYSTEM A simple pulsed Doppler system contains a number of elements that are similar if not identical to those of the CW system (Fig. 8.25) just described. The transducer is driven by a brief pulse consisting of several sinusoidal cycles. Since it is important to ensure that successive excitation pulses are identical, this driving signal is derived from a master oscillator that also determines the pulse repetition frequency (PRF). The received signal consists of signals from stationary interfaces as well as scattered signal from blood cells lying along the beam path. Since the signal amplitude is very dependent on the depth, the RF amplifier will either have a manual gain control, or the gain will be automatically increased with time (time gain control, TGC) in such a way that the signal attenuation is approximately compensated for. Master oscillator Divider Range Gate Probe Set PRF Transmitter Phase Quad. Demod. Range delay Sample volume Vessel RF Amp. Sample & Hold Set Delay Transmit pulses Received RF Signal Wall signal Rangegate pulses Scattered dopplershifted signal 1/f PRF Range delay HP & LP Filters Spectrum analyzer (FFT) Scan Conv. Flow sep. Fwd. Rev. Display Doppler outputs Fig Pulsed Doppler Modulus Schematic Diagram. Depth discrimination is achieved by sampling the outputs at the phase quadrature demodulators at a point in time from the start of the transmitted pulse that corresponds to twice the transit time ( there and back) from the probe to the sample position. Since the range delay can be adjusted, the Doppler signal from any given point can be obtained. Furthermore, in some systems the duration of the sample can also be adjusted so that the volume sampled can be varied from a long cylindrical region along the axis, down to the minimum sample volume. The proper choice of the PRF is of major importance since this frequency determines the maximum velocity (Vmax) that can be determined without causing ambiguity as to their positional origin. Since the time between transmitted pulses must be sufficiently long to allow an ultrasound pulse to reach the target and the resultant echo to return back to the transducer, it is necessary that 1 2 > R max cos θ (4) f c prf
34 282 A TEXTBOOK OF MEDICAL INSTRUMENTS where the pulse repetition frequency (PRF) is denoted by f prf and c is the velocity of sound in the medium (typically, 1500 m/s). Now, to avoid ambiguity in the Doppler signal spectrum due to frequency aliasing, it is well-known result of communications theory (the Nyquist theorem) that the signal must be sampled at a rate equal to at least twice the maximum frequency present. Failure to meet this criterion causes a wrap around of the Doppler spectrum. This is the same phenomenon observed in a western movie where spokes of the wagon wheel appear to go backwards when the wagon goes sufficiently fast. Thus, since it is required that fopt > 2( f D )max and noting the maximum frequency (Doppler frequency) and the maximum velocity related by the Doppler equation, then from eqn (4), 2V max /c = f D /f s and f D /f prf = 1/2...(5) R max V max = c 2 /(8f s cos θ) (6) where f s is the transmitted frequency and the direction of the moving target is assumed to be at an angle θ to the probe axis. Eqn. (5) is plotted in Fig. 8.26, which enables either the maximum range or maximum velocity to be determined. For example, if a 6MHz probe is used at 60 to the vessel axis, and if the peak flow velocity is 100 cm/s, then the PRF must be greater than 8 KHz to avoid frequency aliasing. For this PRF, the vessel range should be less than 9.3 cm if range ambiguity is to be avoided. Finally, it should be noted that the limit in the range/velocity product as expressed by eqn. (6) which can be extended through the use of periodic changes in the PRF, and the adaptive technique used in the ATL duplex system. Fig Shows the range ambiguity and aliasing limitations of pulsed doppler system. DUPLEX DOPPLER (B-MODE) Systems that provide both B-mode vessel image and a Doppler signal from a specific region of a vessel are widely used in clinical practice. Such systems, which are commonly referred to as duplex Doppler systems, normally use a pulsed Doppler and provide a means whereby the beam

35 ULTRASOUND MEDICAL DIAGNOSTIC INSTRUMENTATION 283 direction and the location of the sample volume are superimposed on the B-mode display, as illustrated in the recording of Fig In addition, for cardiac examination, to avoid the problem of aliasing, a CW Doppler mode may also be provided. A major advantage of such systems, in spite of their increased complexity, and cost, is the ability to determine the precise location of the sample volume in relation to the vessel under examination. Furthermore, vessel abnormalities may be apparent from the image display. The B-mode imaging system may consist of mechanically rotated or rocked transducer elements, or a phased array, or a phased annular array that is rocked. The Doppler transducer can be an independently moved unit within the scan head or it may be a crystal that is time- shared with the imaging portion of the system. Through the use of an independent Doppler probe, both the imaging and Doppler subsystem designs can be optimised. In addition this arrangement also provides greater flexibility in clinical use. In the Duplex mode of operation, whereby both imaging and Doppler information are displayed, a reduction in the imaging frame rate may be required. Fig Duplex recording from the abdominal aorta with the pulse sample volume positioned close to the vessel centre. The sample volume is 3 mm and is 6.5 cm from the transducer face (as shown by = in fig.). An individual spectrum from the spectrogram, taken at the time marked with the arrow, is also displayed. DOPPLER FLOW IMAGING Recently, developments in pulsed Doppler methods have made possible the presentation of real time Doppler flow images superimposed on the conventional real time B-mode (structural) images. A major difficulty in the design of such systems is the problem of processing the Doppler information sufficiency fast to extract the flow information from each scan line. The basic principles are illustrated in Fig. 8.28, where it is assumed that the transducer produces a sector scan by means of a phased array. Each line of the sector scan is used to produce a B-mode image in the usual manner. In addition, each line is processed by comparing it to the
36 284 A TEXTBOOK OF MEDICAL INSTRUMENTS previous line to remove the stationary and slowly moving interface reflections (clutter removal). This leaves a signal from rapidly moving interfaces and the signals scattered from the red blood cells. Fig Shows the details of real-time cardiac doppler flow imaging system. It is necessary to integrate over several identical scan lines (e.g., eight) and this reduces the frame rate. The digital scan converter and colour converter encode the velocity information as red or blue, depending on a whether the direction is towards or away from the transducer. Furthermore, the colour brightness is proportional to the velocity, while the variance in flow velocity is presented as green. Fig Shows the block diagram of linear phased array Doppler imaging system.
37 ULTRASOUND MEDICAL DIAGNOSTIC INSTRUMENTATION 285 A powerful digital signal processor determines the echo signal magnitude and phase at each point and this enables a B- mode display and Doppler display to be superimposed. In the Doppler display, red indicates slow away from and blue flow towards the transducer; higher velocities are shown by increased brightness. This image of the carotid bulb region was taken at close to peak systole, and shows a region of flow separation and reversal. METHODS OF SPECTRAL ANALYSIS Requirements For both pulsed and CW Doppler systems, the special analysis requirements are generally similar. In peripheral and carotid arterial assessment, it is essential that the analysis be performed in real-time so that the clinical operator will have visual feedback of the Doppler spectral waveform to aid in optimum probe placement. In addition, for identifying venous flow artifacts, as well as for the proper presentation of spectra containing reverse flow components, it is important that forward and reverse signals be processed simultaneously. To avoid precise adjustments of the receiver gain, it is desirable that the analysis system be able to cope with a wide dynamic range: a 60 db range. The frequency analysis range and resolution and time resolution are governed by the nature of the Doppler signal as well as by the transmission frequency. For clinical applications, to process most Doppler signals, the anaylser must accommodate maximum forward frequencies up to 15 khz and reverse frequencies up to 5 KHz. A frequency resolution of approximately 100 Hz may be required. For example, for a normal carotid arterial signal, with a maximum frequency of 3 khz at peak systole, a 100 Hz bandwidth corresponds to a division of the signal spectrum into 30 frequency bins. For real-time spectral analysis systems, the frequency resolution is the inverse of the time resolution. Thus, for a signal segment of 10ms duration, the maximum frequency resolution will be 100 Hz, while for a 5ms signal it will be 200 Hz. It is desirable to smooth the transitions at the beginning and end by using a window function that is generally of the Hanning or Hamming type. DIGITAL METHODS An attractive alternative to analog methods, is the use of the discrete Fourier transform (DFT). The calculations can be performed with either with the conventional DFT or the fast Fourier transform (FFT) algorithm. Suppose that the processor can perform an N-point Fourier transform (yielding N/2 positive frequency bins) in a minimum interval of T seconds. For real time operation on records of duration T, the Doppler signal must be sampled at a frequency of N/T. For this sampling frequency, aliasing will occur if the input signal spectrum contains components higher than N/2T Hz. The N/2 frequency bins will be spaced from zero frequency up to a frequency N/2T, in equal intervals, so that the bin size will be1/t. For example, if T = 0.01 s, and N/2 = 128, then the frequency at which aliasing starts to occur will be 12.8 khz and the frequency resolution will be 100 Hz. By increasing T, the frequency resolution is improved but with a reduction in the
38 286 A TEXTBOOK OF MEDICAL INSTRUMENTS Nyquist frequency. While the arguments just given have considered a single-channel Doppler input signal, they can be extended to the complex input signals from a phase quadrature demodulator, i.e., for the inphase and quadrature signals. Fig Comparison of techniques for data sampling. (a) Conventional method : a new signal segment of duration T 1 s is used for each analysis, yielding a spectrum every T 1 s with a reolution of I/T 1 Hz. (b) Sliding method : data for each analysis contain (T 1 -T 2 ) s of old data from the previous analysis and T 2 s of a new data, creating spectra with a resolution of I/T, Hz but at the increased rate of one spectrum every T 2 s. Fig shows the comparision of techniques for data sampling in Doppler systems. General purpose microprocessors and microcomputers have inadequate speed to implement even the computationally efficient FFT in real-time. A s a result, high speed DSP systems have been developed which perform the analysis. The Motorola DSP56000 chip can perform a point complex FFT in 5 ms. Spectral analysis based on the use of charge coupled devices (CCDs) is a hybrid form of signal processing which has the advantage that time and frequency information are handled digitally. The signal levels are retained in their original analog form (on a sampled basis), thereby eliminating the need for an analog to digital converter. The frequency analysis range, resolution and speed requirements for Doppler ultrasound signal analysis can all be met with available CCD-based transversal filters.
39 ULTRASOUND MEDICAL DIAGNOSTIC INSTRUMENTATION 287 MEAN, MAXIMUM AND VOLUMETRIC FLOW WAVEFORMS Both the maximum and the mean frequency waveforms have important applications in the quantitative assessment of vascular disease. Care must be taken to define whether it is the amplitude or the power Doppler spectrum from which the waveforms are derived. In general, the mean frequency waveform derived from the amplitude spectrum will not be the same as that derived from the power spectrum. The same is true for the maximum frequency waveform. Owing to the statistical origin of the Doppler signal, the estimates of the maximum and mean waveforms will have a statistical variability that depends on the duration over which the estimates are made. Usually, the mean frequency waveform definition is based on the power spectrum P(f D ) and this can be obtained by simply squaring the amplitude spectrum A(f D ). On this basis the mean frequency waveform f D (t) is given by z α α fd() t = fdp( fd) dfd / (P fd) dfd (6) α z α where the integration extends over all frequencies, including the reverse flow frequencies, which are treated as being negative. Evidently, the above eqn.(6) is simply the first moment of the power spectrum. An approximate analog method for estimating the mean Doppler waveform is based on the use of a circuit to count the number of zero crossings of the input signal over as short period of time and to convert this into a proportional output voltage. Of course, this same process can also be performed digitally. It has been pointed out that even with high-resolution pulsed Doppler systems, the spectrum obtained from a sample volume positioned near a severe stenosis can have a relatively wide bandwidth. For such signals the error introduced by a zero-crossing detector may be significant. VOLUMETRIC FLOW WAVEFORM Three categories of method can be identified They are given as follows; 1. Velocity profile method 2. Uniform insonation method and 3. Assumed velocity profile method. In the velocity profile method, the velocity profile across the vessel is measured using pulse Doppler techniques and then assuming semi-axisymmetirc flow, the volumetric flow can be calculated by integration across the vessel diameter, i.e., by evaluating, z+ R Q( t) = πrv( τ, t) dr...(7) R where R(t) is the vessel radius at a time t, and the velocity profile from R to + R is assumed to be known. Evidently, both the instantaneous vessel diameter and the angle of incidence of the Doppler beam must also be known.
40 288 A TEXTBOOK OF MEDICAL INSTRUMENTS EXTREMITIES The normal peripheral arterial waveforms have a triphasic shape with a forward, a reverse and a second forward flow component. Distal to an arterial stenosis the waveform is dampened, i.e., the peak is flattened and delayed, and the reverse flow component is reduced or absent. The waveforms can be analysed subjectively by observing the morphological changes in the shape of the waveform or they can be analysed by a variety of quantitative methods. Of fundamental importance in quantitative analysis is the dependence of the waveform frequency on the probe angle. With a CW Doppler system this angle cannot be determined with sufficient accuracy, and consequently any quantitative index derived form the Doppler waveform should be independent of the angle. Further, the maximum frequency waveform derived from the real-time spectral display is generally used since it avoids the artifacts and errors that are frequently introduced in the calculation of the main waveform as described above. Of the reported quantitative indices, pulsatility index (PI), Laplace transform indices and principal component analysis have shown the best correlation with the results of arteriography and direct pressure measurement. Downstream from a stenosis where disturbed flow occurs, broadening of the spectrum particularly in the region of peak systole occurs. A simple quantitative measure of the degree of spectral broadening, that is approximately independent of the angle of insonation, is the spectral broadening index ( SBI). This is defined in terms of the maximum and mean waveforms. SBI = ( maximum mean)/maximum While this index varies throughout the cardiac cycle, it appears that the greatest sensitivity to disease occurs in the region of peak systole. With a duplex scanner, the B-scan image and the Doppler spectral waveform are interpreted together. STRUCTURE OF COLOR DOPPLER IMAGE This is a combination of 2-D echocardiograph image and the pulsed wave Doppler signal processed pattern. Pulsed Doppler permits finding the velocity within a sample volume at a known distance from the transducer. By pulsing at a known frequency (PRF) and knowing speed of sound in the tissue, we find the depth of returning shifted frequency signal. In conventional Doppler mode, velocities are typically displayed in spectral form for a single sample volume of interest over time. The Spectrogram is a time course of spectral data, plotted with time in the X axis and the frequency components of the signal shown in intensity modulated form in the Y axis. Thus, each vertical line can have, for instance, 128 points which correspond to frequency shifts from 0 to 8 KHz in a typical cardiac chamber blood velocity pattern by insonation. (Fig. 8.31). There are 128 points positive and 128 points negative, which corresponds to positive frequency shifts (particles moving towards the transducer) and negative frequency shifts (particles moving away from transducer).
41 ULTRASOUND MEDICAL DIAGNOSTIC INSTRUMENTATION 289 Fig In this continuous-wave doppler spectral tracing, the diastolic slope of the waveform is shallow, implying mild aortic regurgitation. AR = aortic regurgitation ; MS = mitral stenosis. The simplest scheme is a greyscale display in which either the amplitude or the power of the Doppler spectra is converted into a proportional change in the CRT intensity. In practice it is found that approximately 10 greyscale levels can be discriminated. Different spectral amplitudes can also be represented by different colour hues. It is not clear that there are any advantages to this form of real time spectral displays. However, for Doppler flow imaging systems, a colour display is vital. A fairly high-resolution display ( pixels ) for real time display has considerably enhanced computational power. To plot the magnitude at any frequency, intensity modulation is employed, by choosing several levels of grey, from dark representing that the amplitude of that frequency is large and white representing a zero value at that frequency bin. The spectrogram plot is shown in present machines as a real time display, because it is possible to evaluate the spectrum of the Doppler signal fast, since the time scale of X axis movement is relatively slow only in a cardiac cycle of action. Fig shows the Spectrogram of the Doppler signal as a real time signal display. MULTI-GATED DOPPLER DISPLAY The difference between simple pulsed Doppler and the Colour Doppler is shown in the illustration below.
42 290 A TEXTBOOK OF MEDICAL INSTRUMENTS With the multi-gated Doppler scan line of 128 sample volumes, it would require 128 different velocity spectra to display all of the data versus a time X-axis. Such a display is not possible because of its complexity. So, Colour encoding is employed. Velocities are assigned varying colour intensities corresponding to a colour bar. A TYPICAL DOPPLER-ULTRASOUND BASED HEART BEAT MONITOR The normal human heart carries out its pumping action over 100,000 times every day. Generating its own electric signals to actuate the heart muscles, the heart contracts and relaxes during each beat. We will discuss here, about how one can convert the heart s motion into audio sound using ultrasound electronics with our Doppler ultrasonic stethoscope. The acoustical society of America described how cardiac functions could be inspected by the Doppler ultrasound using a frequency of about 2 MHz even in The Doppler effect is the change in frequency of sound, light or radio waves that occurs when a transmitter or receiver are in motion relative to each other. When a transducer sends an ultrasonic beam into the body, a portion of the energy is reflected back by internal body structures. If the structure moves, the frequency of the reflected bam is also changed in proportion to the velocity of the movement. This technology was developed about forty years ago. This technique is most valuable and completely harmless tool for non-invasive examination of movements inside the body by the medical profession. Experiments have shown that beaming of very low energy high frequency sound into the body is not harmful. The technique is used all in the universe for listening the heart beat of unborn babies in a mother s womb. It is possible to listen to the characteristic Doppler sounds from your own heart which can be heard with an easily built Doppler ultrasonic stethoscope. In this unit, Piezo electric crystals have been used for measuring the heart rate. THE DOPPLER STETHOSCOPE The basic component of the stethoscope is the transducer. This transducer contains two lead zirconate - titanate piezoelectric crystals. One of the crystals is energized by the output of 2.25 MHz oscillator/amplifier so that it expands and contracts at that frequency, setting up pressure or sound waves that are transmitted into the body. When that wave, which is directional, passes form one medium to another medium in the body, a portion is reflected back to the second crystal which generates a voltage. If the reflecting surface is stationary, the voltage generated by the receiving crystal has the same frequency as the transmitted wave. If the reflecting surface is moving away from the transducer, the reflected frequency is lower than the transmitted wave. Similarly, if the reflecting surface is moving towards the transducer, the reflected frequency is higher. By mixing a portion of the transmited frequency with the received frequency, the received
43 ULTRASOUND MEDICAL DIAGNOSTIC INSTRUMENTATION 291 frequency is modulated in both frequency and amplitude. Using an amplitude modulated (AM) detector, one can obtain an audio signal whose frequency is proportional to the velocity of the moving structure within the body. WORKING PRINCIPLE OF THE CIRCUIT DIAGRAM TRANSMITTER CIRCUIT The transmitter circuit is shown in Fig An RF oscillator which is built around Q1 operates at about 2.25MHz. Positive feedback is provided for the secondary tap in T1 to the emitter of Q1. The frequency is determined by C4 and the inductive tuning of T1. The oscillator output is coupled through C5 to Q2, an inductively tuned RF amplifier. A secondary tap on T2 provides a low- impedance output to drive the transmitter crystal XTAL1 in the transducer. The ultrasonic power generated is less that 15 milliwatts per square centimeter of transducer surface. Fig Shows the transmitter circuit. Q1 is an RF oscillator whose 2.25 MHz frequency is determined by C4 and T1. A secondary tap on T2 provides a low-impedance output to drive XTAL1 in the transducer. RECEIVER AND AUDIO CIRCUIT The receiver and audio circuits are shown in Fig. 8.33a. The receiver uses two identical stages of inductively-tuned RF amplification. The voltage generated in the receiving crystal Xtal-2 is coupled to Q3 through C8. The output of Q3 is coupled to Q4 through C11. The combined RF gain for the two stages is about The modulated Doppler signal is detected by D1 to produce audio frequencies in the Hz range.
44 292 A TEXTBOOK OF MEDICAL INSTRUMENTS Fig. 8.33a. Shows the receiver and audio amplifier. A low power audio amplifier, IC1, can drive one or two head sets. It has a gain of 100, which is set by C17- R16 with some base boost determined by C18, R17, as many of the sounds generated by the Doppler effect are in the low audio range. The volume may be adjusted by the potentiometer R25 at the input IC1. The output of the amplifier goes to J1 where the headset is plugged into. If more than one wants to listen simultaneously, then a Y-Jack can be used. For class room demonstrations, an external amplifier with speakers can be plugged in. TRANSDUCER The transducer is shown in Fig. 8.33b. The two crystals of lead zirconate - titanate are ½ ¼ inch rectangles approximately 1/32 thick. Silver electrodes are deposited on each crystal surface, and a small silver trace is carried around from one side to the other side. So electrical connections to both electrodes can be made on the same side of the crystal. Fine wire is used to take leads from the crystals and are soldered. Minimum lead should be used while soldering so as to avoid the change in resonance characteristic of the crystal. Fig. 8.33b. Transducer construction. Silver-bearing solder is used to avoid lifting the silver electrode from the ceramic crystal surface. Energy conversion is most efficient when crystals are air-backed resulting in energy being radiated from the front of the crystal.
45 ULTRASOUND MEDICAL DIAGNOSTIC INSTRUMENTATION 293 ACOUSTIC IMPEDANCE When dealing with ultrasound, the quantity of characteristic acoustic impedance is used in solving various problems dealing with waveform generation, propagation, and detection. Characteristic acoustic impedance Z is defined as Z = ρc where ρ = the density of the medium in kg/m 3 and c = the velocity of sound in m/s. The characteristic acoustic impedance is therefore expressed as kg/m 3 m/s = kg/m 2 s. To obtain the maximum energy conversion efficiency, the crystals should be acoustically matched with the plastic panel. When two mediums are closely matched, most of the energy will be transmitted through the materials. When an ultrasonic beam meets an interface of dissimilar materials, most of the energy is reflected where there is a large difference in acoustic impedance between the two materials. The acoustic impedance of the crystals is about 30 million and that of the body is 1.5 million, with air being less than 50, all in units of kg/m2s. Because the density of air is so much lower than that of the crystal, and the velocity of sound in air is much slower than of the crystal, almost all the energy is reflected at that interface when the back side of the crystals are in contact with air. That difference in impedance results in most of the energy being radiated from the front of the crystal, and improved sensitivity of the receiving crystal. Since we want most of the energy to be reflected at the rear side of the crystal, it is desirable that most of the energy be transmitted at the front surface of the crystal and into the body. Because the crystals are too fragile to be placed in direct contact with the body, they are cemented with epoxy to a sheet of plastic about 1/ 16 thickness which should have an acoustic impedance between the crystal and the body. This results in more energy being transmitted in the body instead of being reflected at the skin surface. When gluing the crystals to the plastic, be sure to exclude any air from the interface and use a minimum amount of glue. Sheet acrylic of fiberglass such as that used for PC boards or a rigid vinyl sheet all have suitable acoustic impedance and provide the required protection for the crystals. When more sensitivity is required, a dab of ultrasound gel is placed on the transducer face to improve the impedance match and exclude any air that may be trapped between the transducer face and the skin. Water or mineral oil will also work. Fig shows the prototype unit of Doppler-ultrasound heart beat monitor. The transducer is mounted on the end plate of the enclosure with its leads close to their solder pads. The end plates are inserted at the end and then into the slot on the top half of the enclosure. Soldering of leads from the transducers is done at the appropriate terminals. 9V battery may be used. The stethoscope is now ready for use. Frequency counter is connected from the emitter of Q1 to ground. Then DMM is connected with a settings at 10 ma range, between TP1 and Tp2 and turn the instrument on. Current meter should read less than 10 ma. Tune T1 to 2.3 MHz, then alternatively tune T2 and T1 to reduce the current to a minimum. After the tuning is over, the DMM is removed and solder the leads Tp1 and Tp2 together.

46 294 A TEXTBOOK OF MEDICAL INSTRUMENTS Fig Prototype Doppler stethoscope. DMM is connected to the cathode of D1 and ground. Using 5 or 10 volt Range settings, alternatively tune T3 and T4 for a maximum voltage which will between 1 and 2 volts. If you do not have the DMM, you can directly tune stethoscope while listening to your heart. With the transducer and headphones connected to the circuit board, put a little mineral oil or ultrasound gel on the face of the transducer and place the transducer firmly on your chest near your heart. The transducer may be placed between a pair of ribs rather than directly over a rib. Turn the volume up until you hear some Doppler sounds which will probably be low, as well as a hissing noise. Alternatively tune T1-T4 to increase the volume and for decreasing the hissing. TESTING AND USE As discussed earlier, maximum sensitivity is obtained when there is good impedance match between the transducer face and the skin with no air is trapped between them. A liquid gel such as aquasonic is specifically made for this purpose and is available at medical supply stores. Apply a small amount of liquid gel to the transducer surface and place the transducer firmly against the bare chest, several inches to the left of the center and about 10 inches below the shoulder. Place the transducer so that ultrasonic beam passes between two ribs for best transmission. You will hear the sounds associated with movement of heart. Keeping the transducer firmly against the chest and changing the direction of the ultrasonic beam you will hear deterrent sounds depending on what surfaces are in the path of the ultrasonic beam. When you take a deep breath, the sounds may disappear because the lungs fill with air, covering aportion of the heart. As previously noted, air is a poor conductor of high frequency sound.
12/26/2017. Alberto Ardon M.D.
 Alberto Ardon M.D. 1 Preparatory Work Ultrasound Physics http://www.nysora.com/mobile/regionalanesthesia/foundations-of-us-guided-nerve-blockstechniques/index.1.html Basic Ultrasound Handling https://www.youtube.com/watch?v=q2otukhrruc
The physics of ultrasound. Dr Graeme Taylor Guy s & St Thomas NHS Trust
 The physics of ultrasound Dr Graeme Taylor Guy s & St Thomas NHS Trust Physics & Instrumentation Modern ultrasound equipment is continually evolving This talk will cover the basics What will be covered?
Lesson 06: Pulse-echo Imaging and Display Modes. These lessons contain 26 slides plus 15 multiple-choice questions.
 Lesson 06: Pulse-echo Imaging and Display Modes These lessons contain 26 slides plus 15 multiple-choice questions. These lesson were derived from pages 26 through 32 in the textbook: ULTRASOUND IMAGING
Introduction to Ultrasound Physics
 Introduction to Ultrasound Physics Vassilis Sboros Medical Physics and Cardiovascular Sciences University of Edinburgh Transverse waves Water remains in position Disturbance traverse producing more wave
Medical Imaging (EL582/BE620/GA4426)
") Medical Imaging (EL582/BE620/GA4426) Jonathan Mamou, PhD Riverside Research Lizzi Center for Biomedical Engineering New York, NY jmamou@riversideresearch.org On behalf of Prof. Daniel Turnbull Outline
Medical Imaging (EL582/BE620/GA4426) Jonathan Mamou, PhD Riverside Research Lizzi Center for Biomedical Engineering New York, NY jmamou@riversideresearch.org On behalf of Prof. Daniel Turnbull Outline
Physics of Ultrasound Ultrasound Imaging and Artifacts รศ.นพ.เดโช จ กราพาน ชก ล สาขาหท ยว ทยา, ภาคว ชาอาย รศาสตร คณะแพทยศาสตร ศ ร ราชพยาบาล
 Physics of Ultrasound Ultrasound Imaging and Artifacts รศ.นพ.เดโช จ กราพาน ชก ล สาขาหท ยว ทยา, ภาคว ชาอาย รศาสตร คณะแพทยศาสตร ศ ร ราชพยาบาล Diagnosis TTE TEE ICE 3D 4D Evaluation of Cardiac Anatomy Hemodynamic
INTRODUCTION. Have applications for imaging, detection and navigation.
 ULTRASONICS INTRODUCTION The word ultrasonic combines the Latin roots ultra - beyond sonic - sound. Having frequencies above the audible range i.e. above 20000Hz Have applications for imaging, detection
3. Ultrasound Imaging(2)
") 3. Ultrasound Imaging(2) Lecture 13, 14 Medical Imaging Systems Jae Gwan Kim, Ph.D. jaekim@gist.ac.kr, X 2220 Department of BioMedical Science and Engineering Gwangju Institute of Sciences and Technology
3. Ultrasound Imaging(2) Lecture 13, 14 Medical Imaging Systems Jae Gwan Kim, Ph.D. jaekim@gist.ac.kr, X 2220 Department of BioMedical Science and Engineering Gwangju Institute of Sciences and Technology
Doppler in Obstetrics: book by K Nicolaides, G Rizzo, K Hecher. Chapter on Doppler ultrasound: principles and practice by Colin Deane
 Doppler in Obstetrics: book by K Nicolaides, G Rizzo, K Hecher Chapter on Doppler ultrasound: principles and practice by Colin Deane INTRODUCTION Competent use of Doppler ultrasound techniques requires
Laboratory Exercise 6 THE OSCILLOSCOPE
 Introduction Laboratory Exercise 6 THE OSCILLOSCOPE The aim of this exercise is to introduce you to the oscilloscope (often just called a scope), the most versatile and ubiquitous laboratory measuring
Ultrasonic Linear Array Medical Imaging System
 Ultrasonic Linear Array Medical Imaging System R. K. Saha, S. Karmakar, S. Saha, M. Roy, S. Sarkar and S.K. Sen Microelectronics Division, Saha Institute of Nuclear Physics, 1/AF Bidhannagar, Kolkata-700064.
Nuove tecnologie per ecografia ad ultrasuoni: da 2D a 4D
 DINFO Dipartimento di Ingegneria dell Informazione Department of Information Engineering Nuove tecnologie per ecografia ad ultrasuoni: da 2D a 4D Piero Tortoli Microelectronics Systems Design Lab 1 Introduction
Exercise 1-3. Radar Antennas EXERCISE OBJECTIVE DISCUSSION OUTLINE DISCUSSION OF FUNDAMENTALS. Antenna types
 Exercise 1-3 Radar Antennas EXERCISE OBJECTIVE When you have completed this exercise, you will be familiar with the role of the antenna in a radar system. You will also be familiar with the intrinsic characteristics
Retrospective Transmit Beamformation. Whitepaper. ACUSON SC2000 Volume Imaging Ultrasound System. Answers for life.
 Whitepaper Retrospective Transmit Beamformation ACUSON SC2000 Volume Imaging Ultrasound System Chuck Bradley, Ph.D. Siemens Healthcare Sector Ultrasound Business Unit Mountain View, California USA Answers
Sonic Distance Sensors
 Sonic Distance Sensors Introduction - Sound is transmitted through the propagation of pressure in the air. - The speed of sound in the air is normally 331m/sec at 0 o C. - Two of the important characteristics
Chapter 4. Pulse Echo Imaging. where: d = distance v = velocity t = time
 Chapter 4 Pulse Echo Imaging Ultrasound imaging systems are based on the principle of pulse echo imaging. These systems require the use of short pulses of ultrasound to create two-dimensional, sectional
4 Working With Scan Modes
 4 Working With Scan Modes Scan Modes Overview All of the information in this chapter pertains to live imaging. Many of the controls and functions change when you freeze the scan. For information on using
Lesson 12: Doppler Principles. This lesson contains 50 slides plus 26 multiple-choice questions.
 Lesson 12: Doppler Principles This lesson contains 50 slides plus 26 multiple-choice questions. Accompanying text for the slides in this lesson can be found on pages 59 through 80 in the textbook: DOPPLER
The Physics of Echo. The Physics of Echo. The Physics of Echo Is there pericardial calcification? 9/30/13
 Basic Ultrasound Physics Kirk Spencer MD Speaker has no disclosures to make Sound Audible range 20Khz Medical ultrasound Megahertz range Advantages of imaging with ultrasound Directed as a beam Tomographic
Artifacts. Artifacts. Causes. Imaging assumptions. Common terms used to describe US images. Common terms used to describe US images
 Artifacts Artifacts Chapter 20 What are they? Simply put they are an error in imaging These artifacts include reflections that are: not real incorrect shape, size or position incorrect brightness displayed
The Discussion of this exercise covers the following points:
 Exercise 3-2 Frequency-Modulated CW Radar EXERCISE OBJECTIVE When you have completed this exercise, you will be familiar with FM ranging using frequency-modulated continuous-wave (FM-CW) radar. DISCUSSION
Exercise 1-4. The Radar Equation EXERCISE OBJECTIVE DISCUSSION OUTLINE DISCUSSION OF FUNDAMENTALS
 Exercise 1-4 The Radar Equation EXERCISE OBJECTIVE When you have completed this exercise, you will be familiar with the different parameters in the radar equation, and with the interaction between these
Department of Electrical and Computer Engineering. Laboratory Experiment 1. Function Generator and Oscilloscope
 Department of Electrical and Computer Engineering Laboratory Experiment 1 Function Generator and Oscilloscope The purpose of this first laboratory assignment is to acquaint you with the function generator
Ultrasound & Artifacts
 ISSN 2005-7881 Journal of Neurosonology 3(Suppl. 2):1-17, 2011 Ultrasound & Artifacts Siryung Han The Catholic University of Korea Artifacts False image- echoes without anatomic correlate US image dose
ELEC3242 Communications Engineering Laboratory Amplitude Modulation (AM)
") ELEC3242 Communications Engineering Laboratory 1 ---- Amplitude Modulation (AM) 1. Objectives 1.1 Through this the laboratory experiment, you will investigate demodulation of an amplitude modulated (AM)
ELEC3242 Communications Engineering Laboratory 1 ---- Amplitude Modulation (AM) 1. Objectives 1.1 Through this the laboratory experiment, you will investigate demodulation of an amplitude modulated (AM)
Photomultiplier Tube
 Nuclear Medicine Uses a device known as a Gamma Camera. Also known as a Scintillation or Anger Camera. Detects the release of gamma rays from Radionuclide. The radionuclide can be injected, inhaled or
Ultrasound Physics. History: Ultrasound 2/13/2019. Ultrasound
 Ultrasound Physics History: Ultrasound Ultrasound 1942: Dr. Karl Theodore Dussik transmission ultrasound investigation of the brain 1949-51: Holmes and Howry subject submerged in water tank to achieve
Ultrasound Imaging Ultr Michael Dadd 2007
 Ultrasound Imaging Ultrasound Physics & Instrumentation - Recommended Reading 1. Diagnostic Ultrasound: Principles and Instruments (7th Ed) Frederick W Kremkau W B Saunders Company 2. Applied Physics &
Multi-spectral acoustical imaging
 Multi-spectral acoustical imaging Kentaro NAKAMURA 1 ; Xinhua GUO 2 1 Tokyo Institute of Technology, Japan 2 University of Technology, China ABSTRACT Visualization of object through acoustic waves is generally
Ultrasound Bioinstrumentation. Topic 2 (lecture 3) Beamforming
 Beamforming") Ultrasound Bioinstrumentation Topic 2 (lecture 3) Beamforming Angular Spectrum 2D Fourier transform of aperture Angular spectrum Propagation of Angular Spectrum Propagation as a Linear Spatial Filter Free
Ultrasound Bioinstrumentation Topic 2 (lecture 3) Beamforming Angular Spectrum 2D Fourier transform of aperture Angular spectrum Propagation of Angular Spectrum Propagation as a Linear Spatial Filter Free
Ultrasonic Level Detection Technology. ultra-wave
 Ultrasonic Level Detection Technology ultra-wave 1 Definitions Sound - The propagation of pressure waves through air or other media Medium - A material through which sound can travel Vacuum - The absence
Medical Imaging. X-rays, CT/CAT scans, Ultrasound, Magnetic Resonance Imaging
 Medical Imaging X-rays, CT/CAT scans, Ultrasound, Magnetic Resonance Imaging From: Physics for the IB Diploma Coursebook 6th Edition by Tsokos, Hoeben and Headlee And Higher Level Physics 2 nd Edition
Ultrasound Beamforming and Image Formation. Jeremy J. Dahl
 Ultrasound Beamforming and Image Formation Jeremy J. Dahl Overview Ultrasound Concepts Beamforming Image Formation Absorption and TGC Advanced Beamforming Techniques Synthetic Receive Aperture Parallel
The Middle East Distributor for AMBISEA Technology Corp. Electro-Medical Product Line
 The Middle East Distributor for AMBISEA Technology Corp. Electro-Medical Product Line AV-9100 Single Channel ECG 1 2 AV-9300 3-Channels ECG 3 4 5 AV-9000B Multi-Parameter Patient Monitor 6 7 8 AV-9000C
R. J. Jones College of Optical Sciences OPTI 511L Fall 2017
 R. J. Jones College of Optical Sciences OPTI 511L Fall 2017 Active Modelocking of a Helium-Neon Laser The generation of short optical pulses is important for a wide variety of applications, from time-resolved
Pulse Doppler Flow-Dop
 EDUCATION Pulse Doppler Flow-Dop GAMPT-50100 User Manual Fon: +49 (0) 3461-278 691-0 Fax: +49 (0) 3461-278 691-101 email: info@gampt.de Gesellschaft für Angewandte Medizinische Physik und Technik mbh (GAMPT
Introduction to Medical Engineering (Medical Imaging) Ultrasound Imaging. Ho Kyung Kim Pusan National University
 Ultrasound Imaging. Ho Kyung Kim Pusan National University") Introduction to Medical Engineering (Medical Imaging) Suetens 6 Ultrasound Imaging Ho Kyung Kim Pusan National University Sound Sonic: 20 Hz 20 khz (audible frequency) Subsonic () Ultrasound
Introduction to Medical Engineering (Medical Imaging) Suetens 6 Ultrasound Imaging Ho Kyung Kim Pusan National University Sound Sonic: 20 Hz 20 khz (audible frequency) Subsonic () Ultrasound
THE BENEFITS OF DSP LOCK-IN AMPLIFIERS
 THE BENEFITS OF DSP LOCK-IN AMPLIFIERS If you never heard of or don t understand the term lock-in amplifier, you re in good company. With the exception of the optics industry where virtually every major
OPERATING MANUAL. 100 MHz CENTER FREQUENCY OFF AXIS ACOUSTO-OPTIC BEAM DEFLECTOR MODEL NUMBER: DEG-.51 DOCUMENT NUMBER: 51A12229A
 OPERATING MANUAL 100 MHz CENTER FREQUENCY OFF AXIS ACOUSTO-OPTIC BEAM DEFLECTOR MODEL NUMBER: DOCUMENT NUMBER: 51A12229A Document approved for release: W Seale Date: 8/18/06 US OFFICE: NEOS Technologies,
MAKING TRANSIENT ANTENNA MEASUREMENTS
 MAKING TRANSIENT ANTENNA MEASUREMENTS Roger Dygert, Steven R. Nichols MI Technologies, 1125 Satellite Boulevard, Suite 100 Suwanee, GA 30024-4629 ABSTRACT In addition to steady state performance, antennas
Blood Flow Analysis Using Ultrasound Doppler Technique
 IOSR Journal of Electronics and Communication Engineering (IOSR-JECE) e-issn: 2278-2834,p- ISSN: 2278-8735.Volume 10, Issue 5, Ver. I (Sep - Oct.2015), PP 31-35 www.iosrjournals.org Blood Flow Analysis
Standard Guide for Evaluating Characteristics of Ultrasonic Search Units 1
 Designation: E 1065 99 An American National Standard Standard Guide for Evaluating Characteristics of Ultrasonic Search Units 1 This standard is issued under the fixed designation E 1065; the number immediately
Optimisation of Image Acquisition Bordeaux 16th November J.S. McGhie W.B. Vletter R. Frowijn No disclosures
 Optimisation of Image Acquisition Bordeaux 16th November 2016 J.S. McGhie W.B. Vletter R. Frowijn No disclosures Image optimisation: The Echo machine It looks difficult to drive an echo machine!! Some
UNIT 8 : MTI AND PULSE DOPPLAR RADAR LECTURE 1
 UNIT 8 : MTI AND PULSE DOPPLAR RADAR LECTURE 1 The ability of a radar receiver to detect a weak echo signal is limited by the noise energy that occupies the same portion of the frequency spectrum as does
Lesson 06: Pulse-echo Imaging and Display Modes. This lesson contains 22 slides plus 15 multiple-choice questions.
 Lesson 06: Pulse-echo Imaging and Display Modes This lesson contains 22 slides plus 15 multiple-choice questions. Accompanying text for the slides in this lesson can be found on pages 26 through 32 in
Application Note (A12)
") Application Note (A2) The Benefits of DSP Lock-in Amplifiers Revision: A September 996 Gooch & Housego 4632 36 th Street, Orlando, FL 328 Tel: 47 422 37 Fax: 47 648 542 Email: sales@goochandhousego.com
Application Note (A2) The Benefits of DSP Lock-in Amplifiers Revision: A September 996 Gooch & Housego 4632 36 th Street, Orlando, FL 328 Tel: 47 422 37 Fax: 47 648 542 Email: sales@goochandhousego.com
1.6 Beam Wander vs. Image Jitter
 8 Chapter 1 1.6 Beam Wander vs. Image Jitter It is common at this point to look at beam wander and image jitter and ask what differentiates them. Consider a cooperative optical communication system that
Vixar High Power Array Technology
 Vixar High Power Array Technology I. Introduction VCSELs arrays emitting power ranging from 50mW to 10W have emerged as an important technology for applications within the consumer, industrial, automotive
Real-Time Scanning Goniometric Radiometer for Rapid Characterization of Laser Diodes and VCSELs
 Real-Time Scanning Goniometric Radiometer for Rapid Characterization of Laser Diodes and VCSELs Jeffrey L. Guttman, John M. Fleischer, and Allen M. Cary Photon, Inc. 6860 Santa Teresa Blvd., San Jose,
(Refer Slide Time: 00:10)
") Fundamentals of optical and scanning electron microscopy Dr. S. Sankaran Department of Metallurgical and Materials Engineering Indian Institute of Technology, Madras Module 03 Unit-6 Instrumental details
Fundamentals of optical and scanning electron microscopy Dr. S. Sankaran Department of Metallurgical and Materials Engineering Indian Institute of Technology, Madras Module 03 Unit-6 Instrumental details
Keywords: Ultrasonic Testing (UT), Air-coupled, Contact-free, Bond, Weld, Composites
, Air-coupled, Contact-free, Bond, Weld, Composites") Single-Sided Contact-Free Ultrasonic Testing A New Air-Coupled Inspection Technology for Weld and Bond Testing M. Kiel, R. Steinhausen, A. Bodi 1, and M. Lucas 1 Research Center for Ultrasonics - Forschungszentrum
Single-Sided Contact-Free Ultrasonic Testing A New Air-Coupled Inspection Technology for Weld and Bond Testing M. Kiel, R. Steinhausen, A. Bodi 1, and M. Lucas 1 Research Center for Ultrasonics - Forschungszentrum
electrical noise and interference, environmental changes, instrument resolution, or uncertainties in the measurement process itself.
 MUST 382 / EELE 491 Spring 2014 Basic Lab Equipment and Measurements Electrical laboratory work depends upon various devices to supply power to a circuit, to generate controlled input signals, and for
Resonance Tube. 1 Purpose. 2 Theory. 2.1 Air As A Spring. 2.2 Traveling Sound Waves in Air
 Resonance Tube Equipment Capstone, complete resonance tube (tube, piston assembly, speaker stand, piston stand, mike with adapters, channel), voltage sensor, 1.5 m leads (2), (room) thermometer, flat rubber
Set No.1. Code No: R
 Set No.1 IV B.Tech. I Semester Regular Examinations, November -2008 RADAR SYSTEMS ( Common to Electronics & Communication Engineering and Electronics & Telematics) Time: 3 hours Max Marks: 80 Answer any
Frequency Agility and Barrage Noise Jamming
 Exercise 1-3 Frequency Agility and Barrage Noise Jamming EXERCISE OBJECTIVE To demonstrate frequency agility, a radar electronic protection is used against spot noise jamming. To justify the use of barrage
Television and video engineering
 Television and video engineering Unit-4 Television Receiver systems Objectives: To learn the requirements of TV receiver Study of monochrome and Colour TV receivers. To learn functions of Tuning circuits
Section 1: Sound. Sound and Light Section 1
 Sound and Light Section 1 Section 1: Sound Preview Key Ideas Bellringer Properties of Sound Sound Intensity and Decibel Level Musical Instruments Hearing and the Ear The Ear Ultrasound and Sonar Sound
Ihor TROTS, Andrzej NOWICKI, Marcin LEWANDOWSKI
 ARCHIVES OF ACOUSTICS 33, 4, 573 580 (2008) LABORATORY SETUP FOR SYNTHETIC APERTURE ULTRASOUND IMAGING Ihor TROTS, Andrzej NOWICKI, Marcin LEWANDOWSKI Institute of Fundamental Technological Research Polish
Ques on (2): [18 Marks] a) Draw the atrial synchronous Pacemaker block diagram and explain its operation. Benha University June 2013
![Ques on (2): [18 Marks] a) Draw the atrial synchronous Pacemaker block diagram and explain its operation. Benha University June 2013](/thumbs/87/96832478.jpg "Ques on (2): [18 Marks] a) Draw the atrial synchronous Pacemaker block diagram and explain its operation. Benha University June 2013") Benha University June 2013 Benha Faculty of Engineering Electrical Department Hospital Instrumentations (E472) 4 Th year (control) Dr.Waleed Abdel Aziz Salem Time: 3 Hrs Answer the following questions.
Benha University June 2013 Benha Faculty of Engineering Electrical Department Hospital Instrumentations (E472) 4 Th year (control) Dr.Waleed Abdel Aziz Salem Time: 3 Hrs Answer the following questions.
INSPECTION OF THERMAL BARRIERS OF PRIMARY PUMPS WITH PHASED ARRAY PROBE AND PIEZOCOMPOSITE TECHNOLOGY
 INSPECTION OF THERMAL BARRIERS OF PRIMARY PUMPS WITH PHASED ARRAY PROBE AND PIEZOCOMPOSITE TECHNOLOGY J. Poguet Imasonic S.A. France E. Abittan EDF-GDL France Abstract In order to meet the requirements
UNIT 2. Q.1) Describe the functioning of standard signal generator. Ans. Electronic Measurements & Instrumentation
 Describe the functioning of standard signal generator. Ans. Electronic Measurements & Instrumentation") UNIT 2 Q.1) Describe the functioning of standard signal generator Ans. STANDARD SIGNAL GENERATOR A standard signal generator produces known and controllable voltages. It is used as power source for the
UNIT 2 Q.1) Describe the functioning of standard signal generator Ans. STANDARD SIGNAL GENERATOR A standard signal generator produces known and controllable voltages. It is used as power source for the
EXPERIMENT 1 PRELIMINARY MATERIAL
 EXPERIMENT 1 PRELIMINARY MATERIAL BREADBOARD A solderless breadboard, like the basic model in Figure 1, consists of a series of square holes, and those columns of holes are connected to each other via
Lesson 02: Sound Wave Production. This lesson contains 24 slides plus 11 multiple-choice questions.
 Lesson 02: Sound Wave Production This lesson contains 24 slides plus 11 multiple-choice questions. Accompanying text for the slides in this lesson can be found on pages 2 through 7 in the textbook: ULTRASOUND
ACOUSTIC MICRO IMAGING ANALYSIS METHODS FOR 3D PACKAGES
 ACOUSTIC MICRO IMAGING ANALYSIS METHODS FOR 3D PACKAGES Janet E. Semmens Sonoscan, Inc. Elk Grove Village, IL, USA Jsemmens@sonoscan.com ABSTRACT Earlier studies concerning evaluation of stacked die packages
ISO INTERNATIONAL STANDARD. Non-destructive testing Ultrasonic inspection Evaluating electronic characteristics of ultrasonic test instruments
 INTERNATIONAL STANDARD ISO 12710 First edition 2002-09-15 Non-destructive testing Ultrasonic inspection Evaluating electronic characteristics of ultrasonic test instruments Essais non destructifs Contrôle
Ultrasonics. Introduction
 Ultrasonics Introduction Ultrasonics is the term used to describe those sound waves whose frequency is above the audible range of human ear upward from approximately 20kHz to several MHz. The ultrasonics
Module 1: Introduction to Experimental Techniques Lecture 2: Sources of error. The Lecture Contains: Sources of Error in Measurement
 The Lecture Contains: Sources of Error in Measurement Signal-To-Noise Ratio Analog-to-Digital Conversion of Measurement Data A/D Conversion Digitalization Errors due to A/D Conversion file:///g /optical_measurement/lecture2/2_1.htm[5/7/2012
Understanding How Frequency, Beam Patterns of Transducers, and Reflection Characteristics of Targets Affect the Performance of Ultrasonic Sensors
 Characteristics of Targets Affect the Performance of Ultrasonic Sensors By Donald P. Massa, President and CTO of Massa Products Corporation Overview of How an Ultrasonic Sensor Functions Ultrasonic sensors
Optical coherence tomography
 Optical coherence tomography Peter E. Andersen Optics and Plasma Research Department Risø National Laboratory E-mail peter.andersen@risoe.dk Outline Part I: Introduction to optical coherence tomography
UGEO H60. Performance in Style. Features
 UGEO H60 Performance in Style The UGEO H60 implements superior performance with new design principles of simplicity and lightness. Its 10.1" touchscreen improves usability while its 18.5" LED monitor enhances
Getting Started. MSO/DPO Series Oscilloscopes. Basic Concepts
 Getting Started MSO/DPO Series Oscilloscopes Basic Concepts 001-1523-00 Getting Started 1.1 Getting Started What is an oscilloscope? An oscilloscope is a device that draws a graph of an electrical signal.
EE 201 Function / Arbitrary Waveform Generator and Oscilloscope Tutorial
 EE 201 Function / Arbitrary Waveform Generator and Oscilloscope Tutorial 1 This is a programmed learning instruction manual. It is written for the Agilent DSO3202A Digital Storage Oscilloscope. The prerequisite
The Lightwave Model 142 CW Visible Ring Laser, Beam Splitter, Model ATM- 80A1 Acousto-Optic Modulator, and Fiber Optic Cable Coupler Optics Project
 The Lightwave Model 142 CW Visible Ring Laser, Beam Splitter, Model ATM- 80A1 Acousto-Optic Modulator, and Fiber Optic Cable Coupler Optics Project Stephen W. Jordan Seth Merritt Optics Project PH 464
Standard Guide for Evaluating Performance Characteristics of Phased-Array Ultrasonic Testing Instruments and Systems 1
 Designation: E2491 08 Standard Guide for Evaluating Performance Characteristics of Phased-Array Ultrasonic Testing Instruments and Systems 1 This standard is issued under the fixed designation E2491; the
Resonance Tube Lab 9
 HB 03-30-01 Resonance Tube Lab 9 1 Resonance Tube Lab 9 Equipment SWS, complete resonance tube (tube, piston assembly, speaker stand, piston stand, mike with adaptors, channel), voltage sensor, 1.5 m leads
SA210-Series Scanning Fabry Perot Interferometer
 435 Route 206 P.O. Box 366 PH. 973-579-7227 Newton, NJ 07860-0366 FAX 973-300-3600 www.thorlabs.com technicalsupport@thorlabs.com SA210-Series Scanning Fabry Perot Interferometer DESCRIPTION: The SA210
FRAUNHOFER AND FRESNEL DIFFRACTION IN ONE DIMENSION
 FRAUNHOFER AND FRESNEL DIFFRACTION IN ONE DIMENSION Revised November 15, 2017 INTRODUCTION The simplest and most commonly described examples of diffraction and interference from two-dimensional apertures
Device Interconnection
 Device Interconnection An important, if less than glamorous, aspect of audio signal handling is the connection of one device to another. Of course, a primary concern is the matching of signal levels and
Elizabethtown College Department of Physics and Engineering PHY104. Lab # 9- Oscilloscope and RC Circuit
 Elizabethtown College Department of Physics and Engineering PHY104 Lab # 9- Oscilloscope and RC Circuit Introduction This lab introduces you to very important tools, the oscilloscope and the waveform generator.
DEPARTMENT OF INFORMATION ENGINEERING. Test No. 1. Introduction to Scope Measurements. 1. Correction. Term Correction. Term...
 2. Correction. Correction Report University of Applied Sciences Hamburg Group No : DEPARTMENT OF INFORMATION ENGINEERING Laboratory for Instrumentation and Measurement L: in charge of the report Test No.
Rec. ITU-R F RECOMMENDATION ITU-R F *
 Rec. ITU-R F.162-3 1 RECOMMENDATION ITU-R F.162-3 * Rec. ITU-R F.162-3 USE OF DIRECTIONAL TRANSMITTING ANTENNAS IN THE FIXED SERVICE OPERATING IN BANDS BELOW ABOUT 30 MHz (Question 150/9) (1953-1956-1966-1970-1992)
Be aware that there is no universal notation for the various quantities.
 Fourier Optics v2.4 Ray tracing is limited in its ability to describe optics because it ignores the wave properties of light. Diffraction is needed to explain image spatial resolution and contrast and
Models 296 and 295 combine sophisticated
 Established 1981 Advanced Test Equipment Rentals www.atecorp.com 800-404-ATEC (2832) Models 296 and 295 50 MS/s Synthesized Multichannel Arbitrary Waveform Generators Up to 4 Independent Channels 10 Standard
Virtual ultrasound sources
 CHAPTER SEVEN Virtual ultrasound sources One of the drawbacks of the generic synthetic aperture, the synthetic transmit aperture, and recursive ultrasound imaging is the low signal-to-noise ratio (SNR)
FPGA-BASED CONTROL SYSTEM OF AN ULTRASONIC PHASED ARRAY
 The 10 th International Conference of the Slovenian Society for Non-Destructive Testing»Application of Contemporary Non-Destructive Testing in Engineering«September 1-3, 009, Ljubljana, Slovenia, 77-84
Implementation of Orthogonal Frequency Coded SAW Devices Using Apodized Reflectors
 Implementation of Orthogonal Frequency Coded SAW Devices Using Apodized Reflectors Derek Puccio, Don Malocha, Nancy Saldanha Department of Electrical and Computer Engineering University of Central Florida
Fig. 1
 PhysicsAndMathsTutor.com 1 1. Fig. 1 shows data for the intensity of a parallel beam of X-rays after penetration through varying thicknesses of a material. intensity / MW m 2 thickness / mm 0.91 0.40 0.69
Experiment 5 The Oscilloscope
 Experiment 5 The Oscilloscope Vision is the art of seeing things invisible. J. Swift (1667-1745) OBJECTIVE To learn to operate a cathode ray oscilloscope. THEORY The oscilloscope, or scope for short, is
Phased Array Velocity Sensor Operational Advantages and Data Analysis
 Phased Array Velocity Sensor Operational Advantages and Data Analysis Matt Burdyny, Omer Poroy and Dr. Peter Spain Abstract - In recent years the underwater navigation industry has expanded into more diverse
UNIT-3. Electronic Measurements & Instrumentation
 UNIT-3 1. Draw the Block Schematic of AF Wave analyzer and explain its principle and Working? ANS: The wave analyzer consists of a very narrow pass-band filter section which can Be tuned to a particular
COMPUTER PHANTOMS FOR SIMULATING ULTRASOUND B-MODE AND CFM IMAGES
 Paper presented at the 23rd Acoustical Imaging Symposium, Boston, Massachusetts, USA, April 13-16, 1997: COMPUTER PHANTOMS FOR SIMULATING ULTRASOUND B-MODE AND CFM IMAGES Jørgen Arendt Jensen and Peter
HANDBOOK OF ACOUSTIC SIGNAL PROCESSING. BAW Delay Lines
 HANDBOOK OF ACOUSTIC SIGNAL PROCESSING BAW Delay Lines Introduction: Andersen Bulk Acoustic Wave (BAW) delay lines offer a very simple yet reliable means of time delaying a video or RF signal with more
1. Introduction. 2. Concept. reflector. transduce r. node. Kraftmessung an verschiedenen Fluiden in akustischen Feldern
 1. Introduction The aim of this Praktikum is to familiarize with the concept and the equipment of acoustic levitation and to measure the forces exerted by an acoustic field on small spherical objects.
Ultrasonic Time-of-Flight Shift Measurements in Carbon Composite Laminates Containing Matrix Microcracks
 Ultrasonic Time-of-Flight Shift Measurements in Carbon Composite Laminates Containing Matrix Microcracks Ajith Subramanian a, Vinay Dayal b, and Daniel J. Barnard a a CNDE, Iowa State University, Ames,
FREQUENCY AGILE FM MODULATOR INSTRUCTION BOOK IB
 FMT615C FREQUENCY AGILE FM MODULATOR INSTRUCTION BOOK IB1215-02 TABLE OF CONTENTS SECTION SUBJECT 1.0 Introduction 2.0 Installation & Operating Instructions 3.0 Specification 4.0 Functional Description
NEW LASER ULTRASONIC INTERFEROMETER FOR INDUSTRIAL APPLICATIONS B.Pouet and S.Breugnot Bossa Nova Technologies; Venice, CA, USA
 NEW LASER ULTRASONIC INTERFEROMETER FOR INDUSTRIAL APPLICATIONS B.Pouet and S.Breugnot Bossa Nova Technologies; Venice, CA, USA Abstract: A novel interferometric scheme for detection of ultrasound is presented.
Spectral Distance Amplitude Control for Ultrasonic Inspection of Composite Components
 ECNDT 26 - Mo.2.6.4 Spectral Distance Amplitude Control for Ultrasonic Inspection of Composite Components Uwe PFEIFFER, Wolfgang HILLGER, DLR German Aerospace Center, Braunschweig, Germany Abstract. Ultrasonic
Acoustic Velocity Independent Ultrasonic Flow-Meter
 flotek.g 2017- Innovative Solutions in Flow Measurement and Control - Oil, Water and Gas August 28-30, 2017, FCRI, Palakkad, Kerala, India Acoustic Velocity Independent Ultrasonic Flow-Meter ABSTRACT Shalini
EFFECT OF SURFACE COATINGS ON GENERATION OF LASER BASED ULTRASOUND
 EFFECT OF SURFACE COATINGS ON GENERATION OF LASER BASED ULTRASOUND V.V. Shah, K. Balasubramaniam and J.P. Singh+ Department of Aerospace Engineering and Mechanics +Diagnostic Instrumentation and Analysis