SENTINEL-1 Toolbox. Polarimetric Tutorial Issued March 2015 Updated August Luis Veci
|
|
|
- Cameron Blankenship
- 5 years ago
- Views:
Transcription


1 SENTINEL-1 Toolbox Polarimetric Tutorial Issued March 2015 Updated August 2016 Luis Veci Copyright 2015 Array Systems Computing Inc.

2 Polarimetric Tutorial The goal of this tutorial is to provide novice and experienced remote sensing users with step-bystep instructions on working with RADARSAT-2 data with the Sentinel-1 Toolbox. The tools have to be developed with the goal of making polarimetric processing easy to use and intuitive. In this tutorial you will process a Quad Pol RADARSAT-2 product and produce polarimetric classifications of the data. For an introduction to polarimetric concepts, please see the "Radar Polarimetry" chapter of the "Fundamentals of Remote Sensing" tutorial from the Canadian Centre for Remote Sensing (CCRS). Sample Data Sample data for RADARSAT-2 Fine Quad-Pol products supplied by MDA can be found at: ftp://rsat2:yvr578mm@ftp.mda.ca/fine Quad-Pol Dataset/ ftp://rsat2:yvr578mm@ftp.mda.ca/vancouver Dataset For this tutorial, we will use the Vancouver Fine Quad Frame 1 dataset. Vancouver in British Columbia is the third largest metropolitan area in Canada located on the Pacific coast. Vancouver Fine Quad Frame 1 Location in World Map Download the Vancouver_R2_FineQuad15_Frame1_SLC product. Supported Products The toolbox can support Quad Pol SLC products from: RADARSAT-2 TerraSAR-X ALOS PALSAR 1 & 2 The toolbox can support Dual Pol SLC products from: SENTINEL-1 ENVISAT ASAR RADARSAT-2 2
. Step 1 - Open a product: Use the Open Product button in the top toolbar and browse for the location of the Vancouver Fine Quad Frame 1 RADARSAT-2 product. Select the product.")
3 TerraSAR-X ALOS PALSAR 1 & 2 Opening a Quad Pol Product In order to process fully polarimetric data, the input products should be Quad Pol (HH, VV, HV, VH) products and should also be Single Look Complex (SLC). Step 1 - Open a product: Use the Open Product button in the top toolbar and browse for the location of the Vancouver Fine Quad Frame 1 RADARSAT-2 product. Select the product.xml file and press Open Product. If your product is contained within a zip file, the Toolbox will also be able to open the product simply by selecting the zip file. Opening a Product Step 2 - View the product: In the Products View you will see the opened product. Within the product bands you will see four polarizations: VH VV HH HV For each polarization, there will be the complex data i and q bands and two virtual bands for intensity and phase. 3

4 Products View Step 3 - View a band: To view the VH band, double-click on the Intensity_VH band. Zoom in using the mouse wheel and pan by clicking and dragging the left mouse button. 4

5 Pan and zoom to the Vancouver airport area. Creating a Subset Intensity_VH Band To reduce the amount of processing needed, you may create a subset around the particular area in which you are interested. Step 4 - Create a subset from the view: Once you have zoomed and panned to your area of interest, right click on the image view and select Spatial Subset from View in the Context menu. 5


6 Context Menu The subset dialog will automatically select the area you were viewing. 6

7 Specifying Product Subset By default, all bands will be included in the subset. You will need all the bands to do the polarimetric processing. Press OK to create the subset. Calibrating the Data To properly work with the SAR data, the data should first be calibrated. Calibration radiometrically corrects a SAR image so that the pixel values truly represent the radar backscatter of the reflecting surface. The corrections that get applied during calibration are mission-specific, therefore the software will automatically determine what kind of input product you have and what corrections need to be applied based on the product s metadata. Calibration is essential for quantitative use of SAR data. Step 5 - Calibrate the product: From the Radar menu, go to the Radiometric menu and select Calibrate. Radiometric Menu The source product should be your newly created subset. The target product will be the new file you will create. Also select the directory in which the target product will be saved to. 7

8 Calibration Dialog If you don t select any source bands, then the calibration operator will automatically select all real and imaginary (i, q) bands. NOTE For polarimetric processing the data must be complex. By default, the calibration operator will produce real sigma0 bands. To produce complex output, check mark the Save in complex parameter. What Polarimetric Tools are Available? In order to properly exploit the information within polarimetric data, you will need processing tools that convert that data into more useable forms for analysis. The Toolbox includes polarimetric tools for: Polarimetric Matrix Generation Polarimetric Speckle Filtering Polarimetric Decompositions Polarimetric Classification Polarimetric Matrix Generation All the polarimetric tools work with either Coherency or Covariance matrices as input. Starting from a Quad Pol SLC product, you may use the Matrix Generation operator to convert the product into one of the following matrices: Covariance matrix C2 Covariance matrix C3 Covariance matrix C4 Coherency matrix T3 Coherency matrix T4 The Coherency matrix T3 is sometimes preferred because its elements have a physical interpretation (odd-bounce, even-bounce, diffuse, etc.). 8

9 Use the Matrix Generation operator when you would like to explicitly select which matrix to use. For simplicity, a Quad Pol SLC product can be used directly by any polarimetric operator. In such a case, the input Quad Pol will automatically be converted to a T3 matrix. Step 6 - Generate a T3 matrix: Select Polarimetric Matrix Generation from the Polarimetric menu. Polarimetric Menu The source product should be your newly created calibrated subset. The target product will be the new file you will create. Also select the directory in which the target product will be saved to. 9
10 Generate Covariance or Coherency Matrix Dialog In the Processing Parameters tab, select a T3 matrix to convert the Quad Pol product into a Coherency matrix T3. Press Run to begin processing. When the processing completes, a new product will be added to the Products View. You will notice the new bands produced correspond to the elements of the T3 matrix. Polarimetric Speckle Filtering Products View Showing New Bands Produced To clean up some of the speckle inherent in SAR images, you can apply a speckle filter. When working with a single polarized detected or SLC image, you may use the conventional Speckle Filters found in the SAR Processing menu. However, for full polarimetric data, there are polarimetric speckle filters available that take advantage of all bands and preserve the complex information. For polarimetric speckle filtering, the following filters are available: Boxcar Improved Lee Sigma Refined Lee Intensity Driven Adaptive Neighbourhood (IDAN) Step 7 - Apply a Speckle Filter: Select Polarimetric Speckle Filter from the Polarimetric menu. 10


11 Select Polarimetric Speckle Filter In the Processing Parameters tab, select the Refined Lee speckle filter. Press the Help button to call up the online help for further information. Press Run to begin processing. Polarimetric Speckle Filter Dialog When the processing completes, your new speckle filtered product should have the same bands as your T3 product, however the data will have been filtered. 11


12 Open the T11 band in both the T3 product and in new speckle filtered T3 product to compare before and after images. The resulting image will have less speckle but also appear more blurred. Before After To clean up your Products View, you may now right-click on the speckle filtered T3 product and from the popup menu select Close All Others to close all other products and leave only the speckle filtered T3 opened. Closing All Other Products in Products View 12


13 Polarimetric Decompositions Polarimetric decompositions allow the separation of different scattering contributions and can be used to extract information about the scattering process. The following polarimetric decompositions are available: Sinclair Pauli Freeman-Durden Yamaguchi Van Zyl Cloude H-a Alpha Touzi Step 8 - Produce a decomposition: Select Polarimetric Decomposition from the Polarimetric menu. Select Polarimetric Decomposition 13


14 Select the Freeman-Durden decomposition. Freeman-Durden Decomposition Dialog The window size parameter corresponds to the amount of averaging applied to each pixel. Press Run to begin processing. When the processing completes, your new Freeman-Durden decomposition product will have three bands corresponding to double bounce, volume scattering and surface scattering. Products View Showing Freeman-Durden Bands 14


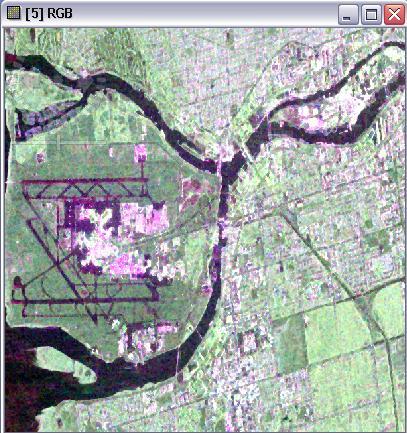
15 Step 9 - View in RGB: You can view all three bands in an RGB colour view by right-clicking on the product name and selecting Open RGB Image View from the popup menu. Viewing Products in RGB Within the RGB channel selection dialog, select the Red, Green, Blue components for the respective bands Freeman_dbl_r, Freeman_vol_g, Freeman_surf_b. Press OK to create the RGB view. Selecting RGB Image Channels 15

16 RGB Freeman-Durden Image The resulting RGB image shows surface scattering in blue from the airport runways, roads and water bodies. Buildings produce double bounce and are shown in red. Vegetation produces volume scattering and is therefore shown in green. Step 10 - Export the RGB as an image: You may now wish to export the colour image to an image file format such as JPEG or PNG to use in a report or presentation. The processed data will usually be saved as Float64 data type. Although it is possible to save JPG, PNG and GeoTIFF files as Float64, the typical image viewing software may expect data to be in UINT8 or UINT16. To convert the data type, select Convert Data Type from the Utilities Data Conversion menu. 16


17 Select Convert Data Type In the Convert Data Type dialog, choose to output UINT8 using linear scaling clipping to 95% of the histogram. 17

.")

18 Select uint8 with Linear Scaling Now you may export the converted product to a common image file format. From the File menu, go to the Product Writers submenu and select Export View (bmp, jpg, png). In the Save dialog, enter the name, location and type of image to export. Exporting an RGB Image to bmp, jpg, png Step 11 - Produce all other Decompositions: Using the speckle filtered T3 as input, repeat the decomposition processing for all other decompositions and compare the results. 18
19 Sinclair Decomposition 19

20 Pauli Decomposition 20
21 Yamaguchi Decomposition 21
22 Van Zyl Decomposition 22
23 Cloude Decomposition 23

24 H-a-Alpha Decomposition To clean up your Products View, you may now right-click on the speckle filtered T3 product and from the pop-up menu select Close All Others to close all other products and leave only the speckle filtered T3 opened. Cleaning up Products View 24

25 Unsupervised Polarimetric Classification Using the speckle filtered T3 product as input, you will now process the unsupervised polarimetric classification to group similar pixels into classes. Unsupervised classification does not rely on user specified classes to be matched. Instead, it automatically determines what classes exist in the data and how best each pixel can be grouped. Step 12 - Apply unsupervised classification: Using the T3 speckle filtered product as input, select Unsupervised Polarimetric Classification from the Polarimetric menu. Select Unsupervised Polarimetric Classification In the Processing Parameters tab, select the Unsupervised Wishart Classification. Press the Help button to call up the online help for further information. 25

26 Press Run to begin processing. Unsupervised Classification Dialog When the processing completes, your new classification results product will have a single band with several regions each belonging to one of nine classes. 26

27 Unsupervised Wishart Classification Both the Cloude-Pottier and the Wishart classifiers are based on the use of the Entropy (H) / Alpha (α) plane. The Wishart classifier will continue to compute the centres of the nine clusters, and then reclassify the pixels based on their Wishart distances to cluster centres. The classes can be interpreted according to the H-α classification plane. 27


28 H-α Classification Plane You may change the default colours for each class within the colour manipulation tool window. Use the pull-down control on the colour to select a new colour. Use the export and import buttons on the right-hand side to save and load colour look-up tables. Colour Manipulation Tool Window 28


29 For more tutorials visit the Sentinel Toolboxes website Send comments to the SNAP Forum 29
SAR IMAGE ANALYSIS FOR MICROWAVE C-BAND FINE QUAD POLARISED RADARSAT-2 USING DECOMPOSITION AND SPECKLE FILTER TECHNIQUE
 SAR IMAGE ANALYSIS FOR MICROWAVE C-BAND FINE QUAD POLARISED RADARSAT-2 USING DECOMPOSITION AND SPECKLE FILTER TECHNIQUE ABSTRACT Mudassar Shaikh Department of Electronics Science, New Arts, Commerce &
Introduction to PolSARpro v3.0
 Introduction to PolSARpro v3.0 Eric POTTIER Tuesday 4 September, Lecture D2PA-2 & D2PB-1 04/09/07 Lecture D2PA-2 & D2PB-1 Introduction to PolSARpro v3.0 Eric POTTIER 1 General Presentation of PolSARpro
Calibration Assessment of RADARSAT-2 Polarimetry Using High Precision Transponders
 Calibration Assessment of RADARSAT-2 Polarimetry Using High Precision Transponders R Touzi, S Côté, RK Hawkins CCRS/CSA Acknowledgments S Nedelcu (CCRS) S Muir (CSA) 1 Outline-Polarimetric RADARSAT-2 Independent
SARscape Modules for ENVI
 Visual Information Solutions SARscape Modules for ENVI Read, process, analyze, and output products from SAR data. ENVI. Easy to Use Tools. Proven Functionality. Fast Results. DEM, based on TerraSAR-X-1
JOURNAL OF INFORMATION, KNOWLEDGE AND RESEARCH IN ELECTRONICS AND COMMUNICATION ENGINEERING
 IMPLEMENTATION OF UNSUPERVISED CLASSIFICATION AND COMBINED CLASSIFICATION BASED ON H/q REGION DIVISION AND WISHART CLASSIFIER ON POLARIMETRIC SAR IMAGE 1 MS, SUSHMA KUMARI, 2 ASSOCIATE PROF. S. D. JOSHI
SAR Othorectification and Mosaicking
 White Paper SAR Othorectification and Mosaicking John Wessels: Senior Scientist PCI Geomatics SAR Othorectification and Mosaicking This study describes the high-speed orthorectification and mosaicking
Enhanced Noise Removal Technique Based on Window Size for SAR Data
 Volume 114 No. 7 2017, 227-235 ISSN: 1311-8080 (printed version); ISSN: 1314-3395 (on-line version) url: http://www.ijpam.eu ijpam.eu Enhanced Noise Removal Technique Based on Window Size for SAR Data
Do It Yourself 3. Speckle filtering
 Do It Yourself 3 Speckle filtering The objectives of this third Do It Yourself concern the filtering of speckle in POLSAR images and its impact on data statistics. 1. SINGLE LOOK DATA STATISTICS 1.1 Data
So S ft f w t a w re T o T ol Po P ls l A S Rpro v5.0. E. E. Po P ttie i r E.Pottier (2013)
") Software Tool PolSARprov5.0 E. Pottier The Polarimetric Polarimetric SAR Data Pro Processing cessing and Educational Tool v5.0 AIRSAR SETHI DCRS PISAR ESAR EMISAR UAV-SAR FSAR CONVAIR PolSARpro v5.0 Software
Software Tool PolSARprov5.0 E. Pottier The Polarimetric Polarimetric SAR Data Pro Processing cessing and Educational Tool v5.0 AIRSAR SETHI DCRS PISAR ESAR EMISAR UAV-SAR FSAR CONVAIR PolSARpro v5.0 Software
Faraday rotation estimation from unfocussed ALOS PALSAR raw data
 Faraday rotation estimation from unfocussed ALOS PALSAR raw data arco Lavalle 1 3, E. Pottier 2, D. Solimini 1, N. iranda 3 1 DISP, Tor Vergata University, Rome, Italy 2 IETR UR CNRS 6164, University of
IMPACT OF BAQ LEVEL ON INSAR PERFORMANCE OF RADARSAT-2 EXTENDED SWATH BEAM MODES
 IMPACT OF BAQ LEVEL ON INSAR PERFORMANCE OF RADARSAT-2 EXTENDED SWATH BEAM MODES Jayson Eppler (1), Mike Kubanski (1) (1) MDA Systems Ltd., 13800 Commerce Parkway, Richmond, British Columbia, Canada, V6V
Co-ReSyF RA lecture: Vessel detection and oil spill detection
 This project has received funding from the European Union s Horizon 2020 Research and Innovation Programme under grant agreement no 687289 Co-ReSyF RA lecture: Vessel detection and oil spill detection
SAR Remote Sensing (Microwave Remote Sensing)
") iirs SAR Remote Sensing (Microwave Remote Sensing) Synthetic Aperture Radar Shashi Kumar shashi@iirs.gov.in Electromagnetic Radiation Electromagnetic radiation consists of an electrical field(e) which
iirs SAR Remote Sensing (Microwave Remote Sensing) Synthetic Aperture Radar Shashi Kumar shashi@iirs.gov.in Electromagnetic Radiation Electromagnetic radiation consists of an electrical field(e) which
Review. Guoqing Sun Department of Geography, University of Maryland ABrief
 Review Guoqing Sun Department of Geography, University of Maryland gsun@glue.umd.edu ABrief Introduction Scattering Mechanisms and Radar Image Characteristics Data Availability Example of Applications
RADARSAT-2/RCM Synthetic Aperture Radar data exploitation for military geomatics via ArcGIS
 RADARSAT-2/RCM Synthetic Aperture Radar data exploitation for military geomatics via ArcGIS Presented by: Greg Barrie, Defence Scientist, DRDC Ottawa October 17, 2018 Defence R&D Canada (DRDC) What we
Radar Polarimetry- Potential for Geosciences
 Radar Polarimetry- Potential for Geosciences Franziska Kersten Department of geology, TU Freiberg Abstract. The ability of Radar Polarimetry to obtain information about physical properties of the surface
 Performance Comparison between Dual Polarimetric and Fully Polarimetric data for DInSAR Subsidence monitoring Dani Monells, Jordi J. Mallorquí Universitat Politècnica de Catalunya, Departament de Teoria
Image Processing Tutorial Basic Concepts
 Image Processing Tutorial Basic Concepts CCDWare Publishing http://www.ccdware.com 2005 CCDWare Publishing Table of Contents Introduction... 3 Starting CCDStack... 4 Creating Calibration Frames... 5 Create
Francesco Holecz. TUBE II meeting - 17 June Land Degradation. Land Degradation
 Land Degradation Francesco Holecz Objective To identify and monitor land degraded areas, in particular those related to agricultural and pastoral activities. Following products are generated: Land cover
Lab 3: Introduction to Image Analysis with ArcGIS 10
 Lab 3: Introduction to Image Analysis with ArcGIS 10 Peter E. Price TerraView 2010 Peter E. Price All rights reserved. Revised 03/2011. Revised for Geob 373 by BK Feb 7, 2017. V9 The information contained
Change detection in cultural landscapes
 9-11 November 2015 ESA-ESRIN, Frascati (Rome), Italy 3 rd ESA-EARSeL Course on Remote Sensing for Archaeology Day 3 Change detection in cultural landscapes DeodatoTapete (1,2) & Francesca Cigna (1,2) (1)
SARscape for ENVI. A Complete SAR Analysis Solution
 SARscape for ENVI A Complete SAR Analysis Solution IDL and ENVI A Foundation for SARscape IDL The Data Analysis & Visualization Platform Data Access: IDL supports virtually every data format, type and
Change Detection using SAR Data
 White Paper Change Detection using SAR Data John Wessels: Senior Scientist PCI Geomatics Change Detection using SAR Data The ability to identify and measure significant changes in target scattering and/or
Lab 7 Julia Janicki. Introduction and methods
 Lab 7 Julia Janicki Introduction and methods The purpose of the lab is to map flood extent after a flooding event that occurred in Houston, Texas. Two Sentinel-1 images with C-band wavelength were used
Image Change Tutorial
 Image Change Tutorial In this tutorial, you will use the Image Change workflow to compare two images of an area over Indonesia that was impacted by the December 26, 2004 tsunami. The first image is a before
Creating a Colour Composite from MERIS L1 Data
 LearnEO! Bilko Tutorial T2.4 www.learn-eo.org/tutorial/ Creating a Colour Composite from MERIS L1 Data Required resources MER_FR 1PNEPA20080812_095210_~.N1 - Envisat MERIS Full Resolution Level 1 data
INTRODUCTION TO SNAP TOOLBOX
 INTRODUCTION TO SNAP TOOLBOX EXERCISE 1 (Exploring S2 data) Data: Sentinel-2A Level 1C: S2A_MSIL1C_20180303T170201_N0206_R069_T14QNG_20180303T221319.SAFE 1. Open file 1.1. File / Open Product 1.2. Browse
1. What is SENSE Batch
 1. What is SENSE Batch 1.1. Introduction SENSE Batch is processing software for thermal images and sequences. It is a modern software which automates repetitive tasks with thermal images. The most important
Exercise 4-1 Image Exploration
 Exercise 4-1 Image Exploration With this exercise, we begin an extensive exploration of remotely sensed imagery and image processing techniques. Because remotely sensed imagery is a common source of data
Introduction to Radar
 National Aeronautics and Space Administration ARSET Applied Remote Sensing Training http://arset.gsfc.nasa.gov @NASAARSET Introduction to Radar Jul. 16, 2016 www.nasa.gov Objective The objective of this
Batch Processing Converting images in a folder to JPEG
 Batch Processing Converting images in a folder to JPEG Request I would like to convert multiple RAW images (NEF files) to JPEG images all at once Response You can use a Batch Process to convert all RAW
ImagesPlus Basic Interface Operation
 ImagesPlus Basic Interface Operation The basic interface operation menu options are located on the File, View, Open Images, Open Operators, and Help main menus. File Menu New The New command creates a
GIMP WEB 2.0 ICONS. Web 2.0 Icons: Paperclip Completed Project
 GIMP WEB 2.0 ICONS WEB 2.0 ICONS: PAPERCLIP OPEN GIMP or Web 2.0 Icons: Paperclip Completed Project Step 1: To begin a new GIMP project, from the Menu Bar, select File New. At the Create a New Image dialog
Enhancement of Multispectral Images and Vegetation Indices
 Enhancement of Multispectral Images and Vegetation Indices ERDAS Imagine 2016 Description: We will use ERDAS Imagine with multispectral images to learn how an image can be enhanced for better interpretation.
RADARSAT-2 Program Update Daniel De Lisle Canadian Space Agency
 RADARSAT-2 Program Update Daniel De Lisle Canadian Space Agency Presentation outline RADARSAT-1 Update RADARSAT-2 Mission description Mission Objectives System Characteristics Data Commercialization/Allocation
Volocity Tutorial Creating a Measurement Protocol in Volocity Software
 TUTORIAL NOTE Cellular Imaging and Analysis Volocity Tutorial Creating a Measurement Protocol in Volocity Software This tutorial will illustrate the process of creating a Measurement Protocol in Volocity
ACTIVE MICROWAVE REMOTE SENSING OF LAND SURFACE HYDROLOGY
 Basics, methods & applications ACTIVE MICROWAVE REMOTE SENSING OF LAND SURFACE HYDROLOGY Annett.Bartsch@polarresearch.at Active microwave remote sensing of land surface hydrology Landsurface hydrology:
8th ESA ADVANCED TRAINING COURSE ON LAND REMOTE SENSING
 Urban Mapping Practical Sebastian van der Linden, Akpona Okujeni, Franz Schug Humboldt Universität zu Berlin Instructions for practical Summary The Urban Mapping Practical introduces students to the work
Scanning: pictures and text
 Scanning: pictures and text 2010 If you would like this document in an alternative format please ask staff for help. On request we can provide documents with a different size and style of font on a variety
SAR Remote Sensing. Introduction into SAR. Data characteristics, challenges, and applications.
 SAR Remote Sensing Introduction into SAR. Data characteristics, challenges, and applications. PD Dr. habil. Christian Thiel, Friedrich-Schiller-University Jena DLR-HR Jena & Friedrich-Schiller-University
g. Click once on the left vertical line of the rectangle.
 This drawing will require you to a model of a truck as a Solidworks Part. Please be sure to read the directions carefully before constructing the truck in Solidworks. Before submitting you will be required
Sea Ice Classification using RADARSAT 2 Dual Polarisation data
 Sea Ice Classification using RADARSAT 2 Dual Polarisation data Stein Sandven (1), Vitaly Alexandrov (2), Natalia Zakhvatkina (2) and Mohamed Babiker (1) (1)Nansen Environmental and Remote Sensing Center,
RADARSAT-2 Image Quality and Calibration Update
 RADARSAT-2 Image Quality and Calibration Update by Dan Williams, Yiman Wang, Marielle Chabot, Pierre Le Dantec, Ron Caves, Yan Wu, Kenny James, Alan Thompson, Cathy Vigneron www.mdacorporation.com Image
Sante FFT Imaging Copyright 2018 Santesoft, all rights reserved
 Sante FFT Imaging Copyright 2018 Santesoft, all rights reserved Table of Contents About the program... 2 System Requirements... 2 The Fourier transform... 3 The user interface... 5 Customize the toolbar...
ALOS-2 followon shimada-masanobu
 ALOS-2 followon-2020 shimada-masanobu 25m resolution global mosaic using PALSAR-2 FBD data Old ver. of 2015 Mosaic (Africa) Stripes in the old version of mosaic 2015 PALSAR-2 25m Global Mosaic New ver.
Quintic Software Tutorial 3
 Quintic Software Tutorial 3 Take a Picture 1 Tutorial 3 Take a Picture Contents Page 1. Photo 2. Photo Sequence a. Add shapes and angles 3. Export Analysis 2 Tutorial 3 Take a Picture 1. Photo Open the
Submittals Quick Reference Guide
 This topic provides a reference for the Project Center Submittals activity center. Purpose The Submittals activity center in Newforma Contract Management enables you to effectively log submittals and track
Image resizing with Microsoft Office Picture Manager
 Marketing Services and Web Management Digital Marketing Image resizing with Microsoft Office Picture Manager Document Owner Adam Seeley Last update Monday, 3 February 2014 Status Final Version 2.0 Circulation
Basics Pictures Media Bar
 Basics 1 The right pictures can make your publication stand out from the crowd. In this tutorial, we ll show you how to: Add and replace pictures. Use the Media Bar. Pan, zoom, and crop pictures. Apply
MEDICAL EDUCATION TECHNOLOGY
 Snipping Tool Overview The Snipping Tool provides a way to capture images from your display screen and imbed them in documents you develop. This is especially useful in Histopathology lab, since it allows
Geography 281 Map Making with GIS Project Ten: Mapping and Spatial Analysis
 Geography 281 Map Making with GIS Project Ten: Mapping and Spatial Analysis This project introduces three techniques that enable you to manipulate the spatial boundaries of geographic features: Clipping
Data Requirements Definition and Data Services Options for RAPP
 Data Requirements Definition and Data Services Options for RAPP Brian Killough CEOS Systems Engineering Office (SEO) 5 th GEOGLAM RAPP Workshop Frascati, Italy May 16-17, 2017 Requirements Update The observation
Performance evaluation of several adaptive speckle filters for SAR imaging. Markus Robertus de Leeuw 1 Luis Marcelo Tavares de Carvalho 2
 Performance evaluation of several adaptive speckle filters for SAR imaging Markus Robertus de Leeuw 1 Luis Marcelo Tavares de Carvalho 2 1 Utrecht University UU Department Physical Geography Postbus 80125
Unsupervised Classification
 Unsupervised Classification Using SAGA Tutorial ID: IGET_RS_007 This tutorial has been developed by BVIEER as part of the IGET web portal intended to provide easy access to geospatial education. This tutorial
GST 101: Introduction to Geospatial Technology Lab Series. Lab 6: Understanding Remote Sensing and Aerial Photography
 GST 101: Introduction to Geospatial Technology Lab Series Lab 6: Understanding Remote Sensing and Aerial Photography Document Version: 2013-07-30 Organization: Del Mar College Author: Richard Smith Copyright
Graphics Handling (GIMP)
") http://www.plk83.edu.hk/cy/gimp Contents 1. Introduction (Page 1) 2. Understanding the User Interface (Page 1) 3. Image Authoring (Page 2) 4. Photo Retouching (Page 6) Introduction GIMP is a free computer
http://www.plk83.edu.hk/cy/gimp Contents 1. Introduction (Page 1) 2. Understanding the User Interface (Page 1) 3. Image Authoring (Page 2) 4. Photo Retouching (Page 6) Introduction GIMP is a free computer
Creating DXF Files. IDeAte Laser Micro Part 1c Dave Touretzky and Susan Finger
 Creating DXF Files IDeAte Laser Micro Part 1c Dave Touretzky and Susan Finger 1. Convert a part to a dxf format When you save a part in Solidworks it is saved as a 3D solid model with all the relationships
Files Used in This Tutorial. Background. Calibrating Images Tutorial
 In this tutorial, you will calibrate a QuickBird Level-1 image to spectral radiance and reflectance while learning about the various metadata fields that ENVI uses to perform calibration. This tutorial
ALOS-Indonesia POLinSAR Experiment (AIPEX): First Result*
: First Result*") ALOS-Indonesia POLinSAR Experiment (AIPEX): First Result* Mahmud Raimadoya(1), Ludmila Zakharova(2), Bambang Trisasongko(1), Nurwadjedi(3) (1) Bogor Agricultural University (IPB), P.O. Box 2049, Bogor
ALOS-Indonesia POLinSAR Experiment (AIPEX): First Result* Mahmud Raimadoya(1), Ludmila Zakharova(2), Bambang Trisasongko(1), Nurwadjedi(3) (1) Bogor Agricultural University (IPB), P.O. Box 2049, Bogor
Resizing for ACCC Competition. Rev 1.0 9/12/2011
 Resizing for ACCC Competition Rev 1.0 9/12/2011 This document contains instructions for resizing your images to comply with the new Digital Image Competition Guidelines. In this document we have attempted
Ionospheric Structure Imaging with ALOS PALSAR
 The Second ALOS PI Symposium Rhodes, Greece November 3 7, 008 Ionospheric Structure Imaging with ALOS PALSAR PI Number: 37 JAXA-RA PI: Jong-Sen Lee, Thomas L. Ainsworth and Kun-Shan Chen CSRSR, National
SCATTERING POLARIMETRY PART 1. Dr. A. Bhattacharya (Slide courtesy Prof. E. Pottier and Prof. L. Ferro-Famil)
") SCATTERING POLARIMETRY PART 1 Dr. A. Bhattacharya (Slide courtesy Prof. E. Pottier and Prof. L. Ferro-Famil) 2 That s how it looks! Wave Polarisation An electromagnetic (EM) plane wave has time-varying
SCATTERING POLARIMETRY PART 1 Dr. A. Bhattacharya (Slide courtesy Prof. E. Pottier and Prof. L. Ferro-Famil) 2 That s how it looks! Wave Polarisation An electromagnetic (EM) plane wave has time-varying
F2 - Fire 2 module: Remote Sensing Data Classification
 F2 - Fire 2 module: Remote Sensing Data Classification F2.1 Task_1: Supervised and Unsupervised classification examples of a Landsat 5 TM image from the Center of Portugal, year 2005 F2.1 Task_2: Burnt
ADMS 5 MapInfo Link. User Guide CERC
 ADMS 5 MapInfo Link User Guide CERC ADMS 5 MapInfo Link User Guide November 2012 Cambridge Environmental Research Consultants Ltd 3 King s Parade Cambridge CB2 1SJ Telephone: +44 (0)1223 357773 Fax: +44
Introduction to Filters
 Introduction to Filters Using SAGA Tutorial ID: IGET_RS_006 This tutorial has been developed by BVIEER as part of the IGET web portal intended to provide easy access to geospatial education. This tutorial
Basic image edits with GIMP: Getting photos ready for competition requirements Dirk Pons, New Zealand
 Basic image edits with GIMP: Getting photos ready for competition requirements Dirk Pons, New Zealand March 2018. This work is made available under the Creative Commons license Attribution-NonCommercial
GIMP Tutorial. v2.2. Boo Virk.
 GIMP Tutorial v2.2 Boo Virk boo.virk@babraham.ac.uk What is GIMP GNU Image Manipulation Program Bitmap Graphics Editor Open Source Cross Platform Not for Vector editing www.gimp.org Vector vs Bitmap GIMP
Remote Sensing 4113 Lab 08: Filtering and Principal Components Mar. 28, 2018
 Remote Sensing 4113 Lab 08: Filtering and Principal Components Mar. 28, 2018 In this lab we will explore Filtering and Principal Components analysis. We will again use the Aster data of the Como Bluffs
Applying mathematics to digital image processing using a spreadsheet
 Jeff Waldock Applying mathematics to digital image processing using a spreadsheet Jeff Waldock Department of Engineering and Mathematics Sheffield Hallam University j.waldock@shu.ac.uk Introduction When
The Toolbars submenu selects or deselects the following toolbars, below shows you how to display the Measuring Toolbar: Scale X in Y
 The Measurement Toolbars Menu The Toolbars submenu selects or deselects the following toolbars, below shows you how to display the Measuring Toolbar: As it looks on the tool bar, below Arrow End Style
SARscape s Coherent Changes Detection Tutorial
 SARscape s Coherent Changes Detection Tutorial Version 1.0 April 2018 1 Index Introduction... 3 Setting Preferences... 4 Data preparation... 5 Input data... 5 DEM Extraction... 5 Single Panels processing...
Fundamentals of ModelBuilder
 Fundamentals of ModelBuilder Agenda An Overview of Geoprocessing Framework Introduction to ModelBuilder Basics of ArcToolbox Using ModelBuilder Documenting Models Sharing Models with Others Q & A Geoprocessing
Introduction. Let s get started...
 Introduction Welcome to PanoramaPlus 2, Serif s fully-automatic 2D image stitcher. If you re looking for panorama-creating software that s quick and easy to use, but doesn t compromise on image quality,
Synthetic Aperture Radar for Rapid Flood Extent Mapping
 National Aeronautics and Space Administration ARSET Applied Remote Sensing Training http://arset.gsfc.nasa.gov @NASAARSET Synthetic Aperture Radar for Rapid Flood Extent Mapping Sang-Ho Yun ARIA Team Jet
All rights reserved. ENVI, IDL and Jagwire are trademarks of Exelis, Inc. All other marks are the property of their respective owners.
 SAR Analysis Made Easy with SARscape 5.1 All rights reserved. ENVI, IDL and Jagwire are trademarks of Exelis, Inc. All other marks are the property of their respective owners. 2014, Exelis Visual Information
Tutorial 1 getting started with the CNCSimulator Pro
 CNCSimulator Blog Tutorial 1 getting started with the CNCSimulator Pro Made for Version 1.0.6.5 or later. The purpose of this tutorial is to learn the basic concepts of how to use the CNCSimulator Pro
Instruction Manual. Mark Deimund, Zuyi (Jacky) Huang, Juergen Hahn
 Huang, Juergen Hahn") Instruction Manual Mark Deimund, Zuyi (Jacky) Huang, Juergen Hahn This manual is for the program that implements the image analysis method presented in our paper: Z. Huang, F. Senocak, A. Jayaraman, and
Instruction Manual Mark Deimund, Zuyi (Jacky) Huang, Juergen Hahn This manual is for the program that implements the image analysis method presented in our paper: Z. Huang, F. Senocak, A. Jayaraman, and
The Convair 580 SAR Facility Recent Activities and Future Opportunities
 The Convair 580 SAR Facility Recent Activities and Future Opportunities Dr. Carl E. Brown Emergencies Science and Technology Section Environment Canada Ottawa, Ontario ESTS Airborne Remote Sensing DC-3,
User Guide. Version 1.2. Copyright Favor Software. Revised:
 User Guide Version 1.2 Copyright 2009-2010 Favor Software Revised: 2010.05.18 Table of Contents Introduction...4 Installation on Windows...5 Installation on Macintosh...6 Registering Intwined Pattern Studio...7
CHANGE DETECTION USING OPTICAL DATA IN SNAP
 CHANGE DETECTION USING OPTICAL DATA IN SNAP EXERCISE 1 (Water change detection) Data: Sentinel-2A Level 2A: S2A_MSIL2A_20170101T082332_N0204_R121_T34HCH_20170101T084543.SAFE S2A_MSIL2A_20180116T082251_N0206_R121_T34HCH_20180116T120458.SAFE
User Guide. Version 1.4. Copyright Favor Software. Revised:
 User Guide Version 1.4 Copyright 2009-2012 Favor Software Revised: 2012.02.06 Table of Contents Introduction... 4 Installation on Windows... 5 Installation on Macintosh... 6 Registering Intwined Pattern
Laboratory Exercise 1
 Page 1 Laboratory Exercise 1 GEOG*2420 The Earth From Space University of Guelph, Department of Geography Prof. John Lindsay Fall 2013 Total of 32 marks Learning objectives The intention of this lab exercise
Mid_Term_Review_PhotoShop_Design Test B Name
 Mid_Term_Review_PhotoShop_Design Test B Name Multiple Choice Identify the choice that best completes the statement or answers the question. 1. Photoshop uses a mathematical process called when it changes
Index 275. K Ka-band, 250, 259 Knowledge-based concepts, 110
 Index A Acquisition planning, 225 Across-track, 30, 41, 88, 90 93 Across-track interferometry, 30 Along-track, 3, 10, 19, 41, 88, 90, 91, 93, 94, 103 Along-track interferometry, 41 Ambiguous elevation
PALSAR calibration with passive antenna reflectors
 PALSAR calibration with passive antenna reflectors Alexander Zakharov, IRE RAS, Russia Peter Jerdev, SDB MPEI, Russia Alexey Sokolov, SDB MPEI, Russia E-mail: aizakhar@sunclass.ire.rssi.ru Bear Lakes calibration
Application Potential of Planned SAR Satellites a Preview
 PREPRINT/PRÉTIRAGE Application Potential of Planned SAR Satellites a Preview J.J. van der Sanden 1, P. Budkewitsch 1, R. Landry 1, M.J. Manore 2, H. McNairn 1, T.J. Pultz 1, and P.W. Vachon 1 1 Canada
Land Cover Change Analysis An Introduction to Land Cover Change Analysis using the Multispectral Image Data Analysis System (MultiSpec )
") Land Cover Change Analysis An Introduction to Land Cover Change Analysis using the Multispectral Image Data Analysis System (MultiSpec ) Level: Grades 9 to 12 Windows version With Teacher Notes Earth Observation
Land Cover Change Analysis An Introduction to Land Cover Change Analysis using the Multispectral Image Data Analysis System (MultiSpec ) Level: Grades 9 to 12 Windows version With Teacher Notes Earth Observation
ENVI Classic Tutorial: Spectral Angle Mapper (SAM) and Spectral Information Divergence (SID) Classification 2
 and Spectral Information Divergence (SID) Classification 2") ENVI Classic Tutorial: Spectral Angle Mapper (SAM) and Spectral Information Divergence (SID) Classification Spectral Angle Mapper (SAM) and Spectral Information Divergence (SID) Classification 2 Files
ENVI Classic Tutorial: Spectral Angle Mapper (SAM) and Spectral Information Divergence (SID) Classification Spectral Angle Mapper (SAM) and Spectral Information Divergence (SID) Classification 2 Files
EE 529 Remote Sensing Techniques. Introduction
 EE 529 Remote Sensing Techniques Introduction Course Contents Radar Imaging Sensors Imaging Sensors Imaging Algorithms Imaging Algorithms Course Contents (Cont( Cont d) Simulated Raw Data y r Processing
Compact polarimetry SAR for natural surface characterization: an attractive compromise
 Compact polarimetry AR for natural surface characterization: an attractive compromise P Dubois-Fernandez (ONERA) JC ouyris (CNE), Angelliaume (ONERA), K Raney (John Hopkins University) Outline of the presentation
v WMS 10.0 Tutorial Introduction Images Read images in a variety of formats and register the images to a coordinate projection
 v. 10.0 WMS 10.0 Tutorial Read images in a variety of formats and register the images to a coordinate projection Objectives Read various types of image files from different sources. Learn how to work with
EDUCATION GIS CONFERENCE Geoprocessing with ArcGIS Pro. Rudy Prosser GISP CTT+ Instructor, Esri
 EDUCATION GIS CONFERENCE Geoprocessing with ArcGIS Pro Rudy Prosser GISP CTT+ Instructor, Esri Maintenance What is geoprocessing? Geoprocessing is - a framework and set of tools for processing geographic
AutoCAD Tutorial First Level. 2D Fundamentals. Randy H. Shih SDC. Better Textbooks. Lower Prices.
 AutoCAD 2018 Tutorial First Level 2D Fundamentals Randy H. Shih SDC PUBLICATIONS Better Textbooks. Lower Prices. www.sdcpublications.com Powered by TCPDF (www.tcpdf.org) Visit the following websites to
CURRENT SCENARIO AND CHALLENGES IN THE ANALYSIS OF MULTITEMPORAL REMOTE SENSING IMAGES
 Remote Sensing Laboratory Dept. of Information Engineering and Computer Science University of Trento Via Sommarive, 14, I-38123 Povo, Trento, Italy CURRENT SCENARIO AND CHALLENGES IN THE ANALYSIS OF MULTITEMPORAL
How to Cut Out Photos
 How to Cut Out Photos Contents Overview page 1 Step 1 Open a Photo page 3 Step 2 Clone Parts of a Photo page 4 Step 3 Remove parts of a Photo page 9 Step 4 Cut out areas of a Photo page 11 Step 5 Save
Session I: Status Reports on Ongoing and Future Missions Chairs: M.Shimada (JAXA) and P. Snoeij (ESA)
 and P. Snoeij (ESA)") Session I: Status Reports on Ongoing and Future Missions Chairs: M.Shimada (JAXA) and P. Snoeij (ESA) Canadian Radarsat Mission status-s. Cote Operating far beyond design lifetime (RSAT-1: 16 years, ASAR:
Session I: Status Reports on Ongoing and Future Missions Chairs: M.Shimada (JAXA) and P. Snoeij (ESA) Canadian Radarsat Mission status-s. Cote Operating far beyond design lifetime (RSAT-1: 16 years, ASAR:
Drawing with precision
 Drawing with precision Welcome to Corel DESIGNER, a comprehensive vector-based drawing application for creating technical graphics. Precision is essential in creating technical graphics. This tutorial
Getting Started. Before You Begin, make sure you customized the following settings:
 Getting Started Getting Started Before getting into the detailed instructions for using Generative Drafting, the following tutorial aims at giving you a feel of what you can do with the product. It provides
REVIT - RENDERING & DRAWINGS
 TUTORIAL L-15: REVIT - RENDERING & DRAWINGS This Tutorial explains how to complete renderings and drawings of the bridge project within the School of Architecture model built during previous tutorials.
CONTENTS. Chapter I Introduction Package Includes Appearance System Requirements... 1
 User Manual CONTENTS Chapter I Introduction... 1 1.1 Package Includes... 1 1.2 Appearance... 1 1.3 System Requirements... 1 1.4 Main Functions and Features... 2 Chapter II System Installation... 3 2.1