S1-A Annual Performance Report for 2015
|
|
|
- Augustus Butler
- 5 years ago
- Views:
Transcription

1 S-1 MPC Reference: Nomenclature: MPC-0139 DI-MPC-APR Issue: 1. 0 Date: 2016,Mar.29
2 FORM-NT-GB-10-0 MPC-0139 DI-MPC-APR V ,Mar.29 i.1 Chronology Issues: Issue: Date: Reason for change: Author Initial release G.Hajduch P.Meadows People involved in this issue: Written by (*): Peter Meadows Date + Initials:( visa or ref) Checked by (*): G.Hajduch Date + Initial:( visa ou ref) [Checker] Approved by (*): G.Hajduch Date + Initial:( visa ou ref) [Approver] Application authorized by (*): Date + Initial:( visa ou ref) *In the opposite box: Last and First name of the person + company if different from CLS Index Sheet: Context: Keywords: Sentinel-1 Mission Performance Centre Sentinel-1, Mission Performance Centre, Annual Report Hyperlink: Distribution: Company Means of distribution Names CLS ESA Notification
3 FORM-NT-GB-10-0 MPC-0139 DI-MPC-APR V ,Mar.29 i.2 List of tables and figures List of tables: Table 1 Radar Data Base Changes History Table 2 List of products affected by mis-synchronization... 6 Table 3 Estimated PG trends: period APR 2014 MAY 2015 (co-pol)... 7 Table 4 Estimated PG trends : period APR 2014 MAY 2015 (cross-pol)... 8 Table 5 Noise power stability (3-sigma): period JAN 2015 DEC 2015 (co-pol) Table 6 Average bitrate for each acquisition mode Table 7 Elevation pointing verification Table 8 SM Azimuth and Slant Range Spatial Resolutions Table 9 IW Azimuth and Slant Range Spatial Resolutions Table 10 EW Azimuth and Slant Range Spatial Resolutions Table 11 SM & IW Sidelobe Ratios Table 12: SM ENL & RR Measurements Table 13: IW ENL & RR Measurements Table 14: EW ENL & RR Measurements Table 15: Azimuth Ambiguity Ratios Table 16: SLC Relative Radar Cross-Section for the DLR transponders (db) Table 17: SM SLC Relative Radar Cross-Section for the DLR transponders (db) Table 18: IW & EW SLC Relative Radar Cross-Section for the DLR transponders (db) Table 19: IW SLC Relative Radar Cross-Section for the DLR transponders (db) Table 20: EW SLC Relative Radar Cross-Section for the DLR transponders (db) Table 21: Gain Imbalance using the DLR transponders Table 22: Gain Imbalance using the DLR transponders Table 23: Phase Imbalance using the DLR transponders Table 24 Polarimetric Calibration Measurements Table 25: SLC Cross-talk List of figures: Figure 1 PG gain trend over time (HH and VV)... 3 Figure 2 Gain (left) and phase (right) stability of the SAR antenna tiles (average of the error matrixes in RX, over rows). The intermittent Tile#5 failure events can be recognized (cyan dots) Figure 3 Burst synchronization statistics Figure 4 PG gain trend over time (HH and VV)... 7 Figure 5 PG gain trend over time (VH and HV)... 7 Figure 6 PG gain trend over time (closer view May-September 2015)... 8
4 FORM-NT-GB-10-0 MPC-0139 DI-MPC-APR V ,Mar.29 i.3 Figure 7 Analysis of the single cal pulses gain over time. Top: TX cal, Mid: RX-EPDN cal, Bottom: TA-APDN cal Figure 8 Noise power versus time (IW mode) Figure 9 I/Q channel imbalance Figure 10 Elevation pointing verification with notch acquisitions over Amazon rain forest Figure 11 Doppler Centroid versus time. Average on a data-take basis (dots) and daily average (red line). The star-trackers reconfigurations events are marked by the vertical black lines Figure 12 SM Azimuth and Slant Range Spatial Resolutions Figure 13 IW Azimuth and Slant Range Spatial Resolutions Figure 14 EW Azimuth and Slant Range Spatial Resolutions Figure 15: SM SLC Early Azimuth Ambiguity, ESTEC Transponder IRF and Late Ambiguity Figure 16: IW Early Azimuth Ambiguity, ESTEC Transponder IRF and Late Ambiguity (A indicates nominal ambiguity locations and S are ships the non-nominal ambiguities are between the ambiguities and the IRF mainlobe) Figure 17: EW Early Azimuth Ambiguity, ESTEC Transponder IRF and Late Ambiguity (A indicates nominal ambiguity locations and S are ships the non-nominal ambiguities are between the ambiguities and the IRF mainlobe) Figure 18: IW Image of SE England (showing the location of the BAE Corner Reflector) and N France with the location of two regions of range ambiguities indicated (acquisition 2nd November 2014, 17:40:53 UT) Figure 19: Extract of middle ambiguity region showing various range ambiguities plus other point targets Figure 20: Detail of middle ambiguity region (left) and the source of the ambiguity in Rotterdam (right) Figure 21: Detail of middle ambiguity region (left) and the source of the ambiguity in Rotterdam (right) Figure 22: Detail of right ambiguity region (left) and the source of the ambiguity in Waalwijk (right) Figure 23: SM SLC Relative Radar Cross-Section for the DLR transponders Figure 24: IW SLC Relative Radar Cross-Section for the DLR transponders Figure 25: EW SLC Relative Radar Cross-Section for the DLR transponders Figure 26: IW SLC Relative Radar Cross-Section for the BAE Corner Reflector Figure 27: Example Australian Corner Reflector and Impulse Response Figure 28: Australian CR relative RCS (top, middle) and RCS standard deviation (bottom) Figure 29 Permanent Scatter Calibration Time Series for Stripmap S6 over Chicago Figure 30 Permanent Scatter Calibration Time Series for TopSAR IW over Milan Figure 31: ALE estimates for StripMap and IW SLC product time series using precise state vectors (AUX_POEORB) shortly after the calibration phase and after May In (a) and (c), each point represents a single SM SLC product over Torny-le-Grand (green) or Dübendorf (black). In (b), red and blue points represent single targets at Torny-le-Grand, while in (d) the points represent single products. Atmospheric path delay correction was applied by UZH in all cases. Bistatic residual correction was applied by UZH in (c) and (d), and the SWST (range) bias, taken from (a), was applied within the S1A processor beginning in May 2015, as can be seen in (c) and (d) Figure 32: Gain Imbalance using the DLR transponders Figure 33: Phase Imbalance using the DLR transponders
5 FORM-NT-GB-10-0 MPC-0139 DI-MPC-APR V ,Mar.29 i.4 Figure 34: SLC Co-registration Examples Figure 35: SLC Cross-talk Examples Figure 36 Example Updated Azimuth Antenna Pattern Figure 37: NESZ measures for SM. Blue is the measured NESZ and the red lines are the predicted NESZ at minimum and maximum orbital altitudes Figure 38: NESZ measures for IW. Blue is the measured NESZ and the red lines are the predicted NESZ at minimum and maximum orbital altitudes Figure 39: NESZ measures for EW. Blue is the measured NESZ and the red lines are the predicted NESZ at minimum and maximum orbital altitudes Figure 40: NESZ measures for WV. Blue is the measured NESZ and the red lines are the predicted NESZ at minimum and maximum orbital altitudes Figure 41: An example of Radio Frequency Interference Figure 42: An example of Radarsat-2/Sentinel1-A Interference Figure 43: An unusual user anomoly Figure 44: Detail of an unusual user anomoly Figure 45: SAR Wind speed compared with reference wind speed for IW mode VV polarization.51 Figure 46: Significant wave height for the long waves performances for December 2015 in Wave Mode 1 (left) and Wave Mode 2 (right). The model outputs from WW3 are considered as reference here. This is only valid from a statistical point of view Figure 47: Monthly performances for WV1 (top-left) and WV2 (top-right) and number of acquisitions co-located to reference data for validation for WV1 (bottom-left) and WV2 (bottom-right). Thick solid lines stand for the mean difference between Sentinel-1 and WW3 model significant wave height Figure 48: Geophysical Doppler as included in the Level 2 products as a function of radial wind speed (wind speed projected in the line of sight of the radar) for WV1 (left) and WV2 (right). The colour code indicates the latitude Figure 49: Doppler bias as a function of latitude estimated over ocean (blue) and land (brown) Figure 50: Geometric Doppler, data Doppler, and EM Doppler differences between wv1 and wv2 acquired over rain forest areas in VV (left) and HH (right) polarizations Figure 51: Radial velocity field from Sentinel 1A IW RVL product acquired over Agulhas in ascending mode. Here land areas are used to calibrate the Doppler anomaly before computing the radial velocity. A clear signature of the Agulhas current is observed as well as wind/wave induced velocity Figure 52: Left: EM doppler offset computed from antenna model with error matrix corresponding to the day of acquisition. Right: Doppler offset computed from rain forest data. Upper panel is S1A IW mode and lower panel is EW mode Figure 53: RVL product Doppler offset in azimuth before (black) and after (red) de-scalloping for each swath of IW mode. The data are acquired over rainforest, and the azimuth profiles area obtained by averaging in range
6 Applicable documents [AD-01] Sentinel-1 Product Specification, S1 RS-MDA , Issue 3/1, October 2015 [AD-02] Sentinel-1 Product Definition, S1-RS-MDA , Issue 2/6, July 2015 [AD-03] Sentinel-1 IPF Detailed Algorithm Definition, S1-TN-MDA , Issue 1/6, November 2014 [AD-04] Sentinel-1 IPF Auxiliary Product Specification, S1-RS-MDA , Issue 3/0, July 2015
7 FORM-NT-GB-10-0 MPC-0139 DI-MPC-APR V ,Mar.29 i.1 Reference documents [S1-RD-01] S1-A MPC Commissioning Phase Report DI-MPC-CPR MPC-0184, Issue 1.3, March [S1-RD-02] Sentinel-1 A Instrument Processing Facility and Operational Product Status After One Year of Operation. Nuno Miranda, Peter Meadows, Adrian Schubert, Alan Pilgrim, David Small, Davide Giudici, Riccardo Piantanida & Guillaume Hajduch. Proceedings of the CEOS SAR Workshop, October 27-29, 2015, ESTEC, Noordwijk, The Netherlands. ( [S1-RD-03] Sentinel-1 A Radiometric Calibration. Peter Meadows, Alan Pilgrim, Riccardo Piantanida, Davide Riva & Nuno Miranda. Proceedings of the CEOS SAR Workshop, October 27-29, 2015, ESTEC, Noordwijk, The Netherlands. ( [S1-RD-04] Calibration with Trihedral Corner Relectors: A Case Study using Satellite-based X, C and L- Band Frequency Synthetic Aperture Radar Data over Queensland. Australia. Medhavy Thankappan, Matthew Garthwaite, Peter Meadows, Nuno Miranda, Adrian Schubert and David Small. Proceedings of the CEOS SAR Workshop, October 27-29, 2015, ESTEC, Noordwijk, The Netherlands. ( [S1-RD-05] Joint Investigations on Radarsat-2 /Sentinel-1 A Mutual RFI. Bjorn Rommen, Itziar Barat, Marielle Chabot, Casey Lambert, Dan Williams. Proceedings of the CEOS SAR Workshop, October 27-29, 2015, ESTEC, Noordwijk, The Netherlands. [S1-RD-06] Schubert, A., D. Small, N. Miranda, D. Geudtner, E. Meier. Sentinel-1A Product Geolocation Accuracy: Commissioning Phase Results. Remote Sens. 2015, 7, doi: /rs [S1-RD-07] Schubert, A., D. Small, N. Miranda, D. Geudtner, E. Meier. Sentinel-1A Product Geolocation Accuracy: Beyond the Calibration Phase. Presented at CEOS SAR Calibration & Validation Workshop; Noordwijk, The Netherlands, [S1-RD-08] Small, D., A. Schubert. Guide to ASAR Geocoding, UZH technical note for ESA- ESRIN, Contract No /07/I-EC, RSL-ASAR-GC-AD, Iss. 1.01; University of Zurich: Zurich, Switzerland, 2008, 36p. [S1-RD-09] GMES Sentinel-1 Team. GMES Sentinel-1 System Requirements Document, Ref. S1-RS-ESA-SY-0001, Iss. 3, Rev. 3, [S1-RD-10] Pietro Guccione, Michele Belotti, Davide Giudici, Andrea Monti Guarnieri, Ignacio Navas-TraverSentinel-1A: Analysis of FDBAQ Performance on Real Data, IEEE TRANSACTIONS ON GEOSCIENCE AND REMOTE SENSING, [S1-RD-11] Harald Johnsen, Fabrice Collard, Sentinel-1 ocean swell wave spectra (OSW) algorithm development, [S1-AD-20]-S1-TN-NRT , Issue 1, Revision 1, November 2010.
8 List of Contents 1. Introduction Purpose of the document Structure of the document Executive Summary Instrument Status Antenna Status Instrument Unavailability Auxiliary Date File Updates Radar Data Base Updates Orbit Manoeuvres Burst synchronization Internal Calibration Noise power monitoring Products Status Level 0 Products Timeline and missing lines I/Q statistics FDBAQ Instrument Pointing Level 1 Products Level 1 Processor Updates Image Quality Spatial Resolution Sidelobe Ratios ENL and Radiometric Resolution Ambiguity Analysis Azimuth Ambiguities Unexpected Azimuth Ambiguities Range Ambiguities Radiometric Calibration IW/EW Re-Calibration Absolute Radiometric Calibration Permanent Scatter Calibration Geometric Calibration Polarimetric Calibration Gain Imbalance... 33
9 FORM-NT-GB-10-0 MPC-0139 DI-MPC-APR V ,Mar.29 i Phase Imbalance Coregistration Cross-talk Elevation Antenna Patterns Azimuth Antenna Patterns Noise Equivalent Radar Cross-section Summary of Anomalies Radio Frequency Interference Radarsat-2/Sentinel1-A Mutual Interference Other Anomalies Quality Disclaimers Level 2 products Wind measurement Image Mode (SM-IW-EW) Swell Measurement Wave Mode Radial Velocity Measurement Wave Mode TOPS Mode Appendix A - List of Acronyms Appendix B - S1-A Orbit Cycles and N-Cyclic Reports Appendix C - ESA S1-A Technical Reports Appendix D - S1-A Transmit Receive Module Failures Appendix E - S1-A Instrument Unavailability Appendix F - S1-A Auxiliary Data Files Appendix G - S1-A Orbit Manoeuvres Appendix H - S1-A Quality Disclaimers Appendix I - S1-A Antenna Pointing... 73
10 MPC-0139 DI-MPC-APR V ,Mar Introduction 1.1. Purpose of the document The purpose of this document is to provide the status on the S1-A instrument and product performance during Structure of the document The outline of this report is given below: - Chapter 1 : this introduction - Chapter 2 : Executive Summary - Chapter 3 : Instrument Status - Chapter 4 : Products Status The following appendices are also provided: - Appendix A : List of Acronyms - Appendix B : S1-A Orbit Cycles and N-Cyclic Reports - Appendix C : ESA S1-A Technical Reports - Appendix D : S1-A Transmit Receive Module Failures - Appendix E : S1-A Instrument Unavailability - Appendix F : S1-A Auxiliary Data Files - Appendix G : S1-A Orbit Manoeuvres - Appendix H : S1-A Quality Disclaimers - Appendix I : S1-A Antenna Pointing
11 MPC-0139 DI-MPC-APR V ,Mar Executive Summary This report gives the status of the Sentinel1-A instrument and products during 2015, the first full year of routine operations since the launch of the satellite in April 2014 and the subsequent commission phase. A summary of this status can also be found in a paper presented at the CEOS SAR workshop at ESTEC in October 2015 (see [S1-RD-02]). As will be seen in Chapters 3 and 4 many aspects of the instrument and products are considered with the aim of ensuring user s receive high quality products.


12 MPC-0139 DI-MPC-APR V ,Mar Instrument Status Here the status of the S1-A instrument during 2015: 3.1. Antenna Status The Antenna status is routinely monitored using the dedicated RFC calibration mode. The RFC products are processed in order to generate the Antenna Error Matrix from which it is possible to retrieve the failure and drift of each TRM. The Figure below shows the antenna Transmit/Receive Module (TRM) status at the end of Ten (10) failures are counted in total among TX-RX and H-V. A full list of all TRM failures during 2015 is given in Appendix D. The impact of the failures on the antenna patterns shape is modelled by the antenna model and the data products are compensated accordingly within the level-1 processor. RX TX Figure 1 PG gain trend over time (HH and VV) As reported in Appendix D, Tile #5 showed an intermittent failure in the period October 2014 July The non-nominal behaviour of the tile amplifier (TA) was responsible of power drops (in receive only, both polarizations) affecting the full tile (see Figure 2).
13 MPC-0139 DI-MPC-APR V1.0 RX H abs mean [db] 2016,Mar.29 4 RX H phase mean [deg] APR Tile Tile Tile Tile Tile Tile Tile Tile Tile Tile Tile Tile Tile Tile AUG-2014 Tile DEC APR AUG APR-2014 Tile Tile Tile Tile Tile Tile Tile Tile Tile Tile Tile Tile Tile Tile AUG DEC APR AUG-2015 Figure 2 Gain (left) and phase (right) stability of the SAR antenna tiles (average of the error matrixes in RX, over rows). The intermittent Tile#5 failure events can be recognized (cyan dots). The tile was switched to redundancy on the 22 nd July 2015 and the intermittent failure has disappeared ever since. The Radar Data Base (RDB) ID was set to 5 to mark the switching to redundancy. Excluding the failed TRMs, the antenna shows overall a stable behaviour: 0.4 db of average temporal stability for the gain and 5 for the phase have been computed Instrument Unavailability A summary of the S1-A instrument unavailability during the reporting period is provided together with an explanation is provided. A full list of all instrument unavailabilities during 2015 is given in Appendix E Auxiliary Date File Updates A summary of S1-A Auxiliary Data Files (ADFs) updates during the reporting period is provided together with an explanation of the updates. A full list of all ADF updates since the S1-A launch is given in Appendix F Radar Data Base Updates FORM-NT-GB-7-1 A summary of S1-A Radar Data Base (RDB) updates during 2015 is provided in the following Table. RDB ID Date of endorsement Update reason RDB #1 4 April 2014 Launch version RDB #2 16 June 2014 Corrected an error in ECC2 and ECC19
 RDB #5 22 July 2015 Switch to redundancy of antenna tile #5 3.")


14 MPC-0139 DI-MPC-APR V ,Mar.29 5 RDB #3 15 September 2014 New instrument gain settings and ADC FSR RDB #4 17 June 2015 New reference frame for quaternions (ECI 2000) RDB #5 22 July 2015 Switch to redundancy of antenna tile # Orbit Manoeuvres Table 1 Radar Data Base Changes History. A summary of S1-A orbit manoeuvres during the reporting period is provided. A full list of all S1-A orbit manoeuvres since launch is given in Appendix G Burst synchronization The burst synchronization between repeat pass interferometric acquisitions is relevant for the TOPSAR modes (IW and EW) to provide an indication of the quality of the interferometric phase that can be expected. The SAR acquisition start time is planned over a discrete set of points round orbit with precision down to milliseconds. The performance of the synchronization is monitored by the PDGS OBS tool. Figure 3 shows the burst synchronization over time for IW and EW mode. Each dot represents a repeat pass acquisition, considering as reference cycle number 43 (10-22 March 2015). It can be noticed that the synchronization is always very high, with the 98.9% of the IW data takes and 96.8% of the EW data takes showing a synchronization better than the 99% of the burst length. The mis-synchronization event happened on the 18 th and 19 th of May 2015 is highlighted in the figure. This event was due to a temporary issue that has rapidly been understood and corrected. The list of affected products is reported in Table 2. EW IW 98.9 % of DTs with synch. better than 99% Synchronization issue on 18 th and 19 th May captured by OBS processor Cycles from 43 to 51 w.r.t. cycle % of DTs with a synch. better than 99% Figure 3 Burst synchronization statistics.
15 MPC-0139 DI-MPC-APR V ,Mar.29 6 L0A Product name Mode Pol. Start time (GPS) S1A_IW_RAW 0ADV_ T073253_ T073350_ _007AD8_5C8C.SAFE S1A_EW_RAW 0ASH_ T081938_ T _005958_007ADA_2B7E.SAFE S1A_EW_RAW 0ADH_ T104733_ T _005960_007AE2_D470.SAFE S1A_IW_RAW 0ASV_ T120452_ T121119_ _007AE4_5E5C.SAFE S1A_EW_RAW 0ADH_ T135501_ T _005962_007AE9_D97A.SAFE S1A_EW_RAW 0ASH_ T181216_ T _005964_007AF4_37AC.SAFE S1A_EW_RAW 0ADH_ T185122_ T _005965_007AF7_0169.SAFE S1A_EW_RAW 0ADH_ T185525_ T _005965_007AF8_93EE.SAFE S1A_EW_RAW 0ASH_ T195104_ T _005965_007AFA_2D52.SAFE S1A_IW_RAW 0ASV_ T014706_ T015037_ _007B19_6C5D.SAFE S1A_EW_RAW 0ADV_ T020053_ T _005969_007B1A_0867.SAFE S1A_IW_RAW 0ADV_ T032350_ T032933_ _007B1E_0640.SAFE S1A_IW_RAW 0ASV_ T033250_ T033521_ _007B1F_E543.SAFE S1A_EW_RAW 0ASH_ T040317_ T _005970_007B20_DCB8.SAFE S1A_EW_RAW 0ADH_ T144130_ T _005977_007B4B_F7C9.SAFE IW DV 17/05/ :32:53 EW SH 17/05/ :19:38 EW DH 17/05/ :47:33 IW SV 17/05/ :04:52 EW DH 17/05/ :55:01 EW SH 17/05/ :12:16 EW DH 17/05/ :51:22 EW DH 17/05/ :55:25 EW SH 17/05/ :51:04 IW SV 18/05/ :47:06 EW DV 18/05/ :00:53 IW DV 18/05/ :23:50 IW SV 18/05/ :32:50 EW SH 18/05/ :03:17 EW DH 18/05/ :41:30 Stop time (GPS) 17/05/ :33:50 17/05/ :23:10 17/05/ :50:32 17/05/ :11:19 17/05/ :01:14 17/05/ :15:03 17/05/ :53:38 17/05/ :57:28 17/05/ :54:27 18/05/ :50:37 18/05/ :03:58 18/05/ :29:33 18/05/ :35:21 18/05/ :04:08 18/05/ :44:10 Table 2 List of products affected by mis-synchronization Orbit number Data Take ID AD ADA AE AE AE AF AF AF AFA B B1A B1E B1F B B4B

.")

16 MPC-0139 DI-MPC-APR V ,Mar Internal Calibration The instrument gains and phase stability over time is monitored through the gain and phase of the PG-product. Figure 4 below shows the PG-gain over time, for the HH and VV polarization cases. Figure 5 shows the PG trend for the cross-pol cases (VH and HV). Figure 4 PG gain trend over time (HH and VV) Figure 5 PG gain trend over time (VH and HV) In the HH case, a linear decay over time can be observed, common to all the swaths. The decay is not visible for the VV case instead. The estimated values of the slope are reported in Table 3 below. Acquisition Mode HH VV SM db/year db/year IW db/year db/year EW db/year db/year WV db/year db/year Table 3 Estimated PG trends: period APR 2014 MAY 2015 (co-pol)


17 MPC-0139 DI-MPC-APR V ,Mar.29 8 A linear decay, similar to the HH case, is noticeable in the VH case. The values of the estimated slopes are reported in Table 4 below. Acquisition Mode VH HV SM db/year db/year IW db/year db/year EW db/year db/year Table 4 Estimated PG trends : period APR 2014 MAY 2015 (cross-pol) The slope of the linear decay appears stable with time up to May 2015, when a change in the slope is observed and the decay ceases. A closer view of the May 2015 September 2015 period is shown in figure below. The reason of the changed behaviour has been found to be related to an increase of the instrument temperature, in turn related to increased operational use, starting from March Figure 6 PG gain trend over time (closer view May-September 2015) It is noted that the evolution of the PG is compensated within the Level 1 processor, so the radiometric quality of the data is preserved. The source of the decay of the PG gain has been investigated in detail by analysis of the single calibration signals available (TX, RX, TA, APDN, EPDN). Following the signals routing within the


18 MPC-0139 DI-MPC-APR V ,Mar.29 9 instrument, the trends affecting the TX, the RX and the TA are compensated by the trends of the APDN and EPDN signals. From this analysis it can be seen that the TX power shows a decay in both H and V polarizations, that is partially compensated by a positive linear trend of the power in the RX chain (except for the jump visible in September 2014 which is related to the reconfiguration of the instrument receiving gain). The TA does not show a clear increasing or decreasing trend. Figure 7 Analysis of the single cal pulses gain over time. Top: TX cal, Mid: RX-EPDN cal, Bottom: TA-APDN cal.
19 MPC-0139 DI-MPC-APR V ,Mar Noise power monitoring The noise power is monitored through the dedicated internal calibration pulses processing embedded at the start/stop of each data-take. Figure below shows the noise power versus time in the period January-October Overall, the noise power has a good stability, with a standard deviation of approximately 1 db in the short term (within one orbit), which can be ascribed to the temperature variation round orbit. The steps that can be observed (for example on the 20 th Jan 2015 and throughout March, April and May 2015) are related to the tile #5 intermittent failure events (see section 3.1). Table below reports the noise power stability (3σ) averaged over the full reporting period, excluding the periods with tile #5 failed. The number in the parenthesis represents the number of products considered. Acquisition mode Noise power stability [db] SM HH: ± (740) VV: ± (1774) HV: ± (738) VH: ± (1505) IW HH: ± (5277) VV: ± (56168) HV: ± (1515) VH: ± (28753) EW HH: ± (65535) VV: ± (3790) HV: ± (41790) VH: ± (3480) WV HH: ± (1344) VV: ± (14820) Table 5 Noise power stability (3-sigma): period JAN 2015 DEC 2015 (co-pol)
20 MPC-0139 DI-MPC-APR V ,Mar Figure 8 Noise power versus time (IW mode).
21 MPC-0139 DI-MPC-APR V ,Mar Products Status 4.1. Level 0 Products Timeline and missing lines The L0 quality monitoring is carried out as a routine task within the QCSS. The checks on the timeline and missing lines have not detected significant problems I/Q statistics The analysis of I/Q bias and standard deviation allow to state that the L0 data quality is nominal. Figure shows the channel imbalance analysis for IW, showing the standard deviation that the two channels are very well aligned along the bisector of the I/Q plane. Figure 9 I/Q channel imbalance FDBAQ The FDBAQ quantization scheme performs nominally. A detailed analysis of the FDBAQ behaviour for the first year can be found in [S1-RD-10]. The long-term statistics over the acquired data show that the average Mbit/s are reported in the following table:
![MPC-0139 DI-MPC-APR V1.0 2016,Mar.29 13 Acquisition mode/swath Average bitrate [Mbit/s] S1 271.5 S2 213.36 S3 222.56 S4 188.58 S5 208.04 S6 178.39 IW 194.89 EW 62.32 WV1 11.8 WV2 6.](/docs-images/86/94869770/images/22-0.jpg "7 Table 6 Average bitrate for each acquisition mode. 4.")

22 MPC-0139 DI-MPC-APR V ,Mar Acquisition mode/swath Average bitrate [Mbit/s] S S S S S S IW EW WV WV2 6.7 Table 6 Average bitrate for each acquisition mode Instrument Pointing The instrument pointing in elevation has been calibrated during the commissioning phase exploiting the availability of the elevation notch acquisitions over the Amazonian rain forest. After the commissioning, the stability has been verified with additional acquisitions (Figure 10) that confirmed the validity of the calibration carried out during the commissioning phase. Table 7 reports the detailed measurements from the 12 th October 2014 and the 24 th July 2015 acquisitions. The estimated position of the notch (off-nadir angle) is reported in the second column and is compared to the angle extracted from the quaternions ( annotated roll error ) and the expected value from the theoretical roll steering law. 12 th October th July 2015 Figure 10 Elevation pointing verification with notch acquisitions over Amazon rain forest.
![MPC-0139 DI-MPC-APR V1.0 2016,Mar.29 14 Data set start time Estimated notch position [deg] Annotated roll error [deg] 24 th July 2015-30.1026-0.0039-0.](/docs-images/86/94869770/images/23-0.jpg "0011 Theoretical roll error mean [deg] 12 th October 2014-30.0788 0.01935 0.00937 Table 7 Elevation pointing verification.")
23 MPC-0139 DI-MPC-APR V ,Mar Data set start time Estimated notch position [deg] Annotated roll error [deg] 24 th July Theoretical roll error mean [deg] 12 th October Table 7 Elevation pointing verification. Plots of the spacecraft attitude (yaw, pitch and roll) are shown in Appendix I. The stability of the pointing in azimuth can be monitored through the Doppler Centroid, estimated directly from SAR data. Figure 11 shows the average Doppler Centroid on a data-take basis (dots) and on a daily basis (red line) versus time. The majority of the values are limited between +/-40 Hz, except for outliers reaching up to Hz. The bias varies along time in correspondence of the different configurations of the star trackers (STT). Activities are on-going in order to reduce the dependency wrt the STT configuration Hz + 12 Hz + 7 Hz - 10 Hz 6 SST changes STT 1+3 STT 1+2 STT 2+3 STT 1+2 STT 2+3 STT 1+3 Figure 11 Doppler Centroid versus time. Average on a data-take basis (dots) and daily average (red line). The star-trackers reconfigurations events are marked by the vertical black lines Level 1 Products A general summary of status of Level 1 products was presented at the 2015 CEOS SAR workshop (see [S1-RD-03]) Level 1 Processor Updates The main improvements introduced in the Level-1 Processor and impacting data quality are here below described, classified according to the release in which they have been included.
24 MPC-0139 DI-MPC-APR V ,Mar IPF v2.4.3 (09/03/2015) Improved Stripmap and Topsar radiometric normalization Improved management of SWST and SWL variations along orbit, in order to avoid issues (gaps, ) during merging of Topsar sub-swaths into GRD products IPF v2.5.0 (30/06/2015) Support to slicing mode processing, adding the possibility to process L0S products also when the associated L0A/C/N ones are not available (e.g. in NRT scenarios) Improved management or orbital information contained in L0S products (better propagation accuracy), in order to support NRT processing Verification, improvement and calibration of de-noising step and related annotations Optimization of L1 SAFE products generation routine performances, in particular for the writing of measurement TIFF files IPF v2.6.0 (09/10/2015) Improved orbital information annotation, reporting in the output L1 products the values really used for processing (e.g. external Restituted or Precise Orbit Files) Improved terrain height management during EAP correction, using one height value per subswath instead of only one for all the data Improved Quick Look scheme for dual polarization data, making it independent from the content of the acquired scene In addition to the described L1 Processor upgrades, a summary of S1-A Auxiliary Data Files (ADFs) updates during the reporting period is provided, together with an explanation of the updates, in Appendix F. The main ones are here below summarized: AUX_INS Range-variant RxGain correction coefficients refinement Activation of SWST bias compensation Internal calibration default settings (time delay, PG model and reference) refinement Support to Stripmap modes without interleaved calibration pulses AUX_PP1 Activation of range-variant RxGain correction Activation of internal calibration (i.e. PG) correction Processing gains and SAFE scaling LUT refinement AUX_CAL Introduction of complex EAP AAP update after TRM failures Noise calibration factors refinement Image Quality The DLR Transponders & Corner Reflectors, the BAE Corner Reflector and the Australian Corner Reflector array have been used to assess various impulse response function parameters as described below. The products analysed were acquired in 2015 and processed with the Sentinel-1 IPF v2.36, v2.43, v2.52, v2.53 and v2.60.
 Resolution (m) S1 4.")
25 MPC-0139 DI-MPC-APR V ,Mar Spatial Resolution The Figures and Tables below give the azimuth and range spatial resolutions derived from SM, IW and EW SLC data. The numbers in brackets indicate the number of measurements. Figure 12 SM Azimuth and Slant Range Spatial Resolutions Mode/Swath Azimuth Spatial Slant Range Spatial Resolution (m) Resolution (m) S1 4.33±0.03 (112) 1.72±0.01 (112) S3 3.56±0.04 (65) 2.54±0.02 (65) S4 4.79±0.02 (52) 2.97±0.01 (52) S6 4.85±0.02 (66) 3.56±0.01 (66) Table 8 SM Azimuth and Slant Range Spatial Resolutions Figure 13 IW Azimuth and Slant Range Spatial Resolutions Mode/Swath Azimuth Spatial Slant Range Spatial Resolution (m) Resolution (m) IW ±0.28 (634) 2.65±0.03 IW ±0.20 (418) 3.10±0.03 IW ±0.12 (127) 3.51±0.01 Table 9 IW Azimuth and Slant Range Spatial Resolutions
26 MPC-0139 DI-MPC-APR V ,Mar Figure 14 EW Azimuth and Slant Range Spatial Resolutions Mode/Swath Azimuth Spatial Slant Range Spatial Resolution (m) Resolution (m) EW ±0.34 (177) 7.93±0.07 (171) EW ±0.43 (38) 10.04±0.05 (38) EW ±1.04 (48) 11.75±0.11 (48) EW ±0.29 (40) 13.44±0.13 (40) EW ±0.19 (30) 14.57±0.11 (30) Table 10 EW Azimuth and Slant Range Spatial Resolutions With the exception of IW & EW azimuth resolutions, the measured spatial resolutions match the predicted resolutions as indicated by the rad horizontal lines. The slightly higher than expected IW& EW spatial resolutions is currently being investigated but is likely to be caused by an azimuth filter length being too short (this will be increased during an IPF update planned for early 2016) Sidelobe Ratios The table below gives the measured impulse response function sidelobe ratios derived from SM, IW and EW SLC data these indicate acceptable values. Mode/Swath Integrated Peak Sidelobe Spurious Sidelobe Sidelobe Ratio (db) Ratio (db) Ratio (db) SM ± ± ±1.65 IW ± ± ±2.98 EW ± ± ± ENL and Radiometric Resolution Table 11 SM & IW Sidelobe Ratios No specific Equivalent Number of Look (ENL) and Radiometric Resolution measurements were performed during Measurements below are re-produced from the S1-A Commissioning Phase Report ([S1-RD-01]):
27 MPC-0139 DI-MPC-APR V ,Mar Large uniform distributed targets are used to measure the equivalent number of looks (ENL) and radiometric resolution (RR) in both SLC and GRD imagery as given in below. For each swath/subswath and product type, the first number is the ENL while the second is the RR in db. SM1 SM2 SM3 SM4 SM5 SM6 SLC 0.938, , , , , , 3.09 GRDF 3.81, , , , , , 1.81 Table 12: SM ENL & RR Measurements IW1 IW2 IW3 SLC 0.947, , , 3.10 GRDH 4.56, , , 1.67 Table 13: IW ENL & RR Measurements EW1 EW2 EW3 EW4 EW5 SLC 0.940, , , , , 3.13 GRDH 2.72, , , , , 2.06 Table 14: EW ENL & RR Measurements Ambiguity Analysis Azimuth Ambiguities No specific ambiguity measurements were performed during Measurements below are reproduced from the S1-A MPC Commissioning Phase Report [S1-RD-01]: Azimuth ambiguities fall into two types: azimuth and range. Examples azimuth ambiguities are shown in Figure 15 to Figure 17 for SM, IW and EW modes for the ESA ESTEC transponder, which in these examples is located over dark ocean backscatter. Note that the early SM ambiguity is located at the end of the image. For these ambiguities it has been difficult to measure the ambiguity ratio as the ambiguities are contaminated by the extended azimuth sidelobe structure from the transponder mainlobe Unexpected Azimuth Ambiguities For the IW and EW transponder IRF, additional azimuth ambiguity like features can also be seen either side of mainlobe (see Figure 16 and Figure 17) this has been identified as being due to the length of the azimuth time unfolding and resampling filter used in the processing [AD-03]. The length of this filter is currently tuned for runtime performance. The length of this filter will be increased in a future release of IPF to reduce the impact of this additional ambiguity.


28 MPC-0139 DI-MPC-APR V ,Mar VV Figure 15: SM SLC Early Azimuth Ambiguity, ESTEC Transponder IRF and Late Ambiguity VH


29 MPC-0139 DI-MPC-APR V ,Mar HH Figure 16: IW Early Azimuth Ambiguity, ESTEC Transponder IRF and Late Ambiguity (A indicates nominal ambiguity locations and S are ships the non-nominal ambiguities are between the ambiguities and the IRF mainlobe) HV


30 MPC-0139 DI-MPC-APR V ,Mar HH Figure 17: EW Early Azimuth Ambiguity, ESTEC Transponder IRF and Late Ambiguity (A indicates nominal ambiguity locations and S are ships the non-nominal ambiguities are between the ambiguities and the IRF mainlobe) The table below gives mean azimuth ambiguity ratios for DLR transponder targets for SM, IW and EW modes. Note that for EW it can be hard to detect the azimuth ambiguities and so the values given should be considered as upper limits to the ambiguity ratio. HV Early Azimuth Ambiguity Ratio (db) Late Azimuth Ambiguity Ratio (db) SM IW EW ± ± ± ± ± ±3.15 Table 15: Azimuth Ambiguity Ratios
.")
31 MPC-0139 DI-MPC-APR V ,Mar Range Ambiguities Range ambiguities have been identified in one IW products to date. The full scene of the IW acquisition from 2nd November 2014 is shown in Figure 18 together two regions where range ambiguities are present (purple boxes). Figure 19 shows the middle ambiguity box where an extensive region of range ambiguities are seen together with non-ambiguous point targets including a wind farm. Two parts of Figure 19 are shown in Figure 20 and Figure 21 together with the source of the range ambiguities located in the city of Rotterdam, The Netherlands, some 150km away to the east. Finally, Figure 22 shows an ambiguous region in the right purple box together with the ambiguity source, which is the town of Waalwijk, The Netherlands. The source of these range ambiguities is at higher slant ranges than the ambiguities (the first far range ambiguity). The range ambiguity ratio has been estimated for the three ambiguous regions shown in Figure 20, Figure 21 and Figure 22. The mean ambiguity ratio is -25.1±4.2dB with the individual ratios being -29.1, and -25.4dB respectively. Figure 18: IW Image of SE England (showing the location of the BAE Corner Reflector) and N France with the location of two regions of range ambiguities indicated (acquisition 2nd November 2014, 17:40:53 UT).

 and the")
32 MPC-0139 DI-MPC-APR V ,Mar Figure 19: Extract of middle ambiguity region showing various range ambiguities plus other point targets. Figure 20: Detail of middle ambiguity region (left) and the source of the ambiguity in Rotterdam (right).
 and the source of the ambiguity in Waalwijk (right). 4.2.3.")

33 MPC-0139 DI-MPC-APR V ,Mar Figure 21: Detail of middle ambiguity region (left) and the source of the ambiguity in Rotterdam (right). Figure 22: Detail of right ambiguity region (left) and the source of the ambiguity in Waalwijk (right) Radiometric Calibration The DLR Transponders & Corner Reflectors, the BAE Corner Reflector and the Australian Corner Reflector array have been used to measure their radar cross-section as described below. The products analysed were acquired in 2015 and processed with the Sentinel-1 IPF v2.36, v2.43, v2.52, v2.53 and v2.60. As described in Section a major re-calibration was performed during 2015 for IW and EW mode acquisitions. All the radiometric measurements below have been corrected following this re-calibration.
34 MPC-0139 DI-MPC-APR V ,Mar An ESA User Note Radiometric Calibration of S-1 Level-1 Products Generated by the S-1 IPF (see Appendix C) was issued during 2015 to describe how the radar cross-section of distributed and point targets using GRD and SLC products can be calculated. Numerical examples are also included in the note (see Appendix C). For point target analysis using TOPS (IW & EW) SLC data it is necessary to remove a linear frequency modulation introduced by the electronic steering of the antenna in azimuth. This deramping step is described in another ESA User Note issued in 2015 Definition of the TOPS SLC deramping function for products generated by the S-1 IPF. Again a numerical example is included IW/EW Re-Calibration As described in the ESA User Note S1-A Radiometric Calibration Refinement#1 (see Appendix C) a major re-calibration was performed during the latter part of 2015 for IW and EW mode data applicable for both GRD and SLC data. This was primarily to correct the IW & EW polarimetric channel imbalance and IW absolute calibration. Further details are provided in the User Note. S1-A products processed with IPF v2.60 include the calibration refinement. All the radar cross-section measurements below include this re-calibration correction Absolute Radiometric Calibration DLR Transponders have been used to calculate the relative radar cross-section for SM, IW and EW modes during The results per mode are shown in Table 16 where mean (radiometric accuracy) and standard deviation (radiometric stability) of the relative radar cross-section in db are given. Note that the radiometric accuracy is close to zero while the radiometric stability is 0.5dB or better. The number of measurements is given in brackets. SM IW EW -0.14±0.50 (150) 0.00±0.33 (148) 0.07±0.43 (235) Table 16: SLC Relative Radar Cross-Section for the DLR transponders (db) The following results are also for the DLR transponders but are separated by polarisation. Figure 23 and Table 17 give the results for SM mode the relative radar cross-sections indicate a reasonable radiometric calibration but a proposed SM re-calibration would improve the measured mean relative radar cross-sections for each of the polarisations.
35 MPC-0139 DI-MPC-APR V ,Mar Figure 23: SM SLC Relative Radar Cross-Section for the DLR transponders VH VV HH HV S1-0.56±0.35 (11) 0.24±0.22 (11) -0.45±0.25 (13) 0.19±0.19 (13) S3-0.91±0.38 (13) -0.58±0.24 (13) -0.26±0.17 (12) 0.05±0.25 (12) S5-0.43±0.35 (9) 0.18±0.21 (9) 0.07±0.24 (17) 0.57±0.13 (17) Table 17: SM SLC Relative Radar Cross-Section for the DLR transponders (db) The IW and EW results below indicate a good radiometric calibration with many mean relative radar cross-section values close to zero (the radiometric accuracy) and a standard deviation of typically 0.3dB (the radiometric stability). Differences between polarisations are also small (see also Section ). Figure 24: IW SLC Relative Radar Cross-Section for the DLR transponders
36 MPC-0139 DI-MPC-APR V ,Mar Figure 25: EW SLC Relative Radar Cross-Section for the DLR transponders VH VV HH HV IW 0.09±0.36 (57) 0.00±0.27 (57) -0.39±0.23 (17) 0.13±0.14 (17) EW 0.13±0.47 (72) 0.25±0.39 (73) -0.31±0.30 (45) 0.05±0.25 (45) Table 18: IW & EW SLC Relative Radar Cross-Section for the DLR transponders (db) IW1 IW2 IW3 VH 0.05±0.38 (17) 0.05±0.27 (8) 0.12±0.38 (32) VV 0.00±0.30 (17) 0.16±0.29 (8) -0.03±0.25 (32) HH -0.38±0.19 (7) -0.31±0.31 (3) -0.44±0.26 (7) HV 0.12±0.06 (7) 0.29±0.11 (3) 0.07±0.17 (7) Table 19: IW SLC Relative Radar Cross-Section for the DLR transponders (db) EW1 EW2 EW3 EW4 EW5 VH 0.13±0.41 (33) 0.10±0.43 (10) 0.12±0.40 (11) -0.08±0.58 (10) 0.49±0.60 (8) VV 0.23±0.32 (34) 0.10±0.28 (10) 0.20±0.29 (11) 0.18±0.50 (10) 0.67±0.58 (8) HH -0.34±0.29 (27) -0.31±0.12 (4) -0.16±0.25 (5) -0.31±0.43 (5) -0.27±0.49 (4) HV -0.04±0.24 (27) 0.32±0.09 (4) 0.23±0.14 (5) 0.13±0.30 (5) 0.11±0.21 (4) Table 20: EW SLC Relative Radar Cross-Section for the DLR transponders (db)


37 MPC-0139 DI-MPC-APR V ,Mar The radiometric calibration results using the BAE Corner Reflector and IW SLC products are shown in Figure 26 from imagery acquired since March 2015 with IPF v2.43 and later (VV polarisation only). The derived relative radar cross-section is -0.03±0.12dB. Figure 26: IW SLC Relative Radar Cross-Section for the BAE Corner Reflector An array of 40 corner reflectors has been deployed near Brisbane, Australia as a component of the Australian Geophysical Observing System (AGOS) see [S1-RD-04] for further details. The CRs of are size 1.5m (34), 2.0m (3) and 2.5m (3) with fixed orientations. An example corner reflector and image response in a SM image are shown in Figure 27. Given that these corner reflectors have a fixed elevation and azimuth orientation they will not be pointing directly at S1-A. Thus the measured radar cross-section will be reduced compared to the case of a perfect orientation. Figure 28 (top and middle) shows the relative RCS from SM and IW acquisitions as a function of the difference in the actual elevation and that for a perfect orientation (the elevation offset). The red curve is the expected reduction in a trihedral corner reflector radar cross-section with elevation offset angle. The VV polarisation results show that the SM radar cross-section measurements at between -10 and -14 follow the expected radar cross-section reduction. Note that there is only a small offset in azimuth (< 2 ) which has a negligible impact on the measured radar cross-section. Figure 28 (bottom) shows standard deviation of SM and IW standard deviation for VV and HH polarisation for each individual corner reflector. For many corner reflectors, the standard deviation (i.e. the radiometric stability) is as low as 0.1dB. The mean standard deviation for SM VV is 0.16 db for IW VV is 0.21 db and for IW HH is 0.24dB. Figure 27: Example Australian Corner Reflector and Impulse Response
38 MPC-0139 DI-MPC-APR V ,Mar VV Polarisation HH Polarisation Figure 28: Australian CR relative RCS (top, middle) and RCS standard deviation (bottom) Permanent Scatter Calibration Figure 29 and Figure 30 show the Permanent Scatter Calibration series for a dataset of 12 Stripmap S6 products acquired over Chicago and for a dataset of 13 TopSAR IW products acquired over Milano. These indicate a good stability for the S1-A instrument and is a first demonstration of the PS-CAL processor operational readiness.

39 MPC-0139 DI-MPC-APR V ,Mar Figure 29 Permanent Scatter Calibration Time Series for Stripmap S6 over Chicago Figure 30 Permanent Scatter Calibration Time Series for TopSAR IW over Milan
40 MPC-0139 DI-MPC-APR V ,Mar Geometric Calibration Geometric calibration of S1-A was performed by the University of Zurich (UZH) on the basis of a time series of products acquired between Aug and Jan over two test sites in Switzerland: Torny-le-Grand and Dübendorf. Trihedral corner reflectors (CRs) whose positions were known with cm-level accuracy were used as reference targets. For calibration purposes, we initially focussed on StripMap (SM) products, as these have the best resolution and represent the native sensor characteristics more closely than other product types. Geolocation accuracy was estimated for IW SLC products as well, also acquired over the same two test sites in For a particular CR visible in an S1-A image product, its predicted azimuth and slant range image pixel position was calculated as follows: The surveyed CR position was adjusted for product-time plate tectonic drift and solid Earth tide (SET), as described in [S1-RD-06]. The relevant timing annotations were extracted from the product annotations; these included the azimuth zero-doppler time stamps, the orbital state vectors, the near-range fast time, and the range and azimuth sample spacings. Range-Doppler geolocation was performed for the CR coordinate as described e.g. in [S1- RD-08], giving a range and an azimuth time as the output. The resulting slant range prediction was corrected by adding the modelled atmospheric path delay, and the azimuth time was corrected by subtracting the bistatic residual. The effects and their associated correction are described in more detail in [S1-RD-06]. The above steps resulted in a range-azimuth predicted position for each target that could be compared to the position of the peak intensity in the image raster itself, i.e., the measured CR position. The differences between predicted and measured positions were then plotted, with the results shown for the SM and IW SLC product time series in Figure 31, at different key dates. Please refer to [S1-RD-06] and [S1-RD-07] for details on the evolution of the standard IPF processing and the geolocation methodology. ALE rg [m]: 1.23 ± 0.06 ALE az [m]: 1.79 ± 0.34 ALE rg [m]: 1.34 ± 0.33 ALE az [m]: 1.90 ± 1.49 (a) SM SLC (January 2015) (b) IW SLC (February 2015)
41 MPC-0139 DI-MPC-APR V ,Mar ALE rg [m]: 1.23 ± 0.06 ALE az [m]: 1.79 ± 0.17 (c) SM SLC (May 2015) (d) IW SLC (May 2015) Figure 31: ALE estimates for StripMap and IW SLC product time series using precise state vectors (AUX_POEORB) shortly after the calibration phase and after May In (a) and (c), each point represents a single SM SLC product over Torny-le-Grand (green) or Dübendorf (black). In (b), red and blue points represent single targets at Torny-le-Grand, while in (d) the points represent single products. Atmospheric path delay correction was applied by UZH in all cases. Bistatic residual correction was applied by UZH in (c) and (d), and the SWST (range) bias, taken from (a), was applied within the S1A processor beginning in May 2015, as can be seen in (c) and (d). The ALE estimates were originally made using data acquired and processed during the S1-A commissioning phase. The initial geolocation results based on SM SLC products served as a basis for an update to the Sampling Window Start Time (SWST) bias annotation in the instrument auxiliary files ingested by the S1-A processor (i.e. Figure 31(a)). All products processed after May 4, 2015 used the updated SWST bias, as can be seen in Figure 31(c) and (d), where the same plots are shown as they appear since May Figure 31(b) shows an early ALE scatterplot for several IW SLC products acquired over one of the Swiss test sites, Torny-le-Grand, with each point representing a single CR (two were visible in each product). The IW SLC plot shown in Figure 31(d) reflects the estimate of geolocation accuracy for this product type at the end of 2015, with each point representing a single product. The points form roughly two groups (upper and lower), which appear to be connected to a known subswath-specific relative offset (in this case, between beams IW2 and IW3) that is under continuing investigation. The ALE plots in Figure 31(c) and (d) indicate that the localisation performance is well within the original requirements (according to sections and in [S1-RD-09]).
42 MPC-0139 DI-MPC-APR V ,Mar Polarimetric Calibration Gain Imbalance The DLR transponders have been used to calculate the gain imbalance (the difference in radar cross-section between the two polarisations of dual polarisation products). Table 21 give a summary of the gain imbalance for the SM, IW and EW modes. As described in Section the IW and EW re-calibration during the latter part of improved the gain imbalance for these modes. Gain Imbalance (db) SM -0.52±0.25 (75) IW -0.06±0.32 (74) EW -0.21±0.29 (117) Table 21: Gain Imbalance using the DLR transponders The following results show the gain imbalance split between the two possible polarisation of VH/VV and HH/HV. Figure 32 and Table 22 give the gain imbalance for SM, IW and EW for acquisitions during 2015.
43 MPC-0139 DI-MPC-APR V ,Mar Figure 32: Gain Imbalance using the DLR transponders Phase Imbalance VH/VV HV/HH SM -0.56±0.26 (33) -0.49±0.25 (42) IW 0.08±0.21 (57) 0.52±0.16 (17) EW -0.12±0.25 (72) 0.36±0.28 (45) Table 22: Gain Imbalance using the DLR transponders The DLR transponders have been used to calculate the phase imbalance (the difference in peak phase between the two polarisations of dual polarisation products). Figure 33 and Table 23 give the gain imbalance for SM, IW and EW for acquisitions during As expected the phase difference is close to zero. Figure 33: Phase Imbalance using the DLR transponders.
 Table 23: Phase Imbalance using the DLR transponders The ESA transponders deployed during the Commissioning Phase and the DLR transponders both provide an impulse response in both")

44 MPC-0139 DI-MPC-APR V ,Mar Coregistration Phase Difference ( ) SM -0.77±0.73 (75) IW -0.93±0.51 (74) EW -1.37±0.85 (92) Table 23: Phase Imbalance using the DLR transponders The ESA transponders deployed during the Commissioning Phase and the DLR transponders both provide an impulse response in both polarisations of dual polarisation imagery. Figure 34 shows examples of SM, IW & EW co-registration for ESA and DLR transponders (the SM acquisitions are shown at full resolution while for the IW & EW acquisitions, oversampled images are shown). In all three examples the co-registration was zero in both range and azimuth. Table 24 below shows that the average measured polarimetic co-registration derived from SLC products acquired during 2015 is very small (the IRF peak position is measured to a 1/8 of a pixel). ESA NLR (S6 SLC HH) ESA NLR (S6 SLC HV)
 DLR D39 (IW SLC HV)")

 Number of")

45 MPC-0139 DI-MPC-APR V ,Mar DLR D39 (IW SLC HH) DLR D39 (IW SLC HV) DLR D41 (EW SLC HH) DLR D41 (EW SLC HV) Figure 34: SLC Co-registration Examples Mode/Swath Range Co-registration Accuracy (m) Azimuth Coregistration Accuracy (m) Number of Measurements SM 0.03± ± IW 0.01± ± EW 0.02± ± Table 24 Polarimetric Calibration Measurements

 of dual polarisation")
:")

46 MPC-0139 DI-MPC-APR V ,Mar Cross-talk The point targets used for the cross-talk analysis are either the DLR or BAE trihedral corners reflector as they both provide an impulse response in only one polarisations (HH or VV) of dual polarisation imagery. Figure 35 shows examples of SM, IW & EW cross-talk for DLR corner reflector (the images shown are oversampled): the measured cross-talk for SM is -30.6dB, for IW is dB while for EW no cross-talk IRF could be identified. Based on results from the Commissioning Phase, Table 25 below shows that the measured cross-talk is very low. The majority of the cross-talk measurements are from SM and IW imagery but does include some EW measurements even though in many cases a response cannot be identified in the corresponding cross-polarisation image. DLR CR D38 (S5 SLC VV) DLR CR D38 (S5 SLC VH) DLR CR D38 (IW SLC HH) DLR CR D38 (IW SLC HV)

.")
47 MPC-0139 DI-MPC-APR V ,Mar DLR CR D42 (EW SLC HH) DLR CR D42 (EW SLC HV) Figure 35: SLC Cross-talk Examples Corner Reflector Cross-talk (m) Number of Measurements -38.7± Table 25: SLC Cross-talk Elevation Antenna Patterns With the IPF v2.45 update in May 2015 the elevation antenna pattern was changed to be complex but the gain of the elevation antenna patterns for all modes were not changed. These complex EAPs were included in the AUX_CAL auxiliary files generated on 4th May 2015 (see Appendix F). As part of the IW and EW re-calibration during the latter part of the 2015, as described in the ESA User Note S1-A Radiometric Calibration Refinement#1 (see Appendix C), the elevation antenna patterns were adjusted by applying a linear ramp. The other adjustment was refining processing gains Azimuth Antenna Patterns During January 2015 the Azimuth Antenna Patterns (AAPs) were updated in AUX_CAL auxiliary files generated on 19th January 2015 (see Appendix F). These changes were made for all modes except WV mode to take into account the failed Tile 4 TRMs that occurred on 05-May-2014 and 09-June (see Appendix D). An example of the difference between the previous (pre-launch) and updated azimuth antenna patterns is shown in Figure 36 for SM mode, swath 6 and HH polarisation. The blue curve is the pre-launch pattern; red curve is the updated pattern with the Tile 4 TRM failures while the greed curve is the difference. Similar differences are found for other modes, swaths and polarisations.
48 MPC-0139 DI-MPC-APR V ,Mar Figure 36 Example Updated Azimuth Antenna Pattern Also with the IPF v2.45 update in May 2015 actual WV mode AAPs derived from the antenna model were included (rather than the flat patterns previously used). These were included in AUX_CAL auxiliary files generated on 4th May 2015 (see Appendix F) Noise Equivalent Radar Cross-section Examples of S1-A imagery with low ocean backscatter have been used to estimate the Noise Equivalent Radar Cross-Section (NESZ) for all modes and swaths. These are shown in Figure 37 to Figure 40 for SM, IW, EW and WV modes respectively based on imagery acquired during 2014 and For all but WV mode, the majority of the NESZ estimates have been performed in crosspolarisation (HV or VH) as the ocean backscatter is much lower compared to co-polarisation. For WV mode where the imagettes are only acquired in co-polarisation, suitable data has been selected by the extraction of the I and Q channel standard deviation parameters from annotation products (a low standard deviation indicates a low radar cross-section). In addition to the measured NESZ, all the plots show the predicted NESZ (at low and high orbital altitudes). In Figure 37 for SM, the measured NESZ are close to the predicted NESZ. In addition, for many SM swaths the measured NESZ exceeds the NESZ requirements of -22 db. The main exception is SM3 where the measured NESZ is -20dB at mid-swath. For some of the other swath, the requirement is not met at the edges of the swath.
49 MPC-0139 DI-MPC-APR V ,Mar S1A_S1_GRDH_1SDH_ T140027_ T140055_003891_004AA7_BF83.SAFE S1A_S1_GRDH_1SDV_ T164844_ T164908_003951_004C09_3702.SAFE S1A_S2_GRDH_1SDH_ T042942_ T043016_003871_004A30_0213.SAFE
50 MPC-0139 DI-MPC-APR V ,Mar S1A_S2_GRDH_1SDV_ T112626_ T112655_003729_004706_DBAB.SAFE S1A_S3_GRDH_1SDH_ T135226_ T135255_004343_0054C1_ADEE.SAFE S1A_S3_GRDH_1SDV_ T140019_ T140047_003716_0046AB_447A.SAFE
51 MPC-0139 DI-MPC-APR V ,Mar S1A_S4_GRDH_1SDV_ T042316_ T042335_003623_004494_F2EB.SAFE S1A_S4_GRDH_1SDH_ T022659_ T022724_003753_004794_183E.SAFE S1A_S5_GRDH_1SDH_ T063052_ T063110_003449_004087_FC6C.SAFE
52 MPC-0139 DI-MPC-APR V ,Mar S1A_S5_GRDH_1SDV_ T070256_ T070315_003741_00474D_C69B.SAFE S1A_S6_GRDH_1SDH_ T103142_ T103210_003816_0048FC_898D.SAFE S1A_S6_GRDH_1SDV_ T042120_ T042154_003623_004493_2D18.SAFE Figure 37: NESZ measures for SM. Blue is the measured NESZ and the red lines are the predicted NESZ at minimum and maximum orbital altitudes.
53 MPC-0139 DI-MPC-APR V ,Mar In Figure 38 for IW and Figure 39 for EW, the -22 db requirement is met at all sub-swaths and all off-boresight angles. For IW the measurements are slightly better than the prediction while for EW the measurements are slightly worse than the prediction. S1A_IW_GRDH_1SDH_ T061844_ T061913_004353_0054FC_3A7B.SAFE S1A_IW_GRDH_1SDV_ T063520_ T063545_003449_00408B_59BA.SAFE Figure 38: NESZ measures for IW. Blue is the measured NESZ and the red lines are the predicted NESZ at minimum and maximum orbital altitudes.
54 MPC-0139 DI-MPC-APR V ,Mar S1A_EW_GRDH_1SDH_ T173642_ T173746_003456_0040B5_8F0F.SAFE S1A_EW_GRDH_1SDV_ T113419_ T113519_003627_0044B1_385B.SAFE Figure 39: NESZ measures for EW. Blue is the measured NESZ and the red lines are the predicted NESZ at minimum and maximum orbital altitudes. Figure 40 shows the measured NESZ for WV mode all met the -22 db requirement and they are all slightly better than the predicted NESZ. Note the NESZ is significantly higher for imagette WV2 than for WV1. For WV1 VV there is some structure in the imagette which accounts for the structure in the NESZ measurement in the far range portion of the imagette. The number after the file name refers to the imagette number within the product.
55 MPC-0139 DI-MPC-APR V ,Mar S1A_WV_SLC 1SSH_ T123642_ T124843_004415_00565A_D1D2.SAFE (009) S1A_WV_SLC 1SSH_ T022919_ T024051_004394_0055E1_C17C.SAFE (036) S1A_WV_SLC 1SSV_ T014102_ T020318_004656_005BF6_11FA.SAFE (025)

56 MPC-0139 DI-MPC-APR V ,Mar S1A_WV_SLC 1SSV_ T152948_ T154021_004548_005968_27D3.SAFE (020) Figure 40: NESZ measures for WV. Blue is the measured NESZ and the red lines are the predicted NESZ at minimum and maximum orbital altitudes. With the IPF v2.51 update in July 2015 the noise calibration factors were updated. These factors are used to calculate the denoising vectors included in the product annotation. The update was from default values to those corresponding to the theoretical NESZ curves shown above. The associated auxiliary file updates were made on 3rd July 2015 (see Appendix F). A further refinement was performed in September 2015 to reflect the actual NESZ profiles indicated in the above plots the associated auxiliary file updates were made on 8th September 2015 (see Appendix F) Summary of Anomalies Radio Frequency Interference As small percentage of Sentinel-1A imagery is affected by the presence of Radio Frequency Interference from the ground. An example is shown below over Germany (the red crosses are the location of some of the DLR corner reflectors and transponders. Usually RFI only affects a few range lines of raw data. S1A_IW_GRDH_1SDV_ T171526_ T171555_008137_00B6BD_A92D.SAFE Figure 41: An example of Radio Frequency Interference

 their repeat periods are a multiple of")

57 MPC-0139 DI-MPC-APR V ,Mar Radarsat-2/Sentinel1-A Mutual Interference Although the orbit altitude of Radarsat-2 and Sentinel1-A are quite different (789 km and 693 km respectively) their repeat periods are a multiple of each other (24 days and 12 days respectively) and their equatorial crossing times are almost the same (~18:00 hrs at the ascending node). Another similarity is that both SARs operate at the same frequency. The repeat period and crossing times mean that every 24 days, Radarsat-2 will be directly above Sentinel-1 and hence both may be imaging the region of the Earth s surface at the same time. If this occurs then mutual interference is detected. Figure 42 shows an example in Sentinel-1A imagery over Italy banding can be seen in IW sub-swaths for a duration of a few minutes. Similar interference is seen in Radarsat-2 imagery. As the exact equatorial crossing time of the two satellites is slowly drifting (by a few seconds per cycle), the exact location of the mutual interference moves to a different latitude every 24 days ([S1-RD-05]). S1A_IW_SLC 1ADV_ T _ T165711_ _009FF3_1C25.SAFE Other Anomalies S1A_IW_SLC 1ADV_ T165709_ T165737_ _009FF3_BEAC.SAFE Figure 42: An example of Radarsat-2/Sentinel1-A Interference S1A_IW_SLC 1ADV_ T _ T165711_ _009FF3_1C25.SAFE An unusual anomaly identified by a user is shown in Figure 43 for a region near Beijing, China the anomaly being the series of almost straight white lines. Close examination of these see Figure 44 concluded that they were due to trains. Any object moving with a component of its velocity in the range direction will lead to a displacement in azimuth. Figure 44 (left) shows the train and the fainter track as the range velocity reduces so does the azimuth displacement between the track and train (as expected). Figure 44 (right) also include one of the azimuth ambiguities towards the bottom of the image.


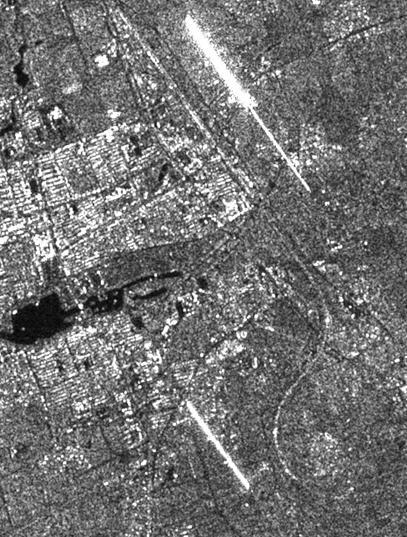
58 MPC-0139 DI-MPC-APR V ,Mar S1A_IW_GRDH_1SSV_ T222018_ T222047_002744_003146_8417 Figure 43: An unusual user anomoly Quality Disclaimers Figure 44: Detail of an unusual user anomoly Quality disclaimers issued during 2015 are given in Appendix H.

59 MPC-0139 DI-MPC-APR V ,Mar Level 2 products Wind measurement Image Mode (SM-IW-EW) The SAR wind measurement is strongly dependant of the product calibration accuracy. Thus, its quality has improved during 2015 as far the calibration of the products has improved. It takes benefit from the efforts made on the SAR Level1 products to improve the calibration constant and align the gamma profile as the function of the elevation angle over Rain Forest. These improvements reduce the wind measurements error belong the subswath and subswath by subswath. Statement of the wind measurements accuracy: The strategy to assess the accuracy of the wind retrieval is to compare it with an auxiliary wind source which is used as a reference. This source could be in-situ data from buoy, other satellite data (ex: scatterometer) or atmospherical model outputs. It is important to outline the importance to multiple the types and the number of the data used as reference, due to their coverage, resolution or possible bias. In this scope, Ifremer has performed systematic collocations with such data (model: ECMWF (global), Arome, Arpege (European), hundreds of buoys, etc.) with L2 products generated by the ESA-IPF by PDGS. Figure 45 presents the performances achieved on the month of December 2015 for IW mode in VV polarisation of the retrieved wind compared to model references (Arome, Arpege and ECMWF). It can be noticed the strong correlation of the SAR-derived wind speeds with the wind references. The bias and the RMS are less important for ECMWF re-analysis since the wind inversion is based on the ECMWF forecast as an a priori wind input. The observed bias (differences between the dotted line and the diagonal) is really close to zero when the number of observations is significant (red part on the diagram). As expected, at low wind speeds, the NESZ impacts the SAR wind measurement (surestimation). At high wind speeds, the SAR tends to sub estimate the wind speed; however the number of samples is low, and may not be sufficient to conclude. A typical RMS of 1.5m/s to 2m/s is observed. The quality of the wind product derived for this mode is fairly good. Same kind of performances (bias nearly equal to zero and RMS of about 2m/s) is achieved on EW HH mode. Other modes such as SM, IW in HH and EW in VV are rarely acquired or processed up to Level 2 products. a) Arome b) Arpege HR
 ECMWF Figure 45: SAR Wind speed compared with reference wind speed for IW mode VV polarization.")
60 MPC-0139 DI-MPC-APR V ,Mar bias Arome m/s Arpege m/s ECMWF m/s Rms 2.00m/s 1.93 m/s 1.68 m/s c) ECMWF Figure 45: SAR Wind speed compared with reference wind speed for IW mode VV polarization. Improvement performed during 2015: Many improvements have been performed during this year related to the way to handle the a-priori wind speed/direction -necessary for the wind inversion- and provided via the AUX_WND files (containing ECMWF forecast in GRIB format). A first improvement was performed on June 2015, by patch of the IPF, allowing the correction of the reading of the zonal and meridional components of the a priori wind, which were in some cases reversed. During July 2015, an update of the task table at the PDGS level has improved the way to handle the AUX_WND, ensuring the right choice with the closest validity date and the most recent production date. In addition since the IPF2.60 release (November 2015), the production of OWI wind product is not performed (test at the beginning of the L2 processing) in the case of invalid AUX_WND (not specified or with validity date is not in between plus/minus 1h30 compared to the product acquisition date). Finally, it has to be outlined that during 2015, the calibration level of the L2 products has been aligned with the L1 products, as it was different due to the differences in the processing of internal IPF products. This has been performed at the end of November 2015 by an AUX_PP1 update. The remaining issues on the L2 wind product (OWI) should then be related on the SAR wind retrieval algorithm, the input parameters and/or the L1 quality. Coming Improvements for 2016: Some improvements of the SAR retrieved wind measurement remains in the scope of Issue regarding to the look angle. It has been recently found a minor issue on the look angle (relative angle between the input wind direction compared to the SAR geometry) used in the OWI process. This should be solved in the beginning of 2016, and will result in reducing the standard deviation and reduce bias (when a low number of occurrences) on the statistics of the SAR derived wind speed compared with the reference wind speed. 2. Issue with the Bright Target The aim of the Pbright algorithm is to remove bright targets (such as the ships for example) on the averaging of the scattering level (normalized radar cross section) on the cell where the wind retrieval is performed to avoid their contribution. The results of the Pbright algorithm are not optimal and tend of surestimating the numbers of bright targets in the wind cell. It means that it reduce the number of points for the averaging, and then could result in a less-confident and underestimated SAR-retrieved wind speed. An update of the processing parameters will be needed via the AUX_PP2.
61 MPC-0139 DI-MPC-APR V ,Mar Activation of the noise removal The activation of the noise removal will allow to reduce the impact of the NESZ on the wind measurements especially for low-to-moderate wind speed and for wind measurements performed at high incidence angle, resulting on a surestimation of the SAR derived wind speed and possible modulation of the profile of the measured wind speed by the antenna lobe Swell Measurement Wave Mode In 2015, there have been several updates of the LOP for waves inversion. Among them the three most important are: The filtering of energy at low frequency. It aims at filtering the signature of ships or rain. Coefficients have been tuned to allow a better detection of the long swell. Indeed the largest size of the imagettes allows to measure longer swells than with Envisat/ASAR. The computation of the image modulation spectra. Also to take advantage of the new resolution and size of Sentinel-1 and get a better resolution in the wavenumber domain, the size of the periodogram used for the spectra computation has been doubled. Ocean wave spectrum resolution. It has been changed to be consistent with the improved resolution of the image modulation spectra. The performances are estimated by comparison between the significant wave height of the long waves as measured by Sentinel-1 and produced by Wave Watch 3 model (WW3). WW3 is used to produce a 2D ocean wave spectra for each Sentinel-1 acquisition. On a statistical basis, WW3 is used as the reference. For both S-1A and WW3, the significant wave height of the long waves is estimated by integration of the 2D ocean wave spectra up to the cut-off values (above this value, the inversion is not expected to work). Figure 46 illustrates the significant wave height performances for the month of December 2015 in Wave Mode 1 and Wave Mode 2. There is a remaining bias (0.87 m) for Wave Mode 1. Figure 46: Significant wave height for the long waves performances for December 2015 in Wave Mode 1 (left) and Wave Mode 2 (right). The model outputs from WW3 are considered as reference here. This is only valid from a statistical point of view. Improvement performed during 2015: Figure 47 shows the monthly performances with respect to time in Note that no performances indicator have been estimated for April due to a lack of reference data (to be resolved soon). We

62 MPC-0139 DI-MPC-APR V ,Mar observe a significant change after May In particular, this yields to a switch between WV1 and WV2 performances. Indeed before summer, WV1 results are good when compared to WW3 whereas significant wave heights from WV2 are underestimated. After May 2015, this is the contrary: WV2 results are good and significant wave heights from WV1 are overestimated. For the last 7 months, we observe fewer fluctuations. Indeed, the IPF is now stabilized. We observe a remaining bias for both Wave Mode 1 whereas Wave Mode 2 bias is close to zero. Figure 47: Monthly performances for WV1 (top-left) and WV2 (top-right) and number of acquisitions co-located to reference data for validation for WV1 (bottom-left) and WV2 (bottomright). Thick solid lines stand for the mean difference between Sentinel-1 and WW3 model significant wave height. Coming Improvements for 2016: The reason of the changes in the significant wave height performances in Summer 2015 is still under investigation and is the priority for the beginning of This is a pre-requisite to stabilize the optimal version (with respect to the ATBD [S1-RD-11]) of the swell inversion algorithm before going further for fine tuning of the modulation transfer functions. Improvements performed during Q1 2016: During Q1 2016, several changes were put in place in order to improve these performances: - Tuned X and Y-Hanning filters are now applied to the cross co-variance for smoothing to compensate for the large periodogram sizes. - An adhoc RAR MTF is estimated taking into account this change, tested over the May 2015 dataset (related to AUX_SCS auxiliary files). - An adhoc tuning of the total MTF is estimated separately for wv1 and WV2 in order to remove the different bias between the two incidence angles. - Improvements brought to the partitioning algorithm are also expected to further improve the estimation of the integral parameters Radial Velocity Measurement Wave Mode The radial velocity measurement is derived from the Geophysical Doppler anomaly. In the S-1 IPF, this geophysical Doppler is estimated by: F dcrvl =F dcsar F dcattitude F dcantenna where:
 Fdcantenna is the antenna contribution related to TRM drifts, failures, misalignements, etc At global scale, the expected")
63 MPC-0139 DI-MPC-APR V ,Mar FdcSAR is estimated from the SAR data FdcOcean is the component related to the ocean radial velocities. FdcAttitude is estimated from the geometry knowledge (quaternion based) Fdcantenna is the antenna contribution related to TRM drifts, failures, misalignements, etc At global scale, the expected relationship between the geophysical Doppler and the sea state (or ocean surface wind vector) is well known since Envisat/ASAR. The performances of the geophysical Doppler are assessed by estimating the bias between the expected Doppler given the sea state conditions (provided by ECMWF) and the geophysical Doppler as included in the Level 2 products. Statement of the ocean surface radial velocities measurements accuracy: Figure 48 shows the geophysical Doppler as included in the Level 2 products as a function of radial wind speed (wind speed projected in the line of sight of the radar). The colour code indicates the latitude. As observed, the Doppler and the radial wind speed are strongly correlated for both WV1 and WV2. However, the colour code indicates a clear and non-geophysical dependence to the latitude. In addition, Doppler is not 0 Hz (as it should be) when radial wind speed is 0 m/s for WV1 and WV2. This shows that the Doppler shift as processed at PDGS is not only related to ocean surface radial velocities. This prevents us for getting any quantitative geophysical signature such as ocean surface currents in the product. Figure 48: Geophysical Doppler as included in the Level 2 products as a function of radial wind speed (wind speed projected in the line of sight of the radar) for WV1 (left) and WV2 (right). The colour code indicates the latitude. Improvement performed during 2015: In 2015 the daily monitoring of this relationship allowed us to show the residual Doppler from the instrument/platform contribution (FdcAttitude and/or Fdcantenna) in geophysical Doppler. In particular, our systematic analysis revealed a contamination with respect to latitude in the geophysical Doppler. Complementary acquisition in WM over land where the geophysical Doppler is expected to be zero showed the same results. Figure 49 shows the bias as a function of latitude estimated both over ocean (blue) and land (brown). In spite of the low number of available acquisitions over land, both show Doppler variation up to 30 Hz. As observed on Figure 6, expected the geophysical signature is expected to be between -60 and 60 Hz. 30 Hz of contamination is thus far too much for ocean current applications.
 observed in the land Doppler between wv1 and wv2 can be well predicted by the recent antenna model as shown in Figure 50.")
64 MPC-0139 DI-MPC-APR V ,Mar Figure 49: Doppler bias as a function of latitude estimated over ocean (blue) and land (brown). The differences (around 10Hz) observed in the land Doppler between wv1 and wv2 can be well predicted by the recent antenna model as shown in Figure 50. Coming Improvements for 2016: In 2016, we will pursue the careful monitoring of the Doppler calibration using geophysical calibration. We recommend continuing acquisitions over land as there are still differences between analysis over land and ocean. Moreover a strategy to replace acquisition over land will be proposed and evaluated. The benefit of using a new antenna model will be assessed and investigations to propose a a- posteriori calibration will be undertaken. Figure 50: Geometric Doppler, data Doppler, and EM Doppler differences between wv1 and wv2 acquired over rain forest areas in VV (left) and HH (right) polarizations TOPS Mode Statement of the ocean surface radial velocities measurements accuracy: As for Wave Mode, the contamination of the geophysical Doppler by the geometry knowledge (quaternion based) and the antenna contribution prevents us for getting any quantitative geophysical signature such as ocean surface currents in the product. Nevertheless, in cases where land areas are present in the image an ad-hoc calibration has been performed, and the results shown are promising (see Figure 51).

65 MPC-0139 DI-MPC-APR V ,Mar Figure 51: Radial velocity field from Sentinel 1A IW RVL product acquired over Agulhas in ascending mode. Here land areas are used to calibrate the Doppler anomaly before computing the radial velocity. A clear signature of the Agulhas current is observed as well as wind/wave induced velocity. Improvement performed during 2015: A main issue has been the compensation of the measured Doppler for the electromagnetic (EM) Doppler bias introduced by the skewness of the antenna elevation pattern. A refined antenna model has been implemented as part of the Level 2 processor and the EM Doppler bias over IW and EW swaths are compared with the data driven Doppler estimated over rain forest areas (see Figure 52). Although the relative trends over swaths are predicted well, a significant Doppler bias is observed between the model and data. The jumps between swaths are also not well predicted.
66 MPC-0139 DI-MPC-APR V ,Mar Figure 52: Left: EM doppler offset computed from antenna model with error matrix corresponding to the day of acquisition. Right: Doppler offset computed from rain forest data. Upper panel is S1A IW mode and lower panel is EW mode. The azimuth scalloping in the RVL Doppler related to the burst overlap areas have been addressed, and a de-scalloping is implemented. This reduces the scalloping to around ±3 Hz (see Figure 53). Figure 53: RVL product Doppler offset in azimuth before (black) and after (red) de-scalloping for each swath of IW mode. The data are acquired over rainforest, and the azimuth profiles area obtained by averaging in range.
67 MPC-0139 DI-MPC-APR V ,Mar Coming Improvements for 2016: In 2016, there will be an improved antenna model for use by the Level 2 RVL processor. It is expected that this will further improve the EM Doppler offset prediction. The benefit of using a new antenna model will be assessed and investigations to propose an a-posteriori calibration will be undertaken for TOPS mode. A further refinement of the de-scalloping will be investigated without increasing the processing time.
68 MPC-0139 DI-MPC-APR V ,Mar Appendix A - List of Acronyms AD ADF RD TBC TBD TRM Applicable Document Auxiliary Data File Reference Document To be confirmed To be defined Transmit Receive Module
69 MPC-0139 DI-MPC-APR V ,Mar Appendix B - S1-A Orbit Cycles and N-Cyclic Reports The table below gives the cycle number with start and stop acquisition dates during The start of a cycle is at approximately 18:00 UT on the dates below. Cycle Start Date End Date 38 09/01/ /01/ /01/ /02/ /02/ /02/ /02/ /02/ /02/ /03/ /03/ /03/ /03/ /04/ /04/ /04/ /04/ /04/ /04/ /05/ /05/ /05/ /05/ /06/ /06/ /06/ /06/ /06/ /06/ /07/ /07/ /07/ /07/ /08/ /08/ /08/ /08/ /08/ /08/ /09/ /09/ /09/ /09/ /09/ /09/ /10/ /10/ /10/ /10/ /11/ /11/ /11/ /11/ /11/ /11/ /12/ /12/ /12/ /12/ /01/ /01/ /01/2016
70 MPC-0139 DI-MPC-APR V ,Mar Appendix C - ESA S1-A Technical Reports The following ESA S1-A Technical Reports were issued during 2015: Nuno Miranda, Definition of the TOPS SLC deramping function for products generated by the S-1 IPF, COPE-GSEG-EOPG-TN , Issue 1, Revision 2, April Nuno Miranda, P.J. Meadows, Radiometric Calibration of S-1 Level-1 Products Generated by the S-1 IPF, ESA-EOPG-CSCOP-TN-0002, Issue 1, Revision 0, May Nuno Miranda, Sentinel-1 Instrument Processing Facility: Impact of the Elevation Antenna Pattern Phase Compensation on the Interferometric Phase Preservation, ESA-EOPG-CSCOP- TN-0004, Issue 1, Revision 0, July Nuno Miranda, S-1A TOPS Radiometric Calibration Refinement#1, ESA-EOPG-CSCOP-TN- 0012, Issue 1, Revision 0, November 2015.
71 MPC-0139 DI-MPC-APR V ,Mar Appendix D - S1-A Transmit Receive Module Failures The following S1-A antenna Transmit/Receive Module (TRM) failed during 2015 (a full list since launch can be found in Appendix B of any S1-A N-Cyclic Performance Report): TRM Description Date of Failure Tile 5, all TRM failures (intermittent) Tile 5, all TRM failures (intermittent) Tile 12, Row 16 (intermittent) Tile 5, all TRM failures (intermittent) Tile 12, Row 16 (intermittent) Tile 5, all TRM failures (intermittent) Rx, H & V Rx, H & V Tx V & Rx V Rx, H & V Tx V & Rx V Rx, H & V Between 18-Mar-2015, 04:09:00 UT and 20-Mar- 2015, 11:46:30 UT Between 26-Mar-2015, 16:20:00 UT and 28-Mar- 2015, 02:50:30 UT Between 16-Apr-2015 and 18-Apr-2015 Between 18-Apr-2015, 17:40:21 UT and 24-Apr- 2015, 17:48:08 UT Between 20-Apr-2015 and 28-Apr-2015 Between 25-Apr :37:37 UT and 30-Apr- 2015, 23:01:11 UT Tile 4, Row 11 Rx H 29-Apr-2015, 21:57:30 UT Tile 12, Row 16 (intermittent) Tile 5, all TRM failures (intermittent) Tx V & Rx V Rx, H & V Between 01-May-2015 and 04-May-2015 Between 05-May-2015, 05:12:51 UT and 06-May- 2015, 00:44:43 UT Tile 12, Row 16 Tx V & Rx V 18-May-2015, 22:33:36 UT Tile 5, all TRM failures Rx, H & V Between 26-May-2015, 19:06:00 UT and 27-May-2015, 06:07:00 UT Tile 5, all TRM failures Rx, H & V Between 06-Jun-2015, 06:35:00 UT and 14-July- 2015, 10:43:00 UT Tile 5, all TRM failures Rx, H & V Between 17-July-2015, 19:07:00 UT and 21-July- 2015, 11:58:00 UT
72 MPC-0139 DI-MPC-APR V ,Mar Appendix E - S1-A Instrument Unavailability The S1-A instrument was unavailable during 2015 (a full list since launch can be found in Appendix C of any S1-A N-Cyclic Performance Report): Start Date/Time End Date/Time MPC Summary Reference 20/01/ :30 20/01/ :00 SOB-112 Sentinel-1A Unavailability - Planned maintenance 01/02/ :50 02/02/ :26 SOB-116 Sentinel-1A unavailability from 01/02/2015 7h50 to 02/02/ h27 17/02/ :56 18/02/ :02 SOB-118 Sentinel-1A Unavailability - since 17/02/15 evening to 18/02/15 afternoon 19/02/ :29 20/02/201510:15 SOB-121 Sentinel-1A unavailability from 19/02/ h29 to 20/02/ h15 14/04/ :30 14/04/ :00 SOB-147 Sentinel-1A unavailability planned on 14/04/2015 for maintenance 09/05/ :19 10/05/ :39 SOB-159 Sentinel-1A unavailability on 10/05/ /05/ :00 19/05/ :00 SOB-168 Sentinel-1A planned unavailability on 19/05/2015 (RDB#4 uplink onboard) 28/05/ :00 28/05/ :30 SOB-170 Planned Sentinel-1A unavailability on 28/05/2015 for maintenance purpose 20/06/ :30 21/06/ :00 SOB-176 Sentinel-1A unavailability on 20 and 21/06/ /07/ :35 22/07/ :21 SOB-206 Sentinel-1A Planned Unavailability (RDB#5) 03/08/ :37 03/08/ :33 SOB-207 Sentinel-1A Unavailability from orbit 7093 to /08/ :52 04/08/ :47 SOB-208 Sentinel-1A Unavailability from orbit 7103 to /08/ :44 05/08/ :20 SOB-209 Sentinel-1A Unavailability from orbit 7120 to /08/ :22 10/08/ :14 SOB-210 Sentinel-1A Unavailability from orbit 7192 to /09/ :54 05/09/ :08 SOB /09/ :20 23/09/ :56 SOB /10/ :28 20/10/ :27 SOB /10/ :54 22/10/ :12 SOB-227 Sentinel-1A Unavailability from 04/09 to 05/09/2015 Sentinel-1A Unavailability from orbit 7840 to 7842 Sentinel-1A Unavailability from 19/10 to 20/10/2015 Sentinel-1A Unavailability from 21/10 to 22/10/2015
73 MPC-0139 DI-MPC-APR V ,Mar Start Date/Time End Date/Time MPC Reference 05/11/ :50 06/11/ :20 SOB : :10 SOB-230 Summary Sentinel-1A Unavailability from 05/11 to 06/11/2015 Sentinel-1A Unavailability from 07/11 to 08/11/ : :28 SOB-233 Sentinel-1A Unavailability on 18/11/ /11/ :54 30/11/ :10 SOB-251 Sentinel-1A Unavailability from 29/11 to 30/11/ /12/ :30 10/12/ :00 SOB-252 Sentinel-1A Planned Unavailability on 10/12/ /12/ :30 11/12/ :00 SOB-253 Sentinel-1A Unavailability on 11/12/2015
74 MPC-0139 DI-MPC-APR V ,Mar Appendix F - S1-A Auxiliary Data Files The following S1-A Auxiliary Data Files (ADFs) were updated during 2015: Instrument ADF (AUX_INS) ADF S1A_AUX_INS_V T133000_G T SAFE S1A_AUX_INS_V T135500_G T SAFE S1A_AUX_INS_V T100000_G T SAFE S1A_AUX_INS_V T133000_G T SAFE S1A_AUX_INS_V T135500_G T SAFE S1A_AUX_INS_V T100000_G T SAFE S1A_AUX_INS_V T133000_G T SAFE S1A_AUX_INS_V T135500_G T SAFE S1A_AUX_INS_V T100000_G T SAFE S1A_AUX_INS_V T100000_G T SAFE S1A_AUX_INS_V T120000_G T SAFE Update Reason New AUX_INS related to RDB#1 to be used for reprocessing activities and compliant with IPF v2.36. New AUX_INS related to RDB#2 to be used for reprocessing activities and compliant with IPF v2.36. New AUX_INS related to RDB#3 to be used for reprocessing activities and compliant with IPF v2.36. New AUX_INS related to RDB#1 to be used for reprocessing activities and compliant with IPF v2.43 New AUX_INS related to RDB#2 to be used for reprocessing activities and compliant with IPF v2.43 New AUX_INS related to RDB#3 to be used for reprocessing activities and compliant with IPF v2.43 New AUX_INS related to RDB#1 to be used for reprocessing activities and compliant with IPF v2.43. New AUX_INS related to RDB#2 to be used for reprocessing activities and compliant with IPF v2.43. New AUX_INS related to RDB#3 to be used for reprocessing activities and compliant with IPF v2.43. Update of AUX_INS for SM without calibration pulses. Related to RDB#3. Update related to RDB#5 Calibration ADF (AUX_CAL) ADF S1A_AUX_CAL_V T133000_G T SAFE Update Reason New AUX_CAL related to RDB#1 to be used for reprocessing activities and compliant with IPF v update of AAP (except for WV
75 MPC-0139 DI-MPC-APR V ,Mar S1A_AUX_CAL_V T135500_G T SAFE S1A_AUX_CAL_V T100000_G T SAFE S1A_AUX_CAL_V T100000_G T SAFE S1A_AUX_CAL_V T133000_G T SAFE S1A_AUX_CAL_V T135500_G T SAFE S1A_AUX_CAL_V T100000_G T SAFE S1A_AUX_CAL_V T133000_G T SAFE S1A_AUX_CAL_V T135500_G T SAFE S1A_AUX_CAL_V T100000_G T SAFE S1A_AUX_CAL_V T120000_G T SAFE S1A_AUX_CAL_V T120000_G T SAFE S1A_AUX_CAL_V T133000_G T SAFE S1A_AUX_CAL_V T135500_G T SAFE S1A_AUX_CAL_V T100000_G T SAFE S1A_AUX_CAL_V T120000_G T SAFE S1A_AUX_CAL_V T120000_G T SAFE S1A_AUX_CAL_V T133000_G T SAFE S1A_AUX_CAL_V T133500_G T SAFE mode). New AUX_CAL related to RDB#2 to be used for reprocessing activities and compliant with IPF v update of AAP (except for WV mode). New AUX_CAL related to RDB#3 to be used for reprocessing activities and compliant with IPF v update of AAP (except for WV mode). New AUX_CAL related to RDB#3 to be used for reprocessing activities and compliant with IPF v2.43 New AUX_CAL related to RDB#1 to be used for reprocessing activities and compliant with IPF v2.43. New AUX_CAL related to RDB#2 to be used for reprocessing activities and compliant with IPF v2.43. New AUX_CAL related to RDB#3 to be used for reprocessing activities and compliant with IPF v2.43. Update of noisecalibrationfactors. Related to RDB#1. Update of noisecalibrationfactors. Related to RDB#2. Update of noisecalibrationfactors. Related to RDB#3. Update of noisecalibrationfactors. Related to RDB#4. Update related to RDB#5 Revised Noise Calibration Factor values. Related to RDB#1. Revised Noise Calibration Factor values. Related to RDB#2. Revised Noise Calibration Factor values. Related to RDB#3. Revised Noise Calibration Factor values. Related to RDB#4. Revised Noise Calibration Factor values. Related to RDB#5. TOPS first recalibration (revised EAP for IW and EW). Related to RDB#1. TOPS first recalibration (revised EAP for IW and EW). Related to
76 MPC-0139 DI-MPC-APR V ,Mar S1A_AUX_CAL_V T100000_G T SAFE S1A_AUX_CAL_V T120000_G T SAFE S1A_AUX_CAL_V T120000_G T SAFE RDB#2. TOPS first recalibration (revised EAP for IW and EW). Related to RDB#3. TOPS first recalibration (revised EAP for IW and EW). Related to RDB#4. TOPS first recalibration (revised EAP for IW and EW). Related to RDB#5. L1 Processor Parameters ADF (AUX_PP1) ADF S1A_AUX_PP1_V T133000_G T SAFE S1A_AUX_PP1_V T135500_G T SAFE S1A_AUX_PP1_V T100000_G T SAFE S1A_AUX_PP1_V T133000_G T SAFE S1A_AUX_PP1_V T135500_G T SAFE S1A_AUX_PP1_V T100000_G T SAFE S1A_AUX_PP1_V T133000_G T SAFE S1A_AUX_PP1_V T135500_G T SAFE S1A_AUX_PP1_V T100000_G T SAFE S1A_AUX_PP1_V T100000_G T SAFE S1A_AUX_PP1_V T133000_G T SAFE Update Reason New AUX_PP1 related to RDB#1 to be used for reprocessing activities and compliant with IPF v2.36. New AUX_PP1 related to RDB#2 to be used for reprocessing activities and compliant with IPF v2.36. New AUX_PP1 related to RDB#3 to be used for reprocessing activities and compliant with IPF v2.36. New AUX_PP1 related to RDB#1 to be used for reprocessing activities and compliant with IPF v2.43 New AUX_PP1 related to RDB#2 to be used for reprocessing activities and compliant with IPF v2.43 New AUX_PP1 related to RDB#3 to be used for reprocessing activities and compliant with IPF v2.43 New AUX_PP1 related to RDB#1 to be used for reprocessing activities and compliant with IPF v2.43. New AUX_PP1 related to RDB#2 to be used for reprocessing activities and compliant with IPF v2.43. New AUX_PP1 related to RDB#3 to be used for reprocessing activities and compliant with IPF v2.43. The Doppler Centroid estimation root mean squared error threshold (dcrmserrorthreshold) has been reduced to 20 in order to reduce IPF failures related to high DC acquisitions. Related to RDB#3. Activate internalcal for Wave Mode. Related to RDB#1.
77 MPC-0139 DI-MPC-APR V ,Mar S1A_AUX_PP1_V T120000_G T SAFE S1A_AUX_PP1_V T135500_G T SAFE S1A_AUX_PP1_V T100000_G T SAFE S1A_AUX_PP1_V T120000_G T SAFE S1A_AUX_PP1_V T133000_G T SAFE S1A_AUX_PP1_V T135500_G T SAFE S1A_AUX_PP1_V T100000_G T SAFE S1A_AUX_PP1_V T120000_G T SAFE S1A_AUX_PP1_V T120000_G T SAFE Activate internalcal for Wave Mode. Related to RDB#2. Activate internalcal for Wave Mode. Related to RDB#3. Activate internalcal for Wave Mode. Related to RDB#4. Update related to RDB#5. TOPS first recalibration (new EW and IW gains). Related to RDB#1. TOPS first recalibration (new EW and IW gains). Related to RDB#2. TOPS first recalibration (new EW and IW gains). Related to RDB#3. TOPS first recalibration (new EW and IW gains). Related to RDB#4. TOPS first recalibration (new EW and IW gains). Related to RDB#5. L2 Processor Parameters ADF (AUX_PP2) ADF S1A_AUX_PP2_V T133000_G T SAFE S1A_AUX_PP2_V T135500_G T SAFE S1A_AUX_PP2_V T100000_G T SAFE S1A_AUX_PP2_V T133000_G T SAFE S1A_AUX_PP2_V T135500_G T SAFE S1A_AUX_PP2_V T100000_G T SAFE S1A_AUX_PP2_V T120000_G T SAFE S1A_AUX_PP2_V T120000_G T SAFE Update Reason New AUX_PP2 related to RDB#1 to be used for reprocessing activities and compliant with IPF v2.36. New AUX_PP2 related to RDB#2 to be used for reprocessing activities and compliant with IPF v2.36. New AUX_PP2 related to RDB#3 to be used for reprocessing activities and compliant with IPF v2.36. Optimisation of LOP parameters in order to capture long swell + update of rangelookfilterwidth. Related to RDB#1. Optimisation of LOP parameters in order to capture long swell + update of rangelookfilterwidth. Related to RDB#2. Optimisation of LOP parameters in order to capture long swell + update of rangelookfilterwidth. Related to RDB#3. Optimisation of LOP parameters in order to capture long swell + update of rangelookfilterwidth. Related to RDB#4. Update related to RDB#5.
78 MPC-0139 DI-MPC-APR V ,Mar Appendix G - S1-A Orbit Manoeuvres The S1-A orbit manoeuvres during 2015 were: Start Date Start Time Stop Date Stop Time 14/01/ :46: /01/ :47: /01/ :30: /01/ :30: /01/ :09: /01/ :09: /01/ :47: /01/ :48: /01/ :26: /01/ :26: /01/ :15: /01/ :19: /01/ :29: /01/ :29: /01/ :08: /01/ :08: /02/ :13: /02/ :14: /02/ :05: /02/ :05: /02/ :43: /02/ :44: /02/ :45: /02/ :45: /02/ :35: /02/ :35: /02/ :25: /02/ :25: /02/ :18: /02/ :19: /02/ :08: /02/ :08: /02/ :22: /02/ :22: /02/ :11: /02/ :11: /02/ :14: /02/ :14: /02/ :04: /02/ :04: /03/ :27: /03/ :27: /03/ :16: /03/ :17: /03/ :00: /03/ :00: /03/ :49: /03/ :50: /03/ :42: /03/ :42: /03/ :35: /03/ :36: /04/ :20: /04/ :21: /04/ :17: /04/ :18: /04/ :05: /04/ :07: /04/ :44: /04/ :46: /04/ :37: /04/ :37: /04/ :16: /04/ :16: /04/ :50: /04/ :51: /04/ :29: /04/ :30: /04/ :21: /04/ :21: /04/ :10: /04/ :11: /05/ :23: /05/ :23:46.799
79 MPC-0139 DI-MPC-APR V ,Mar /05/ :13: /05/ :13: /05/ :32: /05/ :35: /05/ :11: /05/ :13: /05/ :04: /05/ :05: /05/ :43: /05/ :44: /05/ :23: /05/ :23: /05/ :56: /05/ :56: /05/ :17: /05/ :17: /05/ :56: /05/ :57: /05/ :58: /05/ :59: /05/ :48: /05/ :49: /06/ :01: /06/ :01: /06/ :51: /06/ :51: /06/ :10: /06/ :11: /06/ :00: /06/ :00: /06/ :18: /06/ :19: /06/ :08: /06/ :09: /06/ :09: /06/ :10: /06/ :59: /06/ :59: /07/ :34: /07/ :35: /07/ :46: /07/ :49: /07/ :26: /07/ :27: /07/ :16: /07/ :17: /07/ :18: /07/ :18: /07/ :08: /07/ :08: /07/ :30: /07/ :32: /07/ :59: /07/ :59: /08/ :07: /08/ :08: /08/ :46: /08/ :47: /08/ :25: /08/ :26: /08/ :05: /08/ :05: /08/ :14: /08/ :15: /08/ :04: /08/ :08: /08/ :18: /08/ :19: /08/ :08: /08/ :08: /08/ :58: /08/ :58: /09/ :30: /09/ :30: /09/ :20: /09/ :20: /09/ :18: /09/ :18: /09/ :11: /09/ :13: /09/ :48: /09/ :48: /10/ :33: /10/ :33: /10/ :18: /10/ :18:37.955
80 MPC-0139 DI-MPC-APR V ,Mar /10/ :07: /10/ :07: /10/ :53: /10/ :54: /10/ :14: /10/ :14: /11/ :02: /11/ :06: /11/ :44: /11/ :44: /11/ :33: /11/ :34: /11/ :48: /11/ :48: /11/ :38: /11/ :38: /12/ :29: /12/ :29: /12/ :01: /12/ :03: /12/ :37: /12/ :38: /12/ :25: /12/ :25: /12/ :12: /12/ :12: /12/ :59: /12/ :59:33.879
81 MPC-0139 DI-MPC-APR V ,Mar Appendix H - S1-A Quality Disclaimers S1-A quality disclaimers were issued during 2015: Number Description Start Validity Date 1 S1A_WV_SLC_1S products filled with zero (black products) 15:17:26 UT 2 Failure on tile amplifier #5 of the receiving antenna 15:29:30 UT 3 Level 1 products processed with incorrect gains 15:17:26 UT 4 Incorrect Cycle Number and Relative orbit number in products 11:45:25 UT processed in PAC2/DPA 5 Failure on Tile amplifier #5 of the receiving antenna from 18/03/2015 and 20/03/ Failure on Tile amplifier #5 of the receiving antenna from 26/03/2015 to 28/03/ Failure on Tile amplifier #5 of the receiving antenna from 18/04/2015 to 24/04/ Failure on Tile amplifier #5 of the receiving antenna from 25/04/2015 to 30/04/ Failure on Tile amplifier #5 of the receiving antenna from 05/05/2015 to 06/05/ :09:00 UT :20:00 UT :40:21 UT :37:37 UT :12:51 UT 10 Denoising vectors not qualified :00:00 UT 11 S-1 L2 OCN product preliminary qualified 00:31:03 UT 12 Failure of TRM #5 between and :10:28 UT 13 Failure of TRM #5 between and :44:28 UT 14 Invalid radiometric calibration of WV L1 and L2 products 02:29:22 UT 15 Failure of TRM #5 from to :58:56 UT 16 Invalid Orbit Number at UPA before :00:00 UT End Validity Date :34:01 UT :04:54 UT :07:54 UT :53:00 UT :46:30 UT :50:30 UT :48:08 UT :01:11 UT :44:43 UT :33:15 UT :00:00 UT :53:00 UT :50:55 UT :09:02 UT :04:57 UT :28:50 UT Issue Status Issued Issued Issued Issued Issued Issued Issued Issued Issued Issued Issued Issued Issued Issued Issued Issued
82 MPC-0139 DI-MPC-APR V ,Mar Appendix I - S1-A Antenna Pointing The following plots show trends for yaw, pitch and roll errors calculated for the reporting period against ascending node crossing time (ANX). The red horizontal lines show the nominal ±0.01 bounds for these attitude errors. The short duration changes in yaw are due to orbit manoeuvres. The increase in calculated yaw around ANX of 3000 is not an issue with Sentinel1-A itself but with how the yaw is calculated on-ground and consequently there is no impact of the quality of products. Cycles 38 & 39


83 MPC-0139 DI-MPC-APR V ,Mar Cycles 40 & 41 Cycles 43 & 44
84 MPC-0139 DI-MPC-APR V ,Mar Cycles 45 & 46 Cycles 47 & 48
85 MPC-0139 DI-MPC-APR V ,Mar Cycles 49 & 50 Cycles 51 & 52
86 MPC-0139 DI-MPC-APR V ,Mar Cycles 53 & 54 Cycles 55 & 56
87 MPC-0139 DI-MPC-APR V ,Mar Cycles 57 & 58 Cycles 59 & 60
88 MPC-0139 DI-MPC-APR V ,Mar Cycles 61 & 62 Cycles 63 & 64


89 MPC-0139 DI-MPC-APR V ,Mar Cycles 65 & 66 Cycles 67 & 68
S1-B N-Cyclic Performance Report Cycles 43 to 46 (03-July-2017 to 20-August-2017)
") S-1 MPC Cycles 43 to 46 (03-July-2017 to 20-August-2017) Reference: Nomenclature: MPC-0356 DI-MPC-NPR Issue: 2017-03. 5 Date: 2017,Sep.01 FORM-NT-GB-10-0 2017,Sep.01 i.1 Chronology Issues: Issue: Date:
S-1 MPC Cycles 43 to 46 (03-July-2017 to 20-August-2017) Reference: Nomenclature: MPC-0356 DI-MPC-NPR Issue: 2017-03. 5 Date: 2017,Sep.01 FORM-NT-GB-10-0 2017,Sep.01 i.1 Chronology Issues: Issue: Date:
Sentinel-1A Tile #11 Failure
 MPC-S1 Reference: Nomenclature: MPC-0324 OI-MPC-ACR Issue: 1. 2 Date: 2016,Oct.13 FORM-NT-GB-10-1 MPC-0324 OI-MPC-ACR V1.2 2016,Oct.13 i.1 Chronology Issues: Issue: Date: Reason for change: Author 1.0
Sentinel-1A Radiometric Calibration
 Sentinel-1A Radiometric Calibration Peter Meadows 1, Alan Pilgrim 1, Riccardo Piantanida 2, Davide Riva 2, Nuno Miranda 3 (1) BAE Systems Applied Intelligence, West Hanningfield Road, Great Baddow, Chelmsford,
GMES Sentinel-1 Transponder Development
 GMES Sentinel-1 Transponder Development Paul Snoeij Evert Attema Björn Rommen Nicolas Floury Malcolm Davidson ESA/ESTEC, European Space Agency, Noordwijk, The Netherlands Outline 1. GMES Sentinel-1 overview
ERS-2 SAR CYCLIC REPORT
 28TH SEPTEMBER 2009-2ND NOVEMBER 2009 (CYCLE 151) PUBLIC SUMMARY prepared by/préparé par IDEAS SAR Team reference/réference IDEAS-BAE-OQC-REP-0245 issue/édition 9 revision/révision 0 date of issue/date
ENVISAT ASAR MONTHLY REPORT MARCH 2012
 ENVISAT ASAR MONTHLY REPORT MARCH 2012 PUBLIC SUMMARY prepared by/préparé par IDEAS SAR Team reference/réference ENVI-CLVL-EOPG-TN-04-0009 issue/édition 73 revision/révision 0 date of issue/date d édition
RADARSAT-2 Image Quality and Calibration Update
 RADARSAT-2 Image Quality and Calibration Update by Dan Williams, Yiman Wang, Marielle Chabot, Pierre Le Dantec, Ron Caves, Yan Wu, Kenny James, Alan Thompson, Cathy Vigneron www.mdacorporation.com Image
RADARSAT-1: An End-of-Mission Review of the Imaging and Calibration Performance of a Magnificent Canadian Instrument
 RADARSAT-1: An End-of-Mission Review of the Imaging and Calibration Performance of a Magnificent Canadian Instrument S. Cote, S. Srivastava Canadian Space Agency S. Muir Calian Technologies Ltd 1 RADARSAT-1
TerraSAR-X Calibration Status 2 Years in Flight
 2 Years in Flight Dirk Schrank, Marco Schwerdt, Markus Bachmann, Björn Döring, Clemens Schulz November 2009 CEOS 09 VG 1 Calibration Tasks Performed 2009 Introduction Challenge Schedule Re-Calibration
Polarisation Capabilities and Status of TerraSAR-X
 Polarisation Capabilities and Status of TerraSAR-X Irena Hajnsek, Josef Mittermayer, Stefan Buckreuss, Kostas Papathanassiou German Aerospace Center Microwaves and Radar Institute irena.hajnsek@dlr.de
Sentinel-1 System Overview
 Sentinel-1 System Overview Dirk Geudtner, Rámon Torres, Paul Snoeij, Malcolm Davidson European Space Agency, ESTEC Global Monitoring for Environment and Security (GMES) EU-led program aiming at providing
Sentinel-1 Calibration and Performance
 Sentinel-1 Calibration and Performance Paul Snoeij Evert Attema Björn Rommen Nicolas Floury Berthyl Duesmann Malcolm Davidson Ramon Torres European Space Agency Sentinel-1 Mission Objectives Component
Sentinel-1 Overview. Dr. Andrea Minchella
 Dr. Andrea Minchella 21-22/01/2016 ESA SNAP-Sentinel-1 Training Course Satellite Applications Catapult - Electron Building, Harwell, Oxfordshire Contents Sentinel-1 Mission Sentinel-1 SAR Modes Sentinel-1
Sentinel-1 New (Thermal) Denoising Approach
 Denoising Approach") Sentinel-1 New (Thermal) Denoising Approach CEOS WGCV 2017, JPL, Pasadena N. Miranda 1, A. Recchia 2, N. Franceschi 2, R. Piantanida 2 1 ESA/ESRIN 2 Aresys S-1 Mission Performance Center: G. Hajduch, R.
Sentinel-1 New (Thermal) Denoising Approach CEOS WGCV 2017, JPL, Pasadena N. Miranda 1, A. Recchia 2, N. Franceschi 2, R. Piantanida 2 1 ESA/ESRIN 2 Aresys S-1 Mission Performance Center: G. Hajduch, R.
ERS-2 SAR CYCLIC REPORT
 ERS-2 SAR CYCLIC REPORT C YCLE 101 14-DEC-2004 to 18-JAN-2005 Orbit 50456 to 50957 Prepared by: PCS SAR TEAM Issue: 1.0 Reference: Date of Issue Status: Document type: Technical Note Approved by: T A B
ERS-2 SAR CYCLIC REPORT
 ERS-2 SAR CYCLIC REPORT C YCLE 96 22-JUN-2004 to 27-JUL-2004 Orbit 47951 to 48452 Prepared by: PCS SAR TEAM Issue: 1.0 Reference: Date of Issue Status: Document type: Technical Note Approved by: T A B
ERS-2 SAR CYCLIC REPORT
 ERS-2 SAR CYCLIC REPORT C YCLE 90 24-November-2003-29-December-2003 Prepared by: PCS SAR TEAM Issue: 1.0 Reference: Date of Issue Status: Document type: Technical Note Approved by: T A B L E L E O F C
COSMO-skymed, TerraSAR-X, and RADARSAT-2 geolocation accuracy after compensation for earth-system effects
 Zurich Open Repository and Archive University of Zurich Main Library Strickhofstrasse 9 CH-857 Zurich www.zora.uzh.ch Year: COSMO-skymed, TerraSAR-X, and RADARSAT- geolocation accuracy after compensation
Consideration of Inter-Pulse and Intra-Pulse Satellite Motion in Zero Doppler SAR Processing
 DLR.de Chart 1 Consideration of Inter-Pulse and Intra-Pulse Satellite Motion in Zero Doppler SAR Processing Ulrich Balss, Helko Breit, Michael Eineder Remote Sensing Technology Institute (IMF) German Aerospace
THE NASA/JPL AIRBORNE SYNTHETIC APERTURE RADAR SYSTEM. Yunling Lou, Yunjin Kim, and Jakob van Zyl
 THE NASA/JPL AIRBORNE SYNTHETIC APERTURE RADAR SYSTEM Yunling Lou, Yunjin Kim, and Jakob van Zyl Jet Propulsion Laboratory California Institute of Technology 4800 Oak Grove Drive, MS 300-243 Pasadena,
SAOCOM Calibration Strategy
 COMISION NACIONAL DE ACTIVIDADES ESPACIALES (The Argentinean National Commission of Space Activities) M. Azcueta, J. Giardini, J. P. Cuesta González, M. Thibeault, T. Zajc November 7-9, 20 October 20 8
Final Results of the Efficient TerraSAR-X Calibration Method
 Final Results of the Efficient TerraSAR-X Calibration Method M. Schwerdt, B. Bräutigam, M. Bachmann, B. Döring, Dirk Schrank and Jaime Hueso Gonzalez Microwave and Radar Institute of the German Aerospace
On the stability of Amazon rainforest backscattering during the ERS-2 Scatterometer mission lifetime
 On the stability of Amazon rainforest backscattering during the ERS- Scatterometer mission lifetime R. Crapolicchio (), P. Lecomte () () Serco S.p.A. c/o ESA-ESRIN Via Galileo Galilei 44 Frascati Italy
The Sentinel-1 Constellation
 The Sentinel-1 Constellation Evert Attema, Sentinel-1 Mission & System Manager AGRISAR and EAGLE Campaigns Final Workshop 15-16 October 2007 ESA/ESTECNoordwijk, The Netherlands Sentinel-1 Programme Sentinel-1
Spaceborne Active Phased Array Antenna Calibration Using an Accurate Antenna Model
 Spaceborne Active Phased Array Antenna Calibration Using an Accurate Antenna Model Markus Bachmann, Marco Schwerdt, Benjamin Bräutigam German Aerospace Center (DLR), Oberpfaffenhofen, 82234 Wessling, Germany,
ASAR WIDE-SWATH SINGLE-LOOK COMPLEX PRODUCTS: PROCESSING AND EXPLOITATION POTENTIAL
 ASAR WIDE-SWATH SINGLE-LOOK COMPLEX PRODUCTS: PROCESSING AND EXPLOITATION POTENTIAL Ralph Cordey (1), Tim Pearson (2), Yves-Louis Desnos (3), Betlem Rosich-Tell (3) (1) European Space Agency, ESTEC, Keplerlaan
TerraSAR-X Calibration Ground Equipment
 86 Proceedings of WFMN07, Chemnitz, Germany TerraSAR-X Calibration Ground Equipment Björn J. Döring, Marco Schwerdt, Robert Bauer Microwaves and Radar Institute German Aerospace Center (DLR) Oberpfaffenhofen,
Biomass, a polarimetric interferometric P-band SAR mission
 Biomass, a polarimetric interferometric P-band SAR mission M. Arcioni, P. Bensi, M. Fehringer, F. Fois, F. Heliere, N. Miranda, K. Scipal Fringe 2015, ESRIN 27/03/2015 The Biomass Mission 1. Biomass was
PAZ Product Definition
 PAZ Product Definition CALVAL Centre Juan Manuel Cuerda Muñoz, Javier del Castillo Mena, Adolfo López Pescador, Nuria Gimeno Martínez, Nuria Casal Vázquez, Patricia Cifuentes Revenga, Marcos García Rodríguez,
Calibration Assessment of RADARSAT-2 Polarimetry Using High Precision Transponders
 Calibration Assessment of RADARSAT-2 Polarimetry Using High Precision Transponders R Touzi, S Côté, RK Hawkins CCRS/CSA Acknowledgments S Nedelcu (CCRS) S Muir (CSA) 1 Outline-Polarimetric RADARSAT-2 Independent
Calibration Concepts for Future Low Frequency SAR Systems. Jens Reimann, Marco Schwerdt, Sravan Kumar Aitha and Manfred Zink
 Calibration Concepts for Future Low Frequency SAR Systems Jens Reimann, Marco Schwerdt, Sravan Kumar Aitha and Manfred Zink DLR.de Chart 2 Low Frequency SAR Missions OHB DLR.de Chart 3 BIOMASS - Facts
UAVSAR in Africa. Quality Assurance and Preliminary Results. Brian Hawkins, UAVSAR Team
 Photo by Sassan Saatchi UAVSAR in Africa Quality Assurance and Preliminary Results Brian Hawkins, UAVSAR Team CEOS SAR Cal/Val Workshop 2016 Copyright 2016 California Institute of Technology. Government
IMPACT OF BAQ LEVEL ON INSAR PERFORMANCE OF RADARSAT-2 EXTENDED SWATH BEAM MODES
 IMPACT OF BAQ LEVEL ON INSAR PERFORMANCE OF RADARSAT-2 EXTENDED SWATH BEAM MODES Jayson Eppler (1), Mike Kubanski (1) (1) MDA Systems Ltd., 13800 Commerce Parkway, Richmond, British Columbia, Canada, V6V
The Performance of the ERS-2 SAR after 15 Years
 The Performance of the ERS-2 SAR after 15 Years Peter Meadows (1), Nuno Miranda (2), Alan Pilgrim (1) & Emma Griffiths (3) (1) BAE SYSTEMS Advanced Technology Centre, West Hanningfield Road, Great Baddow,
Faraday rotation estimation from unfocussed ALOS PALSAR raw data
 Faraday rotation estimation from unfocussed ALOS PALSAR raw data arco Lavalle 1 3, E. Pottier 2, D. Solimini 1, N. iranda 3 1 DISP, Tor Vergata University, Rome, Italy 2 IETR UR CNRS 6164, University of
Fringe 2015 Workshop
 Fringe 2015 Workshop On the Estimation and Interpretation of Sentinel-1 TOPS InSAR Coherence Urs Wegmüller, Maurizio Santoro, Charles Werner and Oliver Cartus Gamma Remote Sensing AG - S1 IWS InSAR and
MULTI-CHANNEL SAR EXPERIMENTS FROM THE SPACE AND FROM GROUND: POTENTIAL EVOLUTION OF PRESENT GENERATION SPACEBORNE SAR
 3 nd International Workshop on Science and Applications of SAR Polarimetry and Polarimetric Interferometry POLinSAR 2007 January 25, 2007 ESA/ESRIN Frascati, Italy MULTI-CHANNEL SAR EXPERIMENTS FROM THE
LANDSAT 8 Level 1 Product Performance
 Réf: IDEAS-TN-10-CyclicReport LANDSAT 8 Level 1 Product Performance Cyclic Report Month/Year: May 2015 Date: 25/05/2015 Issue/Rev:1/0 1. Scope of this document On May 30, 2013, data from the Landsat 8
Ka-Band Systems and Processing Approaches for Simultaneous High-Resolution Wide-Swath SAR Imaging and Ground Moving Target Indication
 Ka-Band Systems and Processing Approaches for Simultaneous High-Resolution Wide-Swath SAR Imaging and Ground Moving Target Indication Advanced RF Sensors and Remote Sensing Instruments 2014 Ka-band Earth
Estimation of Ocean Current Velocity near Incheon using Radarsat-1 SAR and HF-radar Data
 Korean Journal of Remote Sensing, Vol.23, No.5, 2007, pp.421~430 Estimation of Ocean Current Velocity near Incheon using Radarsat-1 SAR and HF-radar Data Moon-Kyung Kang and Hoonyol Lee Department of Geophysics,
Ocean SAR altimetry. from SIRAL2 on CryoSat2 to Poseidon-4 on Jason-CS
 Ocean SAR altimetry from SIRAL2 on CryoSat2 to Poseidon-4 on Jason-CS Template reference : 100181670S-EN L. Phalippou, F. Demeestere SAR Altimetry EGM NOC, Southampton, 26 June 2013 History of SAR altimetry
Nadir Margins in TerraSAR-X Timing Commanding
 CEOS SAR Calibration and Validation Workshop 2008 1 Nadir Margins in TerraSAR-X Timing Commanding S. Wollstadt and J. Mittermayer, Member, IEEE Abstract This paper presents an analysis and discussion of
Detection of Multipath Propagation Effects in SAR-Tomography with MIMO Modes
 Detection of Multipath Propagation Effects in SAR-Tomography with MIMO Modes Tobias Rommel, German Aerospace Centre (DLR), tobias.rommel@dlr.de, Germany Gerhard Krieger, German Aerospace Centre (DLR),
The Biomass Mission, status of the satellite system
 The Biomass Mission, status of the satellite system M. Arcioni, P. Bensi, M. Fehringer, F. Fois, F. Heliere, K. Scipal PolInSAR/Biomass Meeting 2015, ESRIN 29/01/2015 1. Key facts (lifetime, duty cycle
STM Product Evolution for Processing Baseline 2.24
 PREPARATION AND OPERATIONS OF THE MISSION PERFORMANCE CENTRE (MPC) FOR THE COPERNICUS SENTINEL-3 MISSION Contract: 4000111836/14/I-LG Customer: ESA Document Contract No.: 4000111836/14/I-LG Project: PREPARATION
Calibration Concepts of Multi-Channel Spaceborne SAR
 DLR.de Chart 1 > CEOS Workshop 2016 > Tobias Rommel > September 7 th, 2016 Calibration Concepts of Multi-Channel Spaceborne SAR T. Rommel, F. Queiroz de Almeida, S. Huber, M. Jäger, G. Krieger, C. Laux,
THE ENVISAT ASAR MISSION: A LOOK BACK AT 10 YEARS OF OPERATION
 THE ENVISAT ASAR MISSION: A LOOK BACK AT 10 YEARS OF OPERATION N. Miranda (1), B. Rosich (1), P.J. Meadows (2), K. Haria (3), D. Small (4), A. Schubert (4), M. Lavalle (5), F. Collard (6), H. Johnsen (7),
TanDEM-X Mission Status & Commissioning Phase Overview
 TanDEM-X Mission Status & Commissioning Phase Overview M. Zink TanDEM-X Ground Segment Manager 17-February-2011 TanDEM-X Science Team Meeting 17-Feb-2011 - OP TerraSAR-X-Add-on for Digital Elevation Measurements
TanDEM-X SAR System Verification
 TanDEM-X SAR System Verification Mathias Weigt, Ulrich Steinbrecher, Thomas Kraus, Johannes Böer, Benjamin Bräutigam 07-09 November 2011 Overview Monostatic Commissioning Phase Verification of Power/Thermal
Improved cross-range resolution in TOPSAR imaging using Sentinel-1A in bistatic operation
 Improved cross-range resolution in TOPSAR imaging using Sentinel-A in bistatic operation Virginie Kubica,XavierNeyt and Hugh Griffiths Dept. of Electrical Engineering, Royal Military Academy, elgium Dept.
Towards a polarimetric SAR processor for airborne sensor
 1 Towards a polarimetric SAR processor for airborne sensor H. M.J. Cantalloube 1, B. Fromentin-Denoziere 1, and C. E. Nahum 2 1 ONERA (Office National d Études et Recherches Aérospatiales) Palaiseau, France
Report on CEOS WGCV SAR Subgroup Activities
 Report on CEOS WGCV SAR Subgroup Activities CEOS WGCV 37 th Plenary ESRIN, Frascati/Italy February 17-20, 2014 M. Zink Chair CEOS WGCV SAR Subgroup German Aerospace Center (DLR) manfred.zink@dlr.de http://sarcv.ceos.org
SARscape Modules for ENVI
 Visual Information Solutions SARscape Modules for ENVI Read, process, analyze, and output products from SAR data. ENVI. Easy to Use Tools. Proven Functionality. Fast Results. DEM, based on TerraSAR-X-1
METOP SECOND GENERATION SCATTEROMETER MISSION
 METOP SECOND GENERATION SCATTEROMETER MISSION Franco Fois, Chung-Chi Lin, Hubert Barré, Maurizio Betto, Marc Loiselet and Graeme Mason European Space Agency, Keplerlaan 1, 2200 AG Noordwijk ZH, The Netherlands
SHIP DETECTION AND SEA CLUTTER CHARACTERISATION USING X&L BAND FULL-POLARIMETRIC AIRBORNE SAR DATA
 SHIP DETECTION AND SEA CLUTTER CHARACTERISATION USING X&L BAND FULL-POLARIMETRIC AIRBORNE SAR DATA S. Angelliaume, Ph. Martineau (ONERA) Ph. Durand, T. Cussac (CNES) Context CNES/ONERA study of Space System
Towards Sentinel-1 Soil Moisture Data Services: The Approach taken by the Earth Observation Data Centre for Water Resources Monitoring
 Towards Sentinel-1 Soil Moisture Data Services: The Approach taken by the Earth Observation Data Centre for Water Resources Monitoring Wolfgang Wagner wolfgang.wagner@geo.tuwien.ac.at Department of Geodesy
REVIEW OF THE IMPACT OF ERS-2 PILOTING MODES ON THE SAR DOPPLER STABILITY
 REVIEW OF THE IMPACT OF ERS-2 PILOTING MODES ON THE SAR DOPPLER STABILITY N.Miranda (1), B.Rosich (2), C. Santella (3), M. Grion (3) (1) Serco Spa, via Galileo Galilei, 00044 Frascati, Italy, nuno.miranda@esa.int
SCANSAR AND SPOTLIGHT IMAGING OPERATION STUDY FOR SAR SATELLITE MISSION
 SCANSAR AND SPOTLIGHT IMAGING OPERATION STUDY FOR SAR SATELLITE MISSION Bor-Han Wu, Meng-Che Wu and Ming-Hwang Shie National Space Organization, National Applied Research Laboratory, Taiwan *Corresponding
S3 Product Notice SLSTR
 S3 Product Notice SLSTR Mission Sensor Product S3-A SLSTR Level 2 Land Surface Temperature Product Notice ID S3A.PN-SLSTR-L2L.02 Issue/Rev Date 05/07/2017 Version 1.0 Preparation Approval This Product
ALOS-Indonesia POLinSAR Experiment (AIPEX): First Result*
: First Result*") ALOS-Indonesia POLinSAR Experiment (AIPEX): First Result* Mahmud Raimadoya(1), Ludmila Zakharova(2), Bambang Trisasongko(1), Nurwadjedi(3) (1) Bogor Agricultural University (IPB), P.O. Box 2049, Bogor
ALOS-Indonesia POLinSAR Experiment (AIPEX): First Result* Mahmud Raimadoya(1), Ludmila Zakharova(2), Bambang Trisasongko(1), Nurwadjedi(3) (1) Bogor Agricultural University (IPB), P.O. Box 2049, Bogor
PSInSAR VALIDATION BY MEANS OF A BLIND EXPERIMENT USING DIHEDRAL REFLECTORS
 PSInSAR VALIDATION BY MEANS OF A BLIND EXPERIMENT USING DIHEDRAL REFLECTORS G. Savio (1), A. Ferretti (1) (2), F. Novali (1), S. Musazzi (3), C. Prati (2), F. Rocca (2) (1) Tele-Rilevamento Europa T.R.E.
Towards a Polarimetric SAR Processor for Airborne Sensor
 PIERS ONLINE, VOL. 6, NO. 5, 2010 465 Towards a Polarimetric SAR Processor for Airborne Sensor H. M. J. Cantalloube 1, B. Fromentin-Denoziere 1, and C. E. Nahum 2 1 ONERA (Office National d Études et Recherches
The Current Status and Brief Results of Engineering Model for PALSAR-2 onboard ALOS-2 and Science Project
 The Current Status and Brief Results of Engineering Model for PALSAR-2 onboard ALOS-2 and Science Project + The 16 th KC meeting Japan Aerospace Exploration Agency Masanobu Shimada, Yukihiro KANKAKU The
MOBILE RAPID-SCANNING X-BAND POLARIMETRIC (RaXPol) DOPPLER RADAR SYSTEM Andrew L. Pazmany 1 * and Howard B. Bluestein 2
 DOPPLER RADAR SYSTEM Andrew L. Pazmany 1 * and Howard B. Bluestein 2") 16B.2 MOBILE RAPID-SCANNING X-BAND POLARIMETRIC (RaXPol) DOPPLER RADAR SYSTEM Andrew L. Pazmany 1 * and Howard B. Bluestein 2 1 ProSensing Inc., Amherst, Massachusetts 2 University of Oklahoma, Norman,
16B.2 MOBILE RAPID-SCANNING X-BAND POLARIMETRIC (RaXPol) DOPPLER RADAR SYSTEM Andrew L. Pazmany 1 * and Howard B. Bluestein 2 1 ProSensing Inc., Amherst, Massachusetts 2 University of Oklahoma, Norman,
Microwave Remote Sensing (1)
") Microwave Remote Sensing (1) Microwave sensing encompasses both active and passive forms of remote sensing. The microwave portion of the spectrum covers the range from approximately 1cm to 1m in wavelength.
Microwave Remote Sensing (1) Microwave sensing encompasses both active and passive forms of remote sensing. The microwave portion of the spectrum covers the range from approximately 1cm to 1m in wavelength.
ERS-2 SAR CYCLIC REPORT
 ERS-2 SAR CYCLIC REPORT C YCLE 77 26 th August 2002-30 th September 2002 Prepared by: PCS SAR TEAM Issue: 1.0 Reference: ERSE-SPPA-EOAD-TN-02-0047 Date of Issue: Status: Document type: Technical Note Approved
Microwave Sensors Subgroup (MSSG) Report
 Report") Microwave Sensors Subgroup (MSSG) Report Feb 17-20, 2014, ESA ESRIN, Frascati, Italy DONG, Xiaolong, MSSG Chair National Space Science Center Chinese Academy of Sciences (MiRS,NSSC,CAS) Email: dongxiaolong@mirslab.cn
Microwave Sensors Subgroup (MSSG) Report Feb 17-20, 2014, ESA ESRIN, Frascati, Italy DONG, Xiaolong, MSSG Chair National Space Science Center Chinese Academy of Sciences (MiRS,NSSC,CAS) Email: dongxiaolong@mirslab.cn
Acknowledgment. Process of Atmospheric Radiation. Atmospheric Transmittance. Microwaves used by Radar GMAT Principles of Remote Sensing
 GMAT 9600 Principles of Remote Sensing Week 4 Radar Background & Surface Interactions Acknowledgment Mike Chang Natural Resources Canada Process of Atmospheric Radiation Dr. Linlin Ge and Prof Bruce Forster
Introduction Active microwave Radar
 RADAR Imaging Introduction 2 Introduction Active microwave Radar Passive remote sensing systems record electromagnetic energy that was reflected or emitted from the surface of the Earth. There are also
Introduction to Radar
 National Aeronautics and Space Administration ARSET Applied Remote Sensing Training http://arset.gsfc.nasa.gov @NASAARSET Introduction to Radar Jul. 16, 2016 www.nasa.gov Objective The objective of this
AN OPTIMAL ANTENNA PATTERN SYNTHESIS FOR ACTIVE PHASED ARRAY SAR BASED ON PARTICLE SWARM OPTIMIZATION AND ADAPTIVE WEIGHT- ING FACTOR
 Progress In Electromagnetics Research C, Vol. 10, 129 142, 2009 AN OPTIMAL ANTENNA PATTERN SYNTHESIS FOR ACTIVE PHASED ARRAY SAR BASED ON PARTICLE SWARM OPTIMIZATION AND ADAPTIVE WEIGHT- ING FACTOR S.
GEOMETRIC RECTIFICATION OF EUROPEAN HISTORICAL ARCHIVES OF LANDSAT 1-3 MSS IMAGERY
 GEOMETRIC RECTIFICATION OF EUROPEAN HISTORICAL ARCHIVES OF LANDSAT -3 MSS IMAGERY Torbjörn Westin Satellus AB P.O.Box 427, SE-74 Solna, Sweden tw@ssc.se KEYWORDS: Landsat, MSS, rectification, orbital model
COPERNICUS COLLABORATIVE GROUND SEGMENT TO SUPPORT MARITIME SITUATIONAL AWARENESS
 COPERNICUS COLLABORATIVE GROUND SEGMENT TO SUPPORT MARITIME SITUATIONAL AWARENESS D. Krause*, E. Schwarz, H. Damerow, German Aerospace Center (DLR), German Remote Sensing Data Center (DFD), Kalkhorstweg
TerraSAR-X Mission: Application and Data Access
 TerraSAR-X Mission: Application and Data Access Irena Hajnsek & TSX TEAM German Aerospace Center Microwaves and Radar Institute Pol-InSAR Research Group 2 years in Orbit (since June 2007) irena.hajnsek@dlr.de
Co-ReSyF RA lecture: Vessel detection and oil spill detection
 This project has received funding from the European Union s Horizon 2020 Research and Innovation Programme under grant agreement no 687289 Co-ReSyF RA lecture: Vessel detection and oil spill detection
ENVISAT ASAR DATA PROCESSING
 ASAR data processing with GAMMA Software, Version of 20-Jun-2003 GAMMA SOFTWARE VALIDATION REPORT: ENVISAT ASAR DATA PROCESSING Urs Wegmüller, Tazio Strozzi, Charles Werner and Andreas Wiesmann Gamma Remote
Definition of Calibration Terms
 Microwaves and Radar Institute Tandem-L, Technical Note Doc. No.: TDL-SE-TN-0010 prepared: J. Reimann, M. Schwerdt Date Calibration Engineer reviewed: M. Schwerdt Date Head of Calibration Group released:
Change detection in cultural landscapes
 9-11 November 2015 ESA-ESRIN, Frascati (Rome), Italy 3 rd ESA-EARSeL Course on Remote Sensing for Archaeology Day 3 Change detection in cultural landscapes DeodatoTapete (1,2) & Francesca Cigna (1,2) (1)
CSA Report on Earth Observation
 CSA Report on Earth Observation Dr. Satish K. Srivastava WGCV Chair & CSA Member of WGCV Canadian Space Agency Presented at College Park, MD, USA Sep 30 th to Oct 2 nd, 2014 RADARSAT-2 Spacecraft Health
WIDE-SWATH imaging and high azimuth resolution pose
 260 IEEE GEOSCIENCE AND REMOTE SENSING LETTERS, VOL 1, NO 4, OCTOBER 2004 Unambiguous SAR Signal Reconstruction From Nonuniform Displaced Phase Center Sampling Gerhard Krieger, Member, IEEE, Nicolas Gebert,
Space Frequency Coordination Group
 Space Frequency Coordination Group Report SFCG 38-1 POTENTIAL RFI TO EESS (ACTIVE) CLOUD PROFILE RADARS IN 94.0-94.1 GHZ FREQUENCY BAND FROM OTHER SERVICES Abstract This new SFCG report analyzes potential
Detection of traffic congestion in airborne SAR imagery
 Detection of traffic congestion in airborne SAR imagery Gintautas Palubinskas and Hartmut Runge German Aerospace Center DLR Remote Sensing Technology Institute Oberpfaffenhofen, 82234 Wessling, Germany
Feedback on Level-1 data from CCI projects
 Feedback on Level-1 data from CCI projects R. Hollmann, Cloud_cci Background Following this years CMUG meeting & Science Leader discussion on Level 1 CCI projects ingest a lot of level 1 satellite data
Calibration of RapidScat Instrument Drift. F. Dayton Minor
 Calibration of RapidScat Instrument Drift F. Dayton Minor A thesis submitted to the faculty of Brigham Young University in partial fulfillment of the requirements for the degree of Master of Science David
Microwave Sensors Subgroup (MSSG) Report
 Report") Microwave Sensors Subgroup (MSSG) Report CEOS WGCV-35 May 13-17, 2013, Shanghai, China DONG, Xiaolong, MSSG Chair CAS Key Laboratory of Microwave Remote Sensing National Space Science Center Chinese Academy
Microwave Sensors Subgroup (MSSG) Report CEOS WGCV-35 May 13-17, 2013, Shanghai, China DONG, Xiaolong, MSSG Chair CAS Key Laboratory of Microwave Remote Sensing National Space Science Center Chinese Academy
SAR missions for oceanography at the European Space Agency
 SAR missions for oceanography at the European Space Agency ERS-1, ERS-2, Envisat, Sentinel-1A, Sentinel-1B, ESA 3 rd Party Missions (ALOS) Prepared by ESA teams and ESA supporting companies ESA and SAR
Challenges in Advanced Moving-Target Processing in Wide-Band Radar
 Challenges in Advanced Moving-Target Processing in Wide-Band Radar July 9, 2012 Douglas Page, Gregory Owirka, Howard Nichols 1 1 BAE Systems 6 New England Executive Park Burlington, MA 01803 Steven Scarborough,
Study of Polarimetric Calibration for Circularly Polarized Synthetic Aperture Radar
 Study of Polarimetric Calibration for Circularly Polarized Synthetic Aperture Radar 2016.09.07 CEOS WORKSHOP 2016 Yuta Izumi, Sevket Demirci, Mohd Zafri Baharuddin, and Josaphat Tetuko Sri Sumantyo JOSAPHAT
Envisat and ERS missions: data and services
 FRINGE 2005 Workshop Envisat and ERS missions: and services Henri LAUR Envisat Mission Manager Our top objective: ease access to Earth Observation Common objective for all missions handled by ESA: Envisat,
PSInSAR validation by means of a blind experiment using dihedral reflectors
 PSInSAR validation by means of a blind experiment using dihedral reflectors A.Ferretti( 1 )( 2 ), S. Musazzi( 3 ), F.Novali ( 2 ), C. Prati( 1 ), F. Rocca( 1 ), G. Savio ( 2 ) ( 1 ) Politecnico di Milano
Comparison between SAR atmospheric phase screens at 30 by means of ERS and ENVISAT data
 Fringe 2007 - ESA-ESRIN - Frascati, November 28, 2007 Comparison between SAR atmospheric phase screens at 30 by means of ERS and ENVISAT data D. Perissin Politecnico di Milano Tele-Rilevamento Europa -
Remote Sensing. Ch. 3 Microwaves (Part 1 of 2)
") Remote Sensing Ch. 3 Microwaves (Part 1 of 2) 3.1 Introduction 3.2 Radar Basics 3.3 Viewing Geometry and Spatial Resolution 3.4 Radar Image Distortions 3.1 Introduction Microwave (1cm to 1m in wavelength)
Remote Sensing Ch. 3 Microwaves (Part 1 of 2) 3.1 Introduction 3.2 Radar Basics 3.3 Viewing Geometry and Spatial Resolution 3.4 Radar Image Distortions 3.1 Introduction Microwave (1cm to 1m in wavelength)
SATELLITE OCEANOGRAPHY
 SATELLITE OCEANOGRAPHY An Introduction for Oceanographers and Remote-sensing Scientists I. S. Robinson Lecturer in Physical Oceanography Department of Oceanography University of Southampton JOHN WILEY
Sentinel-2 Products and Algorithms
 Sentinel-2 Products and Algorithms Ferran Gascon (Sentinel-2 Data Quality Manager) Workshop Preparations for Sentinel 2 in Europe, Oslo 26 November 2014 Sentinel-2 Mission Mission Overview Products and
TanDEM-X: Mission Status & Scientific Contribution
 TanDEM-X: Mission Status & Scientific Contribution Irena Hajnsek 1/2, Gerhard Krieger 1, Kostas Papathanassiou 1, Stefan Baumgartner 1, Marc Rodriguez-Cassola 1, Pau Prats 1, Maria Sanjuan Ferrer 1, Florian
Microwave remote sensing. Rudi Gens Alaska Satellite Facility Remote Sensing Support Center
 Microwave remote sensing Alaska Satellite Facility Remote Sensing Support Center 1 Remote Sensing Fundamental The entire range of EM radiation constitute the EM Spectrum SAR sensors sense electromagnetic
Bistatic experiment with the UWB-CARABAS sensor - first results and prospects of future applications
 Zurich Open Repository and Archive University of Zurich Main Library Strickhofstrasse 39 CH-8057 Zurich www.zora.uzh.ch Year: 2009 Bistatic experiment with the UWB-CARABAS sensor - first results and prospects
SARscape s Coherent Changes Detection Tutorial
 SARscape s Coherent Changes Detection Tutorial Version 1.0 April 2018 1 Index Introduction... 3 Setting Preferences... 4 Data preparation... 5 Input data... 5 DEM Extraction... 5 Single Panels processing...
Synthetic aperture RADAR (SAR) principles/instruments October 31, 2018
 principles/instruments October 31, 2018") GEOL 1460/2461 Ramsey Introduction to Remote Sensing Fall, 2018 Synthetic aperture RADAR (SAR) principles/instruments October 31, 2018 I. Reminder: Upcoming Dates lab #2 reports due by the start of next
GEOL 1460/2461 Ramsey Introduction to Remote Sensing Fall, 2018 Synthetic aperture RADAR (SAR) principles/instruments October 31, 2018 I. Reminder: Upcoming Dates lab #2 reports due by the start of next
Upgraded Planar Near-Field Test Range For Large Space Flight Reflector Antennas Testing from L to Ku-Band
 Upgraded Planar Near-Field Test Range For Large Space Flight Reflector Antennas Testing from L to Ku-Band Laurent Roux, Frédéric Viguier, Christian Feat ALCATEL SPACE, Space Antenna Products Line 26 avenue