Theory and Practice of Cavity Test Systems. Tom Powers
|
|
|
- Andra Simmons
- 6 years ago
- Views:
Transcription
1 Theory and Practice of Cavity Test Systems Tom Powers SRF Workshop 2005 Tutorial Session
2 INTRODUCTION Over the past 17 years we have done about 2500 cold cavity tests on more than 500 different cavities at Jefferson Lab. Most of these tests were done with voltage controlled oscillator based phase locked loop systems. In addition to doing many of these test myself, I have been involved with the development, construction and commissioning of several cavity test systems and the software used to control them. My hope today is to provide you with a basic understanding of the RF systems necessary to perform these tests. I hope you leave here with an understanding of the importance of calibration processes and the control and understanding of potential error sources. I brought a copy of a compendium of formulas used when testing cavities, which also contains an error analysis for most of the calculations. Page 2
3 OVERVIEW Voltage controlled oscillator based phase locked loops RF system overview for vertical testing. RF system overview for Cryomodule testing. Coupler conditioning vacuum-rf feedback loop. Cavity resonance monitor Cable calibrations Cable break down in low pressure helium systems. Basic RF equations for critically coupled cavities. Basic RF equations for over coupled cavities. Qo measurements for cryomodules. Page 3
4 BASIC VCO-PLL CENTER FREQUENCY ADJUSTMENT RF IF LPF VCO 6 db PHASE ADJUST LOW NOISE OR LIMITING AMPLIFIER LO LOOP AMPLIFIER RF AMPLIFIER Two fundamental ways to drive a cavity. Fixed frequency systems are used in conjunction with resonance controls like motorized tuners when operating fixed frequency systems in accelerators. Variable frequency systems are used to simplify the system or to test cavities which do not have tuners attached. During vertical testing cavity bandwidths on the order of 1 Hz are not uncommon, it would be extremely difficult to maintain the cavity s frequency while testing. At Jefferson Lab we commonly use voltage controlled oscillator based phase locked loops to track the cavity frequency during the test. Page 4
5 BASIC VCO-PLL CENTER FREQUENCY ADJUSTMENT RF IF LPF VCO 6 db PHASE ADJUST LOW NOISE OR LIMITING AMPLIFIER LO LOOP AMPLIFIER RF AMPLIFIER The front end generally makes use of a low noise amplifier and a series of variable attenuators which are used to: Keep the mixer RF level below the maximum level, typically 6 db below the design LO. Ensure that the mixer and following loop amplifier, crystal detectors, etc. are not power starved. Help to avoid loop oscillations. The loop gain is proportional to the cavity gradient. Thus a system that behaves well at 2 MV/m will very likely oscillate at 20 MV/m, unless the loop gain is reduced at higher gradient. Although difficult to find. Limiting amplifiers such as Lucent Technologies LG1605 extend the dynamic range of the system while preventing oscillation. Page 5
6 BASIC VCO-PLL CENTER FREQUENCY ADJUSTMENT RF IF LPF VCO 6 db PHASE ADJUST LOW NOISE OR LIMITING AMPLIFIER LO LOOP AMPLIFIER RF AMPLIFIER The mixer can be a simple double balanced mixer. Devices such as a mini circuits ZFM-150 are perfectly adequate. The mixer IF output must go to DC. Typically you are limited to somewhere between 7 and 13 dbm mixers by the output level of VCO. Higher IP3 mixers could be used at the cost of a larger amplifier between the VCO and the LO input. This would provide a better dynamic range. Part of the function of the low pass filter is to reject the second harmonic component of the mixer output. Page 6
7 BASIC VCO-PLL CENTER FREQUENCY ADJUSTMENT RF IF LPF VCO 6 db PHASE ADJUST LOW NOISE OR LIMITING AMPLIFIER LO LOOP AMPLIFIER RF AMPLIFIER The secondary function of the low pass filter is to reduce the noise. To that end the bandwidth of the filter is typically 20 khz. The variable gain amplifier circuit is used to adjust the loop gain. At the summing junction a center frequency adjustment signal is summed with the output of the loop amplifier, typically we use course and fine ten-turn potentiometers. In addition to a custom circuit designs, a Stanford Research SR560 can be used to implement the loop amplifier and filter blocks. NOTE: If a general purpose frequency source is used for the VCO the loop gain can be measured by manually adjusting the frequency by a fixed amount (i.e. 200 Hz) and measuring the shift in the loop frequency. The gain is the quotient of the two. Gains over 100 are considered acceptable. Page 7
8 BASIC VCO-PLL CENTER FREQUENCY ADJUSTMENT RF IF LPF VCO 6 db PHASE ADJUST LOW NOISE OR LIMITING AMPLIFIER LO LOOP AMPLIFIER RF AMPLIFIER Inexpensive broad band devices are available from Mini Circuits for about $50. Minus These have very high tuning sensitivities on the order of 3 to 30 MHz/V. Minus - With a wide frequency range they will be more susceptible to temperature induced drifts. Plus They can be used over a broad range without retooling. Plus Low cost Customized VCOs with thermal stabilization an narrow frequency ranges for about $1500 Plus Low bandwidth crystal based devices are not sensitive to temperature drifts. Plus Moderate cost. Minus Can not be used to tune to the different pass band frequencies. Minus Narrow band required for different cavity frequencies. RF source based VCO such as an Agilent E4422B for about $12,000. Plus Low bandwidth to reduce noise issues Plus Flexible and stable frequency source Plus Has simultaneous AM modulation capabilities which are useful for cavity conditioning, etc. Minus High cost device. Page 8
9 BASIC VCO-PLL CENTER FREQUENCY ADJUSTMENT RF IF LPF VCO 6 db PHASE ADJUST LOW NOISE OR LIMITING AMPLIFIER LO LOOP AMPLIFIER RF AMPLIFIER Directional coupler. Coupling dictated by a combination of VCO output level and Mixer LO requirement. LO path may require an amplifier to ensure the proper drive level for the mixer. Phase Shifter* Typically mechanical phase shifters are used such as Narda 3752 or Arra D3428B. Ensure that they provide at least 190 degrees of phase shift at the frequency of operation. Variable Attenuator* Typically both continuous and step mechanical attenuators are used for manual systems Narda, Arra manufacture both. Caution should be used if a PIN attenuator is used as it will strongly affect the loop phase. *Vector Modulators are frequently used to supplement the phase shifter and replace the mechanical attenuators. Analog Devices as well as several other manufactures produce integrated circuits with analog controls GT Microwave, Vectronics, and others make connectorized devices with digital controls. Page 9
10 Complete Low Level System Layout GAIN POT LOCAL REMOTE SWITCH HI/LO GAIN SWITCH FROM ANALOG I/O PORT (ONE ANALOG, ONE DIGITAL) CONTROL INTERFACE PCB EXTERNAL VCO +12 VDC CENTER FREQUENCY ADJUSTMENT P INPUT T 3 db PIN ATTN 6 db 10 db 30 db 50 db PHASE ADJUST DC BLOCK RF LO IF LPF TRANSMITTED POWER NETWORK CHASSIS 10 db 30 db DC BLOCK 50 P INPUT R P INPUT I P INPUT HOMA P INPUT HOMB PWR METER 50 PWR METER PWR METER 10 db 10 db DUAL CHANNEL PWR METER 10 db 20 db 20 db 10 db 4 db 10 db 6 db 1 db POWER METER INTERFACE CHASSIS DC BLOCK VCO/PLL CHASSIS 6 db AMERICAN MICROWAVE SW A 10 db PIN VECTOR SWITCH MODULATOR FREQUENCY COUNTER VECTOR MODULATOR BUFFER PCB STEP ATTEN RF ON/OFF SWITCH P/O XTAL BUFFER P T, P R, P I, LOOP ERR TO RAD ENABLE P/O XTAL BUFFER PCB LLRF DRIVE FREQ PWR1 PWR2 PWR3 PWR4 GPIB P/O ANALOG I/O DIO COMPUTER INTERFACE P/O ANALOG I/O P/O ANALOG I/O RAD7 RAD8 P7 P8 Page 10
11 Complete Low Level System Layout GAIN POT LOCAL REMOTE SWITCH HI/LO GAIN SWITCH FROM ANALOG I/O PORT (ONE ANALOG, ONE DIGITAL) CONTROL INTERFACE PCB EXTERNAL VCO The transmitted power network has a switchable LNA and variable attenuator, both can be controlled by the computer. +12 VDC CENTER FREQUENCY ADJUSTMENT P INPUT T P INPUT R P INPUT I P INPUT HOMA P INPUT HOMB 3 db PIN ATTN PWR METER 50 PWR METER PWR METER TRANSMITTED POWER NETWORK CHASSIS 10 db 10 db DUAL CHANNEL PWR METER 10 db 20 db 6 db db 10 db 4 db 10 db 6 db 1 db POWER METER INTERFACE CHASSIS 10 db 30 db 50 db PHASE DC RF IF ADJUST BLOCK LPF The 6 db pad before the LNA ensures that there is a minimal gap in LO the continuous gain control settings. Without it there would have been 10 db 30 db a 12 db dead band. DC BLOCK VCO/PLL CHASSIS AMERICAN MICROWAVE SW A 10 db PIN VECTOR 6 db SWITCH MODULATOR FREQUENCY COUNTER DC BLOCK The phase shift associated with the PIN attenuator was measured and included as a lookup table in the program. The compensation values are factored into the vector modulator algorithm. STEP ATTEN P/O XTAL BUFFER P T, P R, P I, LOOP ERR TO RAD ENABLE P/O XTAL BUFFER PCB LLRF DRIVE Circulators are used to VECTOR reduce the mismatch and ensure more stable MODULATOR BUFFER PCB power meter calibrations. The 10 db attenuators RF ON/OFF used in the incident SWITCH and reflected power path also serve that purpose Only low drift fixed devices are used between the power meters and the cavities. FREQ PWR1 PWR2 PWR3 PWR4 GPIB P/O ANALOG I/O DIO COMPUTER INTERFACE P/O ANALOG I/O P/O ANALOG I/O RAD7 RAD8 P7 P8 Page 11
12 Complete Low Level System Layout FROM ANALOG I/O PORT The VCO was moved (ONE to ANALOG, an ONE external DIGITAL) location so that it could be thermally LOCAL REMOTE CONTROL stabilized. This SWITCH also allows GAIN INTERFACE us PCBto use POT alternate VCOs. HI/LO GAIN SWITCH The 50 db attenuator was necessary due 3 db PIN P INPUT T ATTN 6 db to the excessive tuning sensitivity of the VCO, which is 5.6 MHz/V. TRANSMITTED POWER NETWORK CHASSIS Crystal detector gain set to reduce the square law errors while maintaining 50 a 1 V amplitude at the DAQ input. PWR METER 20 db Even though there is a vector modulator, db 4 db there is a mechanical 10 db phase shifter which P INPUT 10 db R 10 db is used frequently. PWR METER 6 db 1 db 10 db Computer P INPUT I controlled vector modulator is 20 db PWR used for amplitude and phase control. METER POWER METER INTERFACE CHASSIS All crystal P INPUT HOMA detector DUAL signals are buffered CHANNEL P HOMB INPUT PWR METER and available for observation using an oscilloscope. Computer controlled and automatic data acquisition ensures repeatable data and methods independent of operator. DC BLOCK VCO/PLL CHASSIS 10 db 30 db 50 db FREQ PWR1 PWR2 PWR3 PWR4 6 db 10 db AMERICAN MICROWAVE SW A 10 db PIN VECTOR SWITCH MODULATOR FREQUENCY COUNTER GPIB PHASE ADJUST 30 db EXTERNAL VCO +12 VDC P/O ANALOG I/O DC BLOCK DC BLOCK VECTOR MODULATOR BUFFER PCB DIO COMPUTER INTERFACE RF LO STEP ATTEN IF P/O ANALOG I/O LPF P/O XTAL BUFFER P T, P R, P I, LOOP ERR P/O ANALOG I/O CENTER FREQUENCY ADJUSTMENT RF ON/OFF SWITCH RAD7 RAD8 P7 P8 TO RAD ENABLE P/O XTAL BUFFER PCB LLRF DRIVE Page 12
13 Interlocks For Vertical Tests During vertical testing medium power amplifiers between 100 W and 500 W are used to drive the cavities. No cavity protection interlocks are used during these tests at Jefferson Lab. Each facility and test should be evaluated individually. Field emission radiation does present a safety hazard. This is mitigated during vertical testing at Jefferson Lab by using one of 6 shielded vertical dewars. High power RF can not be applied to an accelerating structure until the PSS system confirms that the dewar shield lid is closed. Low power, less than 1 W, must be applied to the system in order to calibrate the cables. A switching system shown here was implemented to perform these functions for R&D testing. A similar switching system, along with dewar selection switches and permanently installed cables, was implemented for the production system. AC PSS HPRF SW1 LLRF FROM CONTROL ROOM 1W P5 USER SUPPLIED AMPLIFIER AND CIRCULATOR RF SWITCH UNIT (CONFIGURATION CONTROLLED) FREQ DEPENDENT CIRCULATOR SW2 PSS HPRF P1 PSS P2 P3 P4 LLRF AC P6 CONTROL HIGH POWER RF TO DEWAR Page 13
14 Cryomodule Test System Layout VXI BASED VCO-PLL ARC, IR COUPLER VACUUM BEAM LINE VACUUM HELIUM PRESSURE COUPLER WATER FLOW LIQUID LEVEL PM CH1 PM CH2 6 db -6 db PIN SW RF INTERLOCKS RF RELAY -10 db AC PWR KLYSTRON INTERLOCK SWITCH FOWARD POWER PSS HIGH BAY (KLYSTRON AREA) CAVE 40 db 40 db 20 db 20 db 10 db* 10 db* DIGITAL STORAGE OSCILLOSCOPE PM CH3-10 db REFLECTED POWER PM CH4-10 db FIELD PROBE POWER 10 db 1 W RF CONTROLS AND MEASUREMENT COMPUTER PM CH5 PM CH6 HIGHER ORDER MODE A-COUPLER POWER HIGHER ORDER MODE B-COUPLER POWER 10 db 20 W 10 db 20 W Page 14
15 Cryomodule Test System Layout VXI BASED VCO-PLL ARC, IR COUPLER VACUUM BEAM LINE VACUUM HELIUM PRESSURE COUPLER WATER FLOW LIQUID LEVEL DIGITAL STORAGE OSCILLOSCOPE RF CONTROLS AND MEASUREMENT COMPUTER PM CH1 PM CH2 PM CH3 PM CH4 PM CH5 PM CH6 6 db -6 db PIN SW RF INTERLOCKS RF RELAY -10 db -10 db -10 db PSS CAVE AC PWR Due to the excessive costs to recover from a coupler failure. KLYSTRON Full interlocks were implemented for the 40 db 40 db INTERLOCK system, including: SWITCH HIGH Arc BAY (KLYSTRON AREA) 20 db Infrared FOWARD POWER 20 db Coupler and cavity Vacuums Helium pressure and level 10 db* Coupler cooling water flow 10 db* Use of the interlocks was mandatory for all high power operations. REFLECTED POWER Boonton 4532 pulsed RF power meters were used to acquire waveform records of the pulsed RF power data. A software interlock was added based on HOM coupler power levels. 10 db 1 W Circulators FIELD PROBE added POWERto ensure that user changes to the other outputs would not affect calibrations. 4-Way splitters added so that the RF signals could be used by other systems in parallel with the standard data acquisition process. 10 db 20 W HIGHER Crystal ORDER detectors MODE A-COUPLER used POWER for operator feedback only. Computer controlled and automatic data acquisition was 10 db 20 W HIGHER necessary ORDER MODE for B-COUPLER calibration POWERof the field probes using an emitted power technique. Page 15
16 Cryomodule Test System Layout -6 db Personnel safety VXI BASED system provides a permit PINto allow RF VCO-PLL SW RELAY high voltage operation of the klystron. Operations at PM ARC, IR CH1 less than 6 db RF INTERLOCKS COUPLER 1 W VACUUM allowed without a PSS interface. BEAM LINE VACUUM HELIUM PRESSURE COUPLER WATER FLOW LIQUID LEVEL -10 db PM CH2 Waveguide directional coupler placed in the middle of a 4 m run of waveguide in order to avoid errors due to evanescent modes. Attenuators were distributed throughout the system in order to reduce the susceptibility to standing wave induced errors. DIGITAL STORAGE OSCILLOSCOPE PM CH3-10 db Polyphaser B50 or MR50 series lightning arrestors were added to the HOM ports after several RF power heads and medium power attenuators (20 W-CW and 500 W-PK) were destroyed. Excessive power was observed on a crystal detector when a cavity -10 had db a PM CH4 thermal quench. At times during the SNS testing a 20 kw CW klystron was substituted for the 1 MW pulsed klystron. Stub tuners and iris plates were used to modify the input coupling of the system. Maximum PM CH5 RF CONTROLS CW power AND MEASUREMENT levels were limited by the coupler power COMPUTER capacity. PM CH6 AC PWR KLYSTRON INTERLOCK SWITCH HIGH BAY (KLYSTRON AREA) FOWARD POWER PSS REFLECTED POWER FIELD PROBE POWER HIGHER ORDER MODE A-COUPLER POWER HIGHER ORDER MODE B-COUPLER POWER CAVE 40 db 40 db 20 db 20 db 10 db* 10 db* 10 db 1 W 10 db 20 W 10 db 20 W Page 16


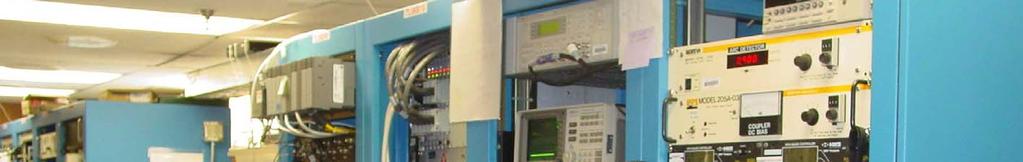
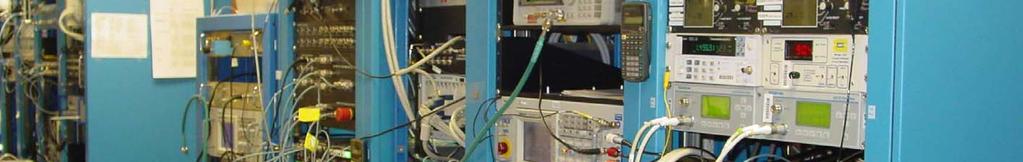
17 VTA TEST SYSTEMS Chassis from 805 MHz production system. 500 to 1000 MHz VCO-PLL System used for SNS Production 500 to 3,000 MHz VCO-PLL system used for research and development Page 17


18 VERTICAL TEST AREA TESTING PROGRAM Forward power and phase controlled via an I/Q modulator Internal algorithm controls LNA and PIN attenuator to ensure proper signal levels for Mixer and transmitted power crystal detector. Qo, incident power, and gradient continuously updated. Measure and log button updates graph and logs data to a file. Interactive calibration routine with imbedded instructions. Page 18
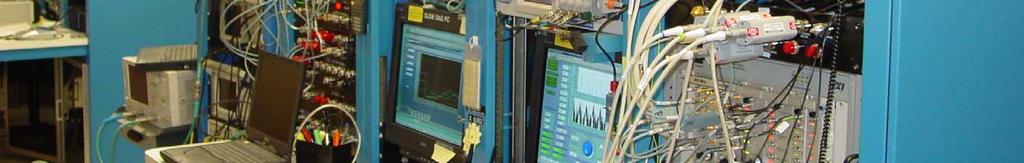
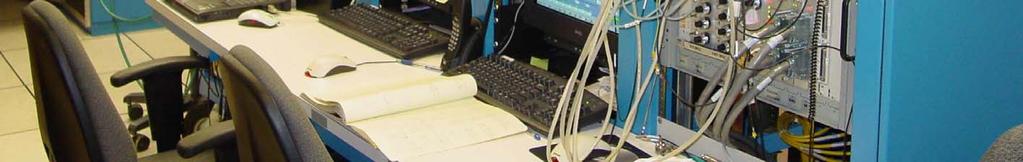
19 CRYOMODULE TEST FACILITY CONTROL ROOM Page 19
 Loaded Q, Field Probe Q, gradient, and emitted power calculated")

20 CRYOMODULE TESTING PROGRAM Real time gradient and forward and reflected power waveforms shown (supplemented with crystal detectors and an oscilloscope) Loaded Q, Field Probe Q, gradient, and emitted power calculated on each pulse. Gradient waveform based on an entered value of the field probe Q. Forward power and phase controlled via an I/Q modulator. Data continuously logged to a network drive. Waveforms recorded on request. Page 20
21 VACUUM CONDITIONING CONTROLLER VACUUM GAUGE CONTROLLER VACUUM GAUGE CONTROLLER VACUUM SETPOINT READBACK + Σ Σ + -V RF SOURCE -2.5 VACUUM GAIN READBACK System uses analog vacuum signal to control the drive level for a klystron. When the vacuum signal increases the PIN attenuator reduces the RF Drive signal Diode adder ensures that the larger of the two vacuum signals controls the feedback. Separate vacuum set point and gain control with analog read back Redundant switching of RF in the event of an interlock fault. Ones of millisecond response time achieved. Limited by vacuum gauge controller. Phase shift associated with PIN attenuator may cause problems when operating a cavity with a VCO-PLL. -5V +1 + VACUUM CONTROL RF CONTROL PIN ATTN LINEARIZATION CIRCUIT PIN SWITCH ARC, COOLING WATER, ETC INTERLOCKS KLYSTRON PROTECTION CIRCUITS Page 21 KLYSTRON TEST CELL TEST CELL
22 CAVITY RESONANCE MONITOR I I _ + di dt I dq dt cos ( ω t + ϕ() t ) 10 db 0 0 RF LO 3 db STABLE RF SOURCE cos( ω 0 t) khz LPF 1 Hz LPF ϕ(t) LIMITER 90 RF I LO Q _ + dq dt Q di dt A cavity resonance monitor is a system which provides an output signal which is proportional to the difference between the input signal and a reference source. They are useful for making accurate microphonic measurements in time domain. The front end circuitry requires careful tuning to ensure precise I/Q demodulation. The limiting amplifier is used to stabilize the gain in the system. Without it a separate power measurement would have to be made in order to calibrate the output signals. Page 22
23 CAVITY RESONANCE MONITOR A cavity resonance monitor is calibrated by using two stable sources with a common reference signal. The frequency on one sources is varied and the difference in output voltage is recorded. An alternate method when using a relatively stable cavity is to shift the frequency of the reference sources slightly and measure the subsequent shift in output signal. One of the problems with an analog resonance monitor is that mixers are not ideal. At higher frequencies of I and Q, the second harmonic components bleed through to the output giving false frequency content. A new DSP based system is currently under development at Jefferson Lab, which shows a great deal of promise. Using a CORDIC algorithm for phase determination and a high resolution analog to digital converter eliminates the need for the difficult to find limiting amplifier; simplifies the calibration process and eliminates gain drifts. A paper will be presented by Tomasz Plawski during the poster session on Thursday I invite you to stop by and visit poster P63. Page 23
24 CRM EXAMPLES Time domain and frequency domain plots of the background microphonics for a 5-cell CEBAF cavity located in the CEBAF accelerator. Page 24
25 CRM EXAMPLES Vibrational modes excited by the sudden loss of cavity gradient due to a window discharge on the cavity side of a cold window in the same cavity as the previous slide. Page 25
26 CRM EXAMPLES Freq Shift (Hz) Freq Shift (Hz) Time (s) Step response of a cavity excited by a by a 50 Hz step in the piezo tuner controls. The total range of this tuner was 550 Hz. Cavity Frequency Shift (Hz) Piezo Drive Voltage (V) Cavity Frequency Shift (Hz) Piezo Drive Voltage (V) Time (s) PZT Drive (V) PZT Drive (V) Page 26
27 CABLE CALIBRATIONS Accurate consistent cable calibrations can make or break a test program. VSWR mismatches in the RF circuits will cause errors to appear when the frequency is shifted or the load mismatch changes. Cable calibrations for cavity testing are complicated by the fact that one or more of the cables are only accessible from one end. In a vertical test the incident power cable, the field probe cable, as well as any HOM cables all have sections that are in the helium bath. In cryomodule testing the field probe cable and any HOM cables have sections of cable that are within the cryomodule. When possible cables should be calibrated using signal injection and measurement at the other end using either a source and power meter combination; or a network analyzer. Cables should be measured at or near the frequency of the test. The only way to measure the losses of a cable within a cryostat is to do a two way loss measurement either with a calibrated network analyzer or a source, a circulator and a power meter. Page 27
28 ONE WAY CABLE CALIBRATION TRANSMITTED POWER METER B C A RF DRIVE SOURCE 30 db TYPICAL D E INCIDENT POWER METER F REFERENCE POWER METER REFERENCE SOURCE REFERENCE CIRCULATOR REFLECTED POWER METER G To calibrate the cable from point A to point C. Measure the one way loss of cable B-C. Measure the reference source power level with the reference power meter. (P1) Connect the reference source to point B of cable B-C. Measure the power level with the transmitted power meter. (P2) The one way loss is P1-P2 (db) Measure the two way return loss of cable A-B Connect the reference source to the input terminal of the circulator. Connect the reference power meter to the load port on the circulator. Record the reading on the reference power meter with the output port of the circulator open.* (P3) Connect the output port of the circulator to port B of cable A-B and record the reading on the reference power meter. (P4) The two way return loss is P3-P4 (db) The cable calibration between for the A-C path is C AC = (P1-P2) + (P3-P4)/2. Page 28
29 TWO WAY CABLE CALIBRATION TRANSMITTED POWER METER B C A RF DRIVE SOURCE 30 db TYPICAL D E INCIDENT POWER METER F REFERENCE POWER METER REFERENCE SOURCE REFERENCE CIRCULATOR REFLECTED POWER METER G To calibrate the cable from point D to F and D to G Measure the forward power calibration from E to F Connect the reference power meter to point E of the cable from the RF drive source. Turn on the RF drive source and increase the power until the power level on the reference power meter is about 2/3 of the maximum allowed. Record the power levels on the reference meter (P5) and the incident meter (P6) Measure the reflected power calibration from E to G Turn off the RF source drive Measure the reference source power level with the reference power meter. (P7) Connect the reference source to point E of the path E-G. Measure the power level with the reflected power meter. (P8) Measure the two way loss for the cable D-E with a detuned cavity. Connect the RF drive source to the cavity at point E. Turn on the RF drive source and apply power to the cavity at a frequency about 10 to 20 khz higher or lower than the cavity s resonant frequency. Measure the incident (P9) and reflected power (P10) with the respective meters. The cable calibration are: Incident C D-F = (P5 P6 + P7 P8 P9 + P10)/2 (db) Reflected C D-G = ( P5 + P6 + 3*P7 3*P8 P9 + P10)/2 (db) Page 29
30 CALIBRATION VERIFICATION Two ways that I use to verify calibration procedures are to: Calibrate the system using an external cable rather than a cable within the dewar then: For field probe power and reflected power inject a known signal level into the external cable and measure the power using the calibrated meter. For the forward power connect the external cable to a remote power meter and measure the power using the remote power meter and the system power meter. In both cases it can be a useful exercise to vary the frequency over a 1 MHz to 2 MHz range and compare the values over the range. Page 30
31 CALIBRATION VERIFICATION A third way to verify the calibration and look for VSWR problems in the incident power cable is to: Use the RF drive source to apply power to either an open test cable that has been calibrated or a detuned cavity. Measure the calibrated forward and reflected power. They should be equal. Vary the RF frequency by +/- 1MHz in 100 khz increments. Variations in the ratio of forward to reflected power indicate a VSWR problem within the cabling system. Page 31
32 MEASUREMENT OF VSWR INDUCED ERRORS 4.0% Difference from 805 MHz value 2.0% 0.0% -2.0% -4.0% -6.0% -8.0% Freqency (MHz) Difference between RF readings calibrated at 805 MHz and those taken at nearby frequencies for several different signal paths. The paths with smaller errors had attenuators distributed throughout the signal path. Page 32
33 CABLE BREAKDOWN IN LOW PRESSURE HELIUM When vertical testing the incident power cables must pass through the low pressure helium gas in order to get to the fundamental power coupler. Both the mating connector space as well as the cable back shell space are susceptible to this phenomena. Glow discharges have been produced in unterminated N-connectors at 20 Torr using as little as 10 Watts. Even connectors in 2 K liquid helium have been known to break down at power levels on the order of 150 W, full reflected at the cavity. Page 33
34 CABLE BREAKDOWN IN LOW PRESSURE HELIUM Once a breakdown is initiated it will be sustained by the forward power even at levels down to 10 W. Such events appear to be Q-switching within the cavity. The gradient will be reduced and the measured Qo will be reduced substantially. These discharges destroy connectors and have the potential to cause failures in vacuum feedthroughs. To put things in perspective The Paschen minimum is the product of the pressure and distance required for the minimum voltage breakdown in gas. For helium this value is 4 Torr-cm. In other words at 20 Torr the electrode spacing for a minimum voltage breakdown is 2 mm. The theory on breakdown in liquid is that: A few watts of heat is produced in the connector, possibly through thermal conduction down the, insulated, center conductor, from the antenna within the cavity, or in the connector pin itself. The liquid helium flashes to gas within the connector A breakdown occurs in the newly produced low pressure gas volume. Page 34
35 CABLE BREAKDOWN IN LOW PRESSURE HELIUM To determine if you have a cable discharge, while it is occurring: Detune the frequency of the LLRF system far enough to lose lock in the cavity. Measure the forward and reflected power. Subtract the calibrated forward power from the calibrated reflected power to calculate the lost power. If any significant power is being lost you probably have a glow discharge in the connector. On occasion connectors damaged from mechanism this will exihibit this anomalous loss permanently at all power levels. Therefore one should turn off the RF power; and repeat the steps above to ensure that the lost power is consistent with the error associated with the measurement. Page 35
36 CABLE BREAKDOWN IN LOW PRESSURE HELIUM So what is an engineer to do? NEVER make a high power RF connection in low pressure helium gas. We use silicon dioxide dielectric, stainless steel jacketed, cables manufactured by Meggitt Safety Systems which have the outer conductor welded into a Conflat flange. This ensures that the high power connections are only made in liquid helium. Vent all connector volumes to the helium bath to improve the heat conduction out of the space, especially connector backshells. Fill all potential spaces with insulating material. In theory this should work but we have only had limited success at 300 W. One option that we have pursued but not fully implemented is to pressurize the cable with helium gas including the connection to the vacuum feed through at the coupler antenna, above the triple point of helium. Best of all critically couple the cavities by carefully adjusting the input antenna or by using a variable coupler so that you do not have to use more than 150 W at the cavity. Page 36
37 VERTICAL AND HORIZONTAL TESTING During production cavities are generally tested using antenna inserted into the fundamental power couplers or one of the beam pipes. The goal is to have the cavity at or near critical coupling for these tests. In this way a minimum amount of power can be used to reach design gradient. Ideally this means just enough power to overcome the heat losses in the cavity and the power coupled out of the other ports. This has the advantage that the power lost to wall heating can be calculated based on RF measurements. In most labs these tests are done in vertical test dewars, hence they are commonly called vertical tests. Cavities in a cryomodule are typically tested using the production couplers that are strongly over coupled. This presents a problem as the errors in lost RF power get excessive when 95% to 99.9% of the incident power is reflected back out of the fundamental power coupler. During cryomodule tests the RF heat load is measured calorimetrically. Page 37
38 FUNDAMENTAL TERMS r/q G Shunt Impedance* Geometry Factor Ω/m Ω T r resid Operational Temperature Residual Surface Resistance K Ω E Electric Field V/m Q 0 Intrinsic Quality Factor L ω 0 U r S Electrical Length Cavity Frequency Stored Energy Surface Resistance m s -1 J Ω QFPC Q FP, Q 2 R C I FPC Coupling Factor Field Probe Coupling Factor Coupling Impedance Beam Current Ω/m A T C Critical Temperature K I M Matching Current A P P X emit R RF Power at port X Emitted Power Shunt impedance W W Ω P disp τ r Dissipated Power Decay Time Shunt Impedance Per Unit L W s Ω/m *Beware that there are different definitions for shunt impedance in use. At Jefferson Lab we use R = V 2 /P that includes transit time factor for β = 1. Page 38
39 FUNDAMENTAL EQUATIONS (The Doolittle Sheet part 1) r S Q L 0 U = Uω0 P = Q R C I M ( r / Q) = G / rs Q f 10 4( ΩK / GHz2) e T Q = Q Q Q 0 FPC = Q E E = Q L 2 L ω ( r / Q) ElectronLoading FP ( r / Q) = E / R C L 1.95T c / T Q FPC + r resid Page 39
40 reflected in Watts, ω FUNDAMENTAL EQUATIONS (The Doolittle Sheet part 2) Power levels for a strongly over coupled cavity, including beam loading but no microphonics: delivered to beam LEI needed from the klystron = ( β + 1) ( E + IR ) ( E IR ) Time dependent, complex diferential equation where K * ( E + I R cosψ ) ( E + IQ ( r / Q) ) ( E IQ ( r / Q) ) ω 1 1 d d E R -j E + = 2K C R C I ω f ω f dt L One addition to the standards is the equation for the power required for cavity center frequency f P to the circulator 0 d Klystron detuned by δf * L L 4β 4R 4R C is the (time varying) detune angle, and ω L R C C C C = = and beam current, I C ( r / Q) L ( r / Q) L 0 2 = ω / 2Q + 2Q 0, off crest byψ B B 0 : 2 : 2 is the incident wave amplitude f L L L δf f L E + I 0 R C sinψ B 2 Page 40
41 BASIC EQUATIONS The following are basic equations relating to coupling factor, β. where C β 1 C β = 1 + C P P reflected reflected / P / P incident incident is1 for under coupled and -1for over coupled In the case of a strongly over coupled cavity In the case β >> 1, QL << Q0, or QFP thus QL Q QL = 2πτ 2 4β ( r / Q) E = PincidentQL (1 + β ) L E β β 4P incident Q L ( r / Q) L Although using the forward power to calculate gradient is a reasonable technique, practical experience says that there can easily be as much as 25% difference between the gradient measured using this technique as compared to the that measured using the emitted power technique or using a well calibrated field probe measurement. This difference can be reduced by properly tuning the phase locked loop, for a variable frequency system or the cavity for a fixed frequency system. FPC Page 41
42 EMITTED POWER MEASUREMENT THE REFERENCE MEASUREMENT FOR STRONGLY OVER COUPLED CAVITIES Consider what happens when you suddenly remove the incident RF power from a cavity that has the stored energy U. This stored energy leaves the system through dissipation due to wall losses, i.e. Q 0 losses, and as RF power that is emitted from all of the RF ports in the system. Since Q L << Q FP and Q L << Q 0 in a strongly over coupled superconducting cavity the stored energy can be calculated as: U = t 0 Pemitted ( t) dt Preflected ( t) dt t 0 Historically value of U was measured using a gating circuit and an RMS power meter. In a sampled system, such as can be done with a Boonton 4532 pulsed power meter, the stored energy can be approximated by: U N m ( P ) t reflected Where m is the sample point where the incident power is removed and N is the total number of sample points. In addition to the errors associated with the power measurement, there are errors in this measurement which are introduced by the sampling system that can be reduced by proper choice of system parameters. i Page 42
43 EMITTED POWER MEASUREMENT UNCERTAINTY The uncertainty in the stored energy is given by the following: U = U Where : C P R CAL t( N C is the percentage error in the power reading due to the cable calibration errors and is the error in the power meter calibration. m) C 2 R R + P P min 2 CAL + t( N m) C R P min + ( P emitted ) m t + τ ( P emitted is the contribution of the power meter noise floor during the integration. ( Pemitted ) m t is due to the jitter in the start of the integration and the peak of the emitted power transient ) N m N τ ( P emitted ) N is the error introduced because you only summed the series to N and not to The last two errors can be minimized by sampling the system at a high sample rate compared to the decay time and insuring that that (m-n) t is greater than 4 decay time constants. Page 43
44 FIELD PROBE CALIBRATION Once the stored energy has been determined the gradient can be calculated by using the following: r / Q E Emitted = 2πf 0 * U * L Where the emitted subscript is just an indicator of method used to determine the value. The filed probe coupling factor, Q FP can the be calculated using: Q FP = E 2 Emitted L ( P ) r / Q Transmitted m 1 * Where P Transmitted is sampled just prior to removal of the incident power signal. Normally an average of several points just prior to m is used for this value. With good calibrations and proper sample rates the gradient, E, can be measured with an accuracy of 5% to 7% and Q of the field probe to about 10% to 12%. Page 44
45 Qo MEASUREMENTS When making a Q 0 measurement on a cavity that is near critical coupling the dissipated power is calculated as the forward power minus the sum RF power leaving the system either as reflected power as it exits the field probe port, HOM port, etc. The error stack up is given as the following: P P Disp Disp = 2 2 ( Pincident ) + ( Preflected ) + ( Ptransmitted ) ( P P P ) 2 incident transmitted reflected 2 ERROR IN DISSIPATED POWER 25% 20% 15% 10% 5% 0% BETA As was stated earlier, β is a measure of the magnitude of the reflected power as compared to incident power. At β = 1 the error in the dissipated power, as measured using the RF signals, is minimized and approximately the value of the error in the incident power. As β gets much above 8 and much below 0.15 the errors in dissipated power, and subsequently calculated values of Q 0 start to become excessive. Page 45
46 Qo MEASUREMENTS When making a Q 0 measurement on a cavity that is strongly over coupled the dissipated power must be measured calorimetrically. To do this: The inlet and outlet values on the helium vessel are closed The rate of rise of the helium pressure is measured under static heat load. The rate of rise of the helium pressure is measured under a heat load of static plus known resistive power. The rate of rise of the helium pressure is measured under a heat load of static plus unknown cavity dissipated power. The following equation is used to calculate the unknown cavity dissipated power. P DISSIPATED = dp dt dp dt RF ON HEATER ON dp dt dp dt STATIC STATIC P HEATER dp where is the rate of dt rise of the pressure under the different conditions. Page 46
47 REFLECTED POWER WAVEFORMS When operating cavities near critical coupling and preparing to make a decay measurement, one of the items that must be determined is the cavity is over coupled or under coupled. Typically a crystal detector is placed on the reflected power signal and the waveform is observed under pulsed conditions. Signal goes to zero if properly tuned Initial peak is equal to the reflected power level when cavity detuned in all cases β < 1/ 3 β > 1 β = 1 1 > β > 1/ 3 Over Coupled Critically Coupled Under Coupled Reflected Power Field Probe Forward Power Page 47
48 CONCLUSION Quality measurements necessary to qualify superconducting cavities require quality equipment designs, careful measurement techniques and well characterized calibrations processes. Errors for the standard measurements are calculable. However, the are a function of the measurement equipment, the quality of the calibration and the specific conditions of each data point. As such they should be included in the measurement system not as an afterthought. In addition to the slides presented, I have included a handout of the equations for both the cavity measurements and the associated errors. I want to thank all of the folks in the SRF Institute at Jefferson Lab for their constant patience in helping me put this presentation together. Page 48
49 CAVITY RESONANCE MONITOR Define the input signal to be cos( ω t) and the reference signal be cos( ω t). Passing the input signal through the 90 degree hybrid provides the following: i = cos( ω t) 1 q = sin( ω t) after going through the respective mixers 1 1 I = cos( ω1t )cos( ω0t) = cos( ω1t -ω0t) + cos( ω1 + ω0) and Q = sin( ω1t )cos( ω0t) = sin( ω1t + ω0t) + sin( ω1t ω0t) 2 2 Going to base band eliminates the sum frequeny terms. To simplify let ω 1 and di ω2 dq ω2 = sin( ω2t) and = cos( ω2t) dt 2 dt 2 dq di ω2 ω2 I + Q = cos( ω2t)cos( ω2t) + sin( ω2t)sin( ω2t) dt dt 2 2 ω2 2 2 = (cos ( ω2t) + sin ( ω2t)) or 2 dq di ω2 I + Q = where ω2 may vary with time. dt dt = ω ω 1 0 Page 49
Cavity Testing Mathematics. Tom Powers USPAS SRF Testing Course 19 Jan. 2014
 Cavity Testing Mathematics Tom Powers USPAS SRF Testing Course 19 Jan. 014 General Block Diagram for Vertical or Horizontal Test Stand Frequency tracking source can be either a VCO-PLL based system or
Low-Level RF. S. Simrock, DESY. MAC mtg, May 05 Stefan Simrock DESY
 Low-Level RF S. Simrock, DESY Outline Scope of LLRF System Work Breakdown for XFEL LLRF Design for the VUV-FEL Cost, Personpower and Schedule RF Systems for XFEL RF Gun Injector 3rd harmonic cavity Main
C100 Cryomodule. Seven cell Cavity, 0.7 m long (high Q L ) 8 Cavities per Cryomodule Fits the existing Cryomodule footprint
 8 Cavities per Cryomodule Fits the existing Cryomodule footprint") 1 new module C100 Cryomodule Seven cell Cavity, 0.7 m long (high Q L ) 8 Cavities per Cryomodule Fits the existing Cryomodule footprint Fundamental frequency f 0 Accelerating gradient E acc 1497 MHz >
1 new module C100 Cryomodule Seven cell Cavity, 0.7 m long (high Q L ) 8 Cavities per Cryomodule Fits the existing Cryomodule footprint Fundamental frequency f 0 Accelerating gradient E acc 1497 MHz >
R.Bachimanchi, IPAC, May 2015, Richmond, VA
 1 new module C100 Cryomodule Seven cell Cavity, 0.7 m long (high Q L ) 8 Cavities per Cryomodule Fits the existing Cryomodule footprint Fundamental frequency f 0 Accelerating gradient E acc 1497 MHz >
Microphonics. T. Powers
 Microphonics T. Powers What is microphonics? Microphonics is the time domain variation in cavity frequency driven by external vibrational sources. A 1.5 GHz structure 0.5 m long will change in frequency
Waveguide Arc Restrike Test Results Abstract Background
 Waveguide Arc Restrike Test Results Tom Powers, Doug Curry, Kirk Davis, Larry King, and Mike Tiefenback Thomas Jefferson National Accelerator Facility (Test dates July 6, 2004 through September 2, 2004)
Low Level RF Systems
 Low Level RF Systems Tom Powers Jan. 2015 (Slides stolen from: Powers LLRF workshop 2011, Plawski LLRF workshop 2013, Power/Hovater LBL light source working group 2012, Powers, HOM workshop 2012. LLRF
Cavity Field Control - RF Field Controller. LLRF Lecture Part3.3 S. Simrock, Z. Geng DESY, Hamburg, Germany
 Cavity Field Control - RF Field Controller LLRF Lecture Part3.3 S. Simrock, Z. Geng DESY, Hamburg, Germany Content Introduction to the controller Control scheme selection In-phase and Quadrature (I/Q)
Digital LLRF Test on the Renascence Cryomodule
 Digital LLRF Test on the Renascence Cryomodule Trent Allison, Rama Bachimanchi, Curt Hovater, John Musson and Tomasz Plawski Introduction The Renascence cryomodule was the first opportunity for testing
MICROWAVE MICROWAVE TRAINING BENCH COMPONENT SPECIFICATIONS:
 Microwave section consists of Basic Microwave Training Bench, Advance Microwave Training Bench and Microwave Communication Training System. Microwave Training System is used to study all the concepts of
ABSTRACT 1 CEBAF UPGRADE CAVITY/CRYOMODULE
 Energy Content (Normalized) SC Cavity Resonance Control System for the 12 GeV Upgrade Cavity: Requirements and Performance T. Plawski, T. Allison, R. Bachimanchi, D. Hardy, C. Hovater, Thomas Jefferson
RF power tests of LEP2 main couplers on a single cell superconducting cavity
 RF power tests of LEP2 main couplers on a single cell superconducting cavity H.P. Kindermann, M. Stirbet* CERN, CH-1211 Geneva 23, Switzerland Abstract To determine the power capability of the input couplers
RF STATUS OF SUPERCONDUCTING MODULE DEVELOPMENT SUITABLE FOR CW OPERATION: ELBE CRYOSTATS
 RF STATUS OF SUPERCONDUCTING MODULE DEVELOPMENT SUITABLE FOR CW OPERATION: ELBE CRYOSTATS J. Teichert, A. Büchner, H. Büttig, F. Gabriel, P. Michel, K. Möller, U. Lehnert, Ch. Schneider, J. Stephan, A.
HIGH POWER INPUT COUPLERS FOR THE STF BASELINE CAVITY SYSTEM AT KEK
 HIGH POWER INPUT COUPLERS FOR THE STF BASELINE CAVITY SYSTEM AT KEK E. Kako #, H. Hayano, S. Noguchi, T. Shishido, K. Watanabe and Y. Yamamoto KEK, Tsukuba, Ibaraki, 305-0801, Japan Abstract An input coupler,
Performance of the Prototype NLC RF Phase and Timing Distribution System *
 SLAC PUB 8458 June 2000 Performance of the Prototype NLC RF Phase and Timing Distribution System * Josef Frisch, David G. Brown, Eugene Cisneros Stanford Linear Accelerator Center, Stanford University,
FLASH rf gun. beam generated within the (1.3 GHz) RF gun by a laser. filling time: typical 55 μs. flat top time: up to 800 μs
 RF gun by a laser. filling time: typical 55 μs. flat top time: up to 800 μs") The gun RF control at FLASH (and PITZ) Elmar Vogel in collaboration with Waldemar Koprek and Piotr Pucyk th FLASH Seminar at December 19 2006 FLASH rf gun beam generated within the (1.3 GHz) RF gun by
The gun RF control at FLASH (and PITZ) Elmar Vogel in collaboration with Waldemar Koprek and Piotr Pucyk th FLASH Seminar at December 19 2006 FLASH rf gun beam generated within the (1.3 GHz) RF gun by
Measurements 2: Network Analysis
 Measurements 2: Network Analysis Fritz Caspers CAS, Aarhus, June 2010 Contents Scalar network analysis Vector network analysis Early concepts Modern instrumentation Calibration methods Time domain (synthetic
Frequency and Time Domain Representation of Sinusoidal Signals
 Frequency and Time Domain Representation of Sinusoidal Signals By: Larry Dunleavy Wireless and Microwave Instruments University of South Florida Objectives 1. To review representations of sinusoidal signals
SNS CRYOMODULE PERFORMANCE*
 SNS CRYOMODULE PERFORMANCE* J. Preble*, I. E. Campisi, E. Daly, G. K. Davis, J. R. Delayen, M. Drury, C. Grenoble, J. Hogan, L. King, P. Kneisel, J. Mammosser, T. Powers, M. Stirbet, H. Wang, T. Whitlatch,
A NEW GENERATION PROGRAMMABLE PHASE/AMPLITUDE MEASUREMENT RECEIVER
 GENERAL A NEW GENERATION PROGRAMMABLE PHASE/AMPLITUDE MEASUREMENT RECEIVER by Charles H. Currie Scientific-Atlanta, Inc. 3845 Pleasantdale Road Atlanta, Georgia 30340 A new generation programmable, phase-amplitude
A Method for Gain over Temperature Measurements Using Two Hot Noise Sources
 A Method for Gain over Temperature Measurements Using Two Hot Noise Sources Vince Rodriguez and Charles Osborne MI Technologies: Suwanee, 30024 GA, USA vrodriguez@mitechnologies.com Abstract P Gain over
Frequency Tuning and RF Systems for the ATLAS Energy Upgrade. Gary P. Zinkann
 Frequency Tuning and RF Systems for the ATLAS Energy Upgrade Outline Overview of the ATLAS Energy Upgrade Description of cavity Tuning method used during cavity construction Description and test results
Couplers for Project X. S. Kazakov, T. Khabiboulline
 Couplers for Project X S. Kazakov, T. Khabiboulline TTC meeting on CW-SRF, 2013 Requirements to Project X couplers Cavity SSR1 (325MHz): Cavity SSR2 (325MHz): Max. energy gain - 2.1 MV, Max. power, 1 ma
To produce more powerful and high-efficiency particle accelerator, efforts have
 Measuring Unloaded Quality Factor of Superconducting RF Cryomodule Jian Cong Zeng Department of Physics and Astronomy, State University of New York at Geneseo, Geneseo, NY 14454 Elvin Harms, Jr. Accelerator
MICROWAVE AND RADAR LAB (EE-322-F) LAB MANUAL VI SEMESTER
 LAB MANUAL VI SEMESTER") 1 MICROWAVE AND RADAR LAB (EE-322-F) MICROWAVE AND RADAR LAB (EE-322-F) LAB MANUAL VI SEMESTER RAO PAHALD SINGH GROUP OF INSTITUTIONS BALANA(MOHINDERGARH)123029 Department Of Electronics and Communication
1 MICROWAVE AND RADAR LAB (EE-322-F) MICROWAVE AND RADAR LAB (EE-322-F) LAB MANUAL VI SEMESTER RAO PAHALD SINGH GROUP OF INSTITUTIONS BALANA(MOHINDERGARH)123029 Department Of Electronics and Communication
CEBAF waveguide absorbers. R. Rimmer for JLab SRF Institute
 CEBAF waveguide absorbers R. Rimmer for JLab SRF Institute Outline Original CEBAF HOM absorbers Modified CEBAF loads for FEL New materials for replacement loads High power loads for next generation FELs
PXIe Contents. Required Software CALIBRATION PROCEDURE
 CALIBRATION PROCEDURE PXIe-5160 This document contains the verification and adjustment procedures for the PXIe-5160. Refer to ni.com/calibration for more information about calibration solutions. Contents
Borut Baricevic. Libera LLRF. 17 September 2009
 Borut Baricevic Libera LLRF borut.baricevic@i-tech.si 17 September 2009 Outline Libera LLRF introduction Libera LLRF system topology Signal processing structure GUI and signal acquisition RF system diagnostics
PA FAN PLATE ASSEMBLY 188D6127G1 SYMBOL PART NO. DESCRIPTION. 4 SBS /10 Spring nut. 5 19A702339P510 Screw, thread forming, flat head.
 MAINTENANCE MANUAL 851-870 MHz, 110 WATT POWER AMPLIFIER 19D902797G5 TABLE OF CONTENTS Page DESCRIPTION.............................................. Front Page SPECIFICATIONS.................................................
CUSTOM INTEGRATED ASSEMBLIES
 17 CUSTOM INTEGRATED ASSEMBLIES CUSTOM INTEGRATED ASSEMBLIES Cougar offers full first-level integration capabilities, providing not just performance components but also full subsystem solutions to help
Resonator System for the BEST 70MeV Cyclotron
 Resonator System for the BEST 70MeV Cyclotron 20 nd International Conference on Cyclotrons and their Applications Vancouver, Canada, September 16-20, 2013 Vasile Sabaiduc, Dipl. Eng. Accelerator Technology
Dhanalakshmi College of Engineering Department of ECE EC6701 RF and Microwave Engineering Unit 5 Microwave Measurements Part A
 Dhanalakshmi College of Engineering Department of ECE EC6701 RF and Microwave Engineering Unit 5 Microwave Measurements Part A 1. What is the principle by which high power measurements could be done by
Exercise 2: Demodulation (Quadrature Detector)
") Analog Communications Angle Modulation and Demodulation Exercise 2: Demodulation (Quadrature Detector) EXERCISE OBJECTIVE When you have completed this exercise, you will be able to explain demodulation
Analog Communications Angle Modulation and Demodulation Exercise 2: Demodulation (Quadrature Detector) EXERCISE OBJECTIVE When you have completed this exercise, you will be able to explain demodulation
Digital Self Excited Loop Implementation and Experience. Trent Allison Curt Hovater John Musson Tomasz Plawski
 Digital Self Excited Loop Implementation and Experience Trent Allison Curt Hovater John Musson Tomasz Plawski Overview Why Self Excited Loop? Algorithm Building Blocks Hardware and Sampling Digital Signal
DEVELOPMENT OF A BETA 0.12, 88 MHZ, QUARTER WAVE RESONATOR AND ITS CRYOMODULE FOR THE SPIRAL2 PROJECT
 DEVELOPMENT OF A BETA 0.12, 88 MHZ, QUARTER WAVE RESONATOR AND ITS CRYOMODULE FOR THE SPIRAL2 PROJECT G. Olry, J-L. Biarrotte, S. Blivet, S. Bousson, C. Commeaux, C. Joly, T. Junquera, J. Lesrel, E. Roy,
7. Experiment K: Wave Propagation
 7. Experiment K: Wave Propagation This laboratory will be based upon observing standing waves in three different ways, through coaxial cables, in free space and in a waveguide. You will also observe some
Low voltage LNA, mixer and VCO 1GHz
 DESCRIPTION The is a combined RF amplifier, VCO with tracking bandpass filter and mixer designed for high-performance low-power communication systems from 800-1200MHz. The low-noise preamplifier has a
PN9000 PULSED CARRIER MEASUREMENTS
 The specialist of Phase noise Measurements PN9000 PULSED CARRIER MEASUREMENTS Carrier frequency: 2.7 GHz - PRF: 5 khz Duty cycle: 1% Page 1 / 12 Introduction When measuring a pulse modulated signal the
10 GHz Microwave Link
 10 GHz Microwave Link Project Project Objectives System System Functionality Testing Testing Procedures Cautions and Warnings Problems Encountered Recommendations Conclusion PROJECT OBJECTIVES Implement
First Results From the Alcator C-Mod Lower Hybrid Experiment.
 First Results From the Alcator C-Mod Lower Hybrid Experiment. R. Parker 1, N. Basse 1, W. Beck 1, S. Bernabei 2, R. Childs 1, N. Greenough 2, M. Grimes 1, D. Gwinn 1, J. Hosea 2, J. Irby 1, D. Johnson
Cost-Effective Traceability for Oscilloscope Calibration. Author: Peter B. Crisp Head of Metrology Fluke Precision Instruments, Norwich, UK
 Cost-Effective Traceability for Oscilloscope Calibration Author: Peter B. Crisp Head of Metrology Fluke Precision Instruments, Norwich, UK Abstract The widespread adoption of ISO 9000 has brought an increased
1GHz low voltage LNA, mixer and VCO
 DESCRIPTION The is a combined RF amplifier, VCO with tracking bandpass filter and mixer designed for high-performance low-power communication systems from 800-1200MHz. The low-noise preamplifier has a
Tuning systems for superconducting cavities at Saclay
 Tuning systems for superconducting cavities at Saclay 1 MACSE: 1990: tuner in LHe bath at 1.8K TTF: 1995 tuner at 1.8K in the insulating vacuum SOLEIL: 1999 tuner at 4 K in the insulating vacuum Super-3HC:
Software Requirements Specification for LLRF Applications at FLASH Version 1.0 Prepared by Zheqiao Geng MSK, DESY Nov. 06, 2009
 Software Specification for LLRF Applications at FLASH Version 1.0 Prepared by Zheqiao Geng MSK, DESY Nov. 06, 2009 Copyright 2009 by Zheqiao Geng. Any change of this document should be agreed by the development
Effects of Intensity and Position Modulation On Switched Electrode Electronics Beam Position Monitor Systems at Jefferson Lab*
 JLAB-ACT--9 Effects of Intensity and Position Modulation On Switched Electrode Electronics Beam Position Monitor Systems at Jefferson Lab* Tom Powers Thomas Jefferson National Accelerator Facility Newport
The Principle V(SWR) The Result. Mirror, Mirror, Darkly, Darkly
 The Result. Mirror, Mirror, Darkly, Darkly") The Principle V(SWR) The Result Mirror, Mirror, Darkly, Darkly 1 Question time!! What do you think VSWR (SWR) mean to you? What does one mean by a transmission line? Coaxial line Waveguide Water pipe Tunnel
The Principle V(SWR) The Result Mirror, Mirror, Darkly, Darkly 1 Question time!! What do you think VSWR (SWR) mean to you? What does one mean by a transmission line? Coaxial line Waveguide Water pipe Tunnel
FAST RF KICKER DESIGN
 FAST RF KICKER DESIGN David Alesini LNF-INFN, Frascati, Rome, Italy ICFA Mini-Workshop on Deflecting/Crabbing Cavity Applications in Accelerators, Shanghai, April 23-25, 2008 FAST STRIPLINE INJECTION KICKERS
Exercise 2: FM Detection With a PLL
 Phase-Locked Loop Analog Communications Exercise 2: FM Detection With a PLL EXERCISE OBJECTIVE When you have completed this exercise, you will be able to explain how the phase detector s input frequencies
ALICE SRF SYSTEM COMMISSIONING EXPERIENCE A. Wheelhouse ASTeC, STFC Daresbury Laboratory
 ALICE SRF SYSTEM COMMISSIONING EXPERIENCE A. Wheelhouse ASTeC, STFC Daresbury Laboratory ERL 09 8 th 12 th June 2009 ALICE Accelerators and Lasers In Combined Experiments Brief Description ALICE Superconducting
Third Harmonic Superconducting passive cavities in ELETTRA and SLS
 RF superconductivity application to synchrotron radiation light sources Third Harmonic Superconducting passive cavities in ELETTRA and SLS 2 cryomodules (one per machine) with 2 Nb/Cu cavities at 1.5 GHz
Overview of ERL Projects: SRF Issues and Challenges. Matthias Liepe Cornell University
 Overview of ERL Projects: SRF Issues and Challenges Matthias Liepe Cornell University Overview of ERL projects: SRF issues and challenges Slide 1 Outline Introduction: SRF for ERLs What makes it special
Vibration studies of a superconducting accelerating
 Vibration studies of a superconducting accelerating module at room temperature and at 4.5 K Ramila Amirikas, Alessandro Bertolini, Wilhelm Bialowons Vibration studies on a Type III cryomodule at room temperature
note application Measurement of Frequency Stability and Phase Noise by David Owen
 application Measurement of Frequency Stability and Phase Noise note by David Owen The stability of an RF source is often a critical parameter for many applications. Performance varies considerably with
EE 3324 Electromagnetics Laboratory
 EE 3324 Electromagnetics Laboratory Experiment #10 Microstrip Circuits and Measurements 1. Objective The objective of Experiment #8 is to investigate the application of microstrip technology. A precision
Contents. CALIBRATION PROCEDURE NI PXIe-5668R 14 GHz and 26.5 GHz Signal Analyzer
 CALIBRATION PROCEDURE NI PXIe-5668R 14 GHz and 26.5 GHz Signal Analyzer This document contains the verification procedures for the National Instruments PXIe-5668R (NI 5668R) vector signal analyzer (VSA)
DSTS-3B DEPTHSOUNDER TEST SET OPERATOR S MANUAL
 Page 1 1.0 INTRODUCTION DSTS-3B DEPTHSOUNDER TEST SET OPERATOR S MANUAL The DSTS-3B is a full-featured test set designed for use with all types of echo sounders from small flashers to large commercial
RF and Microwave Test and Design Roadshow 5 Locations across Australia and New Zealand
 RF and Microwave Test and Design Roadshow 5 Locations across Australia and New Zealand Advanced VNA Measurements Agenda Overview of the PXIe-5632 Architecture SW Experience Overview of VNA Calibration
Abridged Data. General Data. MG7095 Tunable S-Band Magnetron for Switched Energy Applications. Cooling. Electrical. Accessories.
 The data should be read in conjunction with the Magnetron Preamble and with British Standard BS9030: 1971 Abridged Data Mechanically tuned pulse magnetron intended primarily for linear accelerators. Frequency
EMC Amplifiers Going Beyond the Basics to Ensure Successful Immunity Tests
 EMC Amplifiers Going Beyond the Basics to Ensure Successful Immunity Tests Paul Denisowski, Application Engineer Broadband amplifiers are used to generate the high field strengths required by EMC radiated
Aperture Efficiency of Integrated-Circuit Horn Antennas
 First International Symposium on Space Terahertz Technology Page 169 Aperture Efficiency of Integrated-Circuit Horn Antennas Yong Guo, Karen Lee, Philip Stimson Kent Potter, David Rutledge Division of
Status of superconducting module development suitable for cw operation: ELBE cryostats
 Status of superconducting module development suitable for cw operation: ELBE cryostats, A. Büchner, H. Büttig, F. Gabriel, P. Michel, K. Möller, U. Lehnert, Ch. Schneider, J. Stephan, A. Winter Forschungszentrum
MG7095 Tunable S-Band Magnetron
 MG7095 Tunable S-Band Magnetron The data should be read in conjunction with the Magnetron Preamble and with British Standard BS9030 : 1971. ABRIDGED DATA Mechanically tuned pulse magnetron intended primarily
R. J. Jones College of Optical Sciences OPTI 511L Fall 2017
 R. J. Jones College of Optical Sciences OPTI 511L Fall 2017 Active Modelocking of a Helium-Neon Laser The generation of short optical pulses is important for a wide variety of applications, from time-resolved
Exercise 1: RF Stage, Mixer, and IF Filter
 SSB Reception Analog Communications Exercise 1: RF Stage, Mixer, and IF Filter EXERCISE OBJECTIVE DISCUSSION On the circuit board, you will set up the SSB transmitter to transmit a 1000 khz SSB signal
INSTALLATION AND FIRST COMMISSIONING OF THE LLRF SYSTEM
 INSTALLATION AND FIRST COMMISSIONING OF THE LLRF SYSTEM FOR THE EUROPEAN XFEL Julien Branlard, for the LLRF team TALK OVERVIEW 2 Introduction Brief reminder about the XFEL LLRF system Commissioning goals
Utilizzo del Time Domain per misure EMI
 Utilizzo del Time Domain per misure EMI Roberto Sacchi Measurement Expert Manager - Europe 7 Giugno 2017 Compliance EMI receiver requirements (CISPR 16-1-1 ) range 9 khz - 18 GHz: A normal +/- 2 db absolute
Table of Contents...2. About the Tutorial...6. Audience...6. Prerequisites...6. Copyright & Disclaimer EMI INTRODUCTION Voltmeter...
 1 Table of Contents Table of Contents...2 About the Tutorial...6 Audience...6 Prerequisites...6 Copyright & Disclaimer...6 1. EMI INTRODUCTION... 7 Voltmeter...7 Ammeter...8 Ohmmeter...8 Multimeter...9
SNS LLRF Design Experience and its Possible Adoption for the ILC
 SNS LLRF Design Experience and its Possible Adoption for the ILC Brian Chase SNS - Mark Champion Fermilab International Linear Collider Workshop 11/28/2005 1 Why Consider the SNS System for ILC R&D at
TECHNICAL INFORMATION
 TECHNICAL INFORMATION TECHNOLOGY Y-Junction circulator PORT 1 PORT 2 PORT 3 FIG. 1 The Y-junction circulator uses spinel ferrites or garnet ferrites in the presence of a magnetic bias field, to provide
FREQUENCY AGILE FM MODULATOR INSTRUCTION BOOK IB
 FMT615C FREQUENCY AGILE FM MODULATOR INSTRUCTION BOOK IB1215-02 TABLE OF CONTENTS SECTION SUBJECT 1.0 Introduction 2.0 Installation & Operating Instructions 3.0 Specification 4.0 Functional Description
EE-4022 Experiment 3 Frequency Modulation (FM)
") EE-4022 MILWAUKEE SCHOOL OF ENGINEERING 2015 Page 3-1 Student Objectives: EE-4022 Experiment 3 Frequency Modulation (FM) In this experiment the student will use laboratory modules including a Voltage-Controlled
EE-4022 MILWAUKEE SCHOOL OF ENGINEERING 2015 Page 3-1 Student Objectives: EE-4022 Experiment 3 Frequency Modulation (FM) In this experiment the student will use laboratory modules including a Voltage-Controlled
77 GHz VCO for Car Radar Systems T625_VCO2_W Preliminary Data Sheet
 77 GHz VCO for Car Radar Systems Preliminary Data Sheet Operating Frequency: 76-77 GHz Tuning Range > 1 GHz Output matched to 50 Ω Application in Car Radar Systems ESD: Electrostatic discharge sensitive
EC 1402 Microwave Engineering
 SHRI ANGALAMMAN COLLEGE OF ENGINEERING & TECHNOLOGY (An ISO 9001:2008 Certified Institution) SIRUGANOOR,TRICHY-621105. DEPARTMENT OF ELECTRONICS AND COMMUNICATION ENGINEERING EC 1402 Microwave Engineering
FREIA Facility for Research Instrumentation and Accelerator Development Infrastructure and Control Architecture
 FREIA Facility for Research Instrumentation and Accelerator Development Infrastructure and Control Architecture Konrad Gajewski 10 September 2013, Uppsala Why FREIA? Several circumstances test stand for
Antenna Measurements using Modulated Signals
 Antenna Measurements using Modulated Signals Roger Dygert MI Technologies, 1125 Satellite Boulevard, Suite 100 Suwanee, GA 30024-4629 Abstract Antenna test engineers are faced with testing increasingly
PLL Synchronizer User s Manual / Version 1.0.6
 PLL Synchronizer User s Manual / Version 1.0.6 AccTec B.V. Den Dolech 2 5612 AZ Eindhoven The Netherlands phone +31 (0) 40-2474321 / 4048 e-mail AccTecBV@tue.nl Contents 1 Introduction... 3 2 Technical
High Power Couplers for TTF - FEL
 High Power Couplers for TTF - FEL 1. Requirements for High Power Couplers on superconducting Cavities 2. Characteristics of pulsed couplers 3. Standing wave pattern in the coaxial coupler line 4. Advantages
Understanding RF and Microwave Analysis Basics
 Understanding RF and Microwave Analysis Basics Kimberly Cassacia Product Line Brand Manager Keysight Technologies Agenda µw Analysis Basics Page 2 RF Signal Analyzer Overview & Basic Settings Overview
Review on Progress in RF Control Systems. Cornell University. Matthias Liepe. M. Liepe, Cornell U. SRF 2005, July 14
 Review on Progress in RF Control Systems Matthias Liepe Cornell University 1 Why this Talk? As we all know, superconducting cavities have many nice features one of which is very high field stability. Why?
5.5 SNS Superconducting Linac
 JP0150514 ICANS - XV 15 th Meeting of the International Collaboration on Advanced Neutron Sources November 6-9, 2000 Tsukuba, Japan Ronald M. Sundelin Jefferson Lab* 5.5 SNS Superconducting Linac 12000
MAHAVEER INSTITUTE OF SCIENCE & TECHNOLOGY. Microwave and Digital Communications Lab. Department Of Electronics and Communication Engineering
 MAHAVEER INSTITUTE OF SCIENCE & TECHNOLOGY Microwave and Digital Communications Lab Department Of Electronics and Communication Engineering MICROWAVE ENGINEERING LAB List of Experiments: 1.Reflex Klystron
MAKING TRANSIENT ANTENNA MEASUREMENTS
 MAKING TRANSIENT ANTENNA MEASUREMENTS Roger Dygert, Steven R. Nichols MI Technologies, 1125 Satellite Boulevard, Suite 100 Suwanee, GA 30024-4629 ABSTRACT In addition to steady state performance, antennas
Maintenance Manual LBI-38531G MHz, 110 WATT POWER AMPLIFIER 19D902797G1 DESCRIPTION TABLE OF CONTENTS
 Maintenance Manual LBI-38531G 136-174 MHz, 110 WATT POWER AMPLIFIER 19D902797G1 TABLE OF CONTENTS Page DESCRIPTION.............................................. Front Cover SPECIFICATIONS.................................................
Direct Digital Down/Up Conversion for RF Control of Accelerating Cavities
 Direct Digital Down/Up Conversion for RF Control of Accelerating Cavities C. Hovater, T. Allison, R. Bachimanchi, J. Musson and T. Plawski Introduction As digital receiver technology has matured, direct
AVN Training HartRAO 2016
 AVN Training HartRAO 2016 Microwave 1 Overview Introduction to basic components used in microwave receivers. Performance characteristics of these components. Assembly of components into a complete microwave
HIGH POWER PULSED TESTS OF A BETA=0.5 5-CELL 704 MHZ SUPERCONDUCTING CAVITY
 HIGH POWER PULSED TESTS OF A BETA=0.5 5-CELL 704 MHZ SUPERCONDUCTING CAVITY G. Devanz, D. Braud, M. Desmons, Y. Gasser, E. Jacques, O. Piquet, J. Plouin, J.- P. Poupeau, D. Roudier, P. Sahuquet, CEA-Saclay,
Specification for Radiated susceptibility Test
 1 of 11 General Information on Radiated susceptibility test Supported frequency Range : 20MHz to 6GHz Supported Field strength : 30V/m at 3 meter distance 100V/m at 1 meter distance 2 of 11 Signal generator
SA620 Low voltage LNA, mixer and VCO 1GHz
 INTEGRATED CIRCUITS Low voltage LNA, mixer and VCO 1GHz Supersedes data of 1993 Dec 15 2004 Dec 14 DESCRIPTION The is a combined RF amplifier, VCO with tracking bandpass filter and mixer designed for high-performance
CHAPTER 6 EMI EMC MEASUREMENTS AND STANDARDS FOR TRACKED VEHICLES (MIL APPLICATION)
") 147 CHAPTER 6 EMI EMC MEASUREMENTS AND STANDARDS FOR TRACKED VEHICLES (MIL APPLICATION) 6.1 INTRODUCTION The electrical and electronic devices, circuits and systems are capable of emitting the electromagnetic
147 CHAPTER 6 EMI EMC MEASUREMENTS AND STANDARDS FOR TRACKED VEHICLES (MIL APPLICATION) 6.1 INTRODUCTION The electrical and electronic devices, circuits and systems are capable of emitting the electromagnetic
Lab Exercise PN: Phase Noise Measurement - 1 -
 Lab Exercise PN: Phase Noise Measurements Phase noise is a critical specification for oscillators used in applications such as Doppler radar and synchronous communications systems. It is tricky to measure
Data Sheet SC5317 & SC5318A. 6 GHz to 26.5 GHz RF Downconverter SignalCore, Inc. All Rights Reserved
 Data Sheet SC5317 & SC5318A 6 GHz to 26.5 GHz RF Downconverter www.signalcore.com 2018 SignalCore, Inc. All Rights Reserved Definition of Terms 1 Table of Contents 1. Definition of Terms... 2 2. Description...
ANALOG COMMUNICATION
 ANALOG COMMUNICATION TRAINING LAB Analog Communication Training Lab consists of six kits, one each for Modulation (ACL-01), Demodulation (ACL-02), Modulation (ACL-03), Demodulation (ACL-04), Noise power
Agilent ESA-L Series Spectrum Analyzers
 Agilent ESA-L Series Spectrum Analyzers Data Sheet Available frequency ranges E4403B E4408B 9 khz to 1.5 GHz 9 khz to 3.0 GHz 9 khz to 26.5 GHz As the lowest cost ESA option, these basic analyzers are
Technician Licensing Class. Lesson 4. presented by the Arlington Radio Public Service Club Arlington County, Virginia
 Technician Licensing Class Lesson 4 presented by the Arlington Radio Public Service Club Arlington County, Virginia 1 Quiz Sub elements T6 & T7 2 Good Engineering Practice Sub element T8 3 A Basic Station
W-band vector network analyzer based on an audio lock-in amplifier * Abstract
 SLAC PUB 7884 July 1998 W-band vector network analyzer based on an audio lock-in amplifier * R. H. Siemann Stanford Linear Accelerator Center, Stanford University, Stanford CA 94309 Abstract The design
Agilent 8902A Measuring Receiver
 Agilent 8902A Measuring Receiver Technical Specifications Agilent 11722A Sensor Module Agilent 11792A Sensor Module Agilent 11793A Microwave Converter Agilent 11812A Verification Kit The Agilent Technologies
EXPERIMENTAL RESULT OF LORENTZ DETUNING IN STF PHASE-1 AT KEK-STF
 EXPERIMENTAL RESULT OF LORENTZ DETUNING IN STF PHASE-1 AT KEK-STF Y. Yamamoto #, H. Hayano, E. Kako, T. Matsumoto, S. Michizono, T. Miura, S. Noguchi, M. Satoh, T. Shishidio, K. Watanabe, KEK, Tsukuba,
DESCRIPTION OF THE OPERATION AND CALIBRATION OF THE MILLIMETER I/Q PHASE BRIDGE-INTERFEROMETER
 DESCRIPTION OF THE OPERATION AND CALIBRATION OF THE MILLIMETER I/Q PHASE BRIDGE-INTERFEROMETER Overview of Interferometer Operation The block diagram of the I/Q Phase Bridge-Interferometer is shown below
PXIe Contents CALIBRATION PROCEDURE. Reconfigurable 6 GHz RF Vector Signal Transceiver with 200 MHz Bandwidth
 IBRATION PROCEDURE PXIe-5646 Reconfigurable 6 GHz Vector Signal Transceiver with 200 MHz Bandwidth This document contains the verification and adjustment procedures for the PXIe-5646 vector signal transceiver.
RF System LSD Work. William Merz
 RF System LSD Work William Merz LSD Re-Baseline Review Jefferson Lab Thomas Jefferson National Accelerator Facility Page 1 Outline What I will talk about 12 GEV RF power system installation and commissioning