Cable Diagnostic Focused Initiative Regional Meeting NEETRAC
|
|
|
- Beverly York
- 6 years ago
- Views:
Transcription
1 Cable Diagnostic Focused Initiative Regional Meeting NEETRAC Hosted by Pacific Gas and Electric San Ramon, CA August 19-20,
2 GTRI/DOE Disclaimer The information contained herein is to our knowledge accurate and reliable at the date of publication. Neither GTRC nor The Georgia Institute of Technology nor NEETRAC will be responsible for any injury to or death of persons or damage to or destruction of property or for any other loss, damage or injury of any kind whatsoever resulting from the use of the project results and/or data. GTRC, GIT and NEETRAC disclaim any and all warranties both express and implied with respect to analysis or research or results contained in this report. It is the user's responsibility to conduct the necessary assessments in order to satisfy themselves as to the suitability of the products or recommendations for the user's particular purpose. No statement herein shall be construed as an endorsement of any product or process or provider Any opinions, findings and conclusions or recommendations expressed in this material are those of the author(s) and do not necessarily reflect the views of the Department of Energy This material is based upon work supported by the Department of Energy under Award No DE-FC02-04CH
. Dr.")
3 Presenters Dr. Nigel Hampton is the Program Manager for Reliability work at NEETRAC. He has worked in the Power Cable arena for more than 20 years. Nigel has a PhD in Physics from the University of Bath UK. He is currently the vice-chair of the Insulated Conductor Committee s subcommittee on diagnostic testing (Subcommittee F). Dr. Joshua Perkel is a Research Engineer in the Assessment group at NEETRAC. He has worked in the Power Cable arena for more than 5 years. Josh holds a PhD in electrical engineering from the Georgia Institute of Technology. 3 3
4 CDFI Contributors NEETRAC Jorge Altamirano Tim Andrews Yamille del Valle Nigel Hampton (Co-PI) Georgia Tech - ECE Miroslav Begovic Ron Harley J.C. Hernandez Salman Mohagheghi Rick Hartlein (PI) Thomas Parker Joshua Perkel IREQ Jean-Francois Drapeau 4 4
5 Day 1 Time 12:00 13:00 13:00 13:10 13:10 13:30 13:30 14:00 14:00 14:30 14:30 14:45 14:45 15:00 15:00 16:00 16:00 16:30 16:30 17:00 18:00 Topic Lunch Welcome NEETRAC Overview CDFI Background/Overview Cable System Failure Process SAGE Concept Break Case Study: Roswell Diagnostic Accuracies Diagnostic Testing Technologies (Part I) Dinner 5 5
6 Dinner Pasta Primavera Limited menu due to potential numbers ($21 fixed price) Butternut Squash Ravioli Chicken Piccata Linguine with Red or White Clam Sauce Full bar available Short walk from conference center 3124-C Crow Canyon Pl. 6 6
7 Day 2 Time 07:30 08:00 08:00 08:15 08:15 09:30 09:30 10:00 10:00 10:15 10:15 11:20 11:25 11:45 11:45 12:00 12:00 13:00 Topic Continental Breakfast Review Day 1 Diagnostic Testing Technologies (Part II) Accuracies Really Matter Break The Things We Know Now That We Did Not Know Before Selecting a Diagnostic Testing Technology Summary Lunch 7 7
8 Day 1 8 8
9 Outline NEETRAC Overview CDFI Background/Overview Cable System Failure Process SAGE Concept Case Study: Roswell Diagnostic Accuracies Diagnostic Testing Technologies Accuracies Really Matter The Things We Know Now That We Did Not Know Before Selecting a Diagnostic Testing Technology Summary 9 9
10 NEETRAC Overview 10 10
11 Background Created in 1996 when Georgia Power donated the facilities of its Research Center to Georgia Tech. Set up as a self supporting center within the School of Electrical and Computer Engineering of the Georgia Tech. NEETRAC is a membership based center, conducting research programs for the Electric Energy Transmission and Distribution Industry. NEETRAC Overview 11 11
12 Mission NEETRAC Mission & Vision To provide a venue where NEETRAC Staff, NEETRAC Members and the Georgia Tech Academic community can collaborate to solve problems in the T&D Arena. Vision We will build on our expertise to become the leading national Center for collaborative applied and strategic research and development for electric transmission and distribution. NEETRAC Overview 12 12
13 Members M 2. ABB 3. Ameren Services 4. American Electric Power 5. Baltimore Gas & Electric 6. British Columbia Hydro 7. Borealis Compounds LLC 8. Con Edison 9. Cooper Power Systems 10. Dominion/Virginia Power 11. Dow Chemical Company 12. Duke Energy 13. Entergy 14. Exelon 15. First Energy 16. Florida Power & Light 17. GRESCO Utility Supply 18. Hubbell 19. NRECA 20. NSTAR 21. PacifiCorp 22. Prysmian Cables & Systems 23. Public Service Electric & Gas 24. S&C Electric Company 25. South Carolina Electric & Gas 26. Southern California Edison 27. Southern Company 28. Southern States 29. Southwire 30. Thomas and Betts/Homac 31. TVA 32. tyco / Raychem 33. Zenergy Power NEETRAC Overview 13 13
14 NEETRAC Membership Growth Members Year NEETRAC Overview 14 14
15 Members Utility Members Provide > 50% of power sold in the US Serve over 64,000,000 customers Manufacturing Members Primary suppliers of T&D equipment to electric utilities in the United States NEETRAC Overview 15 15
16 Focus Areas Developed PRIMARY FOCUS AREA Hardware/Equipment Testing New Technology/Research Reliability System Analysis FOCUS SEGMENTS Application Research Product Evaluation Engineering Analysis & Support Equipment Spec. & Test Protocol Development New Product Development Research System Enhancements Asset Management Condition Assessment Forensics Operation, Installation, Design Power Quality/Grounding Safety Training/Education NEETRAC Overview 16 16

17 Facilities: High Voltage Lab NEETRAC Overview 17 17


18 Facilities: Low Voltage & Mechanical Lab NEETRAC Overview 18 18


19 19 19 Direction of Drop Movement γ r γ a Investment ΔV P loss NEETRAC Overview


 1500 1000 500")

20 Tensile and Impact Tests on 12-ft Grounding Jumpers C-clamp on 2-in pin to Flat-face Clamp on 5/8-in pin, Tension versus Clamp Displacement 3000 Sample J4 Impact 2500 Sample J4 Tensile Sample J5, Impact Sample J5 Tensile 2000 Sample I4, Impact Sample I5, Impact Sample I6, Impact Tension (lb) Actuator Displacement (inches) NEETRAC Overview 20 20
21 Staff 25 Research Staff Ph.D degees (EE & Physics) M.S. degrees (EE, IE, & ME) Bachelors degrees (EE & ME) 5 Administrative and IT Support 1 Coop Student NEETRAC Overview 21 21
22 Outline NEETRAC Overview CDFI Background/Overview Cable System Failure Process SAGE Concept Case Study: Roswell Diagnostic Accuracies Diagnostic Testing Technologies Accuracies Really Matter The Things We Know Now That We Did Not Know Before Selecting a Diagnostic Testing Technology Summary 22 22
23 CDFI Background 23 23
24 Why do we need diagnostics? Underground cable system infrastructure is aging (and failing). Much of the system is older than its design life Not enough money / manufacturing capacity to simply replace cable systems because they are old. Cable Failures per Year Need diagnostic tools that can help us decide which cables/accessories to replace & which can be left in service Always remember that we are talking about the cable SYSTEM, not just cable. CDFI Background/Overview 24 24
25 Composition of US MV system Installed Capacity (%) PILC HMWPE XLPE EPR TRXLPE UNKNOWN CDFI Background/Overview 25 25
26 Failure Split Terminations 5.6% Unknown 1.1% Splices 37.1% Cable 56.2% CDFI Background/Overview 26 26
27 Overview In the CDFI, NEETRAC worked with 17 utilities, 5 manufacturers and 5 diagnostic providers to achieve the objective of clarifying the concerns and defining the benefits of diagnostic testing. Phase 1 has almost exclusively focused on aged medium voltage systems. This is the largest coherent study of cable system diagnostics anywhere. CDFI Background/Overview 27 27
28 Diagnostic Providers NEETRAC Members CDFI Dept of Energy Non NEETRAC Members Supporters CDFI Background/Overview 28 28
29 Participants American Electric Power Ameren Cablewise / Utilx CenterPoint Energy Con Edison Cooper Power Systems Duke Power Company Exelon (Commonwealth Edison & PECO) First Energy Florida Power & Light Georgia Tech GRESCO HDW Electronics High Voltage, Inc HV Diagnostics HV Technologies Hydro Quebec IMCORP NRECA PacifiCorp (added mid 2005) Pacific Gas & Electric (added Jan 06) PEPCO Oncor (TXU) Prysmian Public Service Electric & Gas Tyco / Raychem Southern California Edison Southern Company Southwire CDFI Background/Overview 29 29
30 CDFI - Primary Activities 1) Technology Review 2) Analysis of Existing (Historical) Data 3) Collection and Analysis of Field (New) Data 4) Verification of VLF Test Levels 5) Defect Characterization 6) Develop Knowledge Based System 7) Quantify Economic Benefits 8) Reports, Update Meetings and Tech Transfer Seminars Analyses are data / results driven CDFI Background/Overview 30 30
31 CDFI Activities CDFI Analysis Lab Studies Field Studies Dissemination CDFI Background/Overview 31 31
32 CDFI Activities CDFI Analysis Lab Studies Field Studies Dissemination Value / Benefit VLF Withstand Georgia Power Handbook Accuracies Tan δ Duke Publications Utility Data PD Meetings IEEE Std Work Industry Knowledge Based Systems CDFI CDFI Background/Overview 32 32
33 CDFI Activities Lab Studies VLF Withstand Tan δ PD Test Time Test Voltage Forensics Time Stability Voltage Stability Non-Uniform Degradation Neutral Corrosion Calibration Phase Pattern Feature Extraction Classification CDFI Background/Overview 33 33
34 CDFI Activities Field Studies Georgia Power XLPE Jkt & UnJkt 21 Conductor Miles Duke XLPE & Paper Jkt & UnJkt 29 Conductor Miles Offline PD (0.1Hz) Offline PD (60Hz) Tan δ Monitored Withstand Offline PD (0.1Hz) Tan δ Monitored Withstand Evans Macon Roswell Charlotte * 2 Cincinnati Clemson Morresville CDFI Background/Overview 34 34
35 CDFI Activities Analysis 89,000 Conductor Miles Value / Benefit Accuracies Utility Data IEEE Std Work Knowledge Based Systems Economic Model SAGE DC Withstand Offline PD Online PD Tan δ VLF Withstand 400 Omnibus VLF Survey Expert System Application CDFI Background/Overview 35 35
36 CDFI Activities Utility Data Con Ed Com Ed PPL Alabama Power Keyspan DC Withstand Online PD VLF Withstand Offline PD (60Hz) Online PD Tan Delta VLF Withstand Offline PD (0.1Hz) Tan Delta Online PD Offline PD (0.1Hz) Tan Delta CDFI Background/Overview 36 36
37 CDFI Activities Utility Data FPL PEPCO PG&E ONCOR Ameren Offline PD (60Hz) VLF Withstand Offline PD (60Hz) Offline PD (0.1Hz) Online PD VLF Withstand Offline PD (60Hz) Online PD Tan δ Offline PD (60Hz) Online PD Offline PD (60Hz) CDFI Background/Overview 37 37
38 Data Type Technique DC Withstand Dataset Sizes Laboratory [Conductor miles] - Field [Conductor miles] 78,105 Monitored Withstand PD Offline Diagnostic PD Online Tan δ VLF Withstand 1.5 9,810 IRC Service Performance ALL 89,000 CDFI Background/Overview 38 38
39 Benefits from Diagnostic Programs Decreasing failures associated with diagnostics and actions 1500 Log Cumulative Failures Program Initiated Time [Days] 3000 CDFI Background/Overview 39 39
40 At the Start For many utilities, the usefulness of diagnostic testing was unclear. The focus was on the technique, not the approach. The economic benefits were not well defined. There was almost no independently collated and analyzed data. There were no independent tools for evaluating diagnostic effectiveness. CDFI Background/Overview 40 40
41 Where we are today (1) 1. Diagnostics work they tell you many useful things, but not everything. 2. Diagnostics do not work in all situations. 3. Diagnostics have great difficulty definitively determining the longevity of individual devices. 4. Utilities HAVE to act on ALL replacement & repair recommendations to get improved reliability. 5. The performance of a diagnostic program depends on Where you use the diagnostic When you use the diagnostic What diagnostic you use What you do afterwards CDFI Background/Overview 41 41
42 Where we are today (2) 6. Quantitative analysis is complex BUT is needed to clearly see benefits. 7. Diagnostic data require skilled interpretation to establish how to act. 8. No one diagnostic is likely to provide the detailed data required for accurate diagnoses. 9. Large quantities of field data are needed to establish the accuracy/limitations of different diagnostic technologies. 10.Important to have correct expectations diagnostics are useful but not perfect! CDFI Background/Overview 42 42
43 Overview In the CDFI, NEETRAC worked with 17 utilities, 5 manufacturers and 5 diagnostic providers to achieve the objective of clarifying the concerns and defining the benefits of diagnostic testing. We have come a long way wrt the project objective. Analysis driven by data / results Developed a good understanding that diagnostic testing can be useful, but the technologies are not perfect. Developed ways to define diagnostic technology accuracy and found ways to handle inaccuracies. Developed diagnostic technology selection and economic analysis tools. Understand that there is yet more to learn. CDFI Background/Overview 43 43
44 QUESTIONS 44 44
45 Outline NEETRAC Overview CDFI Background/Overview Cable System Failure Process SAGE Concept Case Study: Roswell Diagnostic Accuracies Diagnostic Testing Technologies Accuracies Really Matter The Things We Know Now That We Did Not Know Before Selecting a Diagnostic Testing Technology Summary 45 45
46 How things fail and what fails have a big impact on the selection of diagnostics Cable System Failure Process 46 46
47 Failure Rates 100 Peak at 140 Failure Rate [#/100 Miles/Year] Max: 140 Mean: 12 Upper Quartile: 8 Median: 3.5 Lower Quartile: Cable System Failure Process 47 47
48 Failures by Equipment 100 Disbursement of Failures (%) Cable - all (%) Splice - all (%) Terminations - all (%) Unknown - all (%) Cable System Failure Process 48 48
49 Failure Rate Estimates By Equipment Failure Rate - Monte Carlo Estimate (#/100miles/yr) Cable Rate Splice Rate Term Rate Unk Rate Cable System Failure Process 49 49


50 Extruded Major Cable Components PILC Conductor Conductor Shield Insulation Insulation Shield Metallic Shield/Neutral Jacket (Recommended) Cable System Failure Process 50 50
 5. Protrusions at shield(s) 6,7 Splinter/Fiber 8.")
51 Defect Types in Extruded Cables 1. Cavity at shield(s) 2. Cavities due to shrinkage 3. Insulation shield defect 4. Contaminant (poor adhesion) 5. Protrusions at shield(s) 6,7 Splinter/Fiber 8. Contaminants in insulation or shields Cable System Failure Process 51 51

52 Conversion of Water to Electrical Trees Electrical tree growing from water tree Acts as a stress enhancement or protrusion (non-conducting) Water tree increases local electric field Water tree also creates local mechanical stresses If electrical and mechanical stresses high enough electrical tree initiates Electrical tree completes the failure path rapid growth Cable System Failure Process 52 52
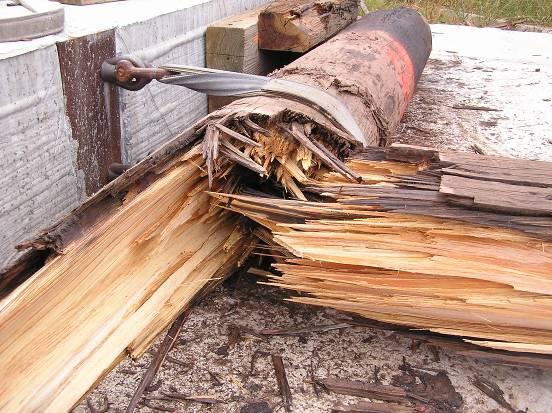
53 Defect Types in Extruded Cable Accessories Cable System Failure Process 53 53


54 Diagnostics used in Challenging Areas Cable System Failure Process 54 54
55 Summary Cable system aging is a complex phenomenon. Multiple factors cause systems to age. Increases in dielectric loss and partial discharge are key phenomenon. The aging process is nonlinear. Diagnostics must take these factors into consideration. Cable System Failure Process 55 55
56 QUESTIONS 56 56
57 Outline NEETRAC Overview CDFI Background/Overview Cable System Failure Process SAGE Concept Case Study: Roswell Diagnostic Accuracies Diagnostic Testing Technologies Accuracies Really Matter The Things We Know Now That We Did Not Know Before Selecting a Diagnostic Testing Technology Summary 57 57
58 SAGE Approach to Diagnostic Programs 58 58
59 Diagnostic Program Phases - SAGE Selection Data compilation and analysis needed to identify circuits that are at-risk for failure (at-risk population). Action Determine what actions can be taken on circuits based on the results of diagnostic testing. Generation Conduct diagnostic testing of the at-risk population. Evaluation Monitor at-risk population after testing to observe/improve performance of diagnostic program. SAGE Concept 59 59
60 Failures [#] SAGE at Work Selection Action Generation Evaluation Increasing Failures Decreasing Failures SAGE Concept Time 60 60
61 Failures [#] Continued Failure Increase Increasing Failures Decreasing Failures SAGE Concept Time 61 61
62 When to deploy diagnostics Cable System Performance Commissioning Operational Stress Condition Assessment Time (Years) SAGE Concept 62 62
63 Context is important Data Generation from Diagnostic Measurement Local Context Comparisons within one area Global Context Comparison with many tests Databases Standards SAGE Concept 63 63
64 QUESTIONS 64 64
65 Outline NEETRAC Overview CDFI Background/Overview Cable System Failure Process SAGE Concept Case Study: Roswell Diagnostic Accuracies Diagnostic Testing Technologies Accuracies Really Matter The Things We Know Now That We Did Not Know Before Selecting a Diagnostic Testing Technology Summary 65 65
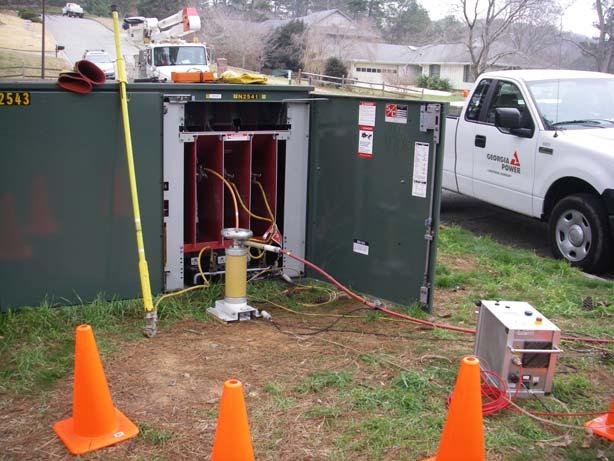
66 Case Study Roswell, GA November 2008 & January 2009 TDR Tan Delta Monitored Withstand Offline PD 66 66

67 Roswell Map Case Study: Roswell 67 67
68 SELECTION Case Study: Roswell 68 68
69 Roswell Background Info vintage XLPE feeder cable, 1000 kcmil, 260 mils wall, jacketed. Failures have occurred over the years no data on source Recently experienced very high failure rates of splices on this section: 80 failures / 100 miles / yr. Overall there have been failures of these splices in last two years on a variety of GPC feeders. Splice replacement may be acceptable if there is a technical basis. Case Study: Roswell 69 69
70 Knowledge Based Selection System Case Study: Roswell 70 70
71 KBS Demo Case Study: Roswell 71 71
72 72 Summary for Diagnostic Selection Replace Small Portion Replace Segment 72 Diagnostic Technique TDR & Historical Records ONLY PD Offline PD Online Tan Delta Monitored Withstand HV DC Leakage VLF 60 Mins VLF 30 Mins VLF 15 Mins DC Withstand Action Scenario Replace Accessories Have a shortlist of three techniques Case Study: Roswell
73 Economic Details prior to testing Complete System Replacement $1,000,000 approx Complete Splice Replacement $60,000 Test time (determined by switching) 3-4 Days Selection Costs $5,000 Splice Replacement 7 Days Retest after remediation 1 Day Monitored Withstand, Offline PD and VLF (30 mins) offer economic benefit over doing nothing. Case Study: Roswell 73 73
74 Scenario Assessment before Testing Offline PD If 51,000ft is tested 0.5% fails on test, no customer interrupted 1 site / 1,000ft (median) 40% discharges in cable Estimate 0 fails on test 51 discharge sites 20 cable, 31 accessories 15 splices <2 failure in 12 months from test Monitored Withstand If 51,000ft is tested <4% fails on test, no customer interrupted 70% of loss tests indicate no further action Estimate <2 fails on test 3 assessed for further consideration by loss 0.5 failure in 12 months from test Case Study: Roswell 74 74
75 ACTION Case Study: Roswell 75 75
76 Initial Corrective Action Options Replace splices only no detailed records assume 12 splices. Complete system replacement. Case Study: Roswell 76 76
77 GENERATION Case Study: Roswell 77 77


78 Overhead and Cabinet Terminations Case Study: Roswell 78 78
79 Tan δ Monitored Withstand Case Study: Roswell 79 79
80 If this had been a Simple Withstand No Failures On Test 18 Segments Tested Length Tested (miles) 8 10 Case Study: Roswell 80 80
81 Monitored Withstand - Stability 18 Segments Tested Pass - Stable Loss Pass - Un Stable Loss 30 min test 60 min test Sequence of Lengths Tested (miles) 8 10 Case Study: Roswell 81 81
82 Test Results - Local Perspective Tip Up in Tan Delta {1.5Uo - 0.5Uo} (1e-3) Numbers indicate Segment ID's Length Along Feeder (ft) Measurement Stability STABLE UNSTABLE Panel variable: Phase Case Study: Roswell 82 82
83 Test Results Global Perspective Tan Uo (1e-3) Stability STABLE UNSTABLE Splice Error Range of instability in monitored withstand Termination Damage Tip Up 1.5Uo Uo (1e-3) 1000 Case Study: Roswell 83 83
84 Targeted Offline PD (VLF) Case Study: Roswell 84 84
85 Targeted Offline PD Test Segment 6 Phase A - 1 TDR B - 2 C - 3 Open symbols represent the anomalous TDR reflections A - 1 PD (Approx Positions) B - 2 C Distance from Cubicle 2 (ft) Case Study: Roswell 85 85
86 PD Inception local perspective VLF Test Voltage (kv) A - 1 B - 2 C PD in 1 of 9 splices PD in 5 of 9 splices Probability of Splice Inception (%) PD in 1 of 7 splices 2400 Position of PD (ft) 3600 Position from Cubicle 2 (ft) Panel variable: Phase PD Inception (kv) 20 Case Study: Roswell 86 86
87 EVALUATION Case Study: Roswell 87 87
88 Evaluation after Testing Offline PD 15,000ft actually tested Estimate 15 discharge sites 6 cable, 9 accessories 6 splices <1 failure in 12 months from test Actual 7 discharge sites 0 cable, 7 accessories 25 splices 0 failure in 7 months since test Monitored Withstand 51,000ft actually tested Estimate 2 fails on test 3 assessed for further consideration by loss 0.5 failure in 12 months from test Actual 0 fails on test 6 assessed for further consideration by stability, tip up & loss 1 failure (cable) in 8 months since test Case Study: Roswell 88 88
89 After Testing Actions have been performed by GPC. Suspect splice investigated, actually broken neutral. Damaged termination replaced. Test excavations & Ground Penetrating Radar tests conducted, concluded that it was not practical to replace splices as planned System re-enforcements planned. All tested circuits have been left in service and are being monitored by GPC. Case Study: Roswell 89 89
90 QUESTIONS 90 90
91 Break 91 91
92 Outline NEETRAC Overview CDFI Background/Overview Cable System Failure Process SAGE Concept Case Study: Roswell Diagnostic Accuracies Diagnostic Testing Technologies Accuracies Really Matter The Things We Know Now That We Did Not Know Before Selecting a Diagnostic Testing Technology Summary 92 92
93 Diagnostic Accuracies 93 93
94 Performance of Diagnostics Performance evaluation primarily focuses on diagnostic accuracy. Diagnostic accuracies quantify the diagnostic s ability to correctly assess a circuit s condition. Accuracy must be assessed based on pilot type field test programs in which no actions are performed. Circuits must be tracked for a sufficient period of time. Diagnostic Accuracies 94 94
95 Diagnostic Measurements and Failures Symptoms are difficult to relate to future failures unless they are in the extremes. Good? Bad Probability No Failure Failure Diagnostic Measurement Diagnostic Accuracies 95 95
96 Objective of Diagnostic Tests The target population contains both Good and Bad components Good Will not fail within diagnostic time horizon Bad Will fail within diagnostic time horizon Bad Components Target Population Good Components Diagnostic Accuracies 96 96
97 Diagnostic Operation Applying the diagnostic will separate the population into: No Action Required group Action Required group But if the diagnostic is imperfect... No Action Required Action Required Diagnostic Accuracies 97 97
98 Complimentary Diagnoses Online PD 14.1% Offline PD 19.7% 33.8% 11.3% VLF TD 12.7% 52.1% 4.2% 69.0% Category No Action Action No Test 83.1% Ratio Action / No Action Online PD 79% Offline PD 36% VLF TD 25% 3 Service Failures since testing completed Diagnostic Accuracies 98 98
99 CDFI Accuracies CDFI diagnostic accuracies are based on service performance (failures) not diagnostic agreement. Agree Agreement Variable Agreement btw Online Offline * Online PD Agreement btw Online VLF TD * Online PD Agreement btw Offline VLF TD * Offline PD Disagree Dont_Act Action Act Diagnostic Accuracies 99 99
100 Perspective Diagnostics make measurements in the field and find Anomalies. Detecting the presence of an Anomaly is, in our view, not sufficient. The goal, in our view, is to detect an Anomaly which leads to reduced reliability (failure in service) or compromised performance (severed neutrals stray voltage). In accuracy estimates we have used failures in service and interpreted the diagnostics as Bad Means Failure. 100 Diagnostic Accuracies 100
101 Bad Means Failure Accuracies No Action Accuracy Action Accuracy Diagnostic Accuracy Dataset Diagnostic Accuracies
102 All Accuracies 100 Diagnostic Accuracy [%] Action Accuracy No Action Accuracy Overall Accuracy 102 Diagnostic Accuracies 102
103 QUESTIONS
104 Outline NEETRAC Overview CDFI Background/Overview Cable System Failure Process SAGE Concept Case Study: Roswell Diagnostic Accuracies Diagnostic Testing Technologies Accuracies Really Matter The Things We Know Now That We Did Not Know Before Selecting a Diagnostic Testing Technology Summary
105 Diagnostic Testing Technologies
106 Introduction A wide range of diagnostic techniques are commercially available. Tests are performed either offline (circuit de-energized)) or online (energized) and by service providers or utility crews. Different voltage sources may be used to perform the same measurement. DC 60 Hz. AC Very Low Frequency (VLF) AC Damped AC (DAC) Diagnostic Testing Technologies
107 Utility Use of Diagnostics Diagnostic Testing Technologies
108 Diagnostic Survey A survey of CDFI participants in 2006 was conducted to determine how diagnostics were employed. Survey was updated at the end of Survey results focused CDFI work on technologies currently used in the USA. Diagnostic Testing Technologies
109 Survey of Use of Diagnostics 27.8% 41.7% 30.6% No Testing Testing - one technique Testing - > one technique Diagnostic Testing Technologies
110 Survey of Use of Diagnostics More than one technique used No testing One technique used 4.0% Testing 25.0% No Testing 96.0% 75.0% No Testing Occasional use Regularly used Some testing Diagnostic Testing Technologies
111 Technologies Simple Dielectric Withstand Dielectric Loss (Tan δ & Dielectric Spectroscopy) Time Domain Reflectometry (TDR) Online Partial Discharge (PD) Offline Partial Discharge (PD) Isothermal Relaxation Current (IRC) Recovery Voltage (RV) Combined Diagnostics Diagnostic Testing Technologies
112 Context Data Generation from Diagnostic Measurement Local Context Comparisons within one area Global Context Comparison with many tests Databases Standards Diagnostic Testing Technologies
113 Diagnostic Context OK Not Proven either way NOT OK Extreme conditions are easy to decide what to do about. What to do about the ones in the middle? How to define the boundaries? Diagnostic Testing Technologies
114 Simple Dielectric Withstand
115 Simple Dielectric Withstand Test Description Application of voltage above normal operating voltage for a prescribed duration. Attempts to drive weakest location(s) within cable segment to failure while segment is not in service. Field Application Offline test that may use: DC 60 Hz. AC VLF AC Damped AC Testing may be performed by a service provider or utility crew. Simple Dielectric Withstand
116 Voltage EARLY Hold Entry Ramp Entry Withstand Test Process HOLD Voltages and Times for VLF covered in IEEE Std The goal is to have circuit out of service, test it such that imminent service failures are made to occur on the test and not in service t = 0 t Test Time Simple Dielectric Withstand
117 VLF Test Voltages Cosine-rectangular Sinusoidal Test Voltage (kv) Variable Use Peak Voltage (kv) Acceptance Peak Voltage (kv) Installation Peak Voltage (kv) Maintenance RMS Voltage (kv) Acceptance RMS Voltage (kv) Installation RMS Voltage (kv) Maintenance Cable Rating (kv) Simple Dielectric Withstand
118 Data Generation from Diagnostic Measurement Simple Dielectric Withstand
119 Test Sequences Withstand Test Outcomes Simple VLF Withstand to IEEE400.2 Levels Time of failure in mins for failures > 15 mins Cumulative Length Tested in One Year (Miles) 140 Simple Dielectric Withstand
120 Local Context Comparisons within one area Simple Dielectric Withstand
121 Separation with Simple VLF Outcomes 35 Failures on Test [% of Tested] Area 1 is clearly different 20 from the others Overall 1 2 Area 3 4 Simple Dielectric Withstand
122 Expect Failures Increase with Time Failures on Test [% of Tested] Expectation Time on Test [Minutes] Simple Dielectric Withstand
123 Early Phase Matters Early Hold Failures on Test [% of Tested] % of failures on test occurred during Early phase Time on Test [Minutes] Simple Dielectric Withstand
124 DC or VLF Failure son Test - FOT (% of Sections Tested) DC Length Adjusted Time on Test (Mins) 5 VLF 0.16% 10 Feeder Voltage Simple Dielectric Withstand
125 Early and Hold Phases Failure son Test - FOT (% of Sections Tested) START OF HOLD PHASE 0.11% 5 DC Length Adjusted START OF HOLD PHASE VLF 0.16% Difference 10 between 15 0 VLF and 5 DC is primarily Time result on Test of (Mins) Early phase 10 Feeder Voltage Simple Dielectric Withstand
126 Early Phase Ramp Entry Example Failures on Test [% of Total Tests] In this case, 60 % of the tests produced a failure before reaching the target test voltage Voltage [U0] 10.0 Simple Dielectric Withstand
127 Early and Hold Failure Mechanisms (VLF) 20 Failures on Test [% of Total Tested] Early Phase 0.5 Hold Phase Time on Test [Minutes] Simple Dielectric Withstand
128 Early Phase Hold Entry Failures on Test [% of Total Tested] 5 1 Early phase accounts for 30 % of failures on test Time on Test [Minutes] Simple Dielectric Withstand
129 Global Context Comparison with many tests Databases Standards Simple Dielectric Withstand
130 Withstand Testing Experience 100 Survivors [% of Total LengthsTested] Conductor Miles >2000 Conductor Miles 0.3 Conductor Miles IEEE Recommendation IEEE Range Time on Test [Minutes] Simple Dielectric Withstand
131 Test Performance for Different Utilities Failures on Test [% of 1000 ft Segments] Utility A1 A2 D I 1000ft Length Adj. 5.7% 5.0% 4.4% 0.5% Time on Test [Minutes] Simple Dielectric Withstand
132 Service Failures [% of Total Tested] Service Experience U U0 Test Conditions 2650 Conductor Miles Time to Failure 5% [Days] U U Days Time to Failure [Days since test] Time to Failure 10% [Days] 2247 Days % Simple Dielectric Withstand
133 Test Failures 1.8 Uo 30 mins 2.5 Uo 15 mins FOT 29.0% Pass 53.7% FOT 46.3% Pass 71.0% 3-Phase Segments
134 Performance After Test Pass/No Pass Not Length Adjusted 2.5 Uo 15 Minute 1.8 Uo 30 Minute 20 Initial Test Result Pass No Pass - Repaired 20 Initial Test Result Pass No Pass - Repaired Failures on Test [% of T otal T ested] Failures on Test [% of T otal T ested] T ime to Failure [Days] T ime to Failure [Days] Simple Dielectric Withstand
135 Difference between Passing and not Passing Test Duration [Min] Time to Failure for 1 % of Tested Segments [Days] Pass No Pass - Repaired Segments that fail on test and subsequently repaired perform better in service
136 What does this mean for Withstand? The technique is widely used by utilities Tested circuits display improved reliability Circuits normally Pass the tests Multiple / cascading failures are rare IEEE400.2 recommended times (30 mins) and voltages seem to give good service performance
137 What does this mean for Withstand? Modifications to IEEE400.2 recommendations need to be considered very carefully Voltage & test time cannot be determined independently Many test fails occur early in the test, useful information is revealed by tracking of these times / voltages of failure More failures on test does not mean fewer service fails
138 QUESTIONS
139 Day
140 Cable Diagnostic Focused Initiative Regional Meeting NEETRAC Hosted by Pacific Gas and Electric San Ramon, CA August 19-20,
141 At the Start For many utilities, the usefulness of diagnostic testing was unclear. The focus was on the technique, not the approach. The economic benefits were not well defined. There was almost no independently collated and analyzed data. There were no independent tools for evaluating diagnostic effectiveness. CDFI Background/Overview
142 Where we are today (1) 1. Diagnostics work they tell you many useful things, but not everything. 2. Diagnostics do not work in all situations. 3. Diagnostics have great difficulty definitively determining the longevity of individual devices. 4. Utilities HAVE to act on ALL replacement & repair recommendations to get improved reliability. 5. The performance of a diagnostic program depends on Where you use the diagnostic When you use the diagnostic What diagnostic you use What you do afterwards CDFI Background/Overview
143 Where we are today (2) 6. Quantitative analysis is complex BUT is needed to clearly see benefits. 7. Diagnostic data require skilled interpretation to establish how to act. 8. No one diagnostic is likely to provide the detailed data required for accurate diagnoses. 9. Large quantities of field data are needed to establish the accuracy/limitations of different diagnostic technologies. 10.Important to have correct expectations diagnostics are useful but not perfect! CDFI Background/Overview
144 Outline NEETRAC Overview CDFI Background/Overview Cable System Failure Process SAGE Concept Case Study: Roswell Diagnostic Accuracies Diagnostic Testing Technologies Accuracies Really Matter The Things We Know Now That We Did Not Know Before Selecting a Diagnostic Testing Technology Summary
145 Dielectric Loss (Tan δ)
146 Dielectric Loss (Tan δ) Test Description Measures total cable system loss (cable, elbows, splices & terminations). May be performed at one or more frequencies (dielectric spectroscopy). May be performed at multiple voltage levels. Monitoring may be conducted for long durations. Field Application Offline test that may use: 60 Hz. AC VLF AC Damped AC Testing may be performed by a service provider or utility crew. Step voltage up to pre determined level with post test analysis Tan δ
147 I V Dielectric Loss (Tan δ) The cable insulation system is represented by an equivalent circuit. In its simplest form the equivalent circuit consists of two parameters (IEEE Std. 400): Resistor Capacitor When voltage is applied to the cable, the total current is the sum of the capacitor current and resistor current. I R I C I I I R 1 C tan( δ ) = DF = = δ I ωrc C I R θ V Tan δ
148 Cable System Equivalent Cable system (cable, splices, and terminations) is reduced to simple circuit. Tan δ
149 Data Generation from Diagnostic Measurement Tan δ
150 Tan δ Ramp Test Data Voltage [p.u.] Tan-delta [1e-3] Tip Up Mean Scatter (represented by Standard Deviation - IQR could be used) Time [min] Tan δ
151 Local Context Comparisons within one area Tan δ
152 Tan δ Data for EPR Cable Systems Highest Concern Tan Delta (1e-3) Lowest Concern Voltage (kv) Tan δ
153 Segments within a Feeder Tip Up in Tan Delta {1.5Uo - 0.5Uo} (1e-3) Stable STABLE UNSTABLE Phase = Length Along Feeder (ft) Tan δ
154 Lengths within a Local Region 10 Tan Delta (1e-3) Length (ft) Tan δ
155 Global Context Comparison with many tests Databases Standards Tan δ
156 Testing at Reduced Voltages Regression 95% CI 95% PI Uo [1E-3] CI: Confidence Interval PI: Prediction Interval Uo [1E-3] Tan δ
157 - Tan δ Interpretation Based on 258 Conductor Miles Action Required 150 Tan Delta 6 Further Study No Action Tip Up Tan δ
158 Tan δ Correlation with VLF Withstand Basic Type? Filled Unfilled Tan D (1e-3) Fail Subsequent VLF Withstand Pass Subsequent VLF Withstand Length (ft) Tan δ
159 Tan δ Performance Curves Percent Action Action AR ACTION REQUIRED FS FURTHER STUDY NA NO ACTION FOT 1 10 Elasped Time between test and failure in service at May 09 (Month) Tan δ
160 What does this mean for Tan δ? Provides information on the whole cable system Most useful features are Time Stability Differential Tan δ (Tip Up) Higher loss correlates with increased probability of failure Comparisons provide very useful information Length effects Adjacent sections / phases Existing levels in IEEE Std. 400 are too conservative. Newer (higher) levels to be in IEEE Std revision
161 Time Domain Reflectometry
162 Time Domain Reflectometry (TDR) Test Description Measures changes in the cable impedance as a function of circuit length by observing the pattern of wave reflections. Used to identify locations of accessories, faults, etc. Field Application Offline test that uses a low voltage, high frequency pulse generator. Testing may be performed by a service provider or utility crew. TDR


163 TDR Principles Near End TDR Equipment L Joint Far End Joint TDR

164 Wet Joint Water ingress location as seen by the TDR Feeder had two splice failures just before the test. Water ingress was detected with the TDR. Failure on 01/17/2008 at detected water ingress location. Water ingress confirmed by tests and repair crew. TDR
165 TDR Field Measurements A-1 Anomalous TDR reflections (open circles) Phase B-2 C Distance from Cubicle 2 [ft] TDR
166 Lengths Tested PD Median 814 ft Tan D Median 485 ft Percent VLF Withstand Median 3500 ft Cable Length - log (ft) Panel variable: Technique Based on diagnostic data supplied to CDFI Measurements made with TDR TDR
167 What does this mean for TDR? All diagnostics rely on the neutral, TDR helps to establish its condition. Length and accessory information are very important in establishing the context of diagnostic findings. Unusual TDR traces can diagnose unusual features in their own right
168 Online Partial Discharge
169 Test Description Online Partial Discharge Measurement and interpretation of discharge and signals on cable segments and/or accessories. Signals captured over minutes / hours. Monitoring may be conducted for long durations. Field Application Online test that does not require external voltage supply. Testing typically performed by a service provider. Different implementations of the overall approach Assessment criteria are unique to each embodiment of the technology Online PD
170 Data Generation from Diagnostic Measurement Online PD
171 Discharge Occurrence No PD PD Online PD
172 Local Context Comparisons within one area Online PD
173 Distribution of PD along Lengths 5000 ft. portion of sample feeder Mixture of different PD levels for different sections and accessories. Cable Section Accessory No PD PD Online PD
174 Global Context Comparison with many tests Databases Standards Online PD
175 Where is PD found? Accessory 54.0% Cable 46.0% Online PD
176 Variability in PD Location Percentage of PD (%) Cable Accessory Online PD
177 Diagnostic Results (Overall) Accessory 226 Conductor Miles Cable % 4 2.9% 5 2.5% % % 4 1.8% 5 2.3% % % % Online PD
178 Level Based Reporting Systems Level-based (i.e. 1, 2, 3, Defer, Repair, Replace, Act, Don t Act etc.) reporting systems are increasingly common. Level systems, on their own, can have limited meaning for utilities. Levels clearly indicate a hierarchy 5 worse than 4 Replace worse than Defer No sense of the magnitude of the difference How much worse is Act than Don t Act in terms of service performance? Comparisons / interpretation of different level-based reporting systems is difficult. Need to associate meaning with the levels Level Based Reporting
179 Online PD Performance Curve Level % Percent % % Time to Failure (Years) Level Based Reporting
180 Alternate Interpretation Original Level Alternate Class (based on probability of failure) << 3 < Class 18 has 6 times poorer endurance than Class 3 Class 89 is 5 times poorer than Class 18 Level Based Reporting
181 Probabilistic Approach Online PD PD Class No PD PD 10 Percent Days Between Test & Failure 1000 Level Based Reporting
182 Variability in Diagnostic Results Accessory Cable Percent Level 1 Level 2 Level 3 Level 4 Level 5 Level 1 Level 2 Level 3 Level 4 Level 5 Online PD
183 How often is PD found? 0.35 PD Occurence (#/1000 ft) signals / 1000 ft 1 PD signal every 4000 ft Cable PD Accessory PD All PD Online PD
184 Estimated Failure Reduction 100 ACCESSORY 45 Actions for 14 Avoided Fails CABLE 52 Actions for 23 Avoided Fails Cummulative Failures [#] 10 Lev els 4/5 Replaced All Segments Left in Service Time since Start [Days] 1000 Online PD
185 What does this mean for Online PD? Highly degraded systems most easily differentiated Not necessarily easy to deploy sensor placement and manhole access can be challenging Signal analysis is labor intensive Data for level interpretation is available Trending is likely to be valuable, incorporating this in a level-based reporting system can be a challenge Baseline (when new) studies likely to be valuable Active failure mechanisms need to involve discharges Can localize to accessory and cable segments
186 Offline Partial Discharge
187 Test Description Offline Partial Discharge Measurement and interpretation of partial discharge signals above normal operating voltages. Signal reflections (combined with TDR information) allows location to be identified within cable segment. Field Application Offline test that may use: 60 Hz. AC service provider VLF AC utility crew Damped AC utility crew Step voltage up to pre determined level with post test analysis Offline PD
188 Data Generation from Diagnostic Measurement Offline PD

189 PD Pulse 140 mv 180 pc Offline PD

190 PD Phase Resolved Pattern 2.50E E E Amplitude [pc] -2.50E Phese [Deg] 360 Offline PD
191 PD Magnitude PD Level (pc) Max Limit for 1970's production Individual Measurement from the field Max allowed for current production PD Measurement Voltage (Uo) Offline PD
192 Local Context Comparisons within one area Offline PD
193 PD Charge Magnitude Distributions 20 XLPE 15 Percent Apparent Charge Magnitude [pc] Offline PD
194 PD Inception Voltage XLPE Percent Apparent Inception Voltage [U0] 2.4 Offline PD
195 Global Context Comparison with many tests Databases Standards Offline PD
196 Location of PD 60.6% of PD sites detected in accessories T ermination 26.3% 222 Conductor Miles Cable 39.4% Splice 34.3% Offline PD
197 Offline PD Test Sequence Testing sequence for 16,000 ft. No PD PD Offline PD
198 PD Location Terminations Percent 10 8 Cable & Splices Location [% of Circuit Length] Offline PD
199 PD Sites per Length 5 Median = 0.96 PD Sites/1000 ft Approx. 1 PD Site/1000 ft 4 PD Sites per 1000 feet Offline PD
200 Service Followup - Cable 20 Test Result NO PASS PASS 10 Percent Time Since Test [Days]
201 What does this mean for Offline PD? Highly degraded systems most easily differentiated Signal analysis can be labor intensive Data for level interpretation could be available Trending is likely to be very valuable Incorporating trending in a level-based reporting system can be a challenge Baseline (when new) studies likely to be very valuable Active failure mechanisms need to involve discharges Can localize to accessory and within short cable length within a segment
202 Isothermal Relaxation Current Recovery Voltage
203 Test Description Isothermal Relaxation Current Measures the time constant of trapped charges within the insulation material as they are discharged. Discharge current is observed for minutes. Field Application Offline test that uses DC to charge the cable segment up to 1kV. Testing is performed by a service provider. IRC
204 Test Description Recovery Voltage Similar to IRC only voltage is monitored instead of current Field Application Offline test that requires initial charging by DC source up to 2kV. Testing is performed by a service provider. Recovery Voltage
205 What does this mean for IRC & RV? Use limited to evaluation studies in the laboratory Possibly too sensitive for field use
206 Combined Diagnostics Multiple degradation mechanisms mean that two diagnostics are often better than one Combined Diagnostics
207 Survey of Use of Diagnostics 27.8% 41.7% 30.6% No Testing Testing - one technique Testing - > one technique Combined Diagnostics
208 Multiple Diagnostics 25.0% Category Tan Delta / PD VLF / Tan Delta 75.0% Combined Diagnostics
209 What Diagnostics are Combined DC Leakage Global Tan δ TDR DC Withstand PD Local VLF Withstand Combined Diagnostics
210 Drawbacks of a Single Approach Each diagnostic looks for symptoms of one failure mechanism Voids and water trees cannot generally be detected by a single technique Overlooks short term time evolution of diagnostic measurements Technique specific: Withstand No idea by how much segment passed Tan δ Cannot detect voids or electrical trees PD Cannot detect water trees (water filled voids) Combined Diagnostics
211 Advantage of Multiple Diagnostics Diagnostic 2 Bad BAD Good? GOOD Diagnostic 1 Good? Bad
212 Diagnostic Information High Information Content TD Ramp Current/PD/TD Monitored Withstand PD Ramp Voltage? Low Time Simple Some Skill Difficult Ease of Utility Implementation Combined Diagnostics
213 Diagnostic Information High TD Ramp w/td Monitored Withstand PD Ramp w/pd Monitored Withstand Information Content Current/PD/TD Monitored Withstand Voltage? Low Time Simple Some Skill Difficult Ease of Utility Implementation Combined Diagnostics
214 Diagnostic Information TD & PD Ramp TD & PD Monitored Withstand High TD Ramp w/td Monitored Withstand PD Ramp w/pd Monitored Withstand Information Content Current/PD/TD Monitored Withstand Voltage? Low Time Simple Some Skill Difficult Ease of Utility Implementation Combined Diagnostics
215 Data Generation from Diagnostic Measurement Combined Diagnostics
216 Tan δ Ramp Tan-delta [1e-3] Time [min] 4 Voltage [p.u.] Combined Diagnostics
217 Tan δ Monitored Withstand Tan-delta [1e-3] Stability of Tan-delta monitored through the 15 minute withstand Time [min] Combined Diagnostics
218 Tan δ Ramp & Monitored Withstand Voltage [p.u.] Elbow Failure Hampton Leas Segment HL_23_22 Failure Tan-delta [1e-3] Time [min] Combined Diagnostics
219 After Repair Voltage [p.u.] Elbow Failure Hampton Leas Segment HL_23_22 Failure Tan-delta [1e-3] After Failure Time [min] Combined Diagnostics
220 Global Context Comparison with many tests Databases Standards Combined Diagnostics
221 Tan δ Monitored Withstand Withstand Test Outcomes UNSTABLE High TU Poor Stability High Loss Monitored VLF Withstand to IEEE400.2 Levels Simple VLF Withstand to IEEE400.2 Levels Time of failure in mins Cumulative Length Tested in One Year (Miles) Combined Diagnostics
222 QUESTIONS
223 Outline NEETRAC Overview CDFI Background/Overview Cable System Failure Process SAGE Concept Case Study: Roswell Diagnostic Accuracies Diagnostic Testing Technologies Accuracies Really Matter The Things We Know Now That We Did Not Know Before Selecting a Diagnostic Testing Technology Summary
224 Accuracies Revisited Why do they matter?
225 Cost [$] Diagnostic Program Costs Consequence Corrective Actions Total Diagnostic Program Cost Diagnostic Selection Accuracies Really Matter
226 No Action Required Recall the Example... Action Required Avoided Corrective Actions Avoided service failures Accuracies Really Matter
227 Incorrect Diagnosis No Action Required Action Required Future service failures Unneeded Corrective Actions Accuracies Really Matter
228 Cost [$] Benefit and Loss BENEFIT Consequence Corrective Actions Diagnostic Selection Alternate Program 1 LOSS Alternate Program 2 Accuracies Really Matter
229 Considerations Diagnostic program economic calculations are based on ability to predict future failures. Total diagnostic program cost is more sensitive to certain elements than others. Failure Rate Diagnostic Accuracy Failure Consequence Accuracies Really Matter
230 Uncertainty in Diagnostic Program Costs Cost [$] Consequence Program Cost Range Corrective Actions Selection Diagnostic Accuracies Really Matter
231 Uncertainty in Diagnostic Program Costs Cost [$] LOSS Program Cost Range BENEFIT Alternate Program 1 Accuracies Really Matter
232 Diagnostic Accuracy Complications Time is a critical factor in the assessment of accuracy. Failures do not happen immediately after testing. Two approaches to computing diagnostic accuracy. Bad Means Failure Approach Probabilistic Approach Accuracies Really Matter
233 No Action Required Failures Over Time Year Action Required Accuracies Really Matter
234 Accuracy Over Time Bad Means Failure Accuracy [%] 100 No Action Required Accuracy Action Required Accuracy? System Changes Additional Aging Increased Load Time [Years] Accuracies Really Matter
235 Probabilistic Approach - Tan δ Percent Action Action AR ACTION REQUIRED FS FURTHER STUDY NA NO ACTION FOT 1 10 Elasped Time between test and failure in service at May 09 (Month) Accuracies Really Matter
236 QUESTIONS
237 Break
238 Outline NEETRAC Overview CDFI Background/Overview Cable System Failure Process SAGE Concept Case Study: Roswell Diagnostic Accuracies Diagnostic Testing Technologies Accuracies Really Matter The Things We Know Now That We Did Not Know Before Selecting a Diagnostic Testing Technology Summary
239 The Things We Know Now That We Did Not Know Before
240 By Diagnostic Technique VLF DC Tan Delta PD On PD Off TDR IRC DAC Category No Use Occasional Standard Testing CDFI Research
241 CDFI Work in Lab and Field Dielectric Withstand Simple VLF Laboratory Study Dielectric Loss VLF Tan δ Monitored Withstand Partial Discharge Offline 60 Hz. CDFI Research
242 CDFI Dielectric Withstand Dielectric Withstand
243 Dielectric Withstand Withstand techniques are most widely used diagnostic in the USA. Most utilities use VLF (either sine or cosine-rectangular) in their withstand programs. Test duration and voltage are critical to performance on test and in service. Explored the concept of Monitored Withstand tests. Dielectric Withstand
244 Length Distribution (Overall) 30 Median Length = 3500 ft Percent Wide variability in circuit lengths Circuit Length [Conductor ft] Dielectric Withstand
245 Length Adjustments Comparison of withstand failure on test rates must include length adjustments ft. Choose an appropriate base length Dielectric Withstand
246 Length Adjustments Comparison of withstand failure on test rates must include length adjustments ft. Failure 500 ft. 500 ft. 500 ft. 500 ft. Censored Dielectric Withstand
247 Length Adjustments Base length must be a meaningful length (50 ft is probably not a useful length). Two sets of censored segments: Pass Segments - All segments censored at test duration No Pass Segments 1 failed segment remaining segments censored at failure time Multiple failure modes must be dealt with appropriately. Dielectric Withstand
248 Utility I Hybrid System Length Adjustment 1000 Feet 500 Feet NONE 17.5% Failures on Test [%] 5 4.5% Performance at longer test times can be predicted. 0.1 Length Weighted Average FOT 30 Mins 2.7% 60 Mins 5.0% Time on Test [Minutes] % Dielectric Withstand
249 Effect of Test Voltage IEEE Rec. Level 100 Survivors [% of Tested] PILC Extruded Mixed (PILC and Extruded) NEETRAC Extruded Test Voltage (U0 = Rated Voltage) 3.5 Dielectric Withstand
250 VLF Lab Program Dielectric Withstand
251 Overview Test program combining aging at U 0 with multiple applications of high voltage VLF. Uses field aged cable samples - one area within one utility. Evaluate the effects of Voltage and time on the performance on test and Subsequent reliability during service voltages. Primary Metric Survival during aging and testing Secondary Metrics Before and after each VLF application, PD at U 0 Between Phase A & B IRC, PD (AC 2.2U 0, DAC), Tan δ Dielectric Withstand
252 1: No Withstand 2: VLF 2.2U0 15 Min Withstand Testing Periods (variable durations) 3: VLF 3.6U0 120 Min 4: VLF 2.5U0 60 Min 5: VLF 2.2U0 120 Min Failures are the primary metric Aging Periods for evaluation Phase A End 6: 60 Hz. 3.6U Min CDFI Meeting - Aug San Ramon, CA
253 1: No Withstand 2: VLF 2.2U0 15 Min 3: VLF 3.6U0 120 Min 4: VLF 2.5U0 60 Min 5: VLF 2.2U0 120 Min 6: 60 Hz. 3.6U Min CDFI Meeting - Aug San Ramon, CA T1 T2 T3 T
254 1: No Withstand No Failures 2: VLF 2.2U0 15 Min No Failures 3: VLF 3.6U0 120 Min 4: VLF 2.5U0 60 Min 5: VLF 2.2U0 120 Min 3 VLF Failures No Aging Failures 2 VLF Failures No Aging Failures No Failures 6: 60 Hz. 3.6U Min CDFI Meeting - Aug San Ramon, CA 2 60 Hz. Failures No Aging Failures T1 T2 T3 T
255 1: No Withstand No Failures 2: VLF 2.2U0 15 Min No Failures 3: VLF 3.6U0 120 Min 4: VLF 2.5U0 60 Min 5: VLF 2.2U0 120 Min 3 VLF Failures No Aging Failures 2 VLF Failures No Aging Failures No Failures 6: 60 Hz. 3.6U Min CDFI Meeting - Aug San Ramon, CA 2 60 Hz. Failures No Aging Failures T1 T2 T3 T
256 Failures on Test Uo Rated, Sine Uo, Ambient - Phase I & II Uo Rated, Sine Probability of Failure (%) Uo Rated, Cosine Uo, 45C - Phase III Uo Rated, Cosine Time of VLF Application (mins) Dielectric Withstand
257 Voltage Effect on Times to Failure Phase I & II - Uo / RT ageing, Sine Phase III - 2Uo / 45C ageing, Cosine Time to 10% Failure [mins] Both curves show that higher voltage leads to increased failure rate Test Voltage [Uo] Dielectric Withstand
258 Failure Analyses - Trees & Defects in Cables D DEFECT LARGE WATER TREE MEDIUM WATER TREE SMALL WATER TREE Failed Samples C B A Distance Along Cable (ft) Dielectric Withstand
259 VLF Test Program Summary Analysis of Phase A is complete. Phase B (2U 0 aging, 45 C Cosine Rectangular) underway. Phases A & B show that no VLF exposed samples have failed under 60 Hz U 0 & 2U 0. Phase B tests shows two samples without VLF exposure failed during 60 Hz 2U 0. VLF failures on test: Less than 15 mins: 12 % (2 failures) mins: 71 % (12 failures) Dielectric Withstand
260 CDFI Dielectric Loss Tan δ
261 Prevailing View Tan Delta Importance Tan δ Tip Up [2U0 1U0] Tan δ
262 Importance CDFI Suggestion Tan Delta Tan δ Time Stability Tip Up [1.5U 0 0.5U 0 ] Tan δ [U0] Tan δ
263 Tan δ Time Stability Breakdown Performance Rank Breakdown Frequency [Hz] Tan-delta 0.1 Hz (1.5 Uo) Diagnostic Rank 6 7 Tan δ
264 VLF Tan Delta of Cable Systems Percent Can segregated based on areas where the curves break Define areas that are normal and unusual Tan Delta at Uo (E-3) >650 segments Mean Length 2000ft Total length >250 conductor miles Ins Class Filled Paper PE Tan δ
265 Cable System Global Assessment - Unfilled Polyolefin Insulations Action Required Tan Delta (1e-3) Further Study No Action Tip Up (1e-3) 10 - Tan δ
266 Service Performance / Accuracy Percent Action ACTION REQUIRED FURTHER STUDY NO ACTION FOT 1 10 Elasped Time between test and failure in service at May 09 (Month) Tan δ
267 CDFI Partial Discharge PD
268 CDFI Work Analysis of historical PD field test data Classification Characterization of field samples by PD measurement in laboratory. Feature Extraction for Classification PD
269 PD Charge Magnitude Distributions 40 Variable Cable_Failed_PC Cable_NOFailed_PC 30 Percent Charge Magnitude [pc] PD
270 PD Inception Voltage Variable Cable_Failed_IV Cable_NOFailed_IV 20 Percent Inception Voltage [U0] PD
271 Multi Feature Classification Criterion 2 Bad BAD Good? GOOD Criterion 1 Good? Bad PD
272 Classification - PD Magnitude & PDIV Succes Rate [% of Tested] Variable fail_success nofail_success Overall_success pc and PDIV are not sufficient to get high classification accuracy Neighbors Used in Classification [#] PD
273 PD Lab Data - Cluster Variable Analysis Cluster No. Feature Name 1 Pos. Phase Range [deg] 2 Pos. Mean Phase [deg] Pos. Qmax [pc] Neg. Qmax [pc] Neg. Qmean [pc] Pos. Qmean [pc] 3 Pos. Mean Energy [pc*v] Pos. Max Energy [pc*v] Neg. Max Energy [pc*v] Neg. Mean Energy [pc*v] 4 Neg. Phase Range [deg] 5 Neg. Mean Phase [deg] 6 D Mean Energy Ratio 7 Nw [pulses/cycle] PD
274 PD Lab Data - Cluster Variable Analysis % Similarity Level a 3b Partial Discharge Diagnostic Features Similarity Level [%] Pos. Phase Range [deg] Pos. Mean Phase [deg] Pos. Qmax [pc] Neg. Qmax [pc] Neg. Qmean [pc] Pos. Qmean [pc] Pos. Mean Energy [pc*kv] Pos. Max Energy [pc*kv] Neg. Max Energy [pc*kv] Neg. Mean Energy [pc*kv] Neg. Phase Range [deg] Neg. Mean Phase [deg] D Mean Energy Ratio Nw [pulses/cycle] PD
275 QUESTIONS
276 Outline NEETRAC Overview CDFI Background/Overview Cable System Failure Process SAGE Concept Case Study: Roswell Diagnostic Accuracies Diagnostic Testing Technologies Accuracies Really Matter The Things We Know Now That We Did Not Know Before Selecting a Diagnostic Testing Technology Summary
277 Selecting a Diagnostic Technology Knowledge-Based System Selecting a Diagnostic Technology
278 KBS Selecting the right diagnostic is not easy. No one diagnostic covers everything. How you measure is influenced by what you do with the results. The KBS captures the experience and knowledge of people who have been operating in the field Selecting a Diagnostic Technology
279 Knowledge Based Systems Knowledge-Based Systems are computer systems that are programmed to imitate human problem-solving. Uses a combination of artificial intelligence and reference to a database of knowledge on a particular subject. KBS are generally classified into: Expert Systems Case Based Reasoning Fuzzy Logic Based Systems Neural Networks Selecting a Diagnostic Technology

280 Extruded Cable Diagnostics Selecting a Diagnostic Technology


281 KBS Example Selecting a Diagnostic Technology
GTRI/DOE Disclaimer. Cable Diagnostic Focused Initiative. Outline. CDFI Background. ICC Education Session. Nigel Hampton Rick Hartlein Joshua Perkel
 GTRI/DOE Disclaimer ICC Education Session Cable Diagnostic Focused Initiative Nigel Hampton Rick Hartlein Joshua Perkel Spring 9 Meeting The information contained herein is to our knowledge accurate and
GTRI/DOE Disclaimer. Cable Diagnostic Focused Initiative Regional Meeting NEETRAC. CDFI Contributors. Presenters
 GTRI/DOE Disclaimer Cable Diagnostic Focused Initiative Regional Meeting NEETRAC Hosted by Pacific Gas and Electric San Ramon, CA August 9-, 9 The information contained herein is to our knowledge accurate
Jean Carlos Hernández Mejía International Conference of Doble Clients Boston, MA, USA March 25 - March 30, GTRI/DoE Disclaimer
 Overview of the Cable Diagnostic Focused Initiative Project NEETRAC National Electric Energy Testing Research and Applications Center Jean Carlos Hernández Mejía 2012 International Conference of Doble
Cable Diagnostic Focused Initiative Regional Meeting NEETRAC
 Cable Diagnostic Focused Initiative Regional Meeting NEETRAC Hosted by Consolidated Edison Company of New York New York, NY October 28-29, 2009 1 1 GTRI/DOE Disclaimer The information contained herein
(other than Historical PD Tests) )
 )") Diagnostic Testing Techniques for Distribution and Transmission Cables (other than Historical PD Tests) ) Experience with available techniques ICC Education Session - May 2011 Nigel Hampton, Josh Perkel
Diagnostic Testing Techniques for Distribution and Transmission Cables (other than Historical PD Tests) ) Experience with available techniques ICC Education Session - May 2011 Nigel Hampton, Josh Perkel
Simultaneous Partial Discharge and Tan Delta Measurements: New Technology in Cable Diagnostics
 Simultaneous Partial Discharge and Tan Delta Measurements: New Technology in Cable Diagnostics Dominique Bolliger, Ph.D. HV TECHNOLOGIES, Inc. Manassas, VA, USA d.bolliger@hvtechnologies.com Abstract In
Assuring the Reliability of Critical Power Cable Systems
 Assuring the Reliability of Critical Power Cable Systems Presented by: Benjamin Lanz Manager of Application Engineering IMCORP Power Cable Reliability Consulting & Diagnostics Some of the technologies
Estimating the Impact of VLF Frequency on Effectiveness of VLF Withstand Diagnostics
 Estimating the Impact of VLF on Effectiveness of VLF Withstand Diagnostics Nigel Hampton (1), Jean Carlos Hernandez-Mejia (2), Marina Kuntsevich (3), Joshua Perkel (1), Vivek Tomer (3) 1 - NEETRAC, Atlanta,
Testing and PD Diagnosis of MV Cable Systems with DAC Voltage Educational Session May St Pete Beach, Fl
 Testing and PD Diagnosis of MV Cable Systems with DAC Voltage Educational Session May 26 2011 St Pete Beach, Fl HDW ELECTRONICS, INC. THE BEST IN CABLE FAULT LOCATING TECHNOLOGY by Henning Oetjen Frank
USING DAMPED AC VOLTAGES
 MODERN & TESTING DIAGNOSIS OF POWER CABLES USING DAMPED AC VOLTAGES BY EDWARD GULSKI AND ROGIER JONGEN, Onsite HV Solutions ag, Switzerland AND RALPH PATTERSON, Power Products & Solutions LLC, United States
CHAPTER 4. How to Start
 CHAPTER 4 How to Start Nigel Hampton This chapter represents the state of the art at the time of release. Readers are encouraged to consult the link below for the version of this chapter with the most
An Overview of Diagnostic Testing of Medium Voltage Power Cables John Densley
 An Overview of Diagnostic Testing of Medium Voltage Power Cables John Densley ArborLec Solutions Inc. CIGRE WG 21:04 in 1994 Purpose of diagnostic test is: To evaluate and locate degradation phenomena
A Study on the Effect of Performing VLF Withstand Tests on Field Aged Degraded Joints
 WETS D 15 2.4 Drapeau A Study on the Effect of Performing VLF Withstand Tests on Field Aged Degraded Joints Jean-François DRAPEAU Researcher Expertise Équipement électriques IREQ Jacques CÔTÉ, HQD Simon
PD Testing Considerations for MV Plant Cables
 PD Testing Considerations for MV Plant Cables Cable Testing Philosophy Damage Mistake Aging Repair Manufacturing Transportation Installation Operation Power frequency 50/60 Hz Power frequency 50/60 Hz
CHAPTER 14. Glossary
 CHAPTER 14 Glossary Nigel Hampton and Jean Carlos Hernandez-Mejia This chapter represents the state of the art at the time of release. Readers are encouraged to consult the link below for the version of
ABSTRACT KEYWORDS INTRODUCTION CLASSIC RELIABILITY ANALYSES
 Decision Making & Forecasting using the data available to Utilities Pitfalls, Challenges, and Case Studies of ways forward Detlef Wald (1), Joshua Perkel (2), Nigel Hampton (2) 1 Eifelkabel, Villmergen,
Cable diagnostic in MV underground cable networks
 Cable diagnostic in MV underground cable networks Theoretical background and practical application VLF testing tan delta loss factor measurement Partial discharge localization and measurement Author: Tobias
WIRE AND CABLE ENGINEERING GUIDE
 Excerpt From Prysmian s WIRE AND CABLE ENGINEERING GUIDE Page 1 of 8 CABLE TESTING Testing represents an integral part in the life of a cable. A cable will be subjected to multiple tests in its lifetime
Partial discharge diagnostics on very long and branched cable circuits
 11 Nordic Insulation Symposium Stockholm, June 11-13, 2001 Partial discharge diagnostics on very long and branched cable circuits Nico van Schaik, E. Fred Steennis, Wim Boone and Dick M. van Aartrijk KEMA
PARTIAL DISCHARGE LOCATION Selected Topics
 PARTIAL DISCHARGE LOCATION Selected Topics M.S. Mashikian IMCORP ICC Meeting - Fall 2000 TOPICS TESTING PHILOSOPHY Excitation Voltage Test Voltage Level METHOD OF REFLECTOMETRY METHOD OF ARRIVAL TIME TESTING
ONLINE OFFLINE B Y WIL L IAM H IG INBOT H AM,
 ONLINE OFFLINE VERSUS FEATURE PARTIAL DISCHARGE TESTING FOR CABLE ASSESSMENT B Y WIL L IAM H IG INBOT H AM, EA Technology, LLC Medium voltage cables have three distinct phases to their lifecycle: (1) new
OFFLINE PD DIAGNOSTICS USING SEVERAL EXCITATION VOLTAGES
 OFFLINE PD DIAGNOSTICS USING SEVERAL EXCITATION VOLTAGES Hein PUTTER Frank PETZOLD Philipp LEGLER Megger Germany Megger Germany Megger - Germany hein.putter@megger.com frank.petzold@megger.com philipp.legler@megger.com
Cable testing and diagnostics
 Cable testing and diagnostics To ensure the flow Cost-optimised maintenance through cable diagnostics The sheath and cable testing supports you in assessing whether a cable system is safe and ready to
On-line Partial Discharge Assessment and Monitoring of MV to EHV Cables
 On-line Partial Discharge Assessment and Monitoring of MV to EHV Cables William Higinbotham, Neil Davies and Victor Chan EA Technology LLC, New Jersey; USA, EA Technology Pty Ltd, Brisbane Australia; EA
High Voltage Diagnostics Sarl 4, Rue de Lac CH 1897 Le Bouveret Switzerland
 High Voltage Diagnostics Sarl 4, Rue de Lac CH 1897 Le Bouveret Switzerland Company HV Diagnostics Sarl is a Swiss based company in the field of high voltage test equipment for cable testing and diagnosis.
VLF. DAC tandelta. Partial Discharge. Experience the world of Megger electrical testing
 Cable Testing & Diagnostics Solutions for Medium Voltage Networks (1 kv - 36 kv) VLF Partial Discharge DC DAC tandelta Cable Testing Cable Diagnostics? There are two main applications for cable testing:
Is Fault Location Killing Our Cable Systems?
 Is Fault Location Killing Our Cable Systems? Benjamin Lanz, Member, IEEE; Eugene Sanchez, Member, IEEE Abstract Power outages caused by faults in underground cable systems can be difficult to locate, however
BEST PRACTICES FOR OFFLINE DIAGNOSIS OF MV CABLES
 BEST PRACTICES FOR OFFLINE DIAGNOSIS OF MV CABLES HEIN PUTTER Productmanager cable testing and -diagnosis Megger Site Germany 1 13 th Insucon conference 16-18 th Mai 2017, Birmingham, UK Agenda Introduction
MV Power Cable Testing Training
 MV Power Cable Testing Training Contact us Today for a FREE quotation to deliver this course at your company?s location. https://www.electricityforum.com/onsite-training-rfq Since power cables are used
Name: Craig Goodwin. Company Name: HV Diagnostics Inc
 Name: Craig Goodwin Company Name: HV Diagnostics Inc Trip Out of Cable Circuit: Over Current, Ground Fault, Differential protection or Fuse blows. Try to establish if the cable has in fact failed or has
Dielectric Response Measurements Using DC Voltage
 Dielectric Response Measurements Using DC Voltage Jean-François DRAPEAU Researcher Expertise Équipement électriques IREQ ICC Spring 2011 - St Pete Education Session 2011-05-25 OUTLINE Introduction DC charging
UHF PD-DIAGNOSIS AT HIGH VOLTAGE CABLE TERMINATIONS INTERNATIONAL CASE STUDIES
 UHF PD-DIAGNOSIS AT HIGH VOLTAGE CABLE TERMINATIONS INTERNATIONAL CASE STUDIES D. Götz*, H.T. Putter* *Megger Germany INTRODUCTION High voltage termintions are essential components in high voltage cable
INVESTIGATION ON THE TECHNOLOGIES FOR DEFECT LOCALIZATION AND CHARACTERIZATION ON MEDIUM VOLTAGE UNDERGROUND LINES
 INVESTIGATION ON THE TECHNOLOGIES FOR DEFECT LOCALIZATION AND CHARACTERIZATION ON MEDIUM VOLTAGE UNDERGROUND LINES Gonzalo MAIZ, Iberdrola Distribución, (Spain), gmaiz@iberdrola.es Armando RODRIGO, Instituto
THE PROPAGATION OF PARTIAL DISCHARGE PULSES IN A HIGH VOLTAGE CABLE
 THE PROPAGATION OF PARTIAL DISCHARGE PULSES IN A HIGH VOLTAGE CABLE Z.Liu, B.T.Phung, T.R.Blackburn and R.E.James School of Electrical Engineering and Telecommuniications University of New South Wales
Aspects of PD interpretation in HV power cables. by Edward Gulski, Piotr Cichecki, Rogier Jongen
 Aspects of PD interpretation in HV power cables by Edward Gulski, Piotr Cichecki, Rogier Jongen General There are several aspects having influence on the diagnostic information and the condition judgment
BY JASON SOUCHAK, Megger
 IMPROVING SYSTEM RELIABILITY WITH OFFLINE PD TESTING BY JASON SOUCHAK, Megger Partial discharge (PD) testing is a new generation of diagnostic testing for medium- and high-voltage underground power cable
PHG 70 TD PD / PHG 80 TD PD
 PHG 70 TD PD / PHG 80 TD PD BAUR VLF test and diagnostics system Functions Universal test and diagnostics system flexible, modular, extendable Cutting-edge testing and diagnostics technology: VLF truesinus
Why partial discharge testing makes good sense
 Why partial discharge testing makes good sense PD measurement and analysis have proven to be reliable for detecting defects in the insulation system of electrical assets before major damage or a breakdown
Investigations on a Combined Resonance/VLF HV Test System Partial Discharge (PD) characteristics at VLF and DAC voltages
 characteristics at VLF and DAC voltages") Investigations on a Combined Resonance/VLF HV Test System Partial Discharge (PD) characteristics at VLF and DAC voltages F. Petzold, H.T. Putter, D. Götz, H. Schlapp, S. Markalous SebaKMT GmbH Baunach/Radeburg,
Investigations on a Combined Resonance/VLF HV Test System Partial Discharge (PD) characteristics at VLF and DAC voltages F. Petzold, H.T. Putter, D. Götz, H. Schlapp, S. Markalous SebaKMT GmbH Baunach/Radeburg,
Specialists in HV and MV test and diagnostics. Testing in Substations
 Specialists in HV and MV test and diagnostics Testing in Substations Testing in Substations Testing in Substations At 4fores we specialize in the diagnosis and measurement of all types of existing technologies
ABSTRACT. VLF TAN δ MEASUREMENTS KEYWORDS INTRODUCTION. repeated tests programs.
 Repeated Field Tests Utility Case Studies of the Value of Trending J. Perkel (), Y. Del Valle (), J.C. Hernández (2), and R. N. Hampton (), - NEETRAC, Atlanta, GA, USA, josh.perkel@neetrac.gatech.edu,
OPTIMIZATION OF ON-SITE PD MEASUREMENTS AND EVALUATION OF DIAGNOSTIC PARAMETERS FOR ASSESSING CONDITION OF DISTRIBUTION CABLE SYSTEM ELPIS J SINAMBELA
 1 OPTIMIZATION OF ON-SITE PD MEASUREMENTS AND EVALUATION OF DIAGNOSTIC PARAMETERS FOR ASSESSING CONDITION OF DISTRIBUTION CABLE SYSTEM A thesis submitted to the Faculty of Electrical Power Engineering
EI HIGH VOLTAGE INSULATION TESTING POLICY
 Network(s): Summary: ENGINEERING INSTRUCTION EI 09-0001 HIGH VOLTAGE INSULATION TESTING POLICY EPN, LPN, SPN This engineering instruction details the policy for the on-site insulation testing of new and
IDAX 300 Insulation Diagnostic Analyzer. Dielectric Frequency Response Also known as: Frequency Domain Spectroscopy
 IDAX 300 Insulation Diagnostic Analyzer Dielectric Frequency Response Also known as: Frequency Domain Spectroscopy 1 Frequency Domain Spectroscopy Hi V A Lo Ground C HL Measure at several frequencies Use
Field Detected Cable Manufacturing Defects:
 Field Detected Cable Manufacturing Defects: What do you do when it s the cable that s faulty? Steven Thomas, P.E. Sr. Electrical Engineer - HV Systems May 7, 2018 IMCORP Technology Users Group Meeting
ON-LINE PARTIAL DISCHARGE TESTING OF SOME OF THE WORST PERFORMING CIRCUITS ON A UTILITY DISTRIBUTION SYSTEM
 ON-LINE PARTIAL DISCHARGE TESTING OF SOME OF THE WORST PERFORMING CIRCUITS ON A UTILITY DISTRIBUTION SYSTEM D. Clark¹ R. Mackinlay² M. Seltzer-Grant² S. Goodfellow² Lee Renforth² Jamie McWilliam³ and Roger
Field Measurement of Transmission Cable Dissipation Factor
 Workshop 2000, Alexandria, Virginia, 13 & 14 September 2000 paper No.: 1 Field Measurement of Transmission Cable Dissipation Factor John H. Cooper, Power Delivery Consultants, Inc. Abstract This presentation
7. INSPECTION AND TEST PROCEDURES
 7.1 Switchgear and Switchboard Assemblies A. Visual and Mechanical Inspection 1. Compare equipment nameplate data with drawings and specifications. 2. Inspect physical and mechanical condition. 3. Inspect
TRAINING OVERVIEW EDUCATION IS POWER. HIGH V O L T A G E T E S T S OLUTION S. reliable. precision.
 TRAINING OVERVIEW EDUCATION IS POWER www.hipotronics.com/training reliable. precision. HIGH V O L T A G E T E S T S OLUTION S 2 EDUCATION IS POWER EDUCATION IS POWER LEARN WHAT WE HAVE TO OFFER Through
Basics of Partial Discharge. Prepared for 2015 Phenix RSM Meeting January 2015
 Basics of Partial Discharge Prepared for 2015 Phenix RSM Meeting January 2015 Definitions and History Standard Definitions Fundamentally, what is a Partial Discharge An electric discharge which only partially
The importance of partial discharge testing throughout the development and operation of power transformers
 The importance of partial discharge testing throughout the development and operation of power transformers Ulrike Broniecki OMICRON Energy Solutions GmbH, Berlin Power transformers are exposed to intense
The University of New South Wales. School of Electrical Engineering and Telecommunications. High Voltage Systems ELEC9712. Appendix Partial Discharge
 The University of New South Wales School of Electrical Engineering and Telecommunications High Voltage Systems ELEC9712 Appendix Partial Discharge Content Introduction Quantities measured Test circuits
ECP HV INSULATION TESTING
 Document Number: ECP 11-0006 Network(s): Summary: All ENGINEERING COMMISSIONING PROCEDURE ECP 11-0006 HV INSULATION TESTING This standard details the policy for the on-site insulation testing of new and
MV Power Cable Diagnostics by Frequency Domain Spectroscopy. Peter Werelius Programma Electric AB
 MV Power Cable Diagnostics by Frequency Domain Spectroscopy Peter Werelius Programma Electric AB Frequency Domain Spectroscopy Measurements of insulation capacitance and losses in a frequency interval
CONDITION MONITORING OF MEDIUM VOLTAGE ELECTRICAL CABLES BY MEANS OF PARTIAL DISCHARGE MEASUREMENTS
 136 CONDITION MONITORING OF MEDIUM VOLTAGE ELECTRICAL CABLES BY MEANS OF PARTIAL DISCHARGE MEASUREMENTS H. van Jaarsveldt* and R. Gouws** School of Electrical, Electronic and Computer Engineering, North-West
INSULATION DIAGNOSIS OF HIGH VOLTAGE POWER CABLES
 INSULATION DIAGNOSIS OF HIGH VOLTAGE POWER CABLES Edward GULSKI, Delft University of Technology, (The Netherlands), e.gulski@tudelft.nl Johan J SMIT, Delft University of Technology, (The Netherlands),
Cable fault location in power cables. Systematics for cable testing, diagnosis and cable fault location
 Cable fault location in power cables Systematics for cable testing, diagnosis and cable fault location CABLE JOINTS, CABLE TERMINATIONS, CABLE GLANDS, CABLE CLEATS FEEDER PILLARS, FUSE LINKS, ARC FLASH,
IN USE: CABLE AGING MANAGEMENT
 IN USE: CABLE AGING MANAGEMENT ISSUE STATEMENT Concerns exist that cable aging-related failures may impact nuclear plant safety and reliability. As a result, plant owners and regulators are requiring the
Partial Discharge, Survey or Monitor?
 July 2014 Partial Discharge, Survey or Monitor? 24-7 Partial Discharge monitoring is the ultimate tool for finding insulation weaknesses before they fail. Introduction It s well established that Partial
Test systems made by SebaKMT. Don t stress over tests! SebaKMT has the right answers: reliability, speed, economy.
 Test systems made by SebaKMT Don t stress over tests! SebaKMT has the right answers: reliability, speed, economy. Know how to do it. And what happens next. Test first and save later Connected to the future
Partial Discharge Theory, Modeling and Applications To Electrical Machines
 Partial Discharge Theory, Modeling and Applications To Electrical Machines V. Vahidinasab, A. Mosallanejad, A. Gholami Department of Electrical Engineering Iran University of Science and Technology (IUST)
H V T E S T S O L U T I O N S PA RT N E RS F O R H V & E M C
 H V T E S T S O L U T I O N S PA RT N E RS F O R H V & E M C S O L U T I O N S Y O U R S O U R C E F O R T O P Q U A L I T Y T E S T E Q U I P M E N T w w w. h v t e c h n o l o g i e s. c o m Company
Extended analysis versus frequency of partial discharges phenomena, in support of quality assessment of insulating systems
 Extended analysis versus frequency of partial discharges phenomena, in support of quality assessment of insulating systems Romeo C. Ciobanu, Cristina Schreiner, Ramona Burlacu, Cristina Bratescu Technical
POWER CORPORATION. Power Quality. Specifications and Guidelines for Customers. Phone: Fax:
 POWER CORPORATION Power Quality Specifications and Guidelines for Customers Phone: 403-514-3700 Fax: 403-514-3719 1 GENERAL OVERVIEW........................................ 1.1 WHAT DOES THIS SPECIFICATION
Innovative Test Techniques and Diagnostic Measurements to Improve the Performance and Reliability of Power System Transformers
 Innovative Test Techniques and Diagnostic Measurements to Improve the Performance and Reliability of Power System Transformers Dr. Michael Krüger, Alexander Kraetge, OMICRON electronics GmbH, Austria Alexander
CHAPTER 5 CONCEPT OF PD SIGNAL AND PRPD PATTERN
 75 CHAPTER 5 CONCEPT OF PD SIGNAL AND PRPD PATTERN 5.1 INTRODUCTION Partial Discharge (PD) detection is an important tool for monitoring insulation conditions in high voltage (HV) devices in power systems.
Electrical Equipment Condition Assessment
 Feature Electrical Equipment Condition Assessment Using On-Line Solid Insulation Sampling Importance of Electrical Insulation Electrical insulation plays a vital role in the design and operation of all
Cable test vans and systems
 Cable test vans and systems Prepared for anything BAUR s cable fault location and diagnostics systems Would you like to test and assess new installations and existing cable locations efficiently? To rectify
ECP HV INSULATION TESTING
 Document Number: ECP 11-0006 Network(s): Summary: ENGINEERING COMMISSIONING PROCEDURE EPN, LPN, SPN ECP 11-0006 HV INSULATION TESTING This standard details the policy for the on-site insulation testing
Cable test vans and systems
 Cable test vans and systems Prepared for anything BAUR s cable fault location and diagnostics systems Would you like to test and assess new installations and existing cable locations efficiently? To rectify
Long lengths transmission power cables on-site testing up to 500 kv by damped AC voltages
 Long lengths transmission power cables on-site testing up to 500 kv by damped AC voltages Paul P. SEITZ, Ben QUAK, Seitz Instruments AG, Niederrohrdorf, Switzerland, pps@seitz-instruments.ch Edward GULSKI,
Understanding the Value of Electrical Testing for Power Transformers. Charles Sweetser, OMICRON electronics Corp. USA
 Understanding the Value of Electrical Testing for Power Transformers Charles Sweetser, OMICRON electronics Corp. USA Understanding the Value of Electrical Testing for Power Transformers Charles Sweetser,
Aboveground Monitoring - Casings Long Range Electromagnetic Wave (EMW) Inspection
 Inspection") Aboveground Monitoring - Casings Long Range Electromagnetic Wave (EMW) Inspection Period 7 Pipeline Coatings Course 2017 February 21-23, 2017 John DeWees, CEO WaveTrue 2017 1 Electromagnetic Wave Inspection
Aboveground Monitoring - Casings Long Range Electromagnetic Wave (EMW) Inspection Period 7 Pipeline Coatings Course 2017 February 21-23, 2017 John DeWees, CEO WaveTrue 2017 1 Electromagnetic Wave Inspection
Condition Assessment of High Voltage Insulation in Power System Equipment. R.E. James and Q. Su. The Institution of Engineering and Technology
 Condition Assessment of High Voltage Insulation in Power System Equipment R.E. James and Q. Su The Institution of Engineering and Technology Contents Preface xi 1 Introduction 1 1.1 Interconnection of
A New Approach for Transformer Bushing Monitoring. Emilio Morales Technical Application Specialist Qualitrol
 A New Approach for Transformer Bushing Monitoring Emilio Morales Technical Application Specialist Qualitrol Abstract Transformer bushings are one of the most critical components of a transformer. Up to
ABSTRACT INTRODUCTION DIAGNOSTIC TESTS. MAIN CHARACTERISTICS AND CONDITIONS OF 9 kv NETWORK
 LABORATORY AND ON SITE TESTS FOR THE DETERMINATION OF THE AGEING CONDITION OF MV PILC CABLES Nikola Kuljaca; Sergio Meregalli; Giuseppe Rizzi CESI RICERCA Italy sergio.meregalli@cesiricerca.it ABSTRACT
Diagnostic testing of cast resin transformers
 Paper of the Month Diagnostic testing of cast resin transformers Author Michael Krüger, OMICRON, Austria michael.krueger@omiconenergy.com Christoph Engelen, OMICRON, Austria christoph.engelen@omicronenergy.com
NETWORK INNOVATION COMPETITION ANGLE-DC PROJECT HOLISTIC CIRCUIT CONDITION MONITORING SYSTEM REPORT
 NETWORK INNOVATION COMPETITION PROJECT HOLISTIC CIRCUIT CONDITION MONITORING SYSTEM REPORT NOVEMBER 17 Version: 1.0 Authored by: Andrew Moon Engineering Consultant and Project Manager Kevin Smith Lead
Testing of 400 kv GIS
 Testing of 400 kv GIS Robert le Roux, Dermot Dorgan, Brian Perry ESB International - Ireland Paper 028 1 Introduction The 400 kv transmission is designed for critical periods of low loading. Due to critical
Partial Discharge Patterns in High Voltage Insulation
 22 IEEE International Conference on Power and Energy (PECon), 2-5 December 22, Kota Kinabalu Sabah, Malaysia Partial Discharge Patterns in High Voltage Insulation Hazlee Illias, Teo Soon Yuan, Ab Halim
SMART CABLE GUARD A TOOL FOR ON-LINE MONITORING AND LOCATION OF PD S AND FAULTS IN MV CABLES ITS APPLICATION AND BUSINESS CASE
 SMART CABLE GUARD A TOOL FOR ON-LINE MONITORING AND LOCATION OF PD S AND FAULTS IN MV CABLES ITS APPLICATION AND BUSINESS CASE Fred STEENNIS Paul WAGENAARS Denny HARMSEN DNV GL the Netherlands DNV GL the
Software System for Finding the Incipient Faults in Power Transformers
 Software System for Finding the Incipient Faults in Power Transformers Nikolina Petkova Technical University of Sofia, Department of Theoretical Electrical Engineering, 1156 Sofia, Bulgaria Abstract In
portable affordable CDS Series Cable Fault Locators Thumpers - Surge Generators
 portable CDS Series Cable Fault Locators Thumpers - Surge Generators HVI offers the most complete fault locator packages available for primary cable. HVI offers the only VLF Thumper combination ideal for
3MElectrical Markets Division
 3MElectrical Markets Division Contents Summary 3 Purpose... 3 Test Specimen 3 Test Deviations... 4 Test Results 5 Impulse Test Oscillograms... 10 Specimen Photographs.. 11 Equipment Documentation: Impulse
RESIDUAL LIFE ASSESSMENT OF GENERATOR TRANSFORMERS IN OLD HYDRO POWER PLANTS
 RESIDUAL LIFE ASSESSMENT OF GENERATOR TRANSFORMERS IN OLD HYDRO POWER PLANTS Authored by: Sanjay Srivastava, Chief Engineer (HE&RM), Rakesh Kumar, Director (HE&RM), R.K. Jayaswal, Dy. Director (HE&RM)
AMR Current Sensors for Evaluating the Integrity of Concentric Neutrals in In-Service Underground Power Distribution Cables
 AMR Current Sensors for Evaluating the Integrity of Concentric Neutrals in In-Service Underground Power Distribution Cables Michael Seidel Dept. of Mechanical Engineering mjseidel@berkeley.edu Kanna Krishnan
NX1117C; NX1117CE series
 SOT223 Rev. 2 11 December 2012 Product data sheet 1. General description The NX1117C/NX1117CE are two series of low-dropout positive voltage regulators with an output current capability of 1 A. The two
Application of Polarisation Depolarisation Current (PDC) technique on fault and trouble analysis of stator insulation
 technique on fault and trouble analysis of stator insulation") CIGRE SC A1 & D1 JOINT COLLOQUIUM October 24, 2007 Application of Polarisation Depolarisation Current (PDC) technique on fault and trouble analysis of stator insulation S. A. BHUMIWAT Independent Consultant
CIGRE SC A1 & D1 JOINT COLLOQUIUM October 24, 2007 Application of Polarisation Depolarisation Current (PDC) technique on fault and trouble analysis of stator insulation S. A. BHUMIWAT Independent Consultant
L. B. Gordon Space Power Institute 231 Leach Center Auburn University, Alabama 36849
 FAILURE MODES OF LAMINATE STRUCTURES L. B. Gordon Space Power Institute 231 Leach Center Auburn University, Alabama 36849 Abstract Laminate structures composed of alternating thin layers of conductor and
ANSE VISUAL, developed within the
 ANSE VISUAL Software to Analyze Substation Robustness ANSE VISUAL, developed within the Institutional Project 1724, is a tool to analyze the robustness of electrical substations. The software carries out
Statistical Characteristics of Partial Discharge Caused by Typical Defects in Cable Joint under Oscillating Voltage
 Journal of Energy and Power Engineering 9 () 3-3 doi:.7/93-897/.3. D DAVID PUBLISHIG Statistical Characteristics of Partial Discharge Caused by Typical Defects in Cable Joint under Oscillating Voltage
POWER QUALITY SPECIFICATIONS AND GUIDELINES FOR CUSTOMERS ENGINEERING STANDARDS CITY OF LETHBRIDGE ELECTRIC
 CITY OF LETHBRIDGE ELECTRIC ENGINEERING STANDARDS POWER QUALITY SPECIFICATIONS AND GUIDELINES FOR CUSTOMERS The City of Lethbridge acknowledges the use of other utility industry and industry committee
CONDITION ASSESSMENT OF XLPE MV CABLE JOINTS BY USING AN INSULATION TESTER
 CONDITION ASSESSMENT OF XLPE MV CABLE JOINTS BY USING AN INSULATION TESTER Henrik ENOKSEN Espen EBERG Sverre HVIDSTEN SINTEF Energy Research - Norway SINTEF Energy Research - Norway SINTEF Energy Research
CONTINUOUS ON-LINE MONITORING OF PARTIAL DICHARGES IN HV DISTRIBUTION CABLES
 CONTINUOUS ON-LINE MONITORING OF PARTIAL DICHARGES IN HV DISTRIBUTION CABLES Hao ZHANG, Transgrid, (Australia), hao.zhang@transgrid.com.au Zhao LIU, University of NSW, (Australia), z.liu@unsw.edu.au Toan
Matz Ohlen Director Transformer Test Systems. Megger Sweden
 Matz Ohlen Director Transformer Test Systems Megger Sweden Frequency response analysis of power transformers Measuring and analyzing data as function of frequency, variable frequency diagnostics Impedance
Investigation of PD Detection on XLPE Cables
 Investigation of PD Detection on XLPE Cables Hio Nam O, T.R. Blackburn and B.T. Phung School of Electrical Engineering and Telecommunications The University New South Wales, Australia Abstract- The insulation
1. Introduction to Power Quality
 1.1. Define the term Quality A Standard IEEE1100 defines power quality (PQ) as the concept of powering and grounding sensitive electronic equipment in a manner suitable for the equipment. A simpler and
PERMANENT ON-LINE MONITORING OF MV POWER CABLES BASED ON PARTIAL DISCHARGE DETECTION AND LOCALISATION AN UPDATE
 PERMANENT ON-LINE MONITORING OF MV POWER CABLES BASED ON PARTIAL DISCHARGE DETECTION AND LOCALISATION AN UPDATE Fred STEENNIS, KEMA, (the Netherlands), fred.steennis@kema.com Peter VAN DER WIELEN, KEMA,
Practical aspects of PD localization for long length Power Cables
 Practical aspects of PD localization for long length Power Cables M. Wild, S. Tenbohlen University of Stuttgart Stuttgart, Germany manuel.wild@ieh.uni-stuttgart.de E. Gulski, R. Jongen onsite hv technology
Africa Utility Week Focus Day Substation Condition Monitoring Benefits of Ultrasound
 Africa Utility Week Focus Day 2014 Substation Condition Monitoring Benefits of Ultrasound Agenda Review - Substation Condition Monitoring Electrical discharge Types and origin In switchgear Results/consequences