Modal Analysis and Vibration Test of NASA MSFC Shaker Table
|
|
|
- Hubert Sharp
- 5 years ago
- Views:
Transcription
1 Washington University in St. Louis Washington University Open Scholarship Mechanical Engineering and Materials Science Independent Study Mechanical Engineering & Materials Science Modal Analysis and Vibration Test of NASA MSC Shaker Table Brian Mincks Washington University in St. Louis David Peters Washington University in St. Louis ollow this and additional works at: Recommended Citation Mincks, Brian and Peters, David, "Modal Analysis and Vibration Test of NASA MSC Shaker Table" (2018). Mechanical Engineering and Materials Science Independent Study This inal Report is brought to you for free and open access by the Mechanical Engineering & Materials Science at Washington University Open Scholarship. It has been accepted for inclusion in Mechanical Engineering and Materials Science Independent Study by an authorized administrator of Washington University Open Scholarship. or more information, please contact
2 Modal Analysis and Vibration Test of Shaker Table Brian Mincks Marshall Space light Center July 13, 2018 Reviewed by NASA Mentor Ron Burwell ET40

3 National Aeronautics and Space Administration George C. Marshall Space light Center Marshall Space light Center, AL July 13, 2018 To: rom: Subject: ET40 Vibrations Team Brian Mincks Modal Analysis and Vibration of UD T4000-H Shaker The Unholtz-Dickie T4000A horizontal shaker (UD T4000A-H) was subject to both a modal tap test and a subsequent vibration test. The modal test was completed on July 2, 2018 and the vibration test was completed on July 9, The R s from the modal test and the acceleration profiles and duration schedules from the vibration test are shown in the attached tests and procedures. Please direct any questions or comments to Brian Mincks at (740) , brian.mincks@nasa.gov, or b.d.mincks@wustl.edu. Brian Mincks Structural Dynamics Intern NASA MSC ET40

4 George C. Marshall Space light Center UD T4000A-H Marshall Spaec light Center, Alabama /2/2018-7/9/2018 Unholtz-Dickie T4000A Modal Analysis & Vibration Test
5 Abstract A shaker can be used to simulate launch vibrations and check responses of structures forced at different frequencies. When vibrating at certain frequencies during tests, structural modes of the shaker table itself can cause the test to abort by accelerating too much or by pushing too much electrical gain through the system. urthermore, structural modes can produce misleading data at these modal frequencies and cause the test article to be under-tested or over-tested. A modal roving hammer test of the horizontal shaker table is conducted to characterize these modes of the shaker table. Two cases were tested in an attempt to simulate the boundary condition of the table on the shaker: free-free and free-fixed. The free-free case revealed a stretching mode at Hz while free-fixed showed two stretching modes at 576.7Hz and Hz. A subsequent vibration test revealed controlling 20in from the shaker attachment point best controls these modes without drastically over-testing or under-testing. Introduction The goal of this experiment is to characterize the structural modes of the UD T4000A horizontal shaker in an effort to better understand how to control it at these resonances. A control accelerometer is attached to the shake table and relays how many g s the test article is feeling to the control system. The control system adjusts power to the shaker in an attempt to shake the control accelerometer at a specified level. Due to the continuity in the shaker table structure and the finite location at which a control accelerometer can sense, the control accelerometer can be subject to more or less g s relative to the rest of the structure depending on where it is in the mode shape. If the control accelerometer is in a resonance of the mode shape, it will not take much power to shake the control accelerometer at the specified level and the rest of the mode shape will feel less g s (under testing). Conversely, if the control accelerometer is in a node, the control system will push the shaker harder than necessary. This causes the rest of the mode shape to feel more g s (over testing). urthermore, the control system may be forced to abort the test in this case because it puts too much gain through the amps in an attempt to push the control accelerometer to the specified levels.
6 Damage and test abort problems usually occur in the axis of vibration so the in-axis component of the modes is all that is considered in this report. The plate stretching mode responds completely in axis and usually causes the most problems. The stretching modal frequency in Hz of any structure is calculated as in Eq. 1 [1]. f = V AL (1) Here, V is the speed of sound of the material defined as V = E ρ where E is the elastic modulus of the material and ρ is the density. L is the length of the structure in the axis of stretching. A is a constant dependent on the boundary condition and is defined in Eq. 2. A = { 2, ree ree 4, ree ixed A modal roving hammer test is performed to reveal the stretching modes that Eq. 1-2 predict. The table has a free-forced boundary condition on the table itself. A forced boundary condition cannot be simulated in the modal tap test so the plate will be simulated as both free-free and free-fixed to reveal all frequencies around which the stretching mode might appear. A subsequent vibration test is performed to sweep through the modal frequencies discovered in the modal tests. The swept sine test will be repeated, but controlled at various locations along the length of plate. This should reveal how much vibration gain or attenuation is being felt around the plate Apparatus & Procedures Part 1: Modal Analysis The experiment starts with the free-free modal test. The equipment list for the modal tests is seen below in Table 1. (2)
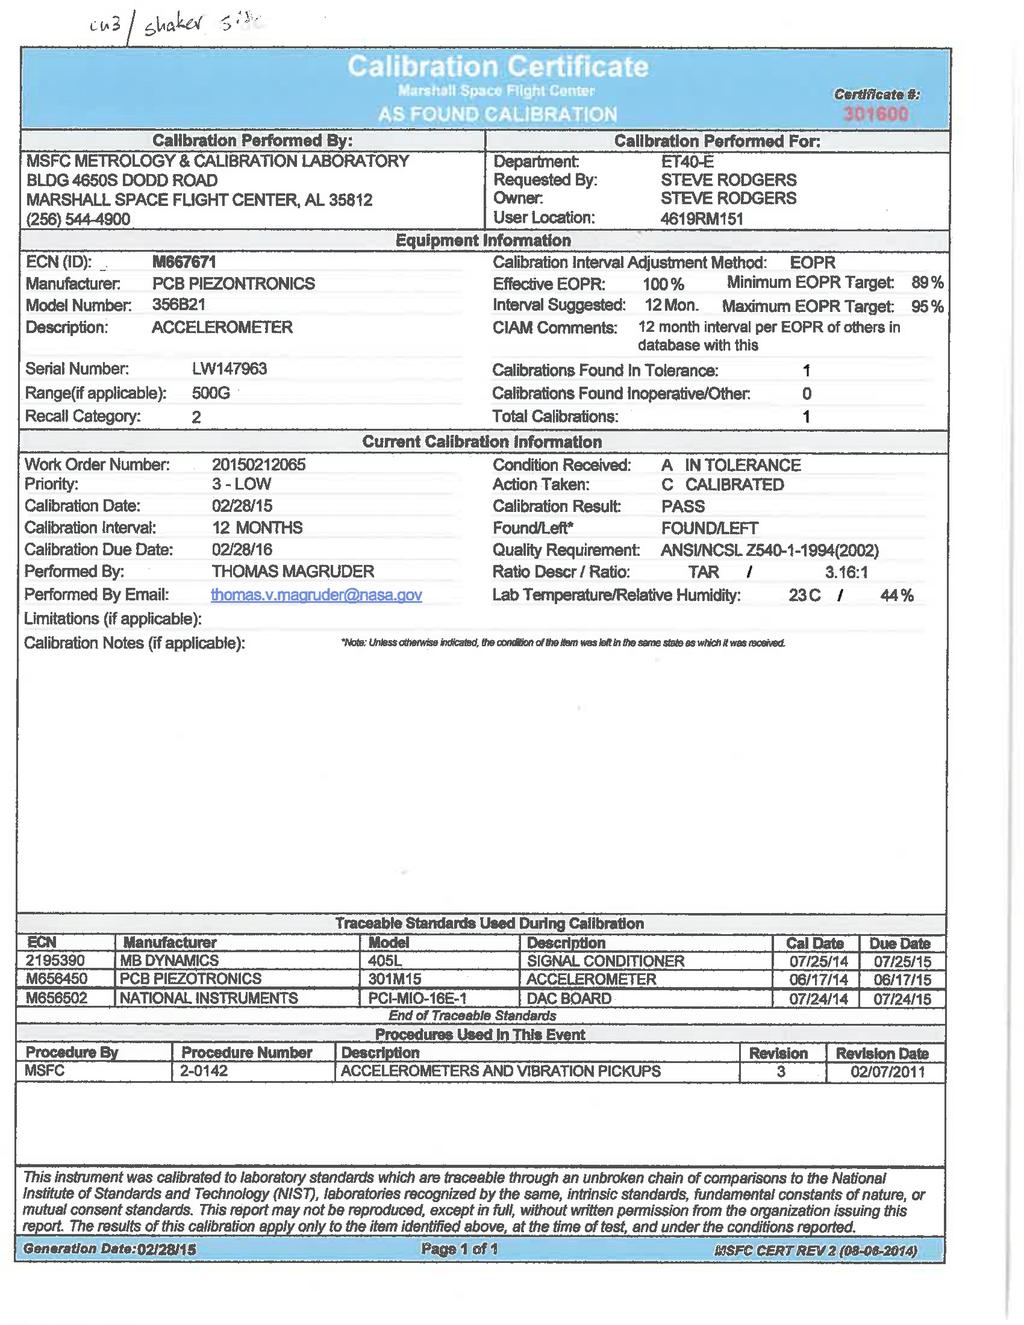
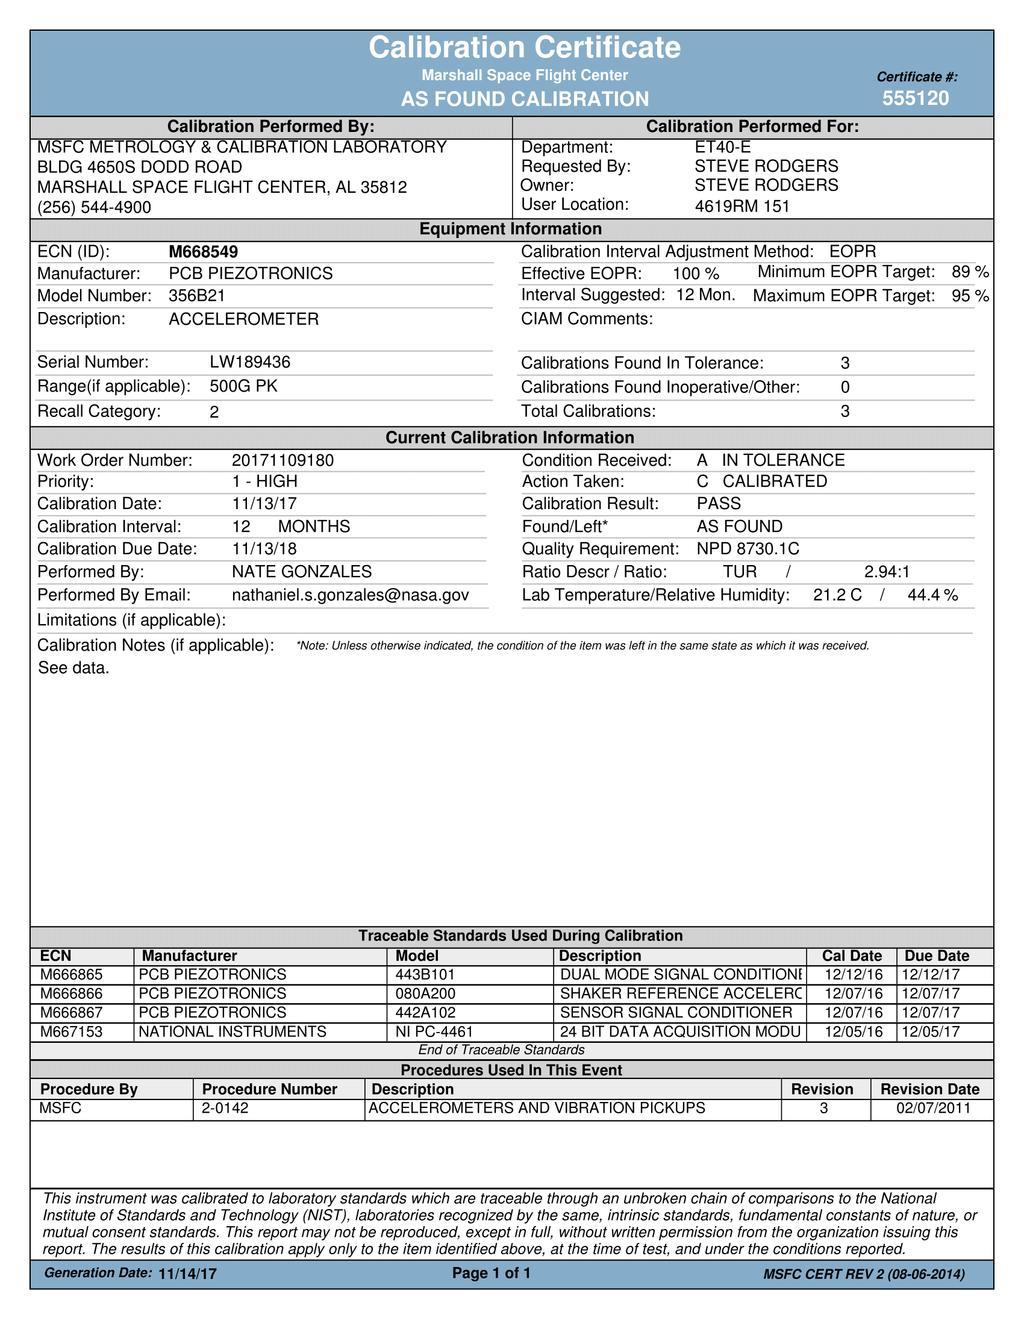
7 Table 1 Equipment List Item NEMS/SN Cal Date Cal Due R1 Accelerometer LW /20/14 9/20/15 R2 Accelerometer LW /28/15 2/28/16 Hammer/Load Cell LW40109 N/A N/A 20g hammer mass N/A N/A N/A Plastic hammer tip N/A N/A N/A Data Acquisition ront End N/A N/A Dell M6400 Computer TL13A N/A N/A ree Shaker Table N/A N/A N/A ixed Shaker Table N/A N/A N/A Accompanying, relevant calibration documents are available in Appendix A.1. A schematic showing the equipment setup is seen below in igure 1. Hammer/Load Cell Dell Computer Data Acquisition ront End Shaker Accelerometer 1 Table Accelerometer 2 igure 1 Modal test setup To simulate the free-free boundary condition, the shaker is setup on foam blocks. Simple, checkout tests revealed the first structural mode was more than ten times that of the first rigid body mode signifying the free-free simulation is valid [1]. igure 2 shows this setup of the shaker table on foam.


8 igure 2 ree-ree test setup To simulate a free-fixed boundary condition, the table is left on the shaker. Lubricating oil that flows during shaker operation is pumped in between the table and its support structure to create the free boundary condition. The shaker is left locked to fix the other end. igure 3 shows the free-fixed configuration. igure 3 ree-fixed test setup
9 The tap test utilized two response accelerometers and six tap locations. The plate geometry, accelerometer locations, and hammer tap locations are seen below in igure 4. X Y Z igure 4 Geometry and tap locations on shaker table (dimensions in inches) Here P1 P6 signify the tap locations of the hammer and R1 and R2 are the accelerometer locations. The accelerometers are glued onto the table using Cyanoacrylate. The test excites frequencies over 1000Hz so glue must be used to ensure good energy transfer. Taps on point P1-P3 happen along the thickness of the plate in the +Z direction while taps on points P4-P6 happen in the -Z direction.
10 All of the data is taken using LMS Impact Testing 13A software. Table 2 shows all of the test setup parameters. The impact scope parameters are all codependent. Once two are defined, the other two are calculated. Bandwidth is set to 1600Hz because tests usually abort around what is suspected to be the stretching mode at 700Hz. In order to prevent leakage in the data, 1600Hz is chosen to ensure at least twice the frequency of interest is measured [1]. Acquisition time was set next at 5.12s. The plate rang for approximately three seconds in the free-free case when struck with the hammer. In order to observe the entire impact with a margin of safety, 5.12s is chosen. Once the Impact scope parameters are chosen, the tip and hammer masses has to be addressed. A db drop in impact energy is desired across the bandwidth of interests. This prevents the introduction of leakage through non negligible energy being input at a frequency that s not being measured [1]. This can be accomplished with many different hammer mass and tip configurations. or this experiment, a hard plastic tip and two 20g masses were used. All the trigger settings were chosen from what the software suggests. A few test taps will yield suggested values similar to those seen below in Table 2. The data is slightly windowed to ensure the entire impact is observed without having lengthy acquisition time. If excluded from the table below, use the default settings. Table 2 LMS parameters Software Software Section Subsection ield Value Bandwidth 1600Hz Impact Scope N/A Spectral Lines 8192 Resolution Hz Acquisition Time 5.12s Input Range 10V Trigger Trigger level Impact Setup Pretrigger s Windowing Input orce-exponential (0.1403%) Response Uniform (100%) Measure N/A Averages 5
11 Part 2: Vibration Test Once the modes have been found and characterized, a vibration test is conducted to sweep across the modal frequencies. The test uses 4 accelerometers at varying lengths from the shaker attachment point. The same test will be run 4 times with the exception of changing the control accelerometer. This should reveal what the rest of the structure is feeling compared to what the control accelerometer feels. The test equipment list is seen below in Table3. Table 3 Vibration test equipment Item NEMS/SN Cal Date Cal Due P1 Accelerometer LW /26/18 1/26/2019 P1 Charge Amp M /1/17 7/1/18 P2 Accelerometer LW /13/17 11/13/18 P2 Charge Amp M /1/17 7/1/18 P3 Accelerometer LW /13/17 11/13/18 P3 Charge Amp M /16/17 11/16/18 P4 Accelerometer LW /13/17 11/13/18 P4 Charge Amp M /23/17 9/23/18 Shaker UD T4000A-H N/A N/A Control System Ch 1-4 VR9500 M N/A N/A Control System Ch 5-8 VR9500 M N/A N/A Control System Ch 9-12 VR9500 M N/A N/A Accompanying, relevant calibration documents are available in Appendix A.2. A schematic of the test setup is seen in igure 5. Control System Shaker Amps Shaker Table Vibration Recorder Signal Conditioners Accelerometers igure 5 Vibration test setup schematic
12 igures 6 shows a detailed drawing of the accelerometer locations on the table. X Y Z igure 6 Accelerometer locations for vibration test (dimensions in inches)

13 igure 7 shows a picture of the actual test setup. igure 7 Vibration test setup The test is controlled and recorded with the VibrationVIEW software. The test sweeps from 40Hz 2000Hz at 0.5g. The test sweeps through the frequencies at 5 octaves/min with an abort range of ±50dB. All of the other settings are default. The first test controls with an accelerometer at P1, the second test controls with an accelerometer at P2, etc. All the other accelerometers in these tests simply record the response. Results Part 1: Modal Analysis The frequency response functions (R s) at each tap location of the free-free tap test are seen below in igure 8. The free-fixed R s are seen in igure 9. Both igures 8 and 9 are obtained directly from LMS.
14 db g/lbf g/lbf db Amplitude db g/lbf g/lbf db Amplitude R p2:-z/p1:+z R p2:-z/p2:+z R p2:-z/p3:+z R p2:-z/p4:-z R p2:-z/p5:-z R p2:-z/p6:-z R p2:-z/p1:+z R p2:-z/p2:+z R p2:-z/p3:+z R p2:-z/p4:-z R p2:-z/p5:-z R p2:-z/p6:-z Hz igure 8 R s of free-free modal tap test R p2:-z/p1:+z R p2:-z/p2:+z R p2:-z/p3:+z R p2:-z/p4:-z R p2:-z/p5:-z R p2:-z/p1:+z R p2:-z/p2:+z R p2:-z/p3:+z R p2:-z/p4:-z R p2:-z/p5:-z Hz igure 9 R s of free-fixed modal tap test 0.00 Hz The quality of the data appears to be good. There is some noise in the data but it s all relatively small compared to the modal peaks.

15 All the peaks in all the test configurations correspond to a stretching mode. LMS directly animates the mode shapes that it is recording. The free-free stretching mode at Hz is seen below in igure 10. The first and second modes of the free-fixed case at Hz and Hz are seen in igures 11 and 12, respectively. Initial Compressed Initial Stretched Initial igure 10 ree-free stretching mode at Hz, 0.02% damping Initial Compressed Initial Stretched Initial igure 11 ree-fixed stretching mode at Hz, 0.67% damping
16 Initial Compressed Initial Stretched Initial igure 12 ree-fixed stretching mode at Hz, 1.19% damping Part 2: Vibration Test igure 13 shows the vibration profile controlling at P1. igure 14 shows the vibration profile controlling at P2. igure 15 shows the acceleration profile controlling at P3. igure 16 shows the vibration profile controlling at P4. All of the acceleration profiles are exported directly from VibrationView
17 Drive (Volts) Acceleration (G peak) Acceleration Profile Demand Control C1 Z C2 Z C3 Z C4 Z requency (Hz) Output Drive Drive requency (Hz) igure 13 Vibration profile controlling at P1
18 Drive (Volts) Acceleration (G peak) Acceleration Profile Demand Control C1 Z C2 Z C3 Z C4 Z requency (Hz) Output Drive Drive requency (Hz) igure 14 Vibration profile controlling at P2
19 Drive (Volts) Acceleration (G peak) Acceleration Profile Demand Control C1 Z C1 Y C2 Z C4 Z requency (Hz) Output Drive Drive requency (Hz) igure 15 Vibration profile controlling at P3
20 Drive (Volts) Acceleration (G peak) Acceleration Profile Demand Control C1 Z C1 Y C2 Z C3 Z requency (Hz) Output Drive Drive requency (Hz) igure 16 Vibration profile controlling at P4
21 The data looks good in quality. There doesn t appear to be any outliers that signify something went wrong in the tests. Discussion Part 1: Modal Analysis The R peaks denote the modal stretching frequencies and align well with the predicted analytical first stretching mode frequencies as seen in Table 3. Table 4 Experimental-analytical comparison of modal frequencies Test Configuration Measured requency [Hz] Analytical requency [Hz] Percent Error ree-ree ree-ixed The discrepancies in the data can be accredited to the irregular plate geometry. Equations 1 and 2 model a fixed-length uniform plate. The plate is not of fixed length and is riddled with mounting and bearing holes which both directly contradict the assumptions that are necessary to use Equations 1 and 2 accurately. The exaggerated error in the free-fixed case is due to an imperfect fixed boundary condition. While the plate is locked in the shaker, the whole shaker/plate system can still move because the shaker sits on airbags. Part 2: Vibration Test Point 1 appears to be a node. igure 13 shows the acceleration profile controlling at point 1. While it stays on its 0.5g line through the frequency, all the other points have vibration gains over 20 at the first stretching mode. The control system has to push the shaker hard to get this node up to a 0.5g while the others are resonating. Point 2 appears to be approaching a resonance. igure 14 shows the control system doesn t have to push the shaker too hard to get Point 2 up to the specified acceleration. It s also seen that the Point 1 node is barely moving and Points 3 and 4 are resonating a little harder at the first stretching mode. igures 15 and 16 show similar trends with points 3 and 4. It appears that point 4 resonates the hardest followed by point 3 and then point 2. This was analyzed by exporting all the vibration view data to Excel.
22 At each control location, the acceleration gains were analyzed by comparing the responses to the control. Table 5 shows these trends. Table 5 Vibration gains across table at varying control points Control Point Vibration Gain --- P1 P2 P3 P4 P P P P This makes sense from the results from the modal test. The animations in igures 11 and 12 show both ends moving like an accordion. However, that is for a free fixed boundary condition. Since the fixed end is actually forced in the actual vibration test, a Galilean transformation must be applied to the frame of reference so that the free-fixed mode shapes can be applied. In this transformed reference frame, the mode shape is viewed from the perspective of the shaker head and the end (P4) will be resonating the most while the attachment point (P1) will be fixed. Conclusion Stretching modes exist in the shaker table. The free-free configuration has a stretching mode at Hz and the free-fixed configuration has two modes at Hz and Hz. The freefree test aligns quite well with the analytical solution while the free-fixed case test setup could be improved to make a more fixed end. These results can be used to help control the shaker through the stretching modal frequencies. A Galilean transformation of the reference frame is conducted to the accordion-like mode shape from the free-fixed test so it is viewed from the perspective of the shaker. In this reference frame the accordion mode will be stationary at the attachment point to the shaker and be resonating at the full length. Table 5 concisely depicts how this length dependent resonance affects the vibration gain in the structure. To best control the shaker table and to provide an accurate, safe, abort free test through the stretching modes, control around 20 inches from the attachment head. The vibration gains felt throughout the rest of the structure only get as big as This should prevent the test from aborting and ensure the test article is not being damagingly over-tested.
23 References 1. Rost, Robert, Allemong, Randal. (2018, May 15-17). Practical Data Acquisition and Experimental Modal Analysis Theory and Applications.

24 Appendix A.1 Modal Test accelerometer calibration information
25
26 Appendix A.2 Vibration Test accelerometer calibration information
27
28
29
sin(wt) y(t) Exciter Vibrating armature ENME599 1
 y(t) Exciter Vibrating armature ENME599 1") ENME599 1 LAB #3: Kinematic Excitation (Forced Vibration) of a SDOF system Students must read the laboratory instruction manual prior to the lab session. The lab report must be submitted in the beginning
ENME599 1 LAB #3: Kinematic Excitation (Forced Vibration) of a SDOF system Students must read the laboratory instruction manual prior to the lab session. The lab report must be submitted in the beginning
Model Correlation of Dynamic Non-linear Bearing Behavior in a Generator
 Model Correlation of Dynamic Non-linear Bearing Behavior in a Generator Dean Ford, Greg Holbrook, Steve Shields and Kevin Whitacre Delphi Automotive Systems, Energy & Chassis Systems Abstract Efforts to
Development of Random Vibration Profiles for Test Deployers to Simulate the Dynamic Environment in the Poly-Picosatellite Orbital Deployer
 Development of Random Vibration Profiles for Test Deployers to Simulate the Dynamic Environment in the Poly-Picosatellite Orbital Deployer Steve Furger California Polytechnic State University, San Luis
Resonance Tube. 1 Purpose. 2 Theory. 2.1 Air As A Spring. 2.2 Traveling Sound Waves in Air
 Resonance Tube Equipment Capstone, complete resonance tube (tube, piston assembly, speaker stand, piston stand, mike with adapters, channel), voltage sensor, 1.5 m leads (2), (room) thermometer, flat rubber
Resonance Tube Lab 9
 HB 03-30-01 Resonance Tube Lab 9 1 Resonance Tube Lab 9 Equipment SWS, complete resonance tube (tube, piston assembly, speaker stand, piston stand, mike with adaptors, channel), voltage sensor, 1.5 m leads
Laboratory Experiment #2 Frequency Response Measurements
 J.B.Francis College of Engineering Mechanical Engineering Department 22-403 Laboratory Experiment #2 Frequency Response Measurements Introduction It is known from dynamic systems that a structure temporarily
Modal Excitation. D. L. Brown University of Cincinnati Structural Dynamics Research Laboratory. M. A. Peres The Modal Shop, Inc Cincinnati, OH
 Modal Excitation D. L. Brown University of Cincinnati Structural Dynamics Research Laboratory M. A. Peres The Modal Shop, Inc Cincinnati, OH IMAC-XXVI, Modal Excitation, #356, Feb 04, 2008, Intoduction
MODEL MODIFICATION OF WIRA CENTER MEMBER BAR
 MODEL MODIFICATION OF WIRA CENTER MEMBER BAR F.R.M. Romlay & M.S.M. Sani Faculty of Mechanical Engineering Kolej Universiti Kejuruteraan & Teknologi Malaysia (KUKTEM), Karung Berkunci 12 25000 Kuantan
Resonance Tube. 1 Purpose. 2 Theory. 2.1 Air As A Spring. 2.2 Traveling Sound Waves in Air
 Resonance Tube Equipment Capstone, complete resonance tube (tube, piston assembly, speaker stand, piston stand, mike with adaptors, channel), voltage sensor, 1.5 m leads (2), (room) thermometer, flat rubber
MEC751 Measurement Lab 2 Instrumented Cantilever Beam
 MEC751 Measurement Lab 2 Instrumented Cantilever Beam Goal: 1. To use a cantilever beam as a precision scale for loads between 0-500 gr. Using calibration procedure determine: a) Sensitivity (mv/gr) b)
CHAPTER 5 FAULT DIAGNOSIS OF ROTATING SHAFT WITH SHAFT MISALIGNMENT
 66 CHAPTER 5 FAULT DIAGNOSIS OF ROTATING SHAFT WITH SHAFT MISALIGNMENT 5.1 INTRODUCTION The problem of misalignment encountered in rotating machinery is of great concern to designers and maintenance engineers.
SCOPE OF ACCREDITATION TO ISO/IEC 17025:2005 & ANSI/NCSL Z
 SCOPE OF ACCREDITATION TO ISO/IEC 17025:2005 & ANSI/NCSL Z540-1-1994 THE MODAL SHOP, INC. A PCB GROUP COMPANY 3149 E. Kemper Road Cincinnati OH 45241 Lisa Moore Phone: 513 351-9919 CALIBRATION Valid To:
Fundamentals of Structural Dynamics
 Fundamentals of Structural Dynamics Smarter decisions, better products. Structural Dynamics Agenda Topics How to characterize structural behavior? Fundamentals Natural Frequencies, Resonances, Damping
SETUP I: CORD. Continuous Systems
 Lab #8 Continuous Systems Name: Date: Section / Group: SETUP I: CORD This part of the laboratory is mainly exploratory in nature. By using your hand to force the cord close to one of its ends, you should
Application of optical measurement techniques for experimental modal analyses of lightweight structures
 Application of optical measurement techniques for experimental modal analyses of lightweight structures C. Schedlinski, J. Schell, E. Biegler, J. Sauer ICS Engineering GmbH Am Lachengraben, Dreieich, Germany
Development of a Package for a Triaxial High-G Accelerometer Optimized for High Signal Fidelity
 Development of a Package for a Triaxial High-G Accelerometer Optimized for High Signal Fidelity R. Langkemper* 1, R. Külls 1, J. Wilde 2, S. Schopferer 1 and S. Nau 1 1 Fraunhofer Institute for High-Speed
IMAC 27 - Orlando, FL Shaker Excitation
 IMAC 27 - Orlando, FL - 2009 Peter Avitabile UMASS Lowell Marco Peres The Modal Shop 1 Dr. Peter Avitabile Objectives of this lecture: Overview some shaker excitation techniques commonly employed in modal
Test Pod User s Guide
 Document Classification X Public Domain ITAR Controlled Internal Only Test Pod User s Guide Revision Date Author Change Log 6 11/6/2006 Jonathan Brown Moved to standard document format 1 of 6 1 Introduction
CubeSat Test Pod User s Guide Revision IV June, 2005
 Contacts: CubeSat Test Pod User s Guide Revision IV June, 2005 Cal Poly, San Luis Obispo Stanford University Prof. Jordi Puig-Suari Prof. Bob Twiggs, Director Aerospace Engineering Dept. Space Systems
Remote-Controlled Rotorcraft Blade Vibration and Modal Analysis at Low Frequencies
 ARL-MR-0919 FEB 2016 US Army Research Laboratory Remote-Controlled Rotorcraft Blade Vibration and Modal Analysis at Low Frequencies by Natasha C Bradley NOTICES Disclaimers The findings in this report
A detailed experimental modal analysis of a clamped circular plate
 A detailed experimental modal analysis of a clamped circular plate David MATTHEWS 1 ; Hongmei SUN 2 ; Kyle SALTMARSH 2 ; Dan WILKES 3 ; Andrew MUNYARD 1 and Jie PAN 2 1 Defence Science and Technology Organisation,
Modal Parameter Estimation Using Acoustic Modal Analysis
 Proceedings of the IMAC-XXVIII February 1 4, 2010, Jacksonville, Florida USA 2010 Society for Experimental Mechanics Inc. Modal Parameter Estimation Using Acoustic Modal Analysis W. Elwali, H. Satakopan,
An Alternative to Pyrotechnic Testing For Shock Identification
 An Alternative to Pyrotechnic Testing For Shock Identification J. J. Titulaer B. R. Allen J. R. Maly CSA Engineering, Inc. 2565 Leghorn Street Mountain View, CA 94043 ABSTRACT The ability to produce a
Mode-based Frequency Response Function and Steady State Dynamics in LS-DYNA
 11 th International LS-DYNA Users Conference Simulation (3) Mode-based Frequency Response Function and Steady State Dynamics in LS-DYNA Yun Huang 1, Bor-Tsuen Wang 2 1 Livermore Software Technology Corporation
EXPERIMENT 2: STRAIN GAGE DYNAMIC TESTING
 EXPERIMENT 2: STRAIN GAGE DYNAMIC TESTING Objective: In this experiment you will use the strain gage installation from the prior lab assignment and test the cantilever beam under dynamic loading situations.
BASICS OF MODAL TESTING AND ANALYSIS
 CI PRODUCT NOTE No. 007 BASICS OF MODAL TESTING AND ANALYSIS WWW.CRYSTALINSTRUMENTS.COM BASICS OF MODAL TESTING AND ANALYSIS Introduction Modal analysis is an important tool for understanding the vibration
Vibration Fundamentals Training System
 Vibration Fundamentals Training System Hands-On Turnkey System for Teaching Vibration Fundamentals An Ideal Tool for Optimizing Your Vibration Class Curriculum The Vibration Fundamentals Training System
430. The Research System for Vibration Analysis in Domestic Installation Pipes
 430. The Research System for Vibration Analysis in Domestic Installation Pipes R. Ramanauskas, D. Gailius, V. Augutis Kaunas University of Technology, Studentu str. 50, LT-51424, Kaunas, Lithuania e-mail:
Testing in a Combined Vibration and Acceleration Environment
 Testing in a Combined Vibration and Acceleration Environment Richard Jepsen and Edward Romero Mechanical Environments Department, MS 1135 Sandia National Laboratories, PO Box 5800 Albuquerque, NM 87185
SDOF System: Obtaining the Frequency Response Function
 University Consortium on Instructional Shake Tables SDOF System: Obtaining the Frequency Response Function Developed By: Dr. Shirley Dyke and Xiuyu Gao Purdue University [updated July 6, 2010] SDOF System:
Vector Network Analyzers (VERY) Basics. Tom Powers USPAS SRF Testing Course 19 Jan. 2014
 Basics. Tom Powers USPAS SRF Testing Course 19 Jan. 2014") Vector Network Analyzers (VERY) Basics Tom Powers USPAS SRF Testing Course 19 Jan. 2014 S-Parameters A scattering matrix relates the voltage waves incident on the ports of a network to those reflected
Vector Network Analyzers (VERY) Basics Tom Powers USPAS SRF Testing Course 19 Jan. 2014 S-Parameters A scattering matrix relates the voltage waves incident on the ports of a network to those reflected
EE 560 Electric Machines and Drives. Autumn 2014 Final Project. Contents
 EE 560 Electric Machines and Drives. Autumn 2014 Final Project Page 1 of 53 Prof. N. Nagel December 8, 2014 Brian Howard Contents Introduction 2 Induction Motor Simulation 3 Current Regulated Induction
Reverberation time and structure loss factor
 Reverberation time and structure loss factor CHRISTER HEED SD2165 Stockholm October 2008 Marcus Wallenberg Laboratoriet för Ljud- och Vibrationsforskning Reverberation time and structure loss factor Christer
Natural Frequencies and Resonance
 Natural Frequencies and Resonance A description and applications of natural frequencies and resonance commonly found in industrial applications Beaumont Vibration Institute Annual Seminar Beaumont, TX
The rapid evolution of
 Shock Testing Miniaturized Products by George Henderson, GHI Systems Smaller product designs mandate changes in test systems and analysis methods. Don t be shocked by the changes. Figure 1. Linear Shock
Response spectrum Time history Power Spectral Density, PSD
 A description is given of one way to implement an earthquake test where the test severities are specified by time histories. The test is done by using a biaxial computer aided servohydraulic test rig.
Operational modal analysis applied to a horizontal washing machine: A comparative approach Sichani, Mahdi Teimouri; Mahjoob, Mohammad J.
 Aalborg Universitet Operational modal analysis applied to a horizontal washing machine: A comparative approach Sichani, Mahdi Teimouri; Mahjoob, Mohammad J. Publication date: 27 Document Version Publisher's
SHOCK AND VIBRATION RESPONSE SPECTRA COURSE Unit 17. Aliasing. Again, engineers collect accelerometer data in a variety of settings.
 SHOCK AND VIBRATION RESPONSE SPECTRA COURSE Unit 17. Aliasing By Tom Irvine Email: tomirvine@aol.com Introduction Again, engineers collect accelerometer data in a variety of settings. Examples include:
Week 15. Mechanical Waves
 Chapter 15 Week 15. Mechanical Waves 15.1 Lecture - Mechanical Waves In this lesson, we will study mechanical waves in the form of a standing wave on a vibrating string. Because it is the last week of
DYNAMIC CHARACTERIZATION OF ORIFICE TYPE AEROSTATIC BEARING
 DYNAMIC CHARACTERIZATION OF ORIFICE TYPE AEROSTATIC BEARING Varun. M 1, M. M. M. Patnaik 2, Arun Kumar. S 3, A. Sekar 4 1Varun. M, Student, M.Tech (Machine Design), K. S. Institute of Technology, Karnataka,
SYSTEM IDENTIFICATION: A STUDY OF VARIOUS METHODS FOR CONTINUOUS SYSTEMS
 SYSTEM IDENTIFICATION: A STUDY OF VARIOUS METHODS FOR CONTINUOUS SYSTEMS Ayush Raizada, Vishnuvardhan Krishnakumar, Dr. P. M. Singru Abstract This paper addresses and evaluates the methods of system identification
(i) Sine sweep (ii) Sine beat (iii) Time history (iv) Continuous sine
 Sine sweep (ii) Sine beat (iii) Time history (iv) Continuous sine") A description is given of one way to implement an earthquake test where the test severities are specified by the sine-beat method. The test is done by using a biaxial computer aided servohydraulic test
A description is given of one way to implement an earthquake test where the test severities are specified by the sine-beat method. The test is done by using a biaxial computer aided servohydraulic test
Experimental investigation of crack in aluminum cantilever beam using vibration monitoring technique
 International Journal of Computational Engineering Research Vol, 04 Issue, 4 Experimental investigation of crack in aluminum cantilever beam using vibration monitoring technique 1, Akhilesh Kumar, & 2,
Modal Analysis of Microcantilever using Vibration Speaker
 Modal Analysis of Microcantilever using Vibration Speaker M SATTHIYARAJU* 1, T RAMESH 2 1 Research Scholar, 2 Assistant Professor Department of Mechanical Engineering, National Institute of Technology,
Experimental Modal Analysis of an Automobile Tire
 Experimental Modal Analysis of an Automobile Tire J.H.A.M. Vervoort Report No. DCT 2007.084 Bachelor final project Coach: Dr. Ir. I. Lopez Arteaga Supervisor: Prof. Dr. Ir. H. Nijmeijer Eindhoven University
Effect of temperature on modal characteristics of steel-concrete composite bridges: Field testing
 4th International Conference on Structural Health Monitoring on Intelligent Infrastructure (SHMII-4) 2009 Abstract of Paper No: XXX Effect of temperature on modal characteristics of steel-concrete composite
Resonant Frequency Analysis of the Diaphragm in an Automotive Electric Horn
 Resonant Frequency Analysis of the Diaphragm in an Automotive Electric Horn R K Pradeep, S Sriram, S Premnath Department of Mechanical Engineering, PSG College of Technology, Coimbatore, India 641004 Abstract
Dynamic Modeling of Air Cushion Vehicles
 Proceedings of IMECE 27 27 ASME International Mechanical Engineering Congress Seattle, Washington, November -5, 27 IMECE 27-4 Dynamic Modeling of Air Cushion Vehicles M Pollack / Applied Physical Sciences
FATIGUE CRACK CHARACTERIZATION IN CONDUCTING SHEETS BY NON
 FATIGUE CRACK CHARACTERIZATION IN CONDUCTING SHEETS BY NON CONTACT STIMULATION OF RESONANT MODES Buzz Wincheski, J.P. Fulton, and R. Todhunter Analytical Services and Materials 107 Research Drive Hampton,
Good Modal Practices
 Good Modal Practices 92-315 Introduction Transducer Considerations Proper Excitation Ensuring Data Gathered is Good Post Processing Tips and Tricks Wrap Up Dr. C. Novak University of Windsor Good Modal
3.0 Apparatus. 3.1 Excitation System
 3.0 Apparatus The individual hardware components required for the GVT (Ground Vibration Test) are broken into four categories: excitation system, test-structure system, measurement system, and data acquisition
Module 4 TEST SYSTEM Part 2. SHAKING TABLE CONTROLLER ASSOCIATED SOFTWARES Dr. J.C. QUEVAL, CEA/Saclay
 Module 4 TEST SYSTEM Part 2 SHAKING TABLE CONTROLLER ASSOCIATED SOFTWARES Dr. J.C. QUEVAL, CEA/Saclay DEN/DM2S/SEMT/EMSI 11/03/2010 1 2 Electronic command Basic closed loop control The basic closed loop
A Custom Vibration Test Fixture Using a Subwoofer
 Paper 068, ENT 205 A Custom Vibration Test Fixture Using a Subwoofer Dale H. Litwhiler Penn State University dale.litwhiler@psu.edu Abstract There are many engineering applications for a source of controlled
Characterization and Validation of Acoustic Cavities of Automotive Vehicles
 Characterization and Validation of Acoustic Cavities of Automotive Vehicles John G. Cherng and Gang Yin R. B. Bonhard Mark French Mechanical Engineering Department Ford Motor Company Robert Bosch Corporation
A study of Vibration Analysis for Gearbox Casing Using Finite Element Analysis
 A study of Vibration Analysis for Gearbox Casing Using Finite Element Analysis M. Sofian D. Hazry K. Saifullah M. Tasyrif K.Salleh I.Ishak Autonomous System and Machine Vision Laboratory, School of Mechatronic,
 15-8 1/31/2014 PRELAB PROBLEMS 1. Why is the boundary condition of the cavity such that the component of the air displacement χ perpendicular to a wall must vanish at the wall? 2. Show that equation (5)
Filling in the MIMO Matrix Part 2 Time Waveform Replication Tests Using Field Data
 Filling in the MIMO Matrix Part 2 Time Waveform Replication Tests Using Field Data Marcos Underwood, Russ Ayres, and Tony Keller, Spectral Dynamics, Inc., San Jose, California There is currently quite
Experimental Vibration-based Damage Detection in Aluminum Plates and Blocks Using Acoustic Emission Responses
 More Info at Open Access Database www.ndt.net/?id=7979 Experimental Vibration-based Damage Detection in Aluminum Plates and Blocks Using Acoustic Emission Responses Abstract Mehdi MIRSADEGI, Mehdi SANATI,
Frequency Response Function Measurements of Disc and Drum Brake With its Verification by CAE
 Frequency Response Function Measurements of Disc and Drum Brake With its Verification by CAE Aniket B. Ghatwai 1, Prof. S.V. Chaitanya 2, Sandip B. Phadke 3 1 Student at AISSMS COE,PUNE,Maharashtra 2Prof.
DS-2000 Series Measurement of Frequency Response Function
 DS-2000 Series Measurement of Frequency Response Function ONO SOKKI CO., LTD. Contents 1. Flow Chart to Measurement 2. Device Connections 3. DS-2000 Setup 4. Measurement 1. Flow Chart to Measurement The
HIGH SURVIVABILITY ACCELEROMETER FOR FUZE APPLICATIONS
 HIGH SURVIVABILITY ACCELEROMETER FOR FUZE APPLICATIONS Randy Martin, James Letterneau Presentation by Randy Martin NDIA 56 th Annual Fuze Conference Wednesday May 16, 2012 Baltimore, MD Meggitt Sensing
Sloshing of Liquid in Partially Filled Container An Experimental Study
 Sloshing of Liquid in Partially Filled Container An Experimental Study P. Pal Department of Civil Engineering, MNNIT Allahabad, India. E-mail: prpal2k@gmail.com Abstract This paper deals with the experimental
Material Parameter Measurement (MPM)
") Material Parameter Measurement (MPM) C4 Software Module and Accessory of the KLIPPEL ANALYZER SYSTEM (Document Revision 1.3) FEATURES Measure E modulus and damping Evaluate raw materials Specify loudspeaker
Material Parameter Measurement (MPM) C4 Software Module and Accessory of the KLIPPEL ANALYZER SYSTEM (Document Revision 1.3) FEATURES Measure E modulus and damping Evaluate raw materials Specify loudspeaker
Design and Evaluation of a Piezoelectric Actuator for Turning
 Design and Evaluation of a Piezoelectric Actuator for Turning Albert A. Espinoza 1, Luke J. Mayer 2, Paul V. Oberlin 3, Matthew Bement 4 1 Dept. of Mechanical Eng., University of Texas at Austin, Austin,
Portable FFT Analyzer CF-9200/9400
 Portable FFT Analyzer CF-9200/9400 Frequency response measurement by impact excitation by using Impulse hammer November2015 Contents 1 Introduction 2 Preparing equipment 3 Before measurement 3-1. Connection
Acoustic Resonance Analysis Using FEM and Laser Scanning For Defect Characterization in In-Process NDT
 ECNDT 2006 - We.4.8.1 Acoustic Resonance Analysis Using FEM and Laser Scanning For Defect Characterization in In-Process NDT Ingolf HERTLIN, RTE Akustik + Prüftechnik, Pfinztal, Germany Abstract. This
Correlation Between Measured and Simulated Parameters of a Proposed Transfer Standard
 Correlation Between Measured and Simulated Parameters of a Proposed Transfer Standard Jim Nadolny AMP Incorporated ABSTRACT Total radiated power of a device can be measured using a mode stirred chamber
Getting Started. MSO/DPO Series Oscilloscopes. Basic Concepts
 Getting Started MSO/DPO Series Oscilloscopes Basic Concepts 001-1523-00 Getting Started 1.1 Getting Started What is an oscilloscope? An oscilloscope is a device that draws a graph of an electrical signal.
A METHOD FOR A MODAL MEASUREMENT OF ELECTRICAL MACHINES
 A METHOD FOR A MODAL MEASUREMENT OF ELECTRICAL MACHINES PACS: 43.40.At Sebastian Fingerhuth 1 ; Roman Scharrer 1 ; Knut Kasper 2 1) Institute of Technical Acoustics RWTH Aachen University Neustr. 50 52066
Fundamentals of Vibration Measurement and Analysis Explained
 Fundamentals of Vibration Measurement and Analysis Explained Thanks to Peter Brown for this article. 1. Introduction: The advent of the microprocessor has enormously advanced the process of vibration data
Experiment 1 Alternating Current with Coil and Ohmic Resistors
 Experiment Alternating Current with Coil and Ohmic esistors - Objects of the experiment - Determining the total impedance and the phase shift in a series connection of a coil and a resistor. - Determining
Standing Waves. Equipment
 rev 12/2016 Standing Waves Equipment Qty Items Parts Number 1 String Vibrator WA-9857 1 Mass and Hanger Set ME-8967 1 Pulley ME-9448B 1 Universal Table Clamp ME-9376B 1 Small Rod ME-8988 2 Patch Cords
EFFECTS OF ACCELEROMETER MOUNTING METHODS ON QUALITY OF MEASURED FRF S
 The 21 st International Congress on Sound and Vibration 13-17 July, 2014, Beijing/China EFFECTS OF ACCELEROMETER MOUNTING METHODS ON QUALITY OF MEASURED FRF S Shokrollahi Saeed, Adel Farhad Space Research
MACHINING FORCES FOR ELLIPTICAL VIBRATION-ASSISTED MACHINING 1
 MACHINING ORCES OR ELLIPTICAL VIBRATION-ASSISTED MACHINING 1 D. E. Brehl, M.A. Cerniway, T.A. Dow,and N. Negishi Precision Engineering Center North Carolina State University Raleigh, North Carolina, USA
TKR Protoflight Dynamic Test Readiness Review
 TKR Protoflight Dynamic Test Readiness Review Mike Opie Mike Opie Eric Roulo Eric Roulo mikeopie@slac.stanford.edu mikeopie@slac.stanford.edu eroulo@slac.stanford.edu eroulo@slac.stanford.edu LAT-TD-05386
Bridge Vibrations Excited Through Vibro-Compaction of Bituminous Deck Pavement
 Bridge Vibrations Excited Through Vibro-Compaction of Bituminous Deck Pavement Reto Cantieni rci dynamics, Structural Dynamics Consultants Raubbuehlstr. 21B, CH-8600 Duebendorf, Switzerland Marc Langenegger
Studies on free vibration of FRP aircraft Instruments panel boards
 89 Studies on free vibration of FRP aircraft Instruments panel boards E. Chandrasekaran Professor in Dept. of Civil Engineering, Crescent Engineering College 648 India. e-mail: sekharan@vsnl.net and K.
Sensitivity of frequency response to type of tubing
 1. Introduction Sensitivity of frequency response to type of tubing A.W. Rofail, R. Tonin and D. Hanafi Windtech Consultants Pty Ltd, Sydney Windtech Consultants uses measurements of the frequency response
EIGEN MODES IDENTIFICATION FOR HYBRID WIRE ROPE ISOLATORS
 The 4th International Conference Advanced Composite Materials Engineering COMAT 2012 18-20 October 2012, Brasov, Romania EIGEN MODES IDENTIFICATION FOR HYBRID WIRE ROPE ISOLATORS D. Buzea 1, L. Kopacz
CONSIDERATIONS FOR ACCELEROMETER MOUNTING ON MOTORS
 SENSORS FOR MACHINERY HEALTH MONITORING WHITE PAPER #49 CONSIDERATIONS FOR ACCELEROMETER MOUNTING ON MOTORS ACCELEROMETER SELECTION AND MOUNTING RECOMMENDATIONS FOR VIBRATION ANALYSIS OF MOTORS IN THE
An experimental investigation of cavity noise control using mistuned Helmholtz resonators
 An experimental investigation of cavity noise control using mistuned Helmholtz resonators ABSTRACT V Surya Narayana Reddi CHINTAPALLI; Chandramouli PADMANABHAN 1 Machine Design Section, Department of Mechanical
8th AIAA/CEAS Aeroacoustics Conference June 16 18, 2002/Breckenridge, CO
 AIAA 22-2416 Noise Transmission Characteristics of Damped Plexiglas Windows Gary P. Gibbs, Ralph D. Buehrle, Jacob Klos, Sherilyn A. Brown NASA Langley Research Center, Hampton, VA 23681 8th AIAA/CEAS
5: SOUND WAVES IN TUBES AND RESONANCES INTRODUCTION
 5: SOUND WAVES IN TUBES AND RESONANCES INTRODUCTION So far we have studied oscillations and waves on springs and strings. We have done this because it is comparatively easy to observe wave behavior directly
Chapter 2 Experimental Non-linear Modal Testing of an Aircraft Engine Casing Assembly
 Chapter 2 Experimental Non-linear Modal Testing of an Aircraft Engine Casing Assembly Dario Di Maio, Paul Bennett, Christoph Schwingshackl, and David J. Ewins Abstract This paper aims to present experimental
SILICON DESIGNS, INC Model 1010 DIGITAL ACCELEROMETER
 SILICON DESIGNS, INC Model 1010 DIGITAL ACCELEROMETER CAPACITIVE DIGITAL OUTPUT WIDE TEMPERATURE RANGE SURFACE MOUNT PACKAGE FEATURES Digital Pulse Density Output Low Power Consumption -55 to +125 (C Operation
LIQUID SLOSHING IN FLEXIBLE CONTAINERS, PART 1: TUNING CONTAINER FLEXIBILITY FOR SLOSHING CONTROL
 Fifth International Conference on CFD in the Process Industries CSIRO, Melbourne, Australia 13-15 December 26 LIQUID SLOSHING IN FLEXIBLE CONTAINERS, PART 1: TUNING CONTAINER FLEXIBILITY FOR SLOSHING CONTROL
Proposal. Analysis of Parallel Vibration Paths with Potential Application to Vehicle Noise. Reduction. Submitted to. The Engineering Honors Committee
 Proposal Analysis of Parallel Vibration Paths with Potential Application to Vehicle Noise Reduction Submitted to The Engineering Honors Committee 119 Hitchcock Hall College of Engineering The Ohio State
Vibration Transducer Calibration System
 1 Overview UCON is designed for calibrating sensitivity, frequency response characteristic and amplitude linearity of acceleration transducer. There are three basic operation modes for the calibration
New Long Stroke Vibration Shaker Design using Linear Motor Technology
 New Long Stroke Vibration Shaker Design using Linear Motor Technology The Modal Shop, Inc. A PCB Group Company Patrick Timmons Calibration Systems Engineer Mark Schiefer Senior Scientist Long Stroke Shaker
Lab 2b: Dynamic Response of a Rotor with Shaft Imbalance
 Lab 2b: Dynamic Response of a Rotor with Shaft Imbalance OBJECTIVE: To calibrate an induction position/displacement sensor using a micrometer To calculate and measure the natural frequency of a simply-supported
MIL-STD-202G SHOCK (SPECIFIED PULSE)
") SHOCK (SPECIFIED PULSE) 1. PURPOSE. This test is conducted for the purpose of determining the suitability of component parts and subassemblies of electrical and electronic components when subjected to
SHOCK (SPECIFIED PULSE) 1. PURPOSE. This test is conducted for the purpose of determining the suitability of component parts and subassemblies of electrical and electronic components when subjected to
Resonance and damping characteristics of cryogenic fusion targets
 Resonance and damping characteristics of cryogenic fusion targets Harvest Zhang Brighton High School Rochester, NY Advisor: Mr. L. D. Lund Laboratory for Laser Energetics University of Rochester Rochester,
Amplitude Modulation Methods and Circuits
 Amplitude Modulation Methods and Circuits By: Mark Porubsky Milwaukee Area Technical College Electronic Technology Electronic Communications Milwaukee, WI Purpose: The various parts of this lab unit will
First and second order systems. Part 1: First order systems: RC low pass filter and Thermopile. Goals: Department of Physics
 slide 1 Part 1: First order systems: RC low pass filter and Thermopile Goals: Understand the behavior and how to characterize first order measurement systems Learn how to operate: function generator, oscilloscope,
DESIGN, CONSTRUCTION, AND THE TESTING OF AN ELECTRIC MONOCHORD WITH A TWO-DIMENSIONAL MAGNETIC PICKUP. Michael Dickerson
 DESIGN, CONSTRUCTION, AND THE TESTING OF AN ELECTRIC MONOCHORD WITH A TWO-DIMENSIONAL MAGNETIC PICKUP by Michael Dickerson Submitted to the Department of Physics and Astronomy in partial fulfillment of
Standing waves in a string
 Standing waves in a string Introduction When you shake a string, a pulse travels down its length. When it reaches the end, the pulse can be reflected. A series of regularly occurring pulses will generate
Filters And Waveform Shaping
 Physics 3330 Experiment #3 Fall 2001 Purpose Filters And Waveform Shaping The aim of this experiment is to study the frequency filtering properties of passive (R, C, and L) circuits for sine waves, and
Pressure Response of a Pneumatic System
 Pressure Response of a Pneumatic System by Richard A., PhD rick.beier@okstate.edu Mechanical Engineering Technology Department Oklahoma State University, Stillwater Abstract This paper describes an instructive
Correction for Synchronization Errors in Dynamic Measurements
 Correction for Synchronization Errors in Dynamic Measurements Vasishta Ganguly and Tony L. Schmitz Department of Mechanical Engineering and Engineering Science University of North Carolina at Charlotte
Design of a Piezoelectric-based Structural Health Monitoring System for Damage Detection in Composite Materials
 Design of a Piezoelectric-based Structural Health Monitoring System for Damage Detection in Composite Materials Seth S. Kessler S. Mark Spearing Technology Laboratory for Advanced Composites Department