Research on Experimental Tools for Infrastructure Health Monitoring
|
|
|
- Curtis Wright
- 5 years ago
- Views:
Transcription

1 SAMCO SUMMER WORKSHOP September 6-9, 2005 Research on Experimental Tools for Infrastructure Health Monitoring Emin Aktan, K. Grimmelsman, K. Ciloglu,, Q. Pan, J. Prader Drexel University, Philadelphia, PA, USA
2 Contents Motivations Field: The Seymour Bridge Study Theory/Lab: Cantilever beam and physical phenomenological model with uncertainty Field: Ambient vibration testing of the Henry Hudson and Brooklyn Bridges Summary of lessons learned
3 The Engineer of 2020: Visions of Engineering in the New Century, National Academy of Engineering The engineer of 2020 will need to be conversant with and embrace a whole realm of new technologies, but some old problems are not going to go away. They will demand new attention and, perhaps, new technologies. In some cases their continuing neglect will move them from problems to crises. Physical Infrastructures in Urban Settings: without a sufficient focus on environmental impact and sustainability victims of pollution, traffic and transportation infrastructure concerns, decreasing greenery, poor biodiversity, and disparate educational services. infrastructures are in serious decline, aging water treatment, waste disposal, transportation, and energy facilities are among the top concerns for public officials and citizens alike.
4 Challenges and Opportunities for Civil Engineers Challenges: Civil (and Environmental) Engineering is slipping in its image, worth and societal standing Civil engineers have not been very successful as stewards of infrastructures and constructed systems for safe, effective, sustainable operation, preservation, protection, maintenance, repair, retrofit and replacement Civil engineers should transform systems engineering and associated tools to more effectively address large infrastructure systems problems. We need to re-learn civil engineering by scientific observation, identification, simulation and control of actual operating infrastructure systems by developing and using the proper tools! Opportunity: Properly educated/trained Civil and Environmental Engineers remain essential for leading and coordinating the multi-disciplinary teams and integrating technology and knowledge essential for effective engineering and management of large infrastructure systems.
5 The Health Monitoring Paradigm for Large Infrastructure Systems Health Monitoring: Define and track health by data and analytical simulation so current and expected performance can be described in a proactive manner Health Monitoring paradigm offers great advantages: Objective characterization of health Proactive management of maintenance Enabler of performance-based engineering, intelligent infrastructures and asset management paradigms Reality of lifecycle of constructed infrastructures Requires integrating a spectrum of experimental, analytical, and information technologies System Identification approach offers rational framework for optimum integration of these technologies
6 Classification of Experimental Tools Local NDE Geometry Measure- ment Short-Term (Hours) Structural Testing Load Testing (Static or Quasi-Static Testing) Vibration Analysis (Dynamic Testing) Material Testing Thermal Magnetic Ultrasonic Acoustic Electrical Forced- Vibration by Exciter Electro- Chem Optical Nuclear Surveying GPS Laser Remote Sensing Photo Methods Controlled Measure Input & Outputs Static Trucks Crawling Trucks Special Loading Devices Uncontrolled Measure Outputs Only Input by Traffic Measure Input by WIM & Outputs Input by Traffic Controlled Measure Input & Outputs Impact Uncontrolled Measure Outputs Only Input by Traffic, Wind, Seismic
7 Classification of Experimental Tools Long-Term Monitoring (Months Decades) Low-Bandwidth Measurements Construction Effects Wind/Ambient Weather Conditions Temperature Movements or Displacements Mechanical Variables (Force, Stress, Strain, etc) Deterioration/Damage Effects Changes in: Geometry, Electro-chemical chemical Properties High-Bandwidth Measurements Vibrations Traffic Loads Operations Incidents or Accidents Impacts Earthquake Security Monitoring

8

9

10

11

12
13 Parameter Estimation for MIMO Modal Analysis of Large Structures F. Necati Catbas 1 ; David L. Brown 2 ; and A. Emin Aktan 3 Abstract: EMA Writers were challenged in their attempts to measure the dynamic properties of an aged bridge by EMA due to inconsistencies within the data set due to short-term variations in ambient conditions. A complex interaction was observed between the dynamic properties of the bridge, hour-to-hour temp changes, and controlled damages applied to the bridge. Inconsistencies in the data set made curve fitting difficult for some common parameter estimation algorithms that have been designed to handle consistent data sets. Although the quality of measurements within the entire data set was affected by time variance and nonlinearity, increasing the number of reference measurements significantly improved the reliability of the information which could be extracted. In conjunction with the MIMO technique, a parameter estimation method using CMIF was developed and implemented in this study to determine the modal properties with proper scaling to obtain modal flexibility. This method proved to be successful with the data acquired from the aged and deteriorated highway bridge. Journal of Engineering Mechanics, Vol. 130, No. 8, August 1, 2004.
14 10-6 Complex Mode Indicator Function (CMIF) 10-7 Log Mag Modal Filtering frequency, (Hz) 10-6 Enhanced Frequency Response Function (efrf) Enhanced Mode 10-7 Log Mag frequency, (Hz) CMIF and efrf Plots for Modal Analysis
15 1 kip/point Deflection, (in)x kip = 4.45 kn 1 inch = 2.54 cm 1 mode 5 modes 9 modes 10 modes 12 modes 13 modes Convergence of Girder Deflection by Including Mass-Normal Modes to Modal Flexibility
16 Flexibility Coefficients of Girder 3 Output point (sensor location) Input point (impact hammer) Driving point (input and output) Unit Load Vector on Girder Flexibility Coefficients for Inner Girders Measurement Points [Flexibility]= Coefficients Corresponding to Unmeasured Degrees of Freedom Bridge Girder Condition Indicator for Girder 3 [Defl.] = 0 0 =.... [F] 0 Zero Load On Other Girders Zero Deflection On Other Girders Reduced Flexibility Matrix from Abbreviated -MIMO Tests
17 Mode Hz Mode Hz Mode Hz Mode Hz Mode Hz Mode Hz Mode Hz Mode Hz Mode Hz Mode Hz Mode Hz Mode Hz Mode Hz Mode Hz Mode Hz, Mode Hz Mode Hz Mode Hz Mode Hz Mode Hz Frequency and Mode Shape Comparison for Seymour Bridge Tests: (a) Inner Girders only; (b) All 6 Girders
18 kips 30 kips N Girder Dynamic Test 2 Inner Girder Dynamic Test Truck Load Instrumentation Reading Deflection, in. 1 kip = 4.45 kn 1 inch = 2.54 cm Correlation of High and Low Spatial Resolution Modal Tests with Truck Load Test
19 1 kip/point Welding and Restoration of BCs ~10% ~50% ~65% After 1/2 Flange After 2/2 Flange After Web Cut After X-Brace Cut /4 Welding/Restoration of BC's 10/14 After 1/2 Flange Cut at Girder 4 at South Span 10/21 After 2/2 Flange Cut at Girder 4 at South Span 10/29 After Web Cut at Girder 4 at South Span 10/30 After X-Brace Cut at South Span ~10% ~50% ~65% Deflection (in) UNIT LOAD PATTERN M 1 kip/point Removed Bearing Flange/Web Cut Location (2" to the South of Point 4M) X-Bracing Cut Location Girder 4 N Damage Location 1 kip = 4.45 kn 1 inch = 2.54 cm Sensitivity of Bridge Girder Condition Indicator to Damage
20 1 kip/point Test Set 1 11% change at damage location Test Set Test Set 2 10% change at damage location Test Set 1 Deflection (in) 9/30 Before Flange Cut Damage (1) 10/4 Before Flange Cut Damage (2) Average Change, μ = 7.7% Standard Dev., σ = 5.4% Test Set 2 Test Set 1 Damage Location 10/14 After Flange Cut Damage (1) 10/14 After Flange Cut Damage (2) Average Change, μ = 4.3% Standard Dev., σ = 4.2% 1 kip = 4.45 kn 1 inch = 2.54 cm Variability of BGCI Deflections from Different Tests for the Same Condition


21 SUBJECTIVE vs OBJECTIVE RATING OF SEYMOUR AVE. BRIDGE As-Is Condition BARS RF FEM Description (ODOT) RF Operating Rating Level Steel Damage Description FEM RF Operating Rating Level 3.29 Concrete Damage Description FEM RF Operating Rating Level 3.10 SUBJECTIVE ANALYSIS Fair Condition - Primary structural elements are sound, but have minor section loss. Secondary elements have significant deterioration. Poor Condition - Advanced section loss, deterioration or spalling. Bridge Inspectors - Shut down the bridge. The damages need to be repaired immediately. Consulting Engineers - There really isn't an immediate concern, but the repair would have to be fixed. The bridge can still carry its required capacity. Bridge Inspectors - Not a problem. The bridge was not designed as a composite. Consulting Engineers - Not a problem. The bridge was not designed as composite.
22 Some Important Conclusions of the Seymour Bridge Study (95-97) 97) Modal analysis of the highly non-stationary constructed system were not successful until short-time time MIMO tests were executed during periods of near-constant temperature. Many modal parameter identification algorithms were unsuccessful due to non-stationarity and highly coupled and damped modes. Even after mitigating non-stationarity stationarity,, a mode (#3) critical for modal flexibility could not be identified until a new CMIF based parameter estimation method was devised. Modal flexibility proved successful as a damage index. Ambient monitoring was not reliable and could not lead to identifying parameters comparable to those from MIMO. The structure, environment, damage, experiment and post- processing proved to be a highly coupled system


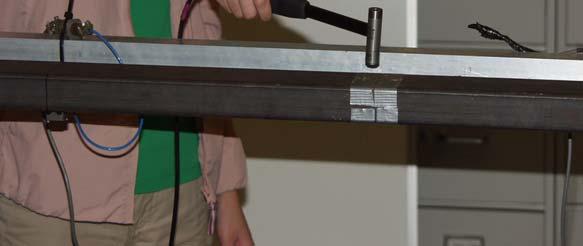
23 Idealized Physical Model of a Cantilever Beam Accel: = Support Steel Tube Section 3 x 1.5 x Instrumented Cantilever Beam
24 Dynamic Testing of a Cantilever Beam Laboratory Testing: Simple structure under near ideal conditions Analytical and experimental characterization Excitation: (1) random base, (2) random taps on beam (spatially distributed excitation), (3) No input, and (4) MIMO impact Test Objectives: Calibration of different dynamic test and data processing methods Identify, characterize, and mitigate sources of uncertainty
25 Partial Differential Equation Solution Solution for cantilever with distributed mass and stiffness (ignoring shear force and rotary motion): (Basic Equation for Lateral Vibration of Beams) 2 x 2 EI 2 x y 2 = γs g 2 t y 2 κ 4 = 2 ω n γs EIg (Substitute) cosκl coshκl ω 4 d X 4 = κ X X = A sin κx A cosκx A sinh κx A cosh κx dx (After Applying B.C.s) n (Solving κ) = κ 2 n = 1 EIg γs ω1 = rad/s ω2 = rad/s ω3 = rad/s (Solution to Equation) ω4 = e+003 rad/s ω5 = e+003 rad/s f1 = Hz f2 = Hz f3 = Hz f4 = Hz f5 = Hz
26 Partial Differential Equation Solution Classical solution method for cantilever beam with distributed mass and stiffness (ignores shear force and rotary motion) Natural Frequencies: f1 = Hz f2 = Hz f3 = Hz f4 = Hz Amplitude Mode Shapes for Cantilever Beam with Distributed Properties Datum Mode 1 Mode 2 Mode 3 Mode 4 Mode 5 f5 = Hz Distance from Fixed End (in)
27 Laboratory Testing Overview Experimental Testing Static Testing Dynamic Testing Controlled Input Controlled Input Controlled Initial Conditions Ambient Vibration Static Flexibility Impact Pull-Release Random Taps on Beam Random Base Excitation Pre-Processing Processing Pre-Processing Processing Time Domain Algorithms Frequency Domain Algorithms Time Domain Algorithms Frequency Domain Algorithms Frequencies, Mode Shapes, Damping & Modal Flexibility Frequencies, Mode Shapes & Damping


28 Cantilever Testing

29 Accelerometer Calibration
30 Time Domain Segments Modal Shape Estimation - DFT FFT 1 FFT 2 FFT 3 FFT 4 Magnitude Phase Magnitude Phase Magnitude Magnitude Phase Phase FFT n Magnitude Phase Average Magnitude Average Phase PHASE (deg) MAGNITUDE (g) 10 4 FFT MAGNITUDE - RMS, Record Length = 10 minutes Frequency (Hz) FFT PHASE, Record Length = 10 minutes No. of Averages = 118 Phase Information is Poor Ch01 Ch02 Ch03 Ch04 Ch05 Ch06 Ch01 Ch02 Ch03 Ch04 Ch05 Ch06 RMS Average: Magnitude & phase calculated for FFT of each segment. Magnitude and phase results are averaged for all segments. 1 Sensor channels Frequency (Hz)
31 Time Domain Segments Modal Shape Estimation - DFT FFT 1 FFT 2 FFT 3 FFT 4 Real Part Imag. Part Real Part Imag. Part Real Part Imag. Part Real Part Imag. Part FFT n Real Part Imag. Part Avg. Real Parts + Avg. Imaginary Parts MAGNITUDE (g) 10 2 FFT MAGNITUDE - VECTOR AVG, Record Length = 10 minutes No. of Averages = 118 Magnitude Spectra are Noisy Frequency (Hz) FFT PHASE - VECTOR AVG, Record Length = 10 minutes Ch01 Ch02 Ch03 Ch04 Ch05 Ch06 Magnitude & Phase Vector Average: Real and imaginary parts of each FFT segment are averaged separately. PHASE (deg) Phase Information is Good Ch01 Ch02 Ch03 Ch04 Ch05 Ch06 1 Sensor channels Frequency (Hz)
32 Modal Shape Estimation - DFT MAGNITUDE (g) 10 4 FFT MAGNITUDE - RMS, Record Length = 10 minutes No. of Averages = Frequency (Hz) Ch01 Ch02 Ch03 Ch04 Ch05 Ch06 Hybrid Approach: RMS Avg. of FFT for Amplitude and Vector Avg. of FFT for Phase FFT PHASE - VECTOR AVG, Record Length = 10 minutes PHASE (deg) Ch01 Ch02 Ch03 Ch04 Ch05 Ch06 1 Sensor channels Frequency (Hz)
33 Frequency Correlation Frequency Correlation 1.223% 1.223% 1.174% 1.174% 1.101% 1.101% 1.315% 1.315% 1.355% 1.355% % 2.483% % % % 0.212% % 0.550% % 0.429% % 0.295% % 0.397% % 3.230% % % % 0.798% % 1.248% % 1.248% % 1.097% % 1.251% % 3.832% 5.852% 5.852% % 0.376% % 0.927% % 0.927% % 0.576% % 0.987% % 4.257% 1.882% 1.882% % 0.100% 0.124% 0.124% 0.124% 0.124% % 2.977% % 0.889% % 4.532% 2.644% 2.644% DOF 320 DOF 5 DOF 5 DOF Freq Freq (Hz) (Hz) Mode Mode Random Random Exc Exc at at Base Base No No Special Special Input Input Random Random Impact Impact Impact Impact Best Best Practice Practice Impact Impact SAP 2000 SAP 2000 Closed Closed Form Form Experimental Experimental Theory Theory

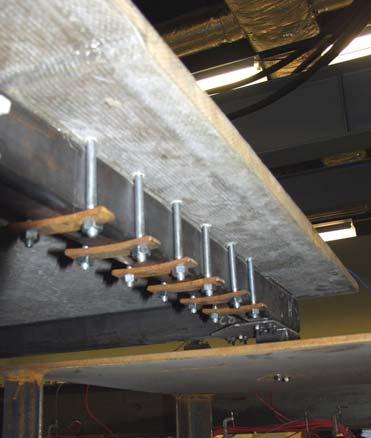

34 Physical Model CONNECTIONS SUPPORTS


35 Dynamic Test Parameter Selection FEM used as a reference point to identify the bandwidth of interest for dynamic testing Convergence between the modal flexibility calculated from dynamic FEA and static FEA used as an indicator of number modes that need be identified by the impact test FEM of the Physical Model Selected Parameters: Sampling Frequency: 200Hz Data Length: 2048 (10.24 sec)
36 Impact Test Results Comparison PTD vs. CMIF with Nominal Boundary Conditions CMIF Mode# CMIF Freq CMIF Damp PTD Mode# PTD Freq PTD Damp MAC
37 Impact Test Mode Shapes Identified by CMIF Method Mode Hz Mode Hz Mode Hz MAC ptd =1.000 MAC ptd =1.000 MAC ptd =1.000 Mode Hz Mode Hz Mode Hz MAC ptd =0.999 MAC ptd =0.996 MAC ptd =NA

38 Ambient Input Application Random forcing function was applied in Hz frequency band Shaker location

39 Modal Parameter Identification using Ambient Vibration Data
40 CMIF Plot & Resulting Modes with Nominal Boundary Conditions Nonparametric Approach Mode 2 Mode 3 Mode Hz MAC Impact = Hz MAC Impact =NA Hz MAC Impact =NA Only one out of first Four modes was found
41 Prony s Method for Conditioning RD Results Prony's method is a technique for extracting the sinusoid or exponential signals by solving a set of linear equations for the coefficients of the recurrence equation that the signals satisfy. Infinite impulse response (IIR) filter coefficients a and b may be calculated by Prony s method from time domain impulse response i.e. the result of random decrement process.


42 Comparison of Raw RD & Conditioned RD Results with Nominal Boundary Conditions Standard RD-CMIF Application RD IRF. Exp. Window Applied CMIF Conditioned RD Application RD IRF. Prony s Method Time Dom. IIR Filter Parameters (a & b) Back Calculated IRF CMIF

43 CMIF Plot & Resulting Modes with Nominal Boundary Conditions Parametric Approach Mode 2 Mode 3 MAC Impact = Hz Mode 1 MAC Impact = Hz Mode Hz MAC Impact = Hz MAC Impact =0.981
44 Some Sources of Uncertainty in Vibration Testing INPUT Non-stationary Echoes/Reflections Bandwidth Directionality Select Harmonics Interference/Noise TEST DESIGN STRUCTURAL SYSTEM Non-stationarity due to changes in environment Nonlinearity Incomplete free body/appendage tests Lack of observability due to insufficient sensor density Scale-induced complexity OUTPUT (DATA) Asynchronous Filters Sensor calibration Noise & bias Spurious pulses Bandwidth Window length Freq. resolution DATA PROCESSING Data quality measures Error ID/Cleaning Filtering, averaging, and windowing Post-processing Access Excitation Sensor density and modality Diagnose/Mitigate malfunctions VERIFICATION Modality Independence PARAMETER ID Parameter grouping Sensitivity Bandwidth Modality Objective Function Optimization ANALYTICAL MODEL Completeness Material variability Geometry BC & CC Temporal/spatial Nonlinearity & nonstationarity MECH PROPERTIES Frequency band Modal order Spatial adequacy 3D vs. idealized Separation Amplitude & phase Damping
45 Types of Uncertainty Affecting Reliability of Field Measurements EU - LUP Human Errors (HE) Inattention/Thoughtlessness Inexperience Omission (Forgetfulness) Commission (Bad Design) HE RP EU - UP Random Phenomena (RP) Epistemic Uncertainty (EU) Less Understood Phenomena (LUP) Unknown Phenomena (UP)
46 Preliminary Conclusions Input, structure, output, experimental setup, data processing, and other systems such as environment act as one interconnected system in an experiment Each element above contributes many components of uncertainty to the experiment Even when we experiment in laboratory with idealized physical models, we observe some mechanisms of uncertainty that impact the reliability of the results obtained by different input/post-processing processing combinations We were able to identify all 5 frequencies and mode shapes of the cantilever with reasonable accuracy irrespective of test/processing; however, this was not the case when we tested a more complex model Uncertainty due to supports and excitation and human error/inexperience emerge as significant barriers
47 Dynamic Testing of Bridges Typical applications: System identification for FE model calibration (i.e. seismic retrofits, baseline for HM) Damage detection/diagnosis Two common implementations: (1) Forced- Excitation Test and (2) Ambient Vibration Test Forced-vibration testing is not always feasible Fundamental assumptions regarding structure under test: (1) linear, (2) stationary, and (3) observable
48 Ambient Vibration Testing Objective: Extract modal parameters (frequencies, mode shapes, and damping) from structure subject to random dynamic excitation Damping estimates not very reliable Dynamic excitation is not measurable Typical sources of excitation for bridges include traffic, wind, pedestrians and micro-tremors (ground motions) Excitation is assumed to be stationary and broad-band, band, Gaussian white noise

49 Henry Hudson Bridge South Approach South Viaduct South Tower Arch Span North Tower North Viaduct North Approach 94 m 91 m 256 m 91 m 82 m Manhattan EAST ELEVATION The Bronx


50 Henry Hudson Bridge
51 Description of Experiment Ambient vibration testing of arch and viaduct spans conducted in two stages Fixed array of accelerometers used for both stages 36 accelerometers used for Stage 1 and 40 accelerometers used for Stage 2 9 accelerometer locations common to both stages Mix of ICP and capacitive accelerometers used Data sampled primarily at 200 Hz in 15 minute records Monitor for 1 week during each test stage
52 Instrumentation Plan Stage 2 Test Setup Stage 1 Test Setup Upper Level L L V CL Arch T T T L L T V T T T T V T L L V V V L L T T T Lower Level T T T V T V V T V T V T T South Viaduct Tower T T T T T T Tower North Viaduct East Elevation T East Side Transverse Accelerometer V East Side Vertical Accelerometer L East Side Longitudinal Accelerometer T West Side Transverse Accelerometer V West Side Vertical Accelerometer L West Side Longitudinal Accelerometer V T V T Sensors used in Stage 1 & Stage 2 Tests


53 Sensors and Data Acquisition
54 Raw Data with Errors Arch - Transverse Viaduct - Transverse


55 Raw Data with Bias Error Tower Longitudinal Tower Longitudinal Capacitive Accelerometers Tower Longitudinal


56 Data with Different Amplitudes High Amplitude Data Arch - Vertical Arch - Transverse Low Amplitude Data

57 Filtered Data Arch - Vertical Arch - Transverse
58 Conditioned Data for Vertical Channels No Window or Averaging Hanning Window & Ensemble Averaging
59 Ambient Test Results Mode Stage 1 Test Combination of Stage 1 & Stage 2 Tests Mode Description Hz Hz Transverse Hz Hz Vertical Hz Hz Vertical Hz Hz Transverse Hz Hz Vertical Hz Transverse Hz Hz Torsional Hz Vertical Hz Transverse Hz Transverse Hz Transverse Hz Hz Vertical Hz Torsional Hz Vertical
60 FE Model of Bridge in SAP2000
61 FEM & Experimental Results Mode Initial FE Model FE Model Modified CC & Joint Mass Ambient Test Mode Description Hz Hz Hz Transverse Hz Hz Hz Vertical Hz Hz Hz Vertical Hz Hz Hz Transverse Hz Hz Hz Vertical Hz Hz Hz Transverse Hz Hz Torsional Hz Hz Vertical Hz Hz Transverse Hz Transverse Hz Hz Transverse Hz Hz Hz Vertical Hz Hz Torsional Hz Hz Vertical
62 Mode Shape Comparison FE Mode 1 f = Hz Projection of Mode Shape Points Transverse Mode 1, Test = Hz, SAP=0.588 Hz SAP_ARC SAP _LL SAP_UL T_ARC T_LL T_UL Distance (ft)
63 Mode Shape Comparison FE Mode 2 f = Hz Projection of Mode Shape Points Vertical Mode 1, Test = Hz, SAP = Hz SAP TEST Distance (ft)

64 Mode Shape Comparison FE Mode 3 f = Hz Projection of Mode Shape Points 0.80 Vertical Mode 2, Test = Hz, SAP = Hz SAP TEST Distance (ft)
65 Mode Shape Comparison Mode 4 f = Hz Transverse Mode 2, Test = Hz, SAP = Hz SAP_ARC SAP _LL SAP_UL T_ARC T_LL 800 Distance (ft) T_UL
66 Conclusions Most uncertainty was associated with data errors a challenge not really faced in laboratory Most data errors can be removed by digital signal processing, provided test design is adequate Primary excitation was traffic and this was spatially distributed due to type of structure Uncertainty due to non-stationary structure painting equipment removed between stages and temperature effects on structure Reasonable correlation of experiment and model with modified boundary conditions


67 Ambient Vibration Testing of the Brooklyn Bridge
68 Scope and Objectives Ambient vibration testing a component of seismic evaluation and retrofit study Results used for system identification to improve reliability of FE models Focus on towers, but span responses also measured Identify frequencies, mode shapes and damping
69 Description of Experiment Wind speed and direction measured Ambient temperature measurements Dynamic range adjusted after observing actual responses minimum range utilized Over 100 data sets sampled at Hz with a fixed array of 43 accelerometers Long data records hours to days Measurements recorded over a month
70 Level H Tower Instrumentation Scheme Level G Level F Level E Level C Level B Level D Level A Brooklyn Tower Elevation Manhattan Tower Elevation
71 Span Instrumentation Scheme V T V T V T Brooklyn Bound Traffic Lanes Side Span V V T Brooklyn Tower Main Span Manhattan Bound Traffic Lanes V V V Partial Plan
72 Accelerometer Layout for Spans Pedestrian Walkway Outer Truss Inner Truss Inner Truss Outer Truss Roadway Roadway V T V STIFFENING TRUSSES Cross Section T L Transverse Accelerometer Longitudinal Accelerometer


73 Accelerometer Installation
74 Uncertainty in Experiment Spurious spikes in data remove during preprocessing Quality of ambient excitation: Low level excitation Non-stationary excitation Ambient excitation primarily from traffic on spans transfer to tower only occurs through connections with deck, main cables, and stays Identification of critical tower modes Damping estimates
75 Comparison of Tower and Span Ambient Responses Acceleration (g) Filtered Time Domain Data for Several Span & Brooklyn Tower Top Sensors HNL N51V N59V S51T HST Time (s) Acceleration (g) Zoomed View of Filtered Time Domain Data for Several Span & Brooklyn Tower Top Sensors Tower Accelerations (Top) Span Accelerations HNL N51V N59V S51T HST Time (s)
76 Effect of Spurious Spikes x 10-4 Filtered Time Domain Data with Noise for Channel #13 Acceleration (g) Typ.. Spikes Time (sec) PSD for Channel #13 PSD (g 2 /Hz) With Noise Avg of Segements Segments Composite of Valid Segments Composite of All Segments Frequency (Hz)
77 N M S Non-Stationary Excitation Frequency Domain Tower Transverse Acceleration (22-NOV NOV-04 16:01 20:00) H G g 2 /Hz 10-6 Brooklyn Tower Transverse - 16:01 to 20:00 - Bandpass 0.3 to 10.0 Hz HST GMT FST EST CST BST FNT FMT GST Duration = 4 Hours F E C B g 2 /Hz Frequency (Hz) Hz Average Normalized PSD ANPSD-T Hz Hz, Hz Hz, Hz Hz Frequency (Hz)
78 Non-Stationary Excitation Time Domain Amplitude Tower Transverse Acceleration (22-NOV NOV-04 17:01 17:16) H G Acceleration (g) 5 x HST Acceleration (g) 5 x GMT F E C Acceleration (g) x 10-4 Time (s) 0 FST Acceleration (g) x 10-4 Time (s) 0 EST B Acceleration (g) x 10-4 Time (s) 0 CST Acceleration (g) x 10-4 Time (s) 0 BST Duration = 15 minutes Time (s) Time (s)
79 Non-Stationary Excitation Frequency Domain Tower Transverse Acceleration (22-NOV NOV-04 17:01 17:16) H G PSD (g 2 /Hz) HST PSD (g 2 /Hz) GMT F E C PSD (g 2 /Hz) Frequency (Hz) FST PSD (g 2 /Hz) Frequency (Hz) EST B Frequency (Hz) CST Frequency (Hz) BST PSD (g 2 /Hz) PSD (g 2 /Hz) Frequency (Hz) Frequency (Hz)
80 Non-Stationary Excitation Time Domain Amplitude Tower Transverse Acceleration (22-NOV NOV-04 18:31 18:46) H G F E Acceleration (g) Acceleration (g) 5 x HST x 10-4 Time (s) 0 FST Acceleration (g) Acceleration (g) 5 x GMT x 10-4 Time (s) 0 EST C B Acceleration (g) x 10-4 Time (s) 0 CST Acceleration (g) x 10-4 Time (s) 0 BST Duration = 15 minutes Time (s) Time (s)
81 Non-Stationary Excitation Frequency Domain Tower Transverse Acceleration (22-NOV NOV-04 18:31 18:46) H 10-6 HST 10-6 GMT G F PSD (g 2 /Hz) Frequency (Hz) FST PSD (g 2 /Hz) Frequency (Hz) EST E PSD (g 2 /Hz) PSD (g 2 /Hz) C B Frequency (Hz) CST Frequency (Hz) BST PSD (g 2 /Hz) PSD (g 2 /Hz) Frequency (Hz) Frequency (Hz)
 Phase (radians) 2 0-2 B 0 1 2 3 4 5 6 Frequency (Hz) 1 COHERENCE 0.")
82 Cross Spectral Density & Coherence Top and Bottom Level Transverse Accelerometers 10-5 CSD OUT=BST, REF=HST H Magnitude (g 2 /Hz) Frequency (Hz) Phase (radians) B Frequency (Hz) 1 COHERENCE Frequency (Hz)
83 Tower Excitation from Traffic Amplitude (g) 0 fmax Ideal Excitation f (Hz) Amplitude (g) 0 fmax More Probable Excitation f (Hz)

84 Analytical Model of Isolated Tower 3D Tower Cross-Sections of Different Tower Levels
85 Analytical Model Results for Tower Mode 1 1st Long Hz Mode 2 1st Tran Hz Mode 3 1st Tor Hz Mode 4 2nd Long Hz Mode 5 2nd Tran Hz Mode 6 2nd Tor Hz
86 Tower Longitudinal Mode Shapes Height Above Base (ft) Tower Top Bold shapes have best coherence & largest peak in frequency spectra Tower Base BROOKLYN TOWER LONGITUDINAL MODE SHAPES Normalized Amplitude
87 Tower Lateral Mode Shapes Middle Tower Leg Sensors at Level F and Level G BROOKLYN TOWER LATERAL MODE SHAPES Middle Leg Transverse Sensors at Level F and Level G Tower Top Height Above Base (ft) Bold shapes have best coherence & largest peak in frequency spectra Tower Base Normalized Amplitude
88 Tower Torsional Mode Shapes BROOKLYN TOWER TORSIONAL MODE SHAPES Tower Top Height Above Base (ft) Tower Base Normalized Amplitude Bold shapes have best coherence & largest peak in frequency spectra
89 Identified Tower Modes Mode Frequency (Hz) Description 1 st Longitudinal Mode 1 st Lateral Mode 1 st Torsional Mode 2 nd Longitudinal Mode 2 nd Lateral Mode Coupled lateral and longitudinal mode
90 Conclusions Uncertainty due to data quality and errors (bias error, spikes) corrected through digital signal processing and manual removal of spikes Uncertain excitation due to transfer of traffic excitation through structural connections to the towers Non-stationary excitation sample for longer time Tower modes coupled with span modes reflection of motions between the two components Uncertainty related to extracting the more critical tower modes from the coupled modes of the spans and towers Seismic evaluation requires identifying those modes that determine the tower demands during earthquake - tbd
91 Conclusions Dynamic testing and modal analysis of real structures are often driven by real engineering objectives A process oriented approach to taking data, processing, and identifying the modal properties may fail to satisfy the real engineering objectives The physics of the problem must be considered during each stage of experiment and analysis so that we may reach meaningful interpretations of the results we cannot simply present a large quantity of identified frequencies/mode shapes for the purpose of seismic retrofitting Although many peaks in PSD may correspond to mathematical normal modes, identifying the subset associated with resonant motion of the tower is essential and this represents a significant challenge in ambient vibration testing
92 Summary The mechanisms of uncertainty in dynamic testing of actual structures are abundant Explicit consideration and mitigation of uncertainty in test design, execution, processing, and interpretation is critical for providing real engineering benefits from the experiment Although some uncertainty can be mitigated through proper design and execution of a field experiment, we may have to accept that some level of uncertainty will always remain heuristics related to structure and test objectives an important component of interpretation and decision making based on experiment
93 Relationship Between Uncertainty and Risk Threat/ Hazard Vulnerability Consequences
EXPERIMENTAL MODAL AND AERODYNAMIC ANALYSIS OF A LARGE SPAN CABLE-STAYED BRIDGE
 The Seventh Asia-Pacific Conference on Wind Engineering, November 82, 29, Taipei, Taiwan EXPERIMENTAL MODAL AND AERODYNAMIC ANALYSIS OF A LARGE SPAN CABLE-STAYED BRIDGE Chern-Hwa Chen, Jwo-Hua Chen 2,
Dynamic Excitation Related Uncertainty in Ambient Vibration Testing of a Truss Bridge
 University of Arkansas, Fayetteville ScholarWorks@UARK Civil Engineering Undergraduate Honors Theses Civil Engineering 5-2014 Dynamic Excitation Related Uncertainty in Ambient Vibration Testing of a Truss
Effect of temperature on modal characteristics of steel-concrete composite bridges: Field testing
 4th International Conference on Structural Health Monitoring on Intelligent Infrastructure (SHMII-4) 2009 Abstract of Paper No: XXX Effect of temperature on modal characteristics of steel-concrete composite
University of Molise Engineering Faculty Dept. SAVA Engineering & Environment Section. C. Rainieri, G. Fabbrocino
 University of Molise Engineering Faculty Dept. SAVA Engineering & Environment Section C. Rainieri, G. Fabbrocino Operational Modal Analysis: overview and applications Carlo Rainieri Strucutural and Geotechnical
REAL TIME VISUALIZATION OF STRUCTURAL RESPONSE WITH WIRELESS MEMS SENSORS
 13 th World Conference on Earthquake Engineering Vancouver, B.C., Canada August 1-6, 24 Paper No. 121 REAL TIME VISUALIZATION OF STRUCTURAL RESPONSE WITH WIRELESS MEMS SENSORS Hung-Chi Chung 1, Tomoyuki
Model Correlation of Dynamic Non-linear Bearing Behavior in a Generator
 Model Correlation of Dynamic Non-linear Bearing Behavior in a Generator Dean Ford, Greg Holbrook, Steve Shields and Kevin Whitacre Delphi Automotive Systems, Energy & Chassis Systems Abstract Efforts to
DYNAMIC CHARACTERISTICS OF A BRIDGE ESTIMATED WITH NEW BOLT-TYPE SENSOR, AMBIENT VIBRATION MEASUREMENTS AND FINITE ELEMENT ANALYSIS
 C. Cuadra, et al., Int. J. of Safety and Security Eng., Vol. 6, No. 1 (2016) 40 52 DYNAMIC CHARACTERISTICS OF A BRIDGE ESTIMATED WITH NEW BOLT-TYPE SENSOR, AMBIENT VIBRATION MEASUREMENTS AND FINITE ELEMENT
MODEL MODIFICATION OF WIRA CENTER MEMBER BAR
 MODEL MODIFICATION OF WIRA CENTER MEMBER BAR F.R.M. Romlay & M.S.M. Sani Faculty of Mechanical Engineering Kolej Universiti Kejuruteraan & Teknologi Malaysia (KUKTEM), Karung Berkunci 12 25000 Kuantan
Clarification of the Effect of High-Speed Train Induced Vibrations on a Railway Steel Box Girder Bridge Using Laser Doppler Vibrometer
 Clarification of the Effect of High-Speed Train Induced Vibrations on a Railway Steel Box Girder Bridge Using Laser Doppler Vibrometer T. Miyashita, H. Ishii, Y. Fujino Dept of Civil Engineering, University
Paper Title: FIELD MONITORING OF FATIGUE CRACK ON HIGHWAY STEEL I- GIRDER BRIDGE
 Zhang, Zhou, Fu and Zhou Paper Title: FIELD MONITORING OF FATIGUE CRACK ON HIGHWAY STEEL I- GIRDER BRIDGE Author: Author: Author: Author: Call Title: Yunfeng Zhang, Ph.D. Associate Professor Department
Natural Frequencies and Resonance
 Natural Frequencies and Resonance A description and applications of natural frequencies and resonance commonly found in industrial applications Beaumont Vibration Institute Annual Seminar Beaumont, TX
Experimental investigation of crack in aluminum cantilever beam using vibration monitoring technique
 International Journal of Computational Engineering Research Vol, 04 Issue, 4 Experimental investigation of crack in aluminum cantilever beam using vibration monitoring technique 1, Akhilesh Kumar, & 2,
Texas Components - Data Sheet. The TX53G1 is an extremely rugged, low distortion, wide dynamic range sensor. suspending Fluid.
 Texas Components - Data Sheet AN004 REV A 08/30/99 DESCRIPTION and CHARACTERISTICS of the TX53G1 HIGH PERFORMANCE GEOPHONE The TX53G1 is an extremely rugged, low distortion, wide dynamic range sensor.
Modal Parameter Estimation Using Acoustic Modal Analysis
 Proceedings of the IMAC-XXVIII February 1 4, 2010, Jacksonville, Florida USA 2010 Society for Experimental Mechanics Inc. Modal Parameter Estimation Using Acoustic Modal Analysis W. Elwali, H. Satakopan,
Response spectrum Time history Power Spectral Density, PSD
 A description is given of one way to implement an earthquake test where the test severities are specified by time histories. The test is done by using a biaxial computer aided servohydraulic test rig.
Application of optical measurement techniques for experimental modal analyses of lightweight structures
 Application of optical measurement techniques for experimental modal analyses of lightweight structures C. Schedlinski, J. Schell, E. Biegler, J. Sauer ICS Engineering GmbH Am Lachengraben, Dreieich, Germany
sin(wt) y(t) Exciter Vibrating armature ENME599 1
 y(t) Exciter Vibrating armature ENME599 1") ENME599 1 LAB #3: Kinematic Excitation (Forced Vibration) of a SDOF system Students must read the laboratory instruction manual prior to the lab session. The lab report must be submitted in the beginning
ENME599 1 LAB #3: Kinematic Excitation (Forced Vibration) of a SDOF system Students must read the laboratory instruction manual prior to the lab session. The lab report must be submitted in the beginning
MODAL IDENTIFICATION OF BILL EMERSON BRIDGE
 The 4 th World Conference on Earthquake Engineering October -7, 8, Beijing, China MODAL IDENTIFICATION OF BILL EMERSON BRIDGE Y.. hang, J.M. Caicedo, S.H. SIM 3, C.M. Chang 3, B.F. Spencer 4, Jr and. Guo
How to perform transfer path analysis
 Siemens PLM Software How to perform transfer path analysis How are transfer paths measured To create a TPA model the global system has to be divided into an active and a passive part, the former containing
Dynamic Vibration Absorber
 Part 1B Experimental Engineering Integrated Coursework Location: DPO Experiment A1 (Short) Dynamic Vibration Absorber Please bring your mechanics data book and your results from first year experiment 7
Development of Optimal Experimental Design Parameters for Pseudo Ambient Vibration Testing of Bridges
 University of Arkansas, Fayetteville ScholarWorks@UARK Civil Engineering Undergraduate Honors Theses Civil Engineering 5-2015 Development of Optimal Experimental Design Parameters for Pseudo Ambient Vibration
SHOCK RESPONSE SPECTRUM SYNTHESIS VIA DAMPED SINUSOIDS Revision B
 SHOCK RESPONSE SPECTRUM SYNTHESIS VIA DAMPED SINUSOIDS Revision B By Tom Irvine Email: tomirvine@aol.com April 5, 2012 Introduction Mechanical shock can cause electronic components to fail. Crystal oscillators
Fundamentals of Structural Dynamics
 Fundamentals of Structural Dynamics Smarter decisions, better products. Structural Dynamics Agenda Topics How to characterize structural behavior? Fundamentals Natural Frequencies, Resonances, Damping
Filling in the MIMO Matrix Part 2 Time Waveform Replication Tests Using Field Data
 Filling in the MIMO Matrix Part 2 Time Waveform Replication Tests Using Field Data Marcos Underwood, Russ Ayres, and Tony Keller, Spectral Dynamics, Inc., San Jose, California There is currently quite
Vibration Fundamentals Training System
 Vibration Fundamentals Training System Hands-On Turnkey System for Teaching Vibration Fundamentals An Ideal Tool for Optimizing Your Vibration Class Curriculum The Vibration Fundamentals Training System
LONG-TERM MONITORING OF SEOHAE CABLE-STAYED BRIDGE USING GNSS AND SHMS
 Istanbul Bridge Conference August 11-13, 2014 Istanbul, Turkey LONG-TERM MONITORING OF SEOHAE CABLE-STAYED BRIDGE USING GNSS AND SHMS J. C. Park 1 and J. I. Shin 2 and H. J. Kim 3 ABSTRACT The Seohae cable-stayed
A METHOD FOR OPTIMAL RECONSTRUCTION OF VELOCITY RESPONSE USING EXPERIMENTAL DISPLACEMENT AND ACCELERATION SIGNALS
 ICSV14 Cairns Australia 9-12 July, 27 A METHOD FOR OPTIMAL RECONSTRUCTION OF VELOCITY RESPONSE USING EXPERIMENTAL DISPLACEMENT AND ACCELERATION SIGNALS Gareth J. Bennett 1 *, José Antunes 2, John A. Fitzpatrick
Spatial coherency of earthquake-induced ground accelerations recorded by 100-Station of Istanbul Rapid Response Network
 Spatial coherency of -induced ground accelerations recorded by 100-Station of Istanbul Rapid Response Network Ebru Harmandar, Eser Cakti, Mustafa Erdik Kandilli Observatory and Earthquake Research Institute,
Borehole vibration response to hydraulic fracture pressure
 Borehole vibration response to hydraulic fracture pressure Andy St-Onge* 1a, David W. Eaton 1b, and Adam Pidlisecky 1c 1 Department of Geoscience, University of Calgary, 2500 University Drive NW Calgary,
New Long Stroke Vibration Shaker Design using Linear Motor Technology
 New Long Stroke Vibration Shaker Design using Linear Motor Technology The Modal Shop, Inc. A PCB Group Company Patrick Timmons Calibration Systems Engineer Mark Schiefer Senior Scientist Long Stroke Shaker
Modal Parameter Identification of A Continuous Beam Bridge by Using Grouped Response Measurements
 Modal Parameter Identification of A Continuous Beam Bridge by Using Grouped Response Measurements Hasan CEYLAN and Gürsoy TURAN 2 Research and Teaching Assistant, Izmir Institute of Technology, Izmir,
SHAKER TABLE SEISMIC TESTING OF EQUIPMENT USING HISTORICAL STRONG MOTION DATA SCALED TO SATISFY A SHOCK RESPONSE SPECTRUM
 SHAKER TABLE SEISMIC TESTING OF EQUIPMENT USING HISTORICAL STRONG MOTION DATA SCALED TO SATISFY A SHOCK RESPONSE SPECTRUM By Tom Irvine Email: tomirvine@aol.com May 6, 29. The purpose of this paper is
Fumiaki UEHAN, Dr.. Eng. Senior Researcher, Structural Mechanics Laboratory, Railway Dynamics Div.
 PAPER Development of the Non-contact Vibration Measuring System for Diagnosis of Railway Structures Fumiaki UEHAN, Dr.. Eng. Senior Researcher, Structural Mechanics Laboratory, Railway Dynamics Div. This
Preliminary study of the vibration displacement measurement by using strain gauge
 Songklanakarin J. Sci. Technol. 32 (5), 453-459, Sep. - Oct. 2010 Original Article Preliminary study of the vibration displacement measurement by using strain gauge Siripong Eamchaimongkol* Department
Vibration studies of a superconducting accelerating
 Vibration studies of a superconducting accelerating module at room temperature and at 4.5 K Ramila Amirikas, Alessandro Bertolini, Wilhelm Bialowons Vibration studies on a Type III cryomodule at room temperature
Indirect structural health monitoring in bridges: scale experiments
 Indirect structural health monitoring in bridges: scale experiments F. Cerda 1,, J.Garrett 1, J. Bielak 1, P. Rizzo 2, J. Barrera 1, Z. Zhuang 1, S. Chen 1, M. McCann 1 & J. Kovačević 1 1 Carnegie Mellon
Correction for Synchronization Errors in Dynamic Measurements
 Correction for Synchronization Errors in Dynamic Measurements Vasishta Ganguly and Tony L. Schmitz Department of Mechanical Engineering and Engineering Science University of North Carolina at Charlotte
Figure 1: The Penobscot Narrows Bridge in Maine, U.S.A. Figure 2: Arrangement of stay cables tested
 Figure 1: The Penobscot Narrows Bridge in Maine, U.S.A. Figure 2: Arrangement of stay cables tested EXPERIMENTAL SETUP AND PROCEDURES Dynamic testing was performed in two phases. The first phase took place
ACOUSTIC NOISE AND VIBRATIONS OF ELECTRIC POWERTRAINS
 ACOUSTIC NOISE AND VIBRATIONS OF ELECTRIC POWERTRAINS Focus on electromagnetically-excited NVH for automotive applications and EV/HEV Part 4 NVH experimental characterization of electric chains LE BESNERAIS
Displacement Measurement of Burr Arch-Truss Under Dynamic Loading Based on Image Processing Technology
 6 th International Conference on Advances in Experimental Structural Engineering 11 th International Workshop on Advanced Smart Materials and Smart Structures Technology August 1-2, 2015, University of
BASICS OF MODAL TESTING AND ANALYSIS
 CI PRODUCT NOTE No. 007 BASICS OF MODAL TESTING AND ANALYSIS WWW.CRYSTALINSTRUMENTS.COM BASICS OF MODAL TESTING AND ANALYSIS Introduction Modal analysis is an important tool for understanding the vibration
AN5E Application Note
 Metra utilizes for factory calibration a modern PC based calibration system. The calibration procedure is based on a transfer standard which is regularly sent to Physikalisch-Technische Bundesanstalt (PTB)
CHAPTER 6 INTRODUCTION TO SYSTEM IDENTIFICATION
 CHAPTER 6 INTRODUCTION TO SYSTEM IDENTIFICATION Broadly speaking, system identification is the art and science of using measurements obtained from a system to characterize the system. The characterization
CONTENTS. Cambridge University Press Vibration of Mechanical Systems Alok Sinha Table of Contents More information
 CONTENTS Preface page xiii 1 Equivalent Single-Degree-of-Freedom System and Free Vibration... 1 1.1 Degrees of Freedom 3 1.2 Elements of a Vibratory System 5 1.2.1 Mass and/or Mass-Moment of Inertia 5
FB-PIER VALIDATION SET
 FB-PIER VALIDATION SET Dynamics February 2004 FB-Pier Dynamics Validation Manual 1 Example 1 Single Pile Subject to a Pulse Load at the Pile Head Problem: The single 24 square prestressed concrete pile
Comparison of natural frequencies of vibration for a bridge obtained from measurements with new sensor systeme
 American Journal of Remote Sensing 2014; 2(4): 30-36 Published online October 30, 2014 (http://www.sciencepublishinggroup.com/j/ajrs) doi: 10.11648/j.ajrs.20140204.12 ISSN: 2328-5788 (Print); ISSN: 2328-580X
Introduction to Measurement Systems
 MFE 3004 Mechatronics I Measurement Systems Dr Conrad Pace Page 4.1 Introduction to Measurement Systems Role of Measurement Systems Detection receive an external stimulus (ex. Displacement) Selection measurement
VIBRATION ANALYSIS AND MODAL IDENTIFICATION OF A CIRCULAR CABLE-STAYED FOOTBRIDGE
 VIBRATION ANALYSIS AND MODAL IDENTIFICATION OF A CIRCULAR CABLE-STAYED FOOTBRIDGE Carlos Rebelo, Dep. of Civil Engineering, University of Coimbra Portugal Eduardo Júlio Dep. of Civil Engineering, University
ANALYSIS OF 3RD OCTAVE BAND GROUND MOTIONS TRANSMISSION IN SYNCHROTRON RADIATION FACILITY SOLARIS Daniel Ziemianski, Marek Kozien
 ANALYSIS OF 3RD OCTAVE BAND GROUND MOTIONS TRANSMISSION IN SYNCHROTRON RADIATION FACILITY SOLARIS Daniel Ziemianski, Marek Kozien Cracow University of Technology, Institute of Applied Mechanics, al. Jana
A NEW APPROACH FOR THE ANALYSIS OF IMPACT-ECHO DATA
 A NEW APPROACH FOR THE ANALYSIS OF IMPACT-ECHO DATA John S. Popovics and Joseph L. Rose Department of Engineering Science and Mechanics The Pennsylvania State University University Park, PA 16802 INTRODUCTION
Experimental Modal Analysis
 Experimental Modal Analysis Joe Spadola What is modal analysis? 2 Modal Analysis is the process of characterizing the dynamics of a structure in terms of its dynamic properties. The dynamic characteristics
Sloshing of Liquid in Partially Filled Container An Experimental Study
 Sloshing of Liquid in Partially Filled Container An Experimental Study P. Pal Department of Civil Engineering, MNNIT Allahabad, India. E-mail: prpal2k@gmail.com Abstract This paper deals with the experimental
IOMAC'13 5 th International Operational Modal Analysis Conference
 IOMAC'13 5 th International Operational Modal Analysis Conference 2013 May 13-15 Guimarães - Portugal STRUCTURAL HEALTH MONITORING OF A MID HEIGHT BUILDING IN CHILE R. Boroschek 1, A. Aguilar 2, J. Basoalto
Modal Excitation. D. L. Brown University of Cincinnati Structural Dynamics Research Laboratory. M. A. Peres The Modal Shop, Inc Cincinnati, OH
 Modal Excitation D. L. Brown University of Cincinnati Structural Dynamics Research Laboratory M. A. Peres The Modal Shop, Inc Cincinnati, OH IMAC-XXVI, Modal Excitation, #356, Feb 04, 2008, Intoduction
IOMAC' May Guimarães - Portugal
 IOMAC'13 5 th International Operational Modal Analysis Conference 213 May 13-15 Guimarães - Portugal MODIFICATIONS IN THE CURVE-FITTED ENHANCED FREQUENCY DOMAIN DECOMPOSITION METHOD FOR OMA IN THE PRESENCE
MULTIPLE INPUT MULTIPLE OUTPUT (MIMO) VIBRATION CONTROL SYSTEM
 VIBRATION CONTROL SYSTEM") MULTIPLE INPUT MULTIPLE OUTPUT (MIMO) VIBRATION CONTROL SYSTEM WWW.CRYSTALINSTRUMENTS.COM MIMO Vibration Control Overview MIMO Testing has gained a huge momentum in the past decade with the development
MULTIPLE INPUT MULTIPLE OUTPUT (MIMO) VIBRATION CONTROL SYSTEM WWW.CRYSTALINSTRUMENTS.COM MIMO Vibration Control Overview MIMO Testing has gained a huge momentum in the past decade with the development
3.0 Apparatus. 3.1 Excitation System
 3.0 Apparatus The individual hardware components required for the GVT (Ground Vibration Test) are broken into four categories: excitation system, test-structure system, measurement system, and data acquisition
SHOCK AND VIBRATION RESPONSE SPECTRA COURSE Unit 4. Random Vibration Characteristics. By Tom Irvine
 SHOCK AND VIBRATION RESPONSE SPECTRA COURSE Unit 4. Random Vibration Characteristics By Tom Irvine Introduction Random Forcing Function and Response Consider a turbulent airflow passing over an aircraft
IMAC 27 - Orlando, FL Shaker Excitation
 IMAC 27 - Orlando, FL - 2009 Peter Avitabile UMASS Lowell Marco Peres The Modal Shop 1 Dr. Peter Avitabile Objectives of this lecture: Overview some shaker excitation techniques commonly employed in modal
An Overview of MIMO-FRF Excitation/Averaging Techniques
 An Overview of MIMO-FRF Excitation/Averaging Techniques Allyn W. Phillips, PhD, Research Assistant Professor Randall J. Allemang, PhD, Professor Andrew T. Zucker, Research Assistant University of Cincinnati
A Comparison of MIMO-FRF Excitation/Averaging Techniques on Heavily and Lightly Damped Structures
 A Comparison of MIMO-FRF Excitation/Averaging Techniques on Heavily and Lightly Damped Structures Allyn W. Phillips, PhD Andrew T. Zucker Randall J. Allemang, PhD Research Assistant Professor Research
Structural Dynamics Measurements Mark H. Richardson Vibrant Technology, Inc. Jamestown, CA 95327
 Structural Dynamics Measurements Mark H. Richardson Vibrant Technology, Inc. Jamestown, CA 95327 Introduction In this paper, the term structural dynamics measurements will more specifically mean the measurement
Experimental Vibration-based Damage Detection in Aluminum Plates and Blocks Using Acoustic Emission Responses
 More Info at Open Access Database www.ndt.net/?id=7979 Experimental Vibration-based Damage Detection in Aluminum Plates and Blocks Using Acoustic Emission Responses Abstract Mehdi MIRSADEGI, Mehdi SANATI,
Damping identification of bridges from nonstatioary ambient vibration data
 Damping identification of bridges from nonstatioary ambient vibration data Sunjoong Kim 1) and Ho-Kyung Kim ) 1), ) Department of Civil and Environmental Engineering, Seoul National University, 1 Gwanak-ro,
Gear Transmission Error Measurements based on the Phase Demodulation
 Gear Transmission Error Measurements based on the Phase Demodulation JIRI TUMA Abstract. The paper deals with a simple gear set transmission error (TE) measurements at gearbox operational conditions that
EXPERIMENTAL ANALYSIS OF BOLT LOOSENING DYNAMICS CHARACTERISTIC IN A BEAM BY IMPACT TESTING
 EXPERIMENTAL ANALYSIS OF BOLT LOOSENING DYNAMICS CHARACTERISTIC IN A BEAM BY IMPACT TESTING Meifal Rusli, Candra Mardianto and Mulyadi Bur Department of Mechanical Engineering, Faculty of Engineering,
Convenient Structural Modal Analysis Using Noncontact Vision-Based Displacement Sensor
 8th European Workshop On Structural Health Monitoring (EWSHM 2016), 5-8 July 2016, Spain, Bilbao www.ndt.net/app.ewshm2016 Convenient Structural Modal Analysis Using Noncontact Vision-Based Displacement
Shinde Suyog Sudhakar, Galatage Abhijeet.A, Kulkarni Sumant.K, International Journal of Advance Research, Ideas and Innovations in Technology.
 ISSN: 2454-132X Impact factor: 4.295 (Volume3, Issue5) Available online at www.ijariit.com Evaluating Seismic Efficiency of Combination of Bracing for Steel Building Suyog Sudhakar Shinde 1P. G. Student
Developer Techniques Sessions
 1 Developer Techniques Sessions Physical Measurements and Signal Processing Control Systems Logging and Networking 2 Abstract This session covers the technologies and configuration of a physical measurement
BLADE AND SHAFT CRACK DETECTION USING TORSIONAL VIBRATION MEASUREMENTS PART 1: FEASIBILITY STUDIES
 Maynard, K. P., and Trethewey, M. W., Blade and Crack detection Using Vibration Measurements Part 1: Feasibility Studies, Noise and Vibration Worldwide, Volume 31, No. 11, December, 2000, pp. 9-15. BLADE
Simulate and Stimulate
 Simulate and Stimulate Creating a versatile 6 DoF vibration test system Team Corporation September 2002 Historical Testing Techniques and Limitations Vibration testing, whether employing a sinusoidal input,
Experimental Investigation of Crack Detection in Cantilever Beam Using Natural Frequency as Basic Criterion
 INSTITUTE OF TECHNOLOGY, NIRMA UNIVERSITY, AHMEDABAD 382 481, 08-10 DECEMBER, 2011 1 Experimental Investigation of Crack Detection in Cantilever Beam Using Natural Frequency as Basic Criterion A. A.V.Deokar,
SETUP I: CORD. Continuous Systems
 Lab #8 Continuous Systems Name: Date: Section / Group: SETUP I: CORD This part of the laboratory is mainly exploratory in nature. By using your hand to force the cord close to one of its ends, you should
EFFECTS OF ACCELEROMETER MOUNTING METHODS ON QUALITY OF MEASURED FRF S
 The 21 st International Congress on Sound and Vibration 13-17 July, 2014, Beijing/China EFFECTS OF ACCELEROMETER MOUNTING METHODS ON QUALITY OF MEASURED FRF S Shokrollahi Saeed, Adel Farhad Space Research
Design of a Piezoelectric-based Structural Health Monitoring System for Damage Detection in Composite Materials
 Design of a Piezoelectric-based Structural Health Monitoring System for Damage Detection in Composite Materials Seth S. Kessler S. Mark Spearing Technology Laboratory for Advanced Composites Department
Development of a Wireless Cable Tension Monitoring System using Smart Sensors
 Development of a Wireless Cable Tension Monitoring System using Smart Sensors Sung-Han Sim 1), Jian Li 2), Hongki Jo 3), Jong-Woong Park 4), and Billie F. Spencer, Jr. 5) 1) School of Urban and Environmental
Frequency Domain Analysis
 1 Frequency Domain Analysis Concerned with analysing the frequency (wavelength) content of a process Application example: Electromagnetic Radiation: Represented by a Frequency Spectrum: plot of intensity
A study of Vibration Analysis for Gearbox Casing Using Finite Element Analysis
 A study of Vibration Analysis for Gearbox Casing Using Finite Element Analysis M. Sofian D. Hazry K. Saifullah M. Tasyrif K.Salleh I.Ishak Autonomous System and Machine Vision Laboratory, School of Mechatronic,
Also, side banding at felt speed with high resolution data acquisition was verified.
 PEAKVUE SUMMARY PeakVue (also known as peak value) can be used to detect short duration higher frequency waves stress waves, which are created when metal is impacted or relieved of residual stress through
STRUCTURAL HEALTH MONITORING USING STRONG AND WEAK EARTHQUAKE MOTIONS
 10NCEE Tenth U.S. National Conference on Earthquake Engineering Frontiers of Earthquake Engineering July 21-25, 2014 Anchorage, Alaska STRUCTURAL HEALTH MONITORING USING STRONG AND WEAK EARTHQUAKE MOTIONS
Bridge Vibrations Excited Through Vibro-Compaction of Bituminous Deck Pavement
 Bridge Vibrations Excited Through Vibro-Compaction of Bituminous Deck Pavement Reto Cantieni rci dynamics, Structural Dynamics Consultants Raubbuehlstr. 21B, CH-8600 Duebendorf, Switzerland Marc Langenegger
Laboratory Experiment #2 Frequency Response Measurements
 J.B.Francis College of Engineering Mechanical Engineering Department 22-403 Laboratory Experiment #2 Frequency Response Measurements Introduction It is known from dynamic systems that a structure temporarily
Practical Applications of the Wavelet Analysis
 Practical Applications of the Wavelet Analysis M. Bigi, M. Jacchia, D. Ponteggia ALMA International Europe (6- - Frankfurt) Summary Impulse and Frequency Response Classical Time and Frequency Analysis
SOLVING VIBRATIONAL RESONANCE ON A LARGE SLENDER BOAT USING A TUNED MASS DAMPER. A.W. Vredeveldt, TNO, The Netherlands
 SOLVING VIBRATIONAL RESONANCE ON A LARGE SLENDER BOAT USING A TUNED MASS DAMPER. A.W. Vredeveldt, TNO, The Netherlands SUMMARY In luxury yacht building, there is a tendency towards larger sizes, sometime
Fundamentals of Vibration Measurement and Analysis Explained
 Fundamentals of Vibration Measurement and Analysis Explained Thanks to Peter Brown for this article. 1. Introduction: The advent of the microprocessor has enormously advanced the process of vibration data
EWGAE 2010 Vienna, 8th to 10th September
 EWGAE 2010 Vienna, 8th to 10th September Frequencies and Amplitudes of AE Signals in a Plate as a Function of Source Rise Time M. A. HAMSTAD University of Denver, Department of Mechanical and Materials
Intermediate and Advanced Labs PHY3802L/PHY4822L
 Intermediate and Advanced Labs PHY3802L/PHY4822L Torsional Oscillator and Torque Magnetometry Lab manual and related literature The torsional oscillator and torque magnetometry 1. Purpose Study the torsional
Acoustic Resonance Analysis Using FEM and Laser Scanning For Defect Characterization in In-Process NDT
 ECNDT 2006 - We.4.8.1 Acoustic Resonance Analysis Using FEM and Laser Scanning For Defect Characterization in In-Process NDT Ingolf HERTLIN, RTE Akustik + Prüftechnik, Pfinztal, Germany Abstract. This
Structural. engineering. dynamics of earthquake. s. Rajasekaran. W OODHEAD PUBLISHING LIMITED Oxford Cambridge New Delhi
 Structural dynamics of earthquake engineering Theory and application using MATHEMATICA and MATLAB s. Rajasekaran ocrc Press Boca Raton Boston New York Washington, DC W OODHEAD PUBLISHING LIMITED Oxford
CASE STUDY BRIDGE DYNAMIC MONITORING
 Introduction BRIDGE DYNAMIC MONITORING Monitoring of structure movements and vibrations (bridges, buildings, monuments, towers etc.) is an increasingly important task for today s construction engineers.
Advanced High-Frequency 6-DOF Vibration Testing Using the Tensor System
 Advanced High-Frequency 6-DOF Vibration Testing Using the Tensor System Joel Hoksbergen, Team Corporation 1 Abstract Commercially available vibration test systems able to reproduce and accurately control
2 Study of an embarked vibro-impact system: experimental analysis
 2 Study of an embarked vibro-impact system: experimental analysis This chapter presents and discusses the experimental part of the thesis. Two test rigs were built at the Dynamics and Vibrations laboratory
Anthony Chu. Basic Accelerometer types There are two classes of accelerometer in general: AC-response DC-response
 Engineer s Circle Choosing the Right Type of Accelerometers Anthony Chu As with most engineering activities, choosing the right tool may have serious implications on the measurement results. The information
Part 2: Second order systems: cantilever response
 - cantilever response slide 1 Part 2: Second order systems: cantilever response Goals: Understand the behavior and how to characterize second order measurement systems Learn how to operate: function generator,
For the electronic measurement of current: DC, AC, pulsed..., with galvanic separation between the primary and secondary circuit.
 Current Transducer LF 510-S I P N = 500 A For the electronic measurement of current: DC, AC, pulsed..., with galvanic separation between the primary and secondary circuit. Features Bipolar and insulated
CHAPTER 5 FAULT DIAGNOSIS OF ROTATING SHAFT WITH SHAFT MISALIGNMENT
 66 CHAPTER 5 FAULT DIAGNOSIS OF ROTATING SHAFT WITH SHAFT MISALIGNMENT 5.1 INTRODUCTION The problem of misalignment encountered in rotating machinery is of great concern to designers and maintenance engineers.
Iterative Learning Control of a Marine Vibrator
 Iterative Learning Control of a Marine Vibrator Bo Bernhardsson, Olof Sörnmo LundU niversity, Olle Kröling, Per Gunnarsson Subvision, Rune Tengham PGS Marine Seismic Surveys Outline 1 Seismic surveying
Operational modal analysis applied to a horizontal washing machine: A comparative approach Sichani, Mahdi Teimouri; Mahjoob, Mohammad J.
 Aalborg Universitet Operational modal analysis applied to a horizontal washing machine: A comparative approach Sichani, Mahdi Teimouri; Mahjoob, Mohammad J. Publication date: 27 Document Version Publisher's
Site-specific seismic hazard analysis
 Site-specific seismic hazard analysis ABSTRACT : R.K. McGuire 1 and G.R. Toro 2 1 President, Risk Engineering, Inc, Boulder, Colorado, USA 2 Vice-President, Risk Engineering, Inc, Acton, Massachusetts,
Development of a Package for a Triaxial High-G Accelerometer Optimized for High Signal Fidelity
 Development of a Package for a Triaxial High-G Accelerometer Optimized for High Signal Fidelity R. Langkemper* 1, R. Külls 1, J. Wilde 2, S. Schopferer 1 and S. Nau 1 1 Fraunhofer Institute for High-Speed