Frequency Domain Analysis
|
|
|
- Calvin Claud Higgins
- 6 years ago
- Views:
Transcription

1 1 Frequency Domain Analysis Concerned with analysing the frequency (wavelength) content of a process Application example: Electromagnetic Radiation: Represented by a Frequency Spectrum: plot of intensity vs frequency
2 3 Solar Radiation Spectrum 0.5 Solar radiation spectrum ( Irradiance [W/cm /µm] nm violet Visible 700 nm red Near IR Infrared Wavelength [nm] 4 Why frequency domain analysis? Consider the following processes: Vibration on a transport vehicle

3 5 Why frequency domain analysis? Consider the following processes: Whale sound 6 Why frequency domain analysis? Consider the following processes: Apache helicopter flyover


4 7 Why frequency domain analysis? Consider the following processes: Ocean surface level fluctuations (waves) 8 Why frequency domain analysis? Consider the following processes: Axle load of passenger vehicle on test track
5 9 Why frequency domain analysis? Consider the following processes: Vibration of structure due to explosion load (pyrotechnic shock) 10 Why frequency domain analysis? Consider the following processes:
6 11 Why frequency domain analysis? Consider the following processes: 1 Why frequency domain analysis? Consider the following processes:
 analysis Filter analysis consists of a number of band-pass frequency filters (analogue or digital) These")
 Octave bands 14 Digital Fourier Transform (DFT) or Fast Fourier Transform (FFT) Transforming a signal from the time to the frequency domain can be achieved via the Fourier")
 Although Fourier theory applies strictly to periodic signals, the periodicity of sampled or measured signals is assumed resulting")
7 13 All continuous signals can be shown to be comprised of a summation of individual harmonic (Fourier) components of various frequencies, amplitudes and phases. Common methods to compute the frequency spectrum of measured data: Filter (octave band) analysis Filter analysis consists of a number of band-pass frequency filters (analogue or digital) These filters allow only a (narrow) band of frequencies to pass A number of filters with adjacent frequency bands are used to generate a frequency spectrum 0-10 db k k 4k 8k 16k (fractional) Octave bands 14 Digital Fourier Transform (DFT) or Fast Fourier Transform (FFT) Transforming a signal from the time to the frequency domain can be achieved via the Fourier Transform (also called Fourier Analysis). Information is neither gained or lost when transforming signals from the time domain to the frequency domain via the FFT. The Fourier transform is reversible Inverse Fourier Transform (IFT) Although Fourier theory applies strictly to periodic signals, the periodicity of sampled or measured signals is assumed resulting in a estimate of he frequency spectrum Signal (real) Complex Magnitude Spectrum FFT Phase Spectrum IFT


.")
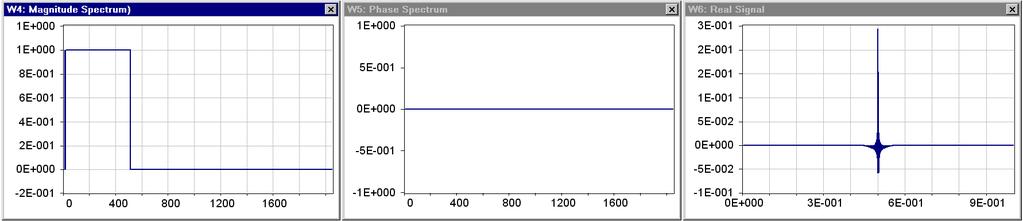
8 15 Random signals (Dadisp: Freqa) Broad-band signals contain more sinusoid components than narrow-band signals A sinusoid can be considered as a very-narrow-band random signal. The phase of the sinusoids which make up random signals are values uniformly-distributed between 0 and π. The phase of the sinusoids which make up pulse signals are equal. Effect of phase on frequency spectrum An infinite number of sinusoidal components with equal phase produces the Delta function (very sharp pulse). 16 Signal bandwidth examples: Uniformly-distributed random phase.


9 17 Signal bandwidth examples: Zero bandwidth signals 18 Signal bandwidth examples: Constant phase.
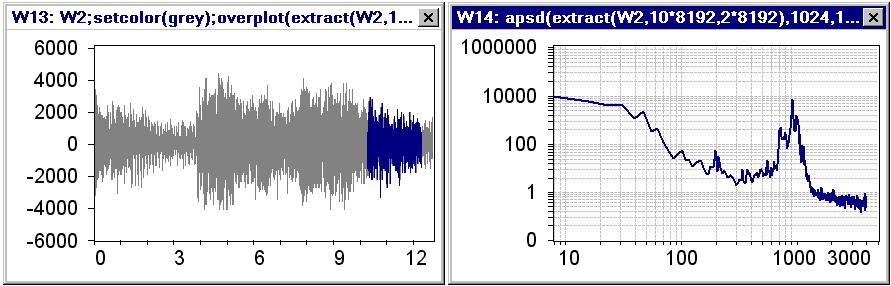
10 19 40 Example of constant phase signal: Gaussian wave packet Elevation [mm] Time [sec.] Energy Spectrum [mm.s] Phase [rad] Frequency [Hz] Frequency [Hz] 0 Digital Fourier Transform (DFT) or Fast Fourier Transform (FFT) Random signals (Dadisp: Apache_PSD & Spectral_averag) Each observation is unique sample of process one physical realisation of the process The frequency spectrum of each sample is an estimate of the frequency spectrum of the entire process The estimate of the true frequency spectrum is improved by computing spectral averages. Important issues when computing the Fourier Transform: Bandwidth: Frequency range to be analysed Frequency Resolution [Hz] = 1/sub-record duration [secs] Spectral estimate accuracy (random error): Std. Deviation of error = 1/ # averages. Spectral error is reduced by: Identifying sub-records within the measured record Computing the spectrum of each sub-record Computing the average spectrum Given a fixed record length, a compromise has to be reached with respect to frequency resolution and spectral error.


11 1 Effects of frequency resolution & spectral averaging. Example: Helicopter fly-by (sound) Effects of frequency resolution & spectral averaging. Example: Heavy vehicle vibrations.
 spectral averaging will conceal these non-stationary properties.")
12 3 Spectral averaging must be used carefully When signals are strongly non-stationary (ie. Evident variations in vital characteristics such as RMS levels or frequencies) spectral averaging will conceal these non-stationary properties. 4 Effects of frequency content variation. Example: Whale cry.

13 5 Effects of frequency content variation. Example: Whale cry. 6 Effects of frequency content variation. Example: Whale cry.
 Overlapping Zero-padding 8 Effects of spectral leakage and windowing. Example: sinusoid.")
14 7 Nyquist Frequency and Sampling Rate (Dadisp: Shannonsine) Leakage and the effects of widowing functions (Dadisp: leakage_sin & leakage_rnd) Overlapping Zero-padding 8 Effects of spectral leakage and windowing. Example: sinusoid.


15 9 Effects of spectral leakage and windowing. Example: Heavy vehicle vibrations. 30 Influence of signal clipping on frequency spectrum No clipping Clipped


16 31 Influence of broad-band and narrow-band (power line) noise on frequency spectrum Clean spectrum + Broad-band noise + Narrow-band noise 3 Influence of intermittent noise (switchgear interference) on frequency spectrum Clean spectrum + Intermittent noise (sharp pulses)
17 33 System Analysis (Excitation Response Relationships) 34 Frequency analysis is useful in determining the frequency characteristics of systems: relationship between output and input as a function of frequency. Real systems are often assumed to approximate an ideal system. Ideal systems: Have constant parameters (no variation in system characteristics wrt time) Are linear (ie. additive and homogeneous): Additive: Response (output) to sum of excitations (inputs) = sum of responses due to each individual input: f (x1+ x ) = f(x 1) + f(x ) Homogeneous: Response from excitation x constant = response x constant from excitation: f( kx) = kf(x)
18 35 Cross Spectrum Excitation signal H(f) System FRF j( π ft + ΦA ) j( π ft + ΦB ) A= Ae, B= Be * S AB(f) = A(f) B(f) = Ae Be = A Be Response signal jπ ft jπ ft Y { } Y { } A( f ) a(t) a(t)e dt = = The cross spectrum of A wrt B is defined as: j(π ft + ΦA ) j(π ft + ΦB ) j( ΦB ΦA ) B( f ) b( t ) b( t )e dt = = Where A*(f) is the complex conjugate of the instantaneous spectrum of a(t) and B(f) is the instantaneous spectrum of b(t) The amplitude of the cross spectrum is the product of the two amplitudes The phase of the cross spectrum is the difference between the phase of B relative to A. The cross spectrum S BA has the same amplitude but opposite phase. Auto spectra and cross spectra are generally expressed in one-sided form: A( f) = Re(f) + iim(f) * A (f) = Re(f) iim(f) 36 Cross Spectrum Excitation signal H(f) System FRF Response signal jπ ft jπ ft Y { } Y { } A( f ) a(t) a(t)e dt = = B( f ) b( t ) b( t )e dt = = The auto spectrum is obtained in the same way: AA * S (f) = A(f) A(f) j( π ft + ΦA ) j( π ft + ΦA ) = A e Ae = A The autospectrum is the power spectrum which has additive properties useful for averaging. Auto spectra and cross spectra are generally expressed in one-sided form: G ( f ) = 0 G ( f ) = 0 f < 0 G (f) = S (f) G (f) = S (f) f= 0 G ( f ) = S ( f ) G ( f ) = S ( f ) f > 0 AA AB AA AA AB AB AA AA AB AB As for the auto spectrum the cross spectrum of stationary random signals is best estimated by averaging over a number of records.
19 37 Coherence The coherence is used to determine the level of linear dependence b/w two signals as a function of frequency The coherence is defined as: G AB( f ) γ (f) = G AA( f ) G BB( f ) And can be viewed as a squared correlation coefficient which quantifies the linear relationship between two variables: ρ xy = 1 ρ xy < 1 ρ xy σ xy = σx σ y Covariance Variance Note that for a single set of records (no averaging) the coherence is 1. ρ xy < 1 ρ xy = 0 38 Coherence In practical cases, reasons for obtaining coherences of less that unity are: 1. Contamination of either excitation or response signal with noise. The presence on nonlinearities in the relationship between the excitation and response 3. Spectral leakage due to insufficient resolution or unsuitable windowing function 4. Time delay between the excitation and response signals Signal:noise ratio The coherence can be used to determine the signal:noise ratio of the measurement which is defined as: γ S:N= 1 γ If noise contamination of the response signal is assumed to be the only factor influencing the coherence, then γ is proportional to the coherent power while (1- γ ) represents the non-coherent power which is due to the noise in the response signal.
20 39 Frequency Response Function The system is excited with a signal of suitable bandwidth (Swept sine [not suited to FFT], band limited random signal or impulse) and the system response is measured The excitation and response signals are each transformed to the frequency domain (FFT) to obtain a complex, instantaneous spectrum which are averaged to produce a mean power spectrum (autospectrum). Further frequency-domain functions such as the cross-spectrum are then computed and the (linear) relationship between the excitation and response signals as a function of frequency is established giving the Frequency Response Function (FRF). a( t ) Y A( f) H(f) System FRF b(t) = a(t) h(t) Y B(f) = A(f) H(f) Relationship between excitation and response for an ideal system without noise contamination In the time domain the response is obtained by convolving the system impulse response function h(t) with the excitation. In the frequency domain, the response spectrum is obtained by multiplying the system Frequency Response Function H(f) with the excitation spectrum. 40 Frequency Response Function a( t ) Y A( f) H(f) System FRF b(t) = a(t) h(t) Y B(f) = A(f) H(f) Relationship between excitation and response for an ideal system without noise contamination For an ideal system without noise, the Frequency Response Function can be determined by: B( f ) H( f ) = A( f ) A= Ae B= B e j( π ft + ΦA ) j( π ft + ΦB ) B H( f ) = e e A B H( f ) = e A j( π ft + ΦB ) j( π ft + ΦA ) j( ΦB ΦA ) Which is a complex function in terms of the magnitude ratio and the phase difference.
21 41 Frequency Response Function In practice it has been shown that when the response signal is contaminated by broad-band random noise (transducer noise), a better estimate of the FRF is obtained by normalising the cross spectrum by the auto spectrum of the input: B(f) A*(f) S AB(f) G AB(f) H( f) = = = = H(f) 1 A(f) A*(f) S (f) G (f) B(f) B*(f) S BB(f) G BB(f) H( f) = = = = H (f) A(f) B*(f) S (f) G (f) AA BA AA If the complex conjugate of the output spectrum is used the resulting FRF is improved when noise contamination is present in the excitation signal: It is interesting to note that the ratio H 1 :H always gives the coherence: BA 1 AB BA AB AB G AB( f ) = = = AA BB AA BB AA BB 1 = γ (f) H(f) G (f) G (f) G (f) G *(f) H (f) G (f) G (f) G (f) G (f) G (f)g (f) H(f) H ( f ) Although the magnitude of H 1 and H will be different for noise contaminated measurements, their phase is always the same. 4 Frequency Response Function effects of noise Consider an ideal system where the measured response signal b(t) is contaminated by extraneous uncorrelated noise n(t). The noise signal may include some component generated by the system but not caused by the excitation signal a(t). n(t) Given sufficient averaging, the measured cross spectrum G AB will approximate the true cross spectrum G AV and the measured response auto h(t) v(t) spectrum is the sum of the clean output and a(t) H(f) the uncorrelated noise: Σ b(t) G (f) = G (f) AB AV BB = VV + NN = AA + NN G (f) G (f) G (f) H(f) G (f) G (f) G (f) = G (f) + G (f) = G (f) = H(f)G (f) AB AV AN AV AA G AB(f) G AV (f) H(f) 1 = = = H(f) Optimum FRF (effects of noise minimised) G (f) G (f) AA AA
22 43 Frequency Response Function effects of noise n(t) while a(t) h(t) v(t) H(f) G BB(f) G VV (f) + G NN (f) H(f) G AA(f) + G NN (f) H ( f ) = = = G (f) G (f) H*(f)G (f) BA VA AA Σ b(t) G NN ( f ) H(f) G NN (f) = H( f ) + = H( f ) + H*(f)G (f) H*(f)G (f) AA VV G NN ( f ) H(f) = H(f)1 + G VV ( f ) FRF magnitude overestimated (phase OK) G wher NN ( f ) e G vv is the coherent output power spectrum and is the noise : signal ratio. G ( f ) VV 44 Frequency Response Function effects of noise When the measured excitation signal is contaminated by extraneous noise m(t) (measurement noise), it can be shown that: u(t) h(t) H(f) b(t) while H( f ) H(f) 1 = FRF magnitude underestimated (phase OK) G MM ( f ) 1 + G UU ( f ) m(t) H(f) = H(f) Optimum FRF (effects of noise minimised) Σ a(t) When there is extraneous noise in both the measured excitation and response signals H 1 and H give the lower and upper bound to the true FRF.
23 45 Frequency Response Function Examples: Excitation: Wave height Excitation: Gusts Excitation: Pavement topography Excitation: Engine vibrations Excitation: Aerodynamic loads System: Ship System: Tower System: Road vehicle System: Military submarine System: Aeroplane wing Response: Pitch or roll Response: Sway or deflection Response: Vertical vibration Response: Sound Response: Stresses or deflection 46 Frequency Response Function Excitation: vertical vibrations System: Packaged product Response: Product vibration Dead Weight Signal Analyser Response accel. signal Guided platen Test sample Vibration Controller Input accel. signal (control) Vibration table Servo-hydraulic Actuator


24 47 Frequency Response Function Linear bearings housing Response accelerometer Guided dead weight Fibreboard cushion sample Guide rod Vibration table Input (table) accelerometer 48 Frequency Response Function 10 steady-state Random Nd = 5 Transmissiblity Frequency [Hz]


25 49 Frequency Response Function Accelerometer Dead Weights Charge Amplifier Accelerometer Charge Amplifier Packaged Unit Table Servo Amplifier Hydraulic Servoactuator PC with ADC and DAC Modules. Function Generator with externally-controlled frequency & amplitude. 50 Frequency Response Function

26 51 Response acceleration Sensor Frequency Response Function Excitation acceleration Sensor Frequency Response Function Before test After test Gain Phase Difference [Deg] Before test -30 Frequency [Hz] After test Frequency [Hz]
Objectives. Presentation Outline. Digital Modulation Lecture 03
 Digital Modulation Lecture 03 Inter-Symbol Interference Power Spectral Density Richard Harris Objectives To be able to discuss Inter-Symbol Interference (ISI), its causes and possible remedies. To be able
System Identification & Parameter Estimation
 System Identification & Parameter Estimation Wb2301: SIPE lecture 4 Perturbation signal design Alfred C. Schouten, Dept. of Biomechanical Engineering (BMechE), Fac. 3mE 3/9/2010 Delft University of Technology
Experimental Modal Analysis of an Automobile Tire
 Experimental Modal Analysis of an Automobile Tire J.H.A.M. Vervoort Report No. DCT 2007.084 Bachelor final project Coach: Dr. Ir. I. Lopez Arteaga Supervisor: Prof. Dr. Ir. H. Nijmeijer Eindhoven University
Lecture on Angular Vibration Measurements Based on Phase Demodulation
 Lecture on Angular Vibration Measurements Based on Phase Demodulation JiříTůma VSB Technical University of Ostrava Czech Republic Outline Motivation Principle of phase demodulation using Hilbert transform
EXAMINATION FOR THE DEGREE OF B.E. Semester 1 June COMMUNICATIONS IV (ELEC ENG 4035)
") EXAMINATION FOR THE DEGREE OF B.E. Semester 1 June 2007 101902 COMMUNICATIONS IV (ELEC ENG 4035) Official Reading Time: Writing Time: Total Duration: 10 mins 120 mins 130 mins Instructions: This is a closed
EXAMINATION FOR THE DEGREE OF B.E. Semester 1 June 2007 101902 COMMUNICATIONS IV (ELEC ENG 4035) Official Reading Time: Writing Time: Total Duration: 10 mins 120 mins 130 mins Instructions: This is a closed
2015 HBM ncode Products User Group Meeting
 Looking at Measured Data in the Frequency Domain Kurt Munson HBM-nCode Do Engineers Need Tools? 3 What is Vibration? http://dictionary.reference.com/browse/vibration 4 Some Statistics Amplitude PDF y Measure
Complex Sounds. Reading: Yost Ch. 4
 Complex Sounds Reading: Yost Ch. 4 Natural Sounds Most sounds in our everyday lives are not simple sinusoidal sounds, but are complex sounds, consisting of a sum of many sinusoids. The amplitude and frequency
speech signal S(n). This involves a transformation of S(n) into another signal or a set of signals
. This involves a transformation of S(n) into another signal or a set of signals") 16 3. SPEECH ANALYSIS 3.1 INTRODUCTION TO SPEECH ANALYSIS Many speech processing [22] applications exploits speech production and perception to accomplish speech analysis. By speech analysis we extract
16 3. SPEECH ANALYSIS 3.1 INTRODUCTION TO SPEECH ANALYSIS Many speech processing [22] applications exploits speech production and perception to accomplish speech analysis. By speech analysis we extract
VOLD-KALMAN ORDER TRACKING FILTERING IN ROTATING MACHINERY
 TŮMA, J. GEARBOX NOISE AND VIBRATION TESTING. IN 5 TH SCHOOL ON NOISE AND VIBRATION CONTROL METHODS, KRYNICA, POLAND. 1 ST ED. KRAKOW : AGH, MAY 23-26, 2001. PP. 143-146. ISBN 80-7099-510-6. VOLD-KALMAN
ME scope Application Note 01 The FFT, Leakage, and Windowing
 INTRODUCTION ME scope Application Note 01 The FFT, Leakage, and Windowing NOTE: The steps in this Application Note can be duplicated using any Package that includes the VES-3600 Advanced Signal Processing
PHASE DEMODULATION OF IMPULSE SIGNALS IN MACHINE SHAFT ANGULAR VIBRATION MEASUREMENTS
 PHASE DEMODULATION OF IMPULSE SIGNALS IN MACHINE SHAFT ANGULAR VIBRATION MEASUREMENTS Jiri Tuma VSB Technical University of Ostrava, Faculty of Mechanical Engineering Department of Control Systems and
Discrete Fourier Transform (DFT)
") Amplitude Amplitude Discrete Fourier Transform (DFT) DFT transforms the time domain signal samples to the frequency domain components. DFT Signal Spectrum Time Frequency DFT is often used to do frequency
Amplitude Amplitude Discrete Fourier Transform (DFT) DFT transforms the time domain signal samples to the frequency domain components. DFT Signal Spectrum Time Frequency DFT is often used to do frequency
Response spectrum Time history Power Spectral Density, PSD
 A description is given of one way to implement an earthquake test where the test severities are specified by time histories. The test is done by using a biaxial computer aided servohydraulic test rig.
Volume 3 Signal Processing Reference Manual
 Contents Volume 3 Signal Processing Reference Manual Contents 1 Sampling analogue signals 1.1 Introduction...1-1 1.2 Selecting a sampling speed...1-1 1.3 References...1-5 2 Digital filters 2.1 Introduction...2-1
New Features of IEEE Std Digitizing Waveform Recorders
 New Features of IEEE Std 1057-2007 Digitizing Waveform Recorders William B. Boyer 1, Thomas E. Linnenbrink 2, Jerome Blair 3, 1 Chair, Subcommittee on Digital Waveform Recorders Sandia National Laboratories
8.2 Common Forms of Noise
 8.2 Common Forms of Noise Johnson or thermal noise shot or Poisson noise 1/f noise or drift interference noise impulse noise real noise 8.2 : 1/19 Johnson Noise Johnson noise characteristics produced by
Biomedical Signals. Signals and Images in Medicine Dr Nabeel Anwar
 Biomedical Signals Signals and Images in Medicine Dr Nabeel Anwar Noise Removal: Time Domain Techniques 1. Synchronized Averaging (covered in lecture 1) 2. Moving Average Filters (today s topic) 3. Derivative
ME scope Application Note 02 Waveform Integration & Differentiation
 ME scope Application Note 02 Waveform Integration & Differentiation The steps in this Application Note can be duplicated using any ME scope Package that includes the VES-3600 Advanced Signal Processing
EE228 Applications of Course Concepts. DePiero
 EE228 Applications of Course Concepts DePiero Purpose Describe applications of concepts in EE228. Applications may help students recall and synthesize concepts. Also discuss: Some advanced concepts Highlight
The Fundamentals of FFT-Based Signal Analysis and Measurement Michael Cerna and Audrey F. Harvey
 Application ote 041 The Fundamentals of FFT-Based Signal Analysis and Measurement Michael Cerna and Audrey F. Harvey Introduction The Fast Fourier Transform (FFT) and the power spectrum are powerful tools
Spectrum Analysis - Elektronikpraktikum
 Spectrum Analysis Introduction Why measure a spectra? In electrical engineering we are most often interested how a signal develops over time. For this time-domain measurement we use the Oscilloscope. Like
Spectral Estimation & Examples of Signal Analysis
 Spectral Estimation & Examples of Signal Analysis Examples from research of Kyoung Hoon Lee, Aaron Hastings, Don Gallant, Shashikant More, Weonchan Sung Herrick Graduate Students Estimation: Bias, Variance
Data Acquisition Systems. Signal DAQ System The Answer?
 Outline Analysis of Waveforms and Transforms How many Samples to Take Aliasing Negative Spectrum Frequency Resolution Synchronizing Sampling Non-repetitive Waveforms Picket Fencing A Sampled Data System
Notes on Noise Reduction
 Notes on Noise Reduction When setting out to make a measurement one often finds that the signal, the quantity we want to see, is masked by noise, which is anything that interferes with seeing the signal.
Frequency Domain Representation of Signals
 Frequency Domain Representation of Signals The Discrete Fourier Transform (DFT) of a sampled time domain waveform x n x 0, x 1,..., x 1 is a set of Fourier Coefficients whose samples are 1 n0 X k X0, X
Developer Techniques Sessions
 1 Developer Techniques Sessions Physical Measurements and Signal Processing Control Systems Logging and Networking 2 Abstract This session covers the technologies and configuration of a physical measurement
1.Explain the principle and characteristics of a matched filter. Hence derive the expression for its frequency response function.
 1.Explain the principle and characteristics of a matched filter. Hence derive the expression for its frequency response function. Matched-Filter Receiver: A network whose frequency-response function maximizes
Department of Mechanical and Aerospace Engineering. MAE334 - Introduction to Instrumentation and Computers. Final Examination.
 Name: Number: Department of Mechanical and Aerospace Engineering MAE334 - Introduction to Instrumentation and Computers Final Examination December 12, 2002 Closed Book and Notes 1. Be sure to fill in your
Biomedical Instrumentation B2. Dealing with noise
 Biomedical Instrumentation B2. Dealing with noise B18/BME2 Dr Gari Clifford Noise & artifact in biomedical signals Ambient / power line interference: 50 ±0.2 Hz mains noise (or 60 Hz in many data sets)
Fourier Signal Analysis
 Part 1B Experimental Engineering Integrated Coursework Location: Baker Building South Wing Mechanics Lab Experiment A4 Signal Processing Fourier Signal Analysis Please bring the lab sheet from 1A experiment
CHAPTER. delta-sigma modulators 1.0
 CHAPTER 1 CHAPTER Conventional delta-sigma modulators 1.0 This Chapter presents the traditional first- and second-order DSM. The main sources for non-ideal operation are described together with some commonly
Gear Transmission Error Measurements based on the Phase Demodulation
 Gear Transmission Error Measurements based on the Phase Demodulation JIRI TUMA Abstract. The paper deals with a simple gear set transmission error (TE) measurements at gearbox operational conditions that
A Brief Introduction to the Discrete Fourier Transform and the Evaluation of System Transfer Functions
 MEEN 459/659 Notes 6 A Brief Introduction to the Discrete Fourier Transform and the Evaluation of System Transfer Functions Original from Dr. Joe-Yong Kim (ME 459/659), modified by Dr. Luis San Andrés
ADC, FFT and Noise. p. 1. ADC, FFT, and Noise
 ADC, FFT and Noise. p. 1 ADC, FFT, and Noise Analog to digital conversion and the FFT A LabView program, Acquire&FFT_Nscans.vi, is available on your pc which (1) captures a waveform and digitizes it using
SHOCK AND VIBRATION RESPONSE SPECTRA COURSE Unit 17. Aliasing. Again, engineers collect accelerometer data in a variety of settings.
 SHOCK AND VIBRATION RESPONSE SPECTRA COURSE Unit 17. Aliasing By Tom Irvine Email: tomirvine@aol.com Introduction Again, engineers collect accelerometer data in a variety of settings. Examples include:
EC 554 Data Communications
 EC 554 Data Communications Mohamed Khedr http://webmail. webmail.aast.edu/~khedraast.edu/~khedr Syllabus Tentatively Week 1 Week 2 Week 3 Week 4 Week 5 Week 6 Week 7 Week 8 Week 9 Week 10 Week 11 Week
EE 451: Digital Signal Processing
 EE 451: Digital Signal Processing Power Spectral Density Estimation Aly El-Osery Electrical Engineering Department, New Mexico Tech Socorro, New Mexico, USA December 4, 2017 Aly El-Osery (NMT) EE 451:
Problem Sheet 1 Probability, random processes, and noise
 Problem Sheet 1 Probability, random processes, and noise 1. If F X (x) is the distribution function of a random variable X and x 1 x 2, show that F X (x 1 ) F X (x 2 ). 2. Use the definition of the cumulative
Engineering Discovery
 Modeling, Computing, & Measurement: Measurement Systems # 4 Dr. Kevin Craig Professor of Mechanical Engineering Rensselaer Polytechnic Institute 1 Frequency Response and Filters When you hear music and
2.1 BASIC CONCEPTS Basic Operations on Signals Time Shifting. Figure 2.2 Time shifting of a signal. Time Reversal.
 1 2.1 BASIC CONCEPTS 2.1.1 Basic Operations on Signals Time Shifting. Figure 2.2 Time shifting of a signal. Time Reversal. 2 Time Scaling. Figure 2.4 Time scaling of a signal. 2.1.2 Classification of Signals
Data and Computer Communications Chapter 3 Data Transmission
 Data and Computer Communications Chapter 3 Data Transmission Eighth Edition by William Stallings Transmission Terminology data transmission occurs between a transmitter & receiver via some medium guided
THE USE OF VOLUME VELOCITY SOURCE IN TRANSFER MEASUREMENTS
 THE USE OF VOLUME VELOITY SOURE IN TRANSFER MEASUREMENTS N. Møller, S. Gade and J. Hald Brüel & Kjær Sound and Vibration Measurements A/S DK850 Nærum, Denmark nbmoller@bksv.com Abstract In the automotive
Quantification of glottal and voiced speech harmonicsto-noise ratios using cepstral-based estimation
 Quantification of glottal and voiced speech harmonicsto-noise ratios using cepstral-based estimation Peter J. Murphy and Olatunji O. Akande, Department of Electronic and Computer Engineering University
ESE 531: Digital Signal Processing
 ESE 531: Digital Signal Processing Lec 12: February 21st, 2017 Data Converters, Noise Shaping (con t) Lecture Outline! Data Converters " Anti-aliasing " ADC " Quantization " Practical DAC! Noise Shaping
Multipath can be described in two domains: time and frequency
 Multipath can be described in two domains: and frequency Time domain: Impulse response Impulse response Frequency domain: Frequency response f Sinusoidal signal as input Frequency response Sinusoidal signal
ESE 531: Digital Signal Processing
 ESE 531: Digital Signal Processing Lec 11: February 20, 2018 Data Converters, Noise Shaping Lecture Outline! Review: Multi-Rate Filter Banks " Quadrature Mirror Filters! Data Converters " Anti-aliasing
IMAC 27 - Orlando, FL Shaker Excitation
 IMAC 27 - Orlando, FL - 2009 Peter Avitabile UMASS Lowell Marco Peres The Modal Shop 1 Dr. Peter Avitabile Objectives of this lecture: Overview some shaker excitation techniques commonly employed in modal
Topic 2. Signal Processing Review. (Some slides are adapted from Bryan Pardo s course slides on Machine Perception of Music)
") Topic 2 Signal Processing Review (Some slides are adapted from Bryan Pardo s course slides on Machine Perception of Music) Recording Sound Mechanical Vibration Pressure Waves Motion->Voltage Transducer
Topic 2 Signal Processing Review (Some slides are adapted from Bryan Pardo s course slides on Machine Perception of Music) Recording Sound Mechanical Vibration Pressure Waves Motion->Voltage Transducer
Chapter-2 SAMPLING PROCESS
 Chapter-2 SAMPLING PROCESS SAMPLING: A message signal may originate from a digital or analog source. If the message signal is analog in nature, then it has to be converted into digital form before it can
ECE 476/ECE 501C/CS Wireless Communication Systems Winter Lecture 6: Fading
 ECE 476/ECE 501C/CS 513 - Wireless Communication Systems Winter 2004 Lecture 6: Fading Last lecture: Large scale propagation properties of wireless systems - slowly varying properties that depend primarily
Chapter 5 Window Functions. periodic with a period of N (number of samples). This is observed in table (3.1).
. This is observed in table (3.1).") Chapter 5 Window Functions 5.1 Introduction As discussed in section (3.7.5), the DTFS assumes that the input waveform is periodic with a period of N (number of samples). This is observed in table (3.1).
Chapter 5 Window Functions 5.1 Introduction As discussed in section (3.7.5), the DTFS assumes that the input waveform is periodic with a period of N (number of samples). This is observed in table (3.1).
APPENDIX T: Off Site Ambient Tests
 Appendix T1 APPENDIX T: Off Site Ambient Tests End of Blowholes road Substation access Surf Club East end of Blowholes Road Appendix T2 West end of Blowholes Road Appendix T3 West end of Blowholes Rd west
THE INVESTIGATION OF VIBRATION OF LINAC AT KEK
 333 THE INVESTIGATION OF VIBRATION OF LINAC AT KEK Kazuyoshi Katayama, Yoshinori Takahashi, Tamio Imazawa and Nobuyoshi Murai TAKENAKA Corporation, Technical Research Laboratory, Osaka, Japan Tsunehiro
Terminology (1) Chapter 3. Terminology (3) Terminology (2) Transmitter Receiver Medium. Data Transmission. Direct link. Point-to-point.
 Chapter 3. Terminology (3) Terminology (2) Transmitter Receiver Medium. Data Transmission. Direct link. Point-to-point.") Terminology (1) Chapter 3 Data Transmission Transmitter Receiver Medium Guided medium e.g. twisted pair, optical fiber Unguided medium e.g. air, water, vacuum Spring 2012 03-1 Spring 2012 03-2 Terminology
Terminology (1) Chapter 3 Data Transmission Transmitter Receiver Medium Guided medium e.g. twisted pair, optical fiber Unguided medium e.g. air, water, vacuum Spring 2012 03-1 Spring 2012 03-2 Terminology
A METHOD FOR OPTIMAL RECONSTRUCTION OF VELOCITY RESPONSE USING EXPERIMENTAL DISPLACEMENT AND ACCELERATION SIGNALS
 ICSV14 Cairns Australia 9-12 July, 27 A METHOD FOR OPTIMAL RECONSTRUCTION OF VELOCITY RESPONSE USING EXPERIMENTAL DISPLACEMENT AND ACCELERATION SIGNALS Gareth J. Bennett 1 *, José Antunes 2, John A. Fitzpatrick
Today s menu. Last lecture. Series mode interference. Noise and interferences R/2 V SM Z L. E Th R/2. Voltage transmission system
 Last lecture Introduction to statistics s? Random? Deterministic? Probability density functions and probabilities? Properties of random signals. Today s menu Effects of noise and interferences in measurement
System on a Chip. Prof. Dr. Michael Kraft
 System on a Chip Prof. Dr. Michael Kraft Lecture 5: Data Conversion ADC Background/Theory Examples Background Physical systems are typically analogue To apply digital signal processing, the analogue signal
! Multi-Rate Filter Banks (con t) ! Data Converters. " Anti-aliasing " ADC. " Practical DAC. ! Noise Shaping
 ! Data Converters. Anti-aliasing ADC. Practical DAC. ! Noise Shaping") Lecture Outline ESE 531: Digital Signal Processing! (con t)! Data Converters Lec 11: February 16th, 2017 Data Converters, Noise Shaping " Anti-aliasing " ADC " Quantization "! Noise Shaping 2! Use filter
Lecture Outline ESE 531: Digital Signal Processing! (con t)! Data Converters Lec 11: February 16th, 2017 Data Converters, Noise Shaping " Anti-aliasing " ADC " Quantization "! Noise Shaping 2! Use filter
(i) Sine sweep (ii) Sine beat (iii) Time history (iv) Continuous sine
 Sine sweep (ii) Sine beat (iii) Time history (iv) Continuous sine") A description is given of one way to implement an earthquake test where the test severities are specified by the sine-beat method. The test is done by using a biaxial computer aided servohydraulic test
A description is given of one way to implement an earthquake test where the test severities are specified by the sine-beat method. The test is done by using a biaxial computer aided servohydraulic test
Lecture Outline. ESE 531: Digital Signal Processing. Anti-Aliasing Filter with ADC ADC. Oversampled ADC. Oversampled ADC
 Lecture Outline ESE 531: Digital Signal Processing Lec 12: February 21st, 2017 Data Converters, Noise Shaping (con t)! Data Converters " Anti-aliasing " ADC " Quantization "! Noise Shaping 2 Anti-Aliasing
The quality of the transmission signal The characteristics of the transmission medium. Some type of transmission medium is required for transmission:
 Data Transmission The successful transmission of data depends upon two factors: The quality of the transmission signal The characteristics of the transmission medium Some type of transmission medium is
Mobile Radio Propagation: Small-Scale Fading and Multi-path
 Mobile Radio Propagation: Small-Scale Fading and Multi-path 1 EE/TE 4365, UT Dallas 2 Small-scale Fading Small-scale fading, or simply fading describes the rapid fluctuation of the amplitude of a radio
FFT Analyzer. Gianfranco Miele, Ph.D
 FFT Analyzer Gianfranco Miele, Ph.D www.eng.docente.unicas.it/gianfranco_miele g.miele@unicas.it Introduction It is a measurement instrument that evaluates the spectrum of a time domain signal applying
Measurement System for Acoustic Absorption Using the Cepstrum Technique. Abstract. 1. Introduction
 The 00 International Congress and Exposition on Noise Control Engineering Dearborn, MI, USA. August 9-, 00 Measurement System for Acoustic Absorption Using the Cepstrum Technique E.R. Green Roush Industries
Theory and praxis of synchronised averaging in the time domain
 J. Tůma 43 rd International Scientific Colloquium Technical University of Ilmenau September 21-24, 1998 Theory and praxis of synchronised averaging in the time domain Abstract The main topics of the paper
Discrete Fourier Transform
 Discrete Fourier Transform The DFT of a block of N time samples {a n } = {a,a,a 2,,a N- } is a set of N frequency bins {A m } = {A,A,A 2,,A N- } where: N- mn A m = S a n W N n= W N e j2p/n m =,,2,,N- EECS
Chapter 2. Signals and Spectra
 Chapter 2 Signals and Spectra Outline Properties of Signals and Noise Fourier Transform and Spectra Power Spectral Density and Autocorrelation Function Orthogonal Series Representation of Signals and Noise
ECE 476/ECE 501C/CS Wireless Communication Systems Winter Lecture 6: Fading
 ECE 476/ECE 501C/CS 513 - Wireless Communication Systems Winter 2005 Lecture 6: Fading Last lecture: Large scale propagation properties of wireless systems - slowly varying properties that depend primarily
Excitation Techniques Do s and Don ts
 Peter Avitabile UMASS Lowell Excitation Techniques Do s and Don ts Marco Peres The Modal Shop 1 Dr. Peter Avitabile Excitation Considerations Objectives of this lecture: Overview impact testing considerations
Coherence Function in Noisy Linear System
 International Journal of Biomedical Science Engineering 015; 3(): 5-33 Published online March 31, 015 (http://www.sciencepublishinggroup.com/j/ijbse) doi: 10.11648/j.ijbse.015030.13 ISSN: 376-77 (Print);
Time and Frequency Domain Windowing of LFM Pulses Mark A. Richards
 Time and Frequency Domain Mark A. Richards September 29, 26 1 Frequency Domain Windowing of LFM Waveforms in Fundamentals of Radar Signal Processing Section 4.7.1 of [1] discusses the reduction of time
INTRODUCTION TO RADAR SIGNAL PROCESSING
 INTRODUCTION TO RADAR SIGNAL PROCESSING Christos Ilioudis University of Strathclyde c.ilioudis@strath.ac.uk Overview History of Radar Basic Principles Principles of Measurements Coherent and Doppler Processing
Proceedings of the 5th WSEAS Int. Conf. on SIGNAL, SPEECH and IMAGE PROCESSING, Corfu, Greece, August 17-19, 2005 (pp17-21)
") Ambiguity Function Computation Using Over-Sampled DFT Filter Banks ENNETH P. BENTZ The Aerospace Corporation 5049 Conference Center Dr. Chantilly, VA, USA 90245-469 Abstract: - This paper will demonstrate
Ambiguity Function Computation Using Over-Sampled DFT Filter Banks ENNETH P. BENTZ The Aerospace Corporation 5049 Conference Center Dr. Chantilly, VA, USA 90245-469 Abstract: - This paper will demonstrate
Signal Characteristics
 Data Transmission The successful transmission of data depends upon two factors:» The quality of the transmission signal» The characteristics of the transmission medium Some type of transmission medium
Detection of Targets in Noise and Pulse Compression Techniques
 Introduction to Radar Systems Detection of Targets in Noise and Pulse Compression Techniques Radar Course_1.ppt ODonnell 6-18-2 Disclaimer of Endorsement and Liability The video courseware and accompanying
Data Communication. Chapter 3 Data Transmission
 Data Communication Chapter 3 Data Transmission ١ Terminology (1) Transmitter Receiver Medium Guided medium e.g. twisted pair, coaxial cable, optical fiber Unguided medium e.g. air, water, vacuum ٢ Terminology
TEST EQUIPMENT CO., LTD
 Electromagnetic Type High Frequency Vibration Tester (ES-3) Technical Specification Index 1 Application...page 2 2 Vibration System...page 2-5 2-1 Technical Parameters 2-2 Vibration Components Details
g - Compensated, Miniature, High Performance Quartz Crystal Oscillators Frequency Electronics Inc. Hugo Fruehauf
 g - Compensated, Miniature, High Performance Quartz Crystal Oscillators Frequency Electronics Inc. Hugo Fruehauf hxf@fei-zyfer.com April 2007 Discussion Outline Introduction Radar Applications GPS Navigation
Analysis of room transfer function and reverberant signal statistics
 Analysis of room transfer function and reverberant signal statistics E. Georganti a, J. Mourjopoulos b and F. Jacobsen a a Acoustic Technology Department, Technical University of Denmark, Ørsted Plads,
EE 215 Semester Project SPECTRAL ANALYSIS USING FOURIER TRANSFORM
 EE 215 Semester Project SPECTRAL ANALYSIS USING FOURIER TRANSFORM Department of Electrical and Computer Engineering Missouri University of Science and Technology Page 1 Table of Contents Introduction...Page
Practical Applications of the Wavelet Analysis
 Practical Applications of the Wavelet Analysis M. Bigi, M. Jacchia, D. Ponteggia ALMA International Europe (6- - Frankfurt) Summary Impulse and Frequency Response Classical Time and Frequency Analysis
Real-Time FFT Analyser - Functional Specification
 Real-Time FFT Analyser - Functional Specification Input: Number of input channels 2 Input voltage ranges ±10 mv to ±10 V in a 1-2 - 5 sequence Autorange Pre-acquisition automatic selection of full-scale
Structural Dynamics Measurements Mark H. Richardson Vibrant Technology, Inc. Jamestown, CA 95327
 Structural Dynamics Measurements Mark H. Richardson Vibrant Technology, Inc. Jamestown, CA 95327 Introduction In this paper, the term structural dynamics measurements will more specifically mean the measurement
Reading: Johnson Ch , Ch.5.5 (today); Liljencrants & Lindblom; Stevens (Tues) reminder: no class on Thursday.
; Liljencrants & Lindblom; Stevens (Tues) reminder: no class on Thursday.") L105/205 Phonetics Scarborough Handout 7 10/18/05 Reading: Johnson Ch.2.3.3-2.3.6, Ch.5.5 (today); Liljencrants & Lindblom; Stevens (Tues) reminder: no class on Thursday Spectral Analysis 1. There are
L105/205 Phonetics Scarborough Handout 7 10/18/05 Reading: Johnson Ch.2.3.3-2.3.6, Ch.5.5 (today); Liljencrants & Lindblom; Stevens (Tues) reminder: no class on Thursday Spectral Analysis 1. There are
An Introduction to Spectrum Analyzer. An Introduction to Spectrum Analyzer
 1 An Introduction to Spectrum Analyzer 2 Chapter 1. Introduction As a result of rapidly advancement in communication technology, all the mobile technology of applications has significantly and profoundly
SAMPLING THEORY. Representing continuous signals with discrete numbers
 SAMPLING THEORY Representing continuous signals with discrete numbers Roger B. Dannenberg Professor of Computer Science, Art, and Music Carnegie Mellon University ICM Week 3 Copyright 2002-2013 by Roger
CHAPTER 6 INTRODUCTION TO SYSTEM IDENTIFICATION
 CHAPTER 6 INTRODUCTION TO SYSTEM IDENTIFICATION Broadly speaking, system identification is the art and science of using measurements obtained from a system to characterize the system. The characterization
MODEL MODIFICATION OF WIRA CENTER MEMBER BAR
 MODEL MODIFICATION OF WIRA CENTER MEMBER BAR F.R.M. Romlay & M.S.M. Sani Faculty of Mechanical Engineering Kolej Universiti Kejuruteraan & Teknologi Malaysia (KUKTEM), Karung Berkunci 12 25000 Kuantan
Auditory Based Feature Vectors for Speech Recognition Systems
 Auditory Based Feature Vectors for Speech Recognition Systems Dr. Waleed H. Abdulla Electrical & Computer Engineering Department The University of Auckland, New Zealand [w.abdulla@auckland.ac.nz] 1 Outlines
Digital Signal Processing +
 Digital Signal Processing + Nikil Dutt UC Irvine ICS 212 Winter 2005 + Material adapted from Tony Givargis & Rajesh Gupta Templates from Prabhat Mishra ICS212 WQ05 (Dutt) DSP 1 Introduction Any interesting
RECOMMENDATION ITU-R F *, ** Signal-to-interference protection ratios for various classes of emission in the fixed service below about 30 MHz
 Rec. ITU-R F.240-7 1 RECOMMENDATION ITU-R F.240-7 *, ** Signal-to-interference protection ratios for various classes of emission in the fixed service below about 30 MHz (Question ITU-R 143/9) (1953-1956-1959-1970-1974-1978-1986-1990-1992-2006)
ECE 476/ECE 501C/CS Wireless Communication Systems Winter Lecture 6: Fading
 ECE 476/ECE 501C/CS 513 - Wireless Communication Systems Winter 2003 Lecture 6: Fading Last lecture: Large scale propagation properties of wireless systems - slowly varying properties that depend primarily
EE 451: Digital Signal Processing
 EE 451: Digital Signal Processing Stochastic Processes and Spectral Estimation Aly El-Osery Electrical Engineering Department, New Mexico Tech Socorro, New Mexico, USA November 29, 2011 Aly El-Osery (NMT)
The University of Texas at Austin Dept. of Electrical and Computer Engineering Final Exam
 The University of Texas at Austin Dept. of Electrical and Computer Engineering Final Exam Date: December 18, 2017 Course: EE 313 Evans Name: Last, First The exam is scheduled to last three hours. Open
System identification studies with the stiff wing minimutt Fenrir Flight 20
 SYSTEMS TECHNOLOGY, INC 3766 S. HAWTHORNE BOULEVARD HAWTHORNE, CALIFORNIA 925-783 PHONE (3) 679-228 email: sti@systemstech.com FAX (3) 644-3887 Working Paper 439- System identification studies with the
SHOCK RESPONSE SPECTRUM SYNTHESIS VIA DAMPED SINUSOIDS Revision B
 SHOCK RESPONSE SPECTRUM SYNTHESIS VIA DAMPED SINUSOIDS Revision B By Tom Irvine Email: tomirvine@aol.com April 5, 2012 Introduction Mechanical shock can cause electronic components to fail. Crystal oscillators
Lecture 2 Physical Layer - Data Transmission
 DATA AND COMPUTER COMMUNICATIONS Lecture 2 Physical Layer - Data Transmission Mei Yang Based on Lecture slides by William Stallings 1 DATA TRANSMISSION The successful transmission of data depends on two
Department of Mechanical and Aerospace Engineering. MAE334 - Introduction to Instrumentation and Computers. Final Examination.
 Name: Number: Department of Mechanical and Aerospace Engineering MAE334 - Introduction to Instrumentation and Computers Final Examination December 12, 2003 Closed Book and Notes 1. Be sure to fill in your
ASTR Sequential Data 1D, cont.
 ASTR509-18 Sequential Data 1D, cont. Joseph Fourier 1768-1830 Three-way conflict priesthood/math/politics Jailed in 1794 for speaking out against the terror. Freed 1794. Ecole Normale tutors Lagrange and
6 Sampling. Sampling. The principles of sampling, especially the benefits of coherent sampling
 Note: Printed Manuals 6 are not in Color Objectives This chapter explains the following: The principles of sampling, especially the benefits of coherent sampling How to apply sampling principles in a test