Visualizing Global Satellite Images Downloading Requests
|
|
|
- Calvin Booth
- 5 years ago
- Views:
Transcription
1 Visualizing Global Satellite Images Downloading Requests Joshua Job and Ziliang Zong Department of Mathematics and Computer Science South Dakota School of Mines, Rapid City, SD Abstract The USGS Earth Resources Observation and Science (EROS) Center recently made its medium resolution images taken by the Landsat 7 and Landsat 5 satellites available to the public at no charge. This caused a dramatic increase of user downloading requests both nationally and globally. Since each request takes time and significant resources to fulfill, EROS is facing great challenges of using existing resources to accommodate ever increasing requests. EROS center is looking at ways to utilize its available resources in a more efficient manner and evaluating the possibility of expanding current resources. This paper analyzes and visualizes the user download requests patterns in the last two months (October 1, December 31, 2009). The results provided in this paper might be useful for EROS to make decisions on how to reorganize and expand its currently available resources in order to provide better services. 1. Introduction The satellite images provided by the Earth Resources Observation and Science (EROS) center of the U.S Geological Survey (USGS) have large impact on the research areas of Geology, Geological Engineering, Hydrology and Earth Science. In October 2008, EROS made its medium resolution images taken by the Landsat 7 and Landsat 5 satellites available to the public for free. The number of download requests of EROS has significantly increased due to the new free downloading policy. For example, the number of scenes processed within the last two months is almost equal to the number of scenes processed during the last two years. EROS records according information every time when users send requests to a log file, which includes PRODUCT_REQUEST_ID, LANDSAT_SCENE_ID, WRS_PATH, WRS_ROW and TIME_SENT_TO_PROCESS. Since these log information is recorded in the form of plain text, it is extremely difficult to analyze these data and find out the useful user download patterns hidden behind the raw data. To address this problem, we design and implement a visualization tool in this paper, which can convert the plain text information to visualized spatial information. 1
2 Using this tool, we are able to easily discover the user downloading patterns all over the world and classify user behavior habits. We found out that there are two main types of people requesting satellite images from the EROS center from October 1, 2009 December 31, The first type is called aggressive user, who is attempting to grab all images available online. The second type is general users, who requests a small number of images related to their work and do not place much of a burden on the system. The aggressive groups have placed a major burden on the system because they sent a large number of requests within a short time. However, these aggressive users may eventually slow down once they have gathered a significant amount images. There are two possible solutions to address the system burden currently caused by the aggressive users. The first solution is to assign higher priority to non-aggressive users. Since the general users requests are small and are the normal customers of the EROS Center, a priority queue can be used to reduce the effect of aggressive users. The second approach is to cache images at another location. A growing trend in providing services on the Internet is to cache files used frequently by users in a location closer to the end user than the central facility. It would be possible for the EROS center to cache images for aggressive users in this way by purchasing similar services from a mirror data server closer to the end user. However, this would be a costly solution for duplicating data and it requires accurate analysis on where most aggressive users locate. The rest of the paper is organized as follows. In section 2, we present the design and implementation of the visualization tool. Visualization results are shown in section 3. Finally, section 4 provides the concluding remarks and future work. 2. Visualization Tools The raw data, which is a log file recording the user downloading requests, was received in an ascii table. The raw data are manipulated using a series of two Perl scripts. The first script translates the data to an intermediate form and the second script processes the data. More specifically, the first script translates the raw data to a form that separates fields with commas and records with newlines. The second script takes the output from the first script and counts the number of requests from a given row and path. The script then outputs the count of each row and path to a Keyhole Markup Language (KML) file for viewing in Google Earth. Counts of zero are not included. KML files allows us to display place marks, polygons, points, groups of polygons and points, pictures and models within Google Earth by describing them in XML. Using data obtained from EROS, every row and path output is converted to a polygon. To determine the color of the polygon, the count is multiplied by the maximum number of colors and divided by the maximum 2
3 count. Colors are 32-bits long with 48-bits fields (most significant byte first): 1) Transparency, 2) blue, 3) green, 4) red. Some red and transparency are on by default; then colors are scaled first through green and then into blue. However, when polygons are specified that cross 180 degrees longitude, Google Earth draws them going around the Earth in the opposite direction. To correct this problem, polygons that cross this line are split in two along it. Both of these halves are then placed in the same group. Google Earth then treats them as the same object when presented to the user. 3. Visualization Results We present a group of visualization results (Figs.1-4) taken from Google Earth showing the amount of times a given area was requested from EROS. These images were generated from a KML file created by processing the given data set with a Perl script. They show popular locations around the globe. 4. Conclusions and Future Work In this paper, we designed and implemented a visualization tool, which is able to convert plain text information to visualized spatial information. This visualization tool is a combination of Perl scripts and Google Earth. We illustrated how to utilize the visualization tool by generating the visualized version of global satellite images downloading requests from EROS. Future work of this project should focus on improving the quality of generated visualization results. For example, we could remove the pins for the images with low request frequency. Further work also can be done in designing better function that decides the color based on the requests frequency. Currently, we are using a linear function but a function with standard deviation may generate better results. 3


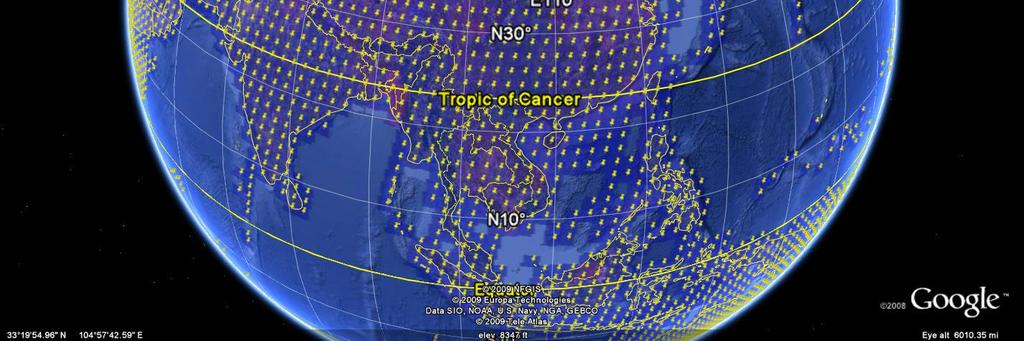
4 Figure 1. Sample Pattern of North America Figure 2. Sample Pattern of Asia 4


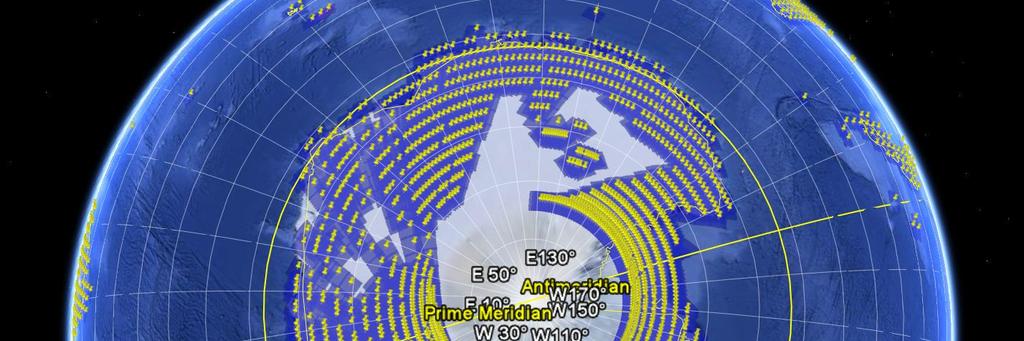

5 Figure 3. Sample Pattern of Africa Figure 3. Sample Pattern of Antarctica 5
QUATERNARY PARK: RETRIEVAL OF LOST SATELLITE IMAGES FROM THE LATE 20TH CENTURY
 QUATERNARY PARK: RETRIEVAL OF LOST SATELLITE IMAGES FROM THE LATE 20TH CENTURY Grady Price Blount Department of Physical and Life Sciences Texas A & M University Corpus Christi, TX Thomas M. Holm U.S.
Tour the World with World Wind By Rob Rice
 Tour the World with World Wind By Rob Rice Lots of folks are familiar with Google Earth the free downloadable virtual globe program. Yet, I am finding that many have never heard of NASA S World Wind. World
White Paper. Medium Resolution Images and Clutter From Landsat 7 Sources. Pierre Missud
 White Paper Medium Resolution Images and Clutter From Landsat 7 Sources Pierre Missud Medium Resolution Images and Clutter From Landsat7 Sources Page 2 of 5 Introduction Space technologies have long been
Please show the instructor your downloaded index files and orthoimages.
 Student Exercise 1: Sandia Forest Infestation Acquiring Orthophotos and Satellite Imagery Please show the instructor your downloaded index files and orthoimages. Objectives: Determine appropriate imagery
29 th Annual Louisiana RS/GIS Workshop April 23, 2013 Cajundome Convention Center Lafayette, Louisiana
 Landsat Data Continuity Mission 29 th Annual Louisiana RS/GIS Workshop April 23, 2013 Cajundome Convention Center Lafayette, Louisiana http://landsat.usgs.gov/index.php# Landsat 5 Sets Guinness World Record
Downloading Imagery & LIDAR
 Downloading Imagery & LIDAR 333 Earth Explorer The USGS is a great source for downloading many different GIS data products for the entire US and Canada and much of the world. Below are instructions for
Update on Landsat Program and Landsat Data Continuity Mission
 Update on Landsat Program and Landsat Data Continuity Mission Dr. Jeffrey Masek LDCM Deputy Project Scientist NASA GSFC, Code 923 November 21, 2002 Draft LDCM Implementation Phase RFP Overview Page 1 Celebrate!
The first part of Module three, data and tools, presents some of the resources available on the internet to get images from the satellites presented
 The first part of Module three, data and tools, presents some of the resources available on the internet to get images from the satellites presented in the previous module and some uses of the images,
Remote Sensing in an
 Chapter 8. Downloading Landsat Imagery using Earth Explorer Remote Sensing in an ArcMap Environment Remote Sensing Analysis in an ArcMap Environment Tammy E. Parece Image source: landsat.usgs.gov Tammy
How to Access Imagery and Carry Out Remote Sensing Analysis Using Landsat Data in a Browser
 How to Access Imagery and Carry Out Remote Sensing Analysis Using Landsat Data in a Browser Including Introduction to Remote Sensing Concepts Based on: igett Remote Sensing Concept Modules and GeoTech
Field size estimation, past and future opportunities
 Field size estimation, past and future opportunities Lin Yan & David Roy Geospatial Sciences Center of Excellence South Dakota State University February 13-15 th 2018 Advances in Emerging Technologies
AUIG2 User s Manual (ALOS/ALOS-2 Consolidated Edition)
") AUIG2 User s Manual (ALOS/ALOS-2 Consolidated Edition) Ver. No. First edition AUIG2 User s Manual (ALOS/ALOS-2 Consolidated Edition) Revision History Revision Date Revised Pages Revision Details A 2014/11/19
AUIG2 User s Manual (ALOS/ALOS-2 Consolidated Edition) Ver. No. First edition AUIG2 User s Manual (ALOS/ALOS-2 Consolidated Edition) Revision History Revision Date Revised Pages Revision Details A 2014/11/19
Google Earth Workshop Version 5
 Google Earth Workshop Version 5 From the Mitchell Home Page (http://mitchell.needham.k12.ma.us) Technology > For Teachers > Prof Dev > Google Earth Getting to Know Google Earth Taken from Google Earth
WGISS-42 USGS Agency Report
 WGISS-42 USGS Agency Report U.S. Department of the Interior U.S. Geological Survey Kristi Kline USGS EROS Center Major Activities Landsat Archive/Distribution Changes Land Change Monitoring, Assessment,
Raster is faster but vector is corrector
 Account not required Raster is faster but vector is corrector The old GIS adage raster is faster but vector is corrector comes from the two different fundamental GIS models: vector and raster. Each of
Satellite image classification
 Satellite image classification EG2234 Earth Observation Image Classification Exercise 29 November & 6 December 2007 Introduction to the practical This practical, which runs over two weeks, is concerned
The availability of cloud free Landsat TM and ETM+ land observations and implications for global Landsat data production
 14475 The availability of cloud free Landsat TM and ETM+ land observations and implications for global Landsat data production *V. Kovalskyy, D. Roy (South Dakota State University) SUMMARY The NASA funded
APCAS/10/21 April 2010 ASIA AND PACIFIC COMMISSION ON AGRICULTURAL STATISTICS TWENTY-THIRD SESSION. Siem Reap, Cambodia, April 2010
 APCAS/10/21 April 2010 Agenda Item 8 ASIA AND PACIFIC COMMISSION ON AGRICULTURAL STATISTICS TWENTY-THIRD SESSION Siem Reap, Cambodia, 26-30 April 2010 The Use of Remote Sensing for Area Estimation by Robert
Spatial Analyst is an extension in ArcGIS specially designed for working with raster data.
 Spatial Analyst is an extension in ArcGIS specially designed for working with raster data. 1 Do you remember the difference between vector and raster data in GIS? 2 In Lesson 2 you learned about the difference
Landsat 8 Pansharpen and Mosaic Geomatica 2015 Tutorial
 Landsat 8 Pansharpen and Mosaic Geomatica 2015 Tutorial On February 11, 2013, Landsat 8 was launched adding to the constellation of Earth imaging satellites. It is the seventh satellite to reach orbit
AmericaView EOD 2016 page 1 of 16
 Remote Sensing Flood Analysis Lesson Using MultiSpec Online By Larry Biehl Systems Manager, Purdue Terrestrial Observatory (biehl@purdue.edu) v Objective The objective of these exercises is to analyze
Haptic control in a virtual environment
 Haptic control in a virtual environment Gerard de Ruig (0555781) Lourens Visscher (0554498) Lydia van Well (0566644) September 10, 2010 Introduction With modern technological advancements it is entirely
Remote Sensing. The following figure is grey scale display of SPOT Panchromatic without stretching.
 Remote Sensing Objectives This unit will briefly explain display of remote sensing image, geometric correction, spatial enhancement, spectral enhancement and classification of remote sensing image. At
UW Campus Navigator: WiFi Navigation
 UW Campus Navigator: WiFi Navigation Eric Work Electrical Engineering Department University of Washington Introduction When 802.11 wireless networking was first commercialized, the high prices for wireless
MRLC 2001 IMAGE PREPROCESSING PROCEDURE
 MRLC 2001 IMAGE PREPROCESSING PROCEDURE The core dataset of the MRLC 2001 database consists of Landsat 7 ETM+ images. Image selection is based on vegetation greenness profiles defined by a multi-year normalized
Using Web-based Tools for GIS-Friendly Satellite Imagery
 Using Web-based Tools for GIS-Friendly Satellite Imagery Lindsey Harriman SGT, Contractor to the USGS EROS Center, Sioux Falls, South Dakota **Work performed under USGS contract G10PC00044 U.S. Department
DISTINGUISHING URBAN BUILT-UP AND BARE SOIL FEATURES FROM LANDSAT 8 OLI IMAGERY USING DIFFERENT DEVELOPED BAND INDICES
 DISTINGUISHING URBAN BUILT-UP AND BARE SOIL FEATURES FROM LANDSAT 8 OLI IMAGERY USING DIFFERENT DEVELOPED BAND INDICES Mark Daryl C. Janiola (1), Jigg L. Pelayo (1), John Louis J. Gacad (1) (1) Central
Impact toolbox. ZIP/DN to TOA reflectance. Principles and tutorial
 Impact toolbox ZIP/DN to TOA reflectance Principles and tutorial ZIP/DN to TOA reflectance principles RapidEye, Landsat and Sentinel 2 are distributed by their owner in a specific format. The file itself
Earth Observations from Space U.S. Geological Survey
 Earth Observations from Space U.S. Geological Survey Geography Land Remote Sensing Program Dr. Bryant Cramer April 1, 2009 U.S. Department of the Interior U.S. Geological Survey USGS Landsat Historical
AN INTERACTIVE GRAPHICAL USER INTERFACE FOR MARITIME SECURITY SERVICES
 AN INTERACTIVE GRAPHICAL USER INTERFACE FOR MARITIME SECURITY SERVICES T. Reize; R. Müller, R. Kiefl German Aerospace Center (DLR) Earth Observation Center (EOC) Tanja.reize@dlr.de KEY WORDS: Graphical
Analysis of Secure Text Embedding using Steganography
 Analysis of Secure Text Embedding using Steganography Rupinder Kaur Department of Computer Science and Engineering BBSBEC, Fatehgarh Sahib, Punjab, India Deepak Aggarwal Department of Computer Science
Open Standard based Visualization Infrastructure for 3D Geospatial Information
 X3D Earth Open Standard based Visualization Infrastructure for 3D Geospatial Information 13 January 2008 / Web3D Korea Forum 유병현 Byounghyun Yoo Web3D Consortium Fellow MOVES (Modeling, Virtual Environment
Digital Image Processing
 Digital Image Processing 1 Patrick Olomoshola, 2 Taiwo Samuel Afolayan 1,2 Surveying & Geoinformatic Department, Faculty of Environmental Sciences, Rufus Giwa Polytechnic, Owo. Nigeria Abstract: This paper
Remote Sensing in an
 Chapter 6: Displaying Data Remote Sensing in an ArcMap Environment Remote Sensing Analysis in an ArcMap Environment Tammy E. Parece Image source: landsat.usgs.gov Tammy Parece James Campbell John McGee
Land Remote Sensing Lab 4: Classication and Change Detection Assigned: October 15, 2017 Due: October 27, Classication
 Name: Land Remote Sensing Lab 4: Classication and Change Detection Assigned: October 15, 2017 Due: October 27, 2017 In this lab, you will generate several gures. Please sensibly name these images, save
Distance Measurement. Figure 1: Internals of an IR electro-optical distance sensor
 Distance Measurement The Sharp GP2D12 Infrared Distance Sensor is an electro-optical device that emits an infrared (IR) beam from an LED and has a position sensitive detector (PSD) that receives reflected
Greg Dydalewicz Animation Six Weeks TEKS TEKS Strand Interdisciplinary/Activity 1st (1) Creativity and
 Creativity and") Six Weeks TEKS TEKS Strand Interdisciplinary/Activity 1st (1) Creativity and (A) use vocabulary as it Art, Chemistry, Physics, innovation. The student relates to digital art, audio, Writing, Research and
Six Weeks TEKS TEKS Strand Interdisciplinary/Activity 1st (1) Creativity and (A) use vocabulary as it Art, Chemistry, Physics, innovation. The student relates to digital art, audio, Writing, Research and
Standing Up NAIP and Landsat Image Services as a Processing Resource. Andrew Leason
 Standing Up NAIP and Landsat Image Services as a Processing Resource Andrew Leason NAIP and Landsat services Differences Different general uses - Landsat - Available from USGS - Designed as an analytical
Liquid Galaxy: a multi-display platform for panoramic geographic-based presentations
 Liquid Galaxy: a multi-display platform for panoramic geographic-based presentations JULIA GIANNELLA, IMPA, LUIZ VELHO, IMPA, Fig 1: Liquid Galaxy is a multi-display platform
Using NAFI viewing fire histories and
 July 207 Using NAFI viewing fire histories and downloading data The NAFI site has a number of tools that are useful for planning fire management. These are found under the Track Fires, View Fire History,
Fundamentals of Remote Sensing
 Climate Variability, Hydrology, and Flooding Fundamentals of Remote Sensing May 19-22, 2015 GEO-Latin American & Caribbean Water Cycle Capacity Building Workshop Cartagena, Colombia 1 Objective To provide
QGIS document from the previous exercise: worldmap.qgs
 MAP PROJECTION 1. Introduction: All data in a GIS view must be in the same projection in order to correctly align with other datasets. In QGIS this is often done in the background. QGIS will use the projection
Forest Inventory System. User manual v.1.2
 Forest Inventory System User manual v.1.2 Table of contents 1. How TRESTIMA works... 3 1.2 How TRESTIMA calculates basal area... 3 2. Usage in the forest... 5 2.1. Measuring basal area by shooting pictures...
Bridgemate App. Information for bridge clubs and tournament directors. Version 2. Bridge Systems BV
 Bridgemate App Information for bridge clubs and tournament directors Version 2 Bridge Systems BV Bridgemate App Information for bridge clubs and tournament directors Page 2 Contents Introduction... 3 Basic
Downloading and formatting remote sensing imagery using GLOVIS
 Downloading and formatting remote sensing imagery using GLOVIS Students will become familiarized with the characteristics of LandSat, Aerial Photos, and ASTER medium resolution imagery through the USGS
IceTrendr - Polygon - Pixel
 INTRODUCTION Using the 1984-2015 Landsat satellite imagery as the primary information source, we want to observe and describe how the land cover changes through time. Using a pixel as the plot extent (30m
Scribble Maps Tutorial
 Scribble Maps Tutorial Go to the homepage of Scribble Maps here: h t t p : / / w w w. s c r i b b l e m a p s. c o m / Getting to know the Interface Scribble Maps is a free online mapping application with
Crop area estimates in the EU. The use of area frame surveys and remote sensing
 INRA Rabat, October 14,. 2011 1 Crop area estimates in the EU. The use of area frame surveys and remote sensing Javier.gallego@jrc.ec.europa.eu Main approaches to agricultural statistics INRA Rabat, October
Line and polygon features can be created via on-screen digitizing.
 This module explains how GPS works, sources of error, and error correction using real time or post processing differential correction. Cost and accuracy of different grades of GPS units are also part of
Level Below Basic Basic Proficient Advanced. Policy PLDs. Cognitive Complexity
 Level Below Basic Basic Proficient Advanced Policy PLDs (Performance Level Descriptors) General descriptors that provide overall claims about a student's performance in each performance level; used to
Data acquisition and access for the Congo Basin
 MRV Joint Workshop 22-24 June 2010, Guadalajara, Jalisco Mexico Data acquisition and access for the Congo Basin Landing Mané 1, Michael Brady 2, Chris Justice 3 and Alice Altstatt 3 1) Satellite Observatory
Finding an Active Shooter with GNURadio
 Finding an Active Shooter with GNURadio 1 Active Shooter Tactical Response Assistant Team : George Mason University Students: Ben McCall, Puja Patel, Joel Williams, Rohini Shah, Aryan Toughiry GMU Sponsors:
Remote Sensing in an
 Chapter 20: Accuracy Assessment Remote Sensing in an ArcMap Environment Remote Sensing Analysis in an ArcMap Environment Tammy E. Parece Image source: landsat.usgs.gov Tammy Parece James Campbell John
Lesson Plan 1 Introduction to Google Earth for Middle and High School. A Google Earth Introduction to Remote Sensing
 A Google Earth Introduction to Remote Sensing Image an image is a representation of reality. It can be a sketch, a painting, a photograph, or some other graphic representation such as satellite data. Satellites
Celtx Studios Owner's Manual January 2011
 January 2011 Get the most out of Celtx Studios with the latest version of Celtx - available free at http://celtx.com Screen captures are made using Windows OS. Some image dialogs differ slightly on Mac
TimeSync V3 User Manual. January Introduction
 TimeSync V3 User Manual January 2017 Introduction TimeSync is an application that allows researchers and managers to characterize and quantify disturbance and landscape change by facilitating plot-level
At-Satellite Reflectance: A First Order Normalization Of Landsat 7 ETM+ Images
 University of Nebraska - Lincoln DigitalCommons@University of Nebraska - Lincoln Publications of the US Geological Survey US Geological Survey 21 At-Satellite Reflectance: A First Order Normalization Of
Supervised Land Cover Classification An introduction to digital image classification using the Multispectral Image Data Analysis System (MultiSpec )
") Supervised Land Cover Classification An introduction to digital image classification using the Multispectral Image Data Analysis System (MultiSpec ) Level: Grades 9 to 12 Windows version With Teacher Notes
Supervised Land Cover Classification An introduction to digital image classification using the Multispectral Image Data Analysis System (MultiSpec ) Level: Grades 9 to 12 Windows version With Teacher Notes
Bloodhound RMS Product Overview
 Page 2 of 10 What is Guard Monitoring? The concept of personnel monitoring in the security industry is not new. Being able to accurately account for the movement and activity of personnel is not only important
* = 18 (instead of dividing, multiply by the reciprocal * 5 11 = 10
 Behavior is the mirror in which everyone shows their image. Introduction: Non-verbal reasoning as the questions appear in diagrammatic and pictorial form. Such test are also called diagrammatic or abstract
Introduction Getting Started
 Introduction Getting Started 1. If you haven t done it already, download Google Earth TM 5.0 from earth.google.com and install it on your computer. 2. If you haven t done it already, download the Essentials_3E_Geotours.kmz
Part 1. Tracing the Dimensions of Some Common Pixel Sizes using a GPS Receiver
 Field and Laboratory Exercise PIXEL DELINEATIONS 1 IMPORTING GPS DATA TO IMAGE BACKGROUND Objectives: 1. Demonstrate the differences in spatial resolution of selected remote sensing instruments. 2. Use
Development of a Real Time Trains Monitoring System:Case Study of Tanzania Zambia Railway Authority
 ZAMBIA INFORMATION COMMUNICATION TECHNOLOGY (ICT) JOURNAL Volume 1 (Issue 1) (2017) Pages 25-29 Development of a Real Time Trains Monitoring System:Case Study of Tanzania Zambia Railway Authority Prof.
Vegetation Phenology. Quantifying climate impacts on ecosystems: Field and Satellite Assessments
 Vegetation Phenology Quantifying climate impacts on ecosystems: Field and Satellite Assessments Plants can tell us a story about climate. Timing of sugar maple leaf drop (Ollinger, S.V. Potential effects
Provides help in resolving repeating defects in copies or prints Provides part numbers for ordering supplies
 Information guide Page 1 of 18 Information guide Help menu The Help menu consists of a series of Help pages that are stored in the multifunction printer (MFP) as PDFs. They contain information about using
Semi-Automatic Classification Plugin Documentation
 Semi-Automatic Classification Plugin Documentation Release 5.3.2.1 Luca Congedo February 05, 2017 Contents I Introduction 1 II Plugin Installation 5 1 Installation in Windows 32 bit 9 1.1 QGIS download
EDUCATION GIS CONFERENCE Geoprocessing with ArcGIS Pro. Rudy Prosser GISP CTT+ Instructor, Esri
 EDUCATION GIS CONFERENCE Geoprocessing with ArcGIS Pro Rudy Prosser GISP CTT+ Instructor, Esri Maintenance What is geoprocessing? Geoprocessing is - a framework and set of tools for processing geographic
Lecture 8: GIS Data Error & GPS Technology
 Lecture 8: GIS Data Error & GPS Technology A. Introduction We have spent the beginning of this class discussing some basic information regarding GIS technology. Now that you have a grasp of the basic terminology
Offset Presses X.1. Press A
 An offset press must be created in the Offset Press category. Printer s Plan offers two approaches to an Offset Press setup: One setup assumes the Press in question is not sensitive to various Paper types
Mastering Autodesk Navisworks 2013
 Mastering Autodesk Navisworks 2013 Dodds, J ISBN-13: 9781118281710 Table of Contents Foreword xvii Introduction xix Part 1 Navisworks Basics 1 Chapter 1 Getting to Know Autodesk Navisworks 3 Interface
Development of an improved flood frequency curve applying Bulletin 17B guidelines
 21st International Congress on Modelling and Simulation, Gold Coast, Australia, 29 Nov to 4 Dec 2015 www.mssanz.org.au/modsim2015 Development of an improved flood frequency curve applying Bulletin 17B
IceTrendr - Polygon. 1 contact: Peder Nelson Anne Nolin Polygon Attribution Instructions
 INTRODUCTION We want to describe the process that caused a change on the landscape (in the entire area of the polygon outlined in red in the KML on Google Earth), and we want to record as much as possible
The Landsat Legacy: Monitoring a Changing Earth. U.S. Department of the Interior U.S. Geological Survey
 The Landsat Legacy: Monitoring a Changing Earth U.S. Department of the Interior U.S. Geological Survey Tom Loveland March 17, 2001 Landsat Science Mission Change is occurring at rates unprecedented in
Ins and Outs of Stereograms
 The Art of Mathematics Ins and Outs of Stereograms Steve Plummer and Pat Ashforth Create simple stereogram drawings using ruler and pencil, or a computer drawing package. Easy, step by step instructions
366 Glossary. Popular method for scale drawings in a computer similar to GIS but without the necessity for spatial referencing CEP
 366 Glossary GISci Glossary ASCII ASTER American Standard Code for Information Interchange Advanced Spaceborne Thermal Emission and Reflection Radiometer Computer Aided Design Circular Error Probability
Fire Mapping in Google Earth. Accurate, efficient, cost effective wildland fire mapping from a fixed wing platform.
 Fire Mapping in Google Earth Accurate, efficient, cost effective wildland fire mapping from a fixed wing platform. Matthew Snyder July, 2015 Introduction In this document I will describe several methods
KEYWORDS Earthquakes; MEMS seismic stations; trigger data; warning time delays. Page 144
 Event Detection Time Delays from Community Earthquake Early Warning System Experimental Seismic Stations implemented in South Western Tanzania Between August 2012 and December 2013 Asinta Manyele 1, Alfred
Assignment: Light, Cameras, and Image Formation
 Assignment: Light, Cameras, and Image Formation Erik G. Learned-Miller February 11, 2014 1 Problem 1. Linearity. (10 points) Alice has a chandelier with 5 light bulbs sockets. Currently, she has 5 100-watt
Session 3 _ Part A Effective Coordination with Revit Models
 Session 3 _ Part A Effective Coordination with Revit Models Class Description Effective coordination relies upon a measured strategic approach to using clash detection software. This class will share best
Evidence Based Service Policy In Libraries: The Reality Of Digital Hybrids
 Qualitative and Quantitative Methods in Libraries (QQML) 5: 573-583, 2016 Evidence Based Service Policy In Libraries: The Reality Of Digital Hybrids Asiye Kakirman Yildiz Marmara University, Information
Improving the Detection of Near Earth Objects for Ground Based Telescopes
 Improving the Detection of Near Earth Objects for Ground Based Telescopes Anthony O'Dell Captain, United States Air Force Air Force Research Laboratories ABSTRACT Congress has mandated the detection of
White paper brief IdahoView Imagery Services: LISA 1 Technical Report no. 2 Setup and Use Tutorial
 White paper brief IdahoView Imagery Services: LISA 1 Technical Report no. 2 Setup and Use Tutorial Keith T. Weber, GISP, GIS Director, Idaho State University, 921 S. 8th Ave., stop 8104, Pocatello, ID
DIGITAL STORYTELLING CAPTURING LIVES, CREATING COMMUNITY 3RD (THIRD) EDITION
 EDITION") DIGITAL STORYTELLING CAPTURING LIVES, CREATING COMMUNITY 3RD (THIRD) EDITION DOWNLOAD EBOOK : DIGITAL STORYTELLING CAPTURING LIVES, CREATING Click link bellow and free register to download ebook: DIGITAL
DIGITAL STORYTELLING CAPTURING LIVES, CREATING COMMUNITY 3RD (THIRD) EDITION DOWNLOAD EBOOK : DIGITAL STORYTELLING CAPTURING LIVES, CREATING Click link bellow and free register to download ebook: DIGITAL
Appendix 2: Worked example using GPS
 Appendix 2: Worked example using GPS This appendix will talk the reader through how to use a GPS, get data out of the unit and use that data in the expedition GIS. The specific example used is a simple
Land Cover Change Analysis An Introduction to Land Cover Change Analysis using the Multispectral Image Data Analysis System (MultiSpec )
") Land Cover Change Analysis An Introduction to Land Cover Change Analysis using the Multispectral Image Data Analysis System (MultiSpec ) Level: Grades 9 to 12 Windows version With Teacher Notes Earth Observation
Land Cover Change Analysis An Introduction to Land Cover Change Analysis using the Multispectral Image Data Analysis System (MultiSpec ) Level: Grades 9 to 12 Windows version With Teacher Notes Earth Observation
The GPS Classroom. Jared Covili
 The GPS Classroom Jared Covili 1/17/06 2 The GPS Classroom Jared Covili jcovili@media.utah.edu (801) 585-5667 The GPS Classroom is a 2-day course that provides participants with the basic knowledge of
Survey questionnaire and topline
 21 Survey questionnaire and topline FUTURE S AMERICAN TRENDS PANEL MARCH 27-APRIL 9, TOTAL N=2,541 Do you think each of the following things will or will not happen in the next 50 years, that is, before
Earth Observation Products & Services in support of the Mining Industry
 Earth Observation Products & Services in support of the Mining Industry Stephen Coulson European Space Agency Directorate of Earth Observation Programmes ESA/ESRIN 27 April 2017, Lisbon 1 ESA Earth Observation
Esri UC 2014 Technical Workshop
 Introduction to Parcel Fabric Amir Plans Parcels Control 1 Points 1-1 Line Points - Lines Editing and Maintaining Parcels using Deed Drafter and ArcGIS Desktop What is a parcel fabric? Dataset of related
Unsupervised Classification
 Unsupervised Classification Using SAGA Tutorial ID: IGET_RS_007 This tutorial has been developed by BVIEER as part of the IGET web portal intended to provide easy access to geospatial education. This tutorial
GPS-G5 User s Manual
 GPS-G5 User s Manual Contents Using the GPS... 1 Description...1 Electrical Connections...2 Mounting...3 GPS Configuration...3 GPS Operation...3 Logging Device Configuration...4 Data Analysis...5 Specifications...
NON-PHOTOGRAPHIC SYSTEMS: Multispectral Scanners Medium and coarse resolution sensor comparisons: Landsat, SPOT, AVHRR and MODIS
 NON-PHOTOGRAPHIC SYSTEMS: Multispectral Scanners Medium and coarse resolution sensor comparisons: Landsat, SPOT, AVHRR and MODIS CLASSIFICATION OF NONPHOTOGRAPHIC REMOTE SENSORS PASSIVE ACTIVE DIGITAL
Gps And Google Earth For Development How To Create Share And Collaborate With Maps On The Net
 Gps And Google Earth For Development How To Create Share And Collaborate With Maps On The Net GPS AND GOOGLE EARTH FOR DEVELOPMENT HOW TO CREATE SHARE AND COLLABORATE WITH MAPS ON THE NET PDF - Are you
RADIOMETRIC CHARACTERIZATION AND PERFORMANCE ASSESSMENT OF THE ALI USING BULK TRENDED DATA
 RADIOMETRIC CHARACTERIZATION AND PERFORMANCE ASSESSMENT OF THE ALI USING BULK TRENDED DATA Tim Ruggles*, Imaging Engineer Dennis Helder*, Director Image Processing Laboratory, Department of Electrical
Games. Episode 6 Part III: Dynamics. Baochun Li Professor Department of Electrical and Computer Engineering University of Toronto
 Games Episode 6 Part III: Dynamics Baochun Li Professor Department of Electrical and Computer Engineering University of Toronto Dynamics Motivation for a new chapter 2 Dynamics Motivation for a new chapter
to Geospatial Technologies
 What s in a Pixel? A Primer for Remote Sensing What s in a Pixel Development UNH Cooperative Extension Geospatial Technologies Training Center Shane Bradt UConn Cooperative Extension Geospatial Technology
Sarah Steele, Curriculum Materials/Media Librarian, Campbell University Karen Waller, Media Specialist, Timber Drive Elementary School
 Sarah Steele, Curriculum Materials/Media Librarian, Campbell University Karen Waller, Media Specialist, Timber Drive Elementary School These are a group of 24 satellites started in 1978 by the US Navy
Using Landsat Imagery to Monitor Post-Fire Vegetation Recovery in the Sandhills of Nebraska: A Multitemporal Approach.
 University of Nebraska - Lincoln DigitalCommons@University of Nebraska - Lincoln Environmental Studies Undergraduate Student Theses Environmental Studies Program Spring 5-2012 Using Landsat Imagery to
ZODIAC DATA SYSTEMS. ZODIAC AEROSYSTEMS Control Systems Division
 ZODIAC DATA SYSTEMS 6/14/2016-2 Monitoring : Produits & services Services Ephemeris and TDOA services Geolocation services Markets: Satellite Operators Regulatory Bodies Defense Agencies System Integrators
The SandBox. Lesson 2 Water Flow Intermediate
 The SandBox Lesson 2 Water Flow Intermediate NSF award #OIA-1208927 1 Lesson 2 Water Flow Intermediate Lesson Summary: Objectives: Estimated Time: Students learn about erosion and deposition. They will