Processing of MA(or µ)-xrf Data with the M6 software
|
|
|
- Raymond Simpson
- 5 years ago
- Views:
Transcription

1 Processing of MA(or µ)-xrf Data with the M6 software Roald Tagle, Max Bügler, Falk Reinhardt, and Ulrich Waldschläger Bruker Nano Berlin Innovation with Integrity
2 Outline 1. Introduction 2. From the object to the data The measurement parameters 3. From the data to the results: data mining tools advantages and disadvantages ROI Fast deconvolution Convolution by forward calculation Peak math, addition and subtraction of lines and more. Innovation with Integrity


3 Three main advantages of µ-xrf Information from the depth of the sample Trace element sensitive No sample preparation 10/11/2017
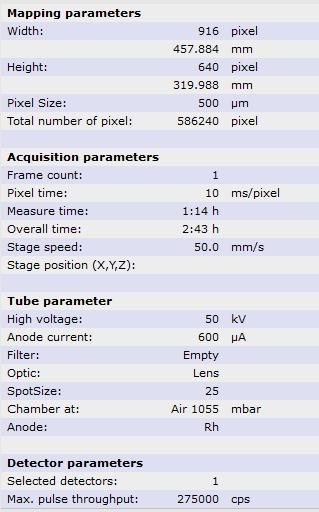
4 From the object to the data The measurement parameters Soft limit Working time Step size Object size Total measurement time Dwell time Instrumental limit File size: Tested up to 33 Gbyte Scan dimension: 800 mm x 600 mm Maximum speed: 100 mm/s Maximum Acceleration: 200 mm/s² Spot size: Starting from 100 µm Spectroscopic resolution: <140 ev for 90 kcps <145 ev for 130 kcps <190 ev for 275 kcps Step size Should correspond to the size of the object that wants to be resolved Painting 300 to 800 µm Drawings 100 to 300 µm Note: small step size allows to improve statistic by use of binning Dwell time Short (< 10 ms) main elements and or elements for which the instrument is sensitive Dwell time reduction Improving the signal - larger detector 60 mm² - He flush 10/11/2017 4


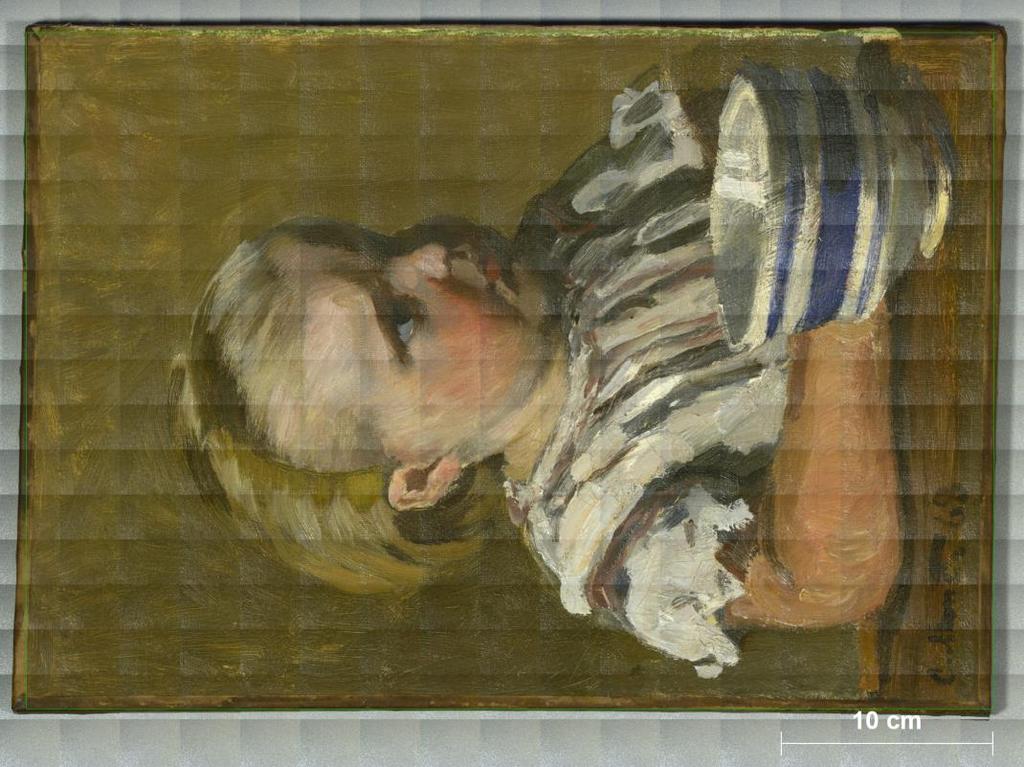
5 From the object to the data The measurement parameters Test painting Variation of time Object size 260 kpixel 800 µm / 3 ms Total measurement time 46 cm 240 kpixel 800 µm / 700 ms Step size Dwell time Variation of step size 36 cm 4 Mpixel 200 µm / 8 ms 16 Mpixel 100 µm / 1 ms results
6 From the object to the data The measurement parameters 800 µm / 8 ms 800 µm / 700 ms File 294 MByte 661 MByte # of Spectra 260 kpixel 240 kpixel Total time 1 h 35 min 48 h 32 min

7 From the object to the data The measurement parameters 800 µm / 8 ms 800 µm / 700 ms File 294 MByte 661 MByte # of Spectra 260 kpixel 240 kpixel Total time 1 h 35 min 48 h 32 min


8 From the object to the data The measurement parameters 4 million 16 million


9 From the object to the data The measurement parameters Full scan 16 Mpixel Detail measurement 2 Detail measurement 1
10 10/11/

11 Now the data is there and the work starts: Data mining. What can be done? Optimized data acquisition Element identification Auto ID and net peak intensity determination Maximum Pixel spectra Quantification/fitting of the spectra to identify elements present Synthetic spectra with channel maximum of all measured spectra. Elements identification Element display


12 Now the data is there and the work starts: Data mining. What can be done? Element display ROI Deconvolution Forward calculation Element display Intensity math Enhance mode Element display Brightness Gamma correction Color intensity
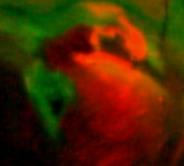
13 The Data: 10/11/
 Wrong identifications are possible!")
14 Data mining, Element identification: Auto ID and Interactive quantification 1) The Auto ID does not identify all the elements. It based on a quantification of all possible elements. 2) Wrong identifications are possible! Auto ID Fundamental parameter forward calculation Bayes deconvolution
15 Data mining, Element identification: Interactive quantification using FP model The M6 s quantification iteratively varies the assumed sample composition and forward calculates the resulting spectra by repeatedly solving the Sherman Equation. Fundamental parameter forward calculation The prerequisite for a quantification is a homogenous, infinitely think sample. which is rarely the case for a painting. There is no forward calculated homogeneous, infinitely thick sample which produces a spectrum like the measured one. Therefore the fit cannot be perfect. However, for most of the samples the fit is surprisingly good. But problems might appear especially in the low energy range!
16 Data mining, Element identification: Interactive deconvolution using Bayes There is a possibility to determine Bayes deconvolution the peak intensity by using a Bayes deconvolution. In this case a peak fit using Gaussian peaks is performed. However, since for example, the line ratios for the elements are not fixed, the deconvolution can run into some problems. The Mn Kb line is overestimated Bayes in the Bayes deconvolution. FP There is no correct solution, there are different tools, which have their pro and contra
17 Data mining, Element identification: Interactive deconvolution using Bayes Bayes This is surely wrong.. But there is sure cobalt here!
18 Data mining, Element identification: Interactive deconvolution using Bayes There is a possibility to determine Bayes deconvolution the peak intensity by using a Bayes deconvolution. In this case a peak fit using Gaussian peaks is performed. However, since for example, the line ratios for the elements are not fixed, the deconvolution can run into some problems. The Mn Kb line is overestimated Bayes in the Bayes deconvolution. FP There is no correct solution, there are different tools, which have their pro and contra


19 Data mining, Element identification: Maximum Pixel spectra In the map spectrum the signal for Ni and Cu is diluted by the large number of spectra. The Maximum pixel spectrum reflects the highest intensity per channel found in any pixel of the map. Maximum pixel spectrum can be used to find hot spots in the data block. Easy identification of Ni and Cu presence somewhere in the sample. An even the cobalt is no question!


20 Data mining, Element display: Region of interest ROI Co Kα ROI The ROI element display does not correct for peak overlapping or background. Thus, f.e. the Co intensity contains also parts of the Kβ from Fe. Extremely fast and robust! 10/11/
 it is possible to edit the lines")

 at the same time, a")

21 Data mining, Element display: Region of interest ROI In the periodic table (right mouse on the element) it is possible to edit the lines that shall be used for the element display. The Line as well as the width of the Region around the peak can be edited. Note: only one line of an element can be displayed at a time. To display two lines of an element (Pb-M and -L) at the same time, a Free region can be used. Free region can be use to display the intensity of any ROI in the spectrum, f.e. scattering background or total intensity. Total intensity Compton 10/11/
 every count in every channel is weighted by the probability that a it belongs to one of the")

22 Data mining, Element display: Fast deconvolution ROI Fast deconvolution In the fast deconvolution (which is a fit) every count in every channel is weighted by the probability that a it belongs to one of the selected elements. As soon as this is calculated for each channel the complete data set is evaluated at high speed. In this case 17 elements and half a million spectra were deconvoluted in 30 seconds. 10/11/


23 Data mining, Element display: Fast deconvolution
24 Data mining, Element display: Fast deconvolution
25 Data mining, Element display: Fast deconvolution Processed by M. Alfeld M6 Jetstream deconvolution


26 Data mining, Element display: Forward calculation I A quantification of a non-ideal sample is the main problem of this approach. One spectrum acquired in short time might contain only a limited number of counts, e.g counts in 4096 channels. Making an iterative spectrum fit and quantification unstable. Best numerical solution might not be the best fit, as a non-ideal sample has no correct solution for the Sherman Equation 10/11/


27 Data mining, Element display: Forward calculation Convolution Multiple overlapping's Hg-Pb-As Very slow, the forward calculated spectrum assumes an infinitely and homogenous sample As Pb Hg
 with all the other spectra in the data block and tries to find similarities.")

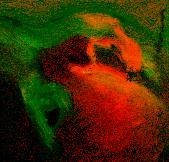
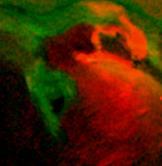
28 Data mining, Element display: Phase analysis Phase analysis is based on an algorithm that compares the intensity of a ROI in the spectra (element or selected free region) with all the other spectra in the data block and tries to find similarities. The Phase analysis can also be done by finding areas with similar spectra to a pre-selected object. Recommended use e.g.: What trace element are associated to selected other elements e.g. Co. Identified phases P3 and Unassigned correlate to the Co image.


29 Data mining, Element display: Phase analysis The cobalt pigment, is associated to the presence of traces of Ni and Cu. Where the Ni comes only with the Co the Cu is also found on other locations of the painting.

30 Data mining, Element display: Enhance mode Peak mathematics Very fast, easy to implement, plenty of option A bit complex to understand at the beginning. Requires experience (or talent)

31 Data mining, Element display: Enhance mode Peak mathematics Very fast, easy to implement, plenty of option A bit complex to understand at the beginning. Requires experience (or talent)

32 Data mining, Element display: Enhance mode Peak mathematics Very fast, easy to implement, plenty of option A bit complex to understand at the beginning. Requires experience.
33 Data mining, Element display: Enhance mode Peak mathematics Very fast, easy to implement, plenty of option A bit complex to understand at the beginning. Requires experience. Co minus Ni Good correlation Co minus Cu No corr. in the eyes Co minus Fe No correlation

34 Data mining, visualization: Image parameters By changing the slither position is possible to highlight or oppress specific features


35 Data mining, visualization: Image parameters, fossil bat with tissues 14 h scan with M4 Tornado 25 µm step size 5.6 million pixel 8 ms


36 Data mining, visualization: Image parameters, fossil bat with tissues Increasing colour intensity Combined to highlight Mn regions
37 Data mining, visualization: Image parameters Gamma correction Brightness Color intensity

38 Data mining, visualization: Element filter None Average 3 Smooth 3 Automatic


39 Data mining, visualization: Image parameters None Average 3 Smooth 3 Automatic Automatic: every element displayed gets, after a statistical evaluation of the number of count in the data, an optimal binning or average number for the display.

40 Data mining, visualization: Image parameters Average 3 Average 5 Average 7 Average 15
41 Data mining: Getting the data out The measured data is stored in a BCF file. This file contains all the information regarding the measurement. The data can be extracted or converted in a format that can be read by other software. Therefore 3 options are available: 1) Exporting all single spectra from the map using a script function 2) Saving the data block as a RAW file 3) Extracting the single element information in the element images of the map window to a TXT file as a number matrix


42 Data mining: Getting the data out ~ 100 kb per TXT file Easily > 1 TB data sets for average sized maps RAW is a very basic file format accessible with a wide variety of software tools.


43 Data mining: Getting the data out M6 Software Excel Fe Concentration

44 90 million Pixel stitched from 40 single maps


45 Transmission with the M6 Jetstream First tests.. M6 scan over a selection of objects: Gold medal, lapis lazuli fragment, glass, Cu alloy coin, Al alloy, airplane plug adapter connector, USB adaptor and gold earring. Using X-ray plate from VMI 5100 MS-C 50 kv 600 µa 10 cm working distance 100 mm/s 0.8 cm 2.5 cm 10/11/

")

46 Transmission with the M6 Jetstream Chimei Museum Taiwan, work in progress. The Awakening Hour: an Interior with a Mother and A Child, Dutch School (19 th Century) Undated, Oil on panel AGFA CR MD4.0T general cassette Fuji cassette-type CC AGFA CR MD4.0T general cassette 10/11/


47
48 Copyright 2013 Bruker Corporation. All rights reserved. Innovation with Integrity
FIRST Newsletter March 2013, Issue 20. Elemental Distribution Analysis of a Meteorite Sample from the Rochechouart Structure with the µ-xrf M4 TORNADO
 FIRST Newsletter March 2013, Issue 20 Elemental Distribution Analysis of a Meteorite Sample from the Rochechouart Structure with the µ-xrf M4 TORNADO By Dr. Roald Tagle, Ulrich Waldschlager, Dr. Michael
Lab Report XRF 441 Elemental distribution analysis on geological samples with the M4 TORNADO
 Bruker Nano Spectrum Geological sample M4 TORNADO Quantification Lab Report XRF 441 Elemental distribution analysis on geological samples with the M4 TORNADO Geological samples are inhomogeneous. The distribution
M6 JETSTREAM. Innovation with Integrity. Large Area Micro X-ray Fluorescence Spectrometer. Micro-XRF
 M6 JETSTREAM Large Area Micro X-ray Fluorescence Spectrometer Innovation with Integrity Micro-XRF Spatially Resolved Elemental Analysis of Large Objects The Bruker M6 JETSTREAM is designed for the nondestructive
Qualitative analysis tutorial for Tracer III SD and V+ data
 Qualitative analysis tutorial for Tracer III SD and V+ data Outline What does the spectrum mean? What to watch out for How to normalize Using Artax What does the spectrum mean? Bremsstrahlung radiation
Quantax 100 Low-Cost EDS System. Innovation with Integrity
 Quantax 100 Low-Cost EDS System Innovation with Integrity XFlash 410 Low Cost Silicon Drift Detector Quantax 100 EDS system includes the XFlash 410 SDD Proven Bruker SDD technology, since 1997 Maintenance-free,
Part I: Bruker Esprit Mapping Options
 Part I: Bruker Esprit Mapping Options Mapping Panel Overview 5. 4. 2. 6. 3. 7. 8. 9. 1. 10. Mapping Panel Overview 1. Element selector - can turn individual elements (as well as the image overlay) on/off.
FAST ELEMENTAL MAPPING WITH MICRO-XRF
 286 FAST ELEMENTAL MAPPING WITH MICRO-XRF Haschke, M.; Rossek, U.; Tagle, R.; Waldschläger, U. Bruker Nano GmbH, 12489 Berlin, Schwarzschildstr.12 ABSTRACT X-Ray optics are now in common use for concentrating
Bruker Nano. M4 tornado. High performance micro-xrf spectrometer. think forward
 Bruker Nano M4 tornado High performance micro-xrf spectrometer think forward µ-xrf M4 TORNADO setting standards in µ-xrf µ-xrf is the method of choice for highly sensitive and non-destructive elemental
M4 TORNADO PLUS. Innovation with Integrity. Super Light Element Micro-XRF Spectrometer. Micro-XRF
 M4 TORNADO PLUS Super Light Element Micro-XRF Spectrometer Innovation with Integrity Micro-XRF M4 TORNADO PLUS - A New Era in Micro-XRF M4 TORNADO PLUS is the world's first Micro-XRF spectrometer that
Advancing EDS Analysis in the SEM Quantitative XRF. International Microscopy Congress, September 5 th, Outline
 Advancing EDS Analysis in the SEM with in-situ Quantitative XRF Brian J. Cross (1) & Kenny C. Witherspoon (2) 1) CrossRoads Scientific, El Granada, CA 94018, USA 2) ixrf Systems, Inc., Houston, TX 77059,
S1 TITAN Alloy LE Calibrations (P/N: )
") S1 TITAN 600-800 Alloy LE Calibrations () Low Alloy Si P S Ti V Cr Mn Fe Co Ni Cu Nb Mo W Pb Analysis range, % LLD-2 LLD-0.15 LLD-0.3 LLD - 0.1 0.05-1.8 LLD - 9 0.1-2.0 75-100 LLD - 8 LLD - 5 LLD - 5 LLD-
S1 TITAN 600-800 Alloy LE Calibrations () Low Alloy Si P S Ti V Cr Mn Fe Co Ni Cu Nb Mo W Pb Analysis range, % LLD-2 LLD-0.15 LLD-0.3 LLD - 0.1 0.05-1.8 LLD - 9 0.1-2.0 75-100 LLD - 8 LLD - 5 LLD - 5 LLD-
ALTURA EDS. Rev. 0915
 ALTURA EDS Rev. 0915 Enable the Oxford PC Enable the Altura-EDS under Dual Beam Tools in Coral. Or enter your NETID and password directly into the Oxford PC. Warning: Ion-milling, GISs/microprobe, and
Material analysis by infrared mapping: A case study using a multilayer
 Material analysis by infrared mapping: A case study using a multilayer paint sample Application Note Author Dr. Jonah Kirkwood, Dr. John Wilson and Dr. Mustafa Kansiz Agilent Technologies, Inc. Introduction
DEVELOPMENT OF A WAVELENGTH DISPERSIVE X-RAY FLUORESCENCE SPECTROMETER USING A MULTI-CAPILLARY X-RAY LENS FOR X-RAY DETECTION
 Copyright JCPDS - International Centre for Diffraction Data 2003, Advances in X-ray Analysis, Volume 46. 346 DEVELOPMENT OF A WAVELENGTH DISPERSIVE X-RAY FLUORESCENCE SPECTROMETER USING A MULTI-CAPILLARY
Film Replacement in Radiographic Weld Inspection The New ISO Standard
 BAM Berlin Film Replacement in Radiographic Weld Inspection The New ISO Standard 17636-2 Uwe Ewert, Uwe Zscherpel, Mirko Jechow Requests and information to: uwez@bam.de 1 Outline - The 3 essential parameters
Computed Radiography
 BAM Berlin Computed Radiography --INDE 2007, Kalpakkam, India -- Uwe Zscherpel, Uwe Ewert BAM Berlin, Division VIII.3 Requests Requests and and information information to: to: Dr. Dr. U. U. Zscherpel Zscherpel
K-edge subtraction X-ray imaging with a pixellated spectroscopic detector
 K-edge subtraction X-ray imaging with a pixellated spectroscopic detector Silvia Pani Department of Physics, University of Surrey Summary Hyperspectral imaging K-edge subtraction X-ray imaging for mammography
Analysis of paint pigments
 Analysis of paint pigments Medieval oil paintings contained specific pigments to achieve the deep impressive color effects. A list of typical inorganic pigments and their chemical composition is : Pigments
STEM Spectrum Imaging Tutorial
 STEM Spectrum Imaging Tutorial Gatan, Inc. 5933 Coronado Lane, Pleasanton, CA 94588 Tel: (925) 463-0200 Fax: (925) 463-0204 April 2001 Contents 1 Introduction 1.1 What is Spectrum Imaging? 2 Hardware 3
The SS6000 Gold Mate Series For analyzing all precious metals and other elements from Mg to U
 The SS6000 Gold Mate Series For analyzing all precious metals and other elements from Mg to U Portable desk top EDXRF analyzers Responsive, bright, color touch screen display Uses Silicon Drift or Silicon
WIDE ANGLE GEOMETRY EDXRF SPECTROMETERS WITH SECONDARY TARGET AND DIRECT EXCITATION MODES
 Copyright(C)JCPDS-International Centre for Diffraction Data 2000, Advances in X-ray Analysis, Vol.42 11 Copyright(C)JCPDS-International Centre for Diffraction Data 2000, Advances in X-ray Analysis, Vol.42
This procedure assumes the user is already familiar with basic operation of the SEM and the MiraTC interface.
 Tescan MIRA3 SEM: EDS using EDAX TEAM Nicholas G. Rudawski ngr@ufl.edu Cell: (805) 252-4916 Office: (352) 392-3077 Last updated: 12/04/17 This procedure assumes the user is already familiar with basic
ARTAX. Innovation with Integrity. Portable Micro-XRF Spectrometer. Micro-XRF
 ARTAX Portable Micro-XRF Spectrometer Innovation with Integrity Micro-XRF ARTAX Elemental Analysis for the Art Community and More The ARTAX is the first portable X ray fluorescence (XRF) spectrometer designed
Automatic optical measurement of high density fiber connector
 Key Engineering Materials Online: 2014-08-11 ISSN: 1662-9795, Vol. 625, pp 305-309 doi:10.4028/www.scientific.net/kem.625.305 2015 Trans Tech Publications, Switzerland Automatic optical measurement of
Grid Assembly. User guide. A plugin developed for microscopy non-overlapping images stitching, for the public-domain image analysis package ImageJ
 BIOIMAGING AND OPTIC PLATFORM Grid Assembly A plugin developed for microscopy non-overlapping images stitching, for the public-domain image analysis package ImageJ User guide March 2008 Introduction In
QUANTAX FlatQUAD. Innovation with Integrity. EDS for SEM with the XFlash FlatQUAD EDS
 QUANTAX FlatQUAD EDS for SEM with the XFlash FlatQUAD Innovation with Integrity EDS Maximum Efficiency in X-ray Detection... QUANTAX FlatQUAD is the EDS microanalysis system based on the revolutionary
New Aspects of Coin Measurement in Quality Inspection
 New Aspects of Coin Measurement in Quality Inspection Dr. Ralf Freiberger Technical Forum Berlin 2018 Ralf Freiberger 2 Overview 1. Purpose 2. Determination of dimensions 3. 4. Summary and outlook 3 Purpose
QUANTAX EBSD with OPTIMUS TKD Transmission Kikuchi Diffraction Under Optimum Conditions
 QUANTAX EBSD with OPTIMUS TKD Transmission Kikuchi Diffraction Under Optimum Conditions Bruker Nano GmbH, Berlin, Germany Webinar, August 26 th, 2015 Innovation with Integrity Speaker Dr. Daniel Goran
A COMPARATIVE STUDY ON THE PERFORMANCE OF DIGITAL DETECTOR SYSTEMS FOR HIGH ENERGY APPLICATIONS
 11th European Conference on Non-Destructive Testing (ECNDT 2014), October 6-10, 2014, Prague, Czech Republic More Info at Open Access Database www.ndt.net/?id=16394 A COMPARATIVE STUDY ON THE PERFORMANCE
DIGITAL-MICROSCOPY CAMERA SOLUTIONS USB 3.0
 DIGITAL-MICROSCOPY CAMERA SOLUTIONS USB 3.0 PixeLINK for Microscopy Applications PixeLINK will work with you to choose and integrate the optimal USB 3.0 camera for your microscopy project. Ideal for use
Quick and simple installation and no maintenance needed. 3 Times More affordable Than a normal SEM. Obtaining results in less than 4 minutes
 INTRODUCTION We believe that every laboratory working in the field of nanotechnology needs an SEM, therefore we would like to introduce to you our IEM series of SEM. In short space of time, our device
INTRODUCTION We believe that every laboratory working in the field of nanotechnology needs an SEM, therefore we would like to introduce to you our IEM
 INTRODUCTION We believe that every laboratory working in the field of nanotechnology needs an SEM, therefore we would like to introduce to you our IEM series of SEM. In short space of time, our device
» There are many possible techniques for making good radiographs. » Following a defined procedure will simplify technique
 Recommended Techniques» There are many possible techniques for making good radiographs using CR» Following a defined procedure will simplify technique development and shorten the time to a good image»
XRF Applications on Native American Collections
 XRF Applications on Native American Collections Cheryl Podsiki The Field Museum, Chicago Symposium School for Advanced Research Indian Arts Research Center, Santa Fe, NM May 28, 2009 Applications Manufactured
Leading in Desktop SEM Imaging and Analysis
 Leading in Desktop SEM Imaging and Analysis Fast. Outstanding. Reliable SEM imaging and analysis. The Phenom: World s Fastest Scanning Electron Microscope With its market-leading Phenom desktop Scanning
DeConvHAADF. User s Guide. (Software Cs-Corrector) DigitalMicrograph Plugin for STEM-HAADFDeconvolution. HREM Research Inc. Version 3.
 DigitalMicrograph Plugin for STEM-HAADFDeconvolution. HREM Research Inc. Version 3.") DeConvHAADF (Software Cs-Corrector) DigitalMicrograph Plugin for STEM-HAADFDeconvolution User s Guide HREM Research Inc. 14-48 Matsukazedai Higashimatsuyama, Saitama 355-0055 Version 3.3 2014.05.25 Table
DeConvHAADF (Software Cs-Corrector) DigitalMicrograph Plugin for STEM-HAADFDeconvolution User s Guide HREM Research Inc. 14-48 Matsukazedai Higashimatsuyama, Saitama 355-0055 Version 3.3 2014.05.25 Table
BRUKER ADVANCED X-RAY SOLUTIONS. SPECTROMETRY SOLUTIONS ARTAX mxrf SPECTROMETER
 BRUKER ADVANCED X-RAY SOLUTIONS SPECTROMETRY SOLUTIONS ARTAX mxrf SPECTROMETER Microanalysis ARTAX Elemental Analysis for the Art Community and More Non-destructive elemental analysis is strictly required
Super High Vertical Resolution Non-Contact 3D Surface Profiler BW-S500/BW-D500 Series
 Super High Vertical Resolution Non-Contact 3D Surface Profiler BW-S500/BW-D500 Series Nikon's proprietary scanning-type optical interference measurement technology achieves 1pm* height resolution. * Height
Electron-Bombarded CMOS
 New Megapixel Single Photon Position Sensitive HPD: Electron-Bombarded CMOS University of Lyon / CNRS-IN2P3 in collaboration with J. Baudot, E. Chabanat, P. Depasse, W. Dulinski, N. Estre, M. Winter N56:
The Sussex Declaration
 THE BRITISH LIBRARY The Sussex Declaration Technical report for Add Mss 8981 Garside, Paul 11/29/2017 Technical report of scientific analysis held at the British Library 1-3 August 2017 of Add Mss 8981
COMPUTED RADIOGRAPHY (CR)
") COMPUTED RADIOGRAPHY (CR) Moving with the time Avi Avner BVSc BSc CVR DVDI MRCVS CR-Basics A five step process: 1. X-ray image received on phosphor plate 2. Image extracted from phosphor plate by Laser
COMPUTED RADIOGRAPHY (CR) Moving with the time Avi Avner BVSc BSc CVR DVDI MRCVS CR-Basics A five step process: 1. X-ray image received on phosphor plate 2. Image extracted from phosphor plate by Laser
MICRO XRF OF LIGHT ELEMENTS USING A POLYCAPILLARY LENS AND AN ULTRA THIN WINDOW SILICON DRIFT DETECTOR INSIDE A VACUUM CHAMBER
 Copyright JCPDS - International Centre for Diffraction Data 2005, Advances in X-ray Analysis, Volume 48. 229 MICRO XRF OF LIGHT ELEMENTS USING A POLYCAPILLARY LENS AND AN ULTRA THIN WINDOW SILICON DRIFT
Very short introduction to light microscopy and digital imaging
 Very short introduction to light microscopy and digital imaging Hernan G. Garcia August 1, 2005 1 Light Microscopy Basics In this section we will briefly describe the basic principles of operation and
BEAMAGE-3.0 KEY FEATURES BEAM DIAGNOSTICS AVAILABLE MODELS MAIN FUNCTIONS SEE ALSO ACCESSORIES. CMOS Beam Profiling Cameras
 BEAM DIAGNOSTICS BEAM DIAGNOSTICS SPECIAL PRODUCTS OEM DETECTORS THZ DETECTORS PHOTO DETECTORS HIGH POWER DETECTORS POWER DETECTORS ENERGY DETECTORS MONITORS CMOS Beam Profiling Cameras AVAILABLE MODELS
ERS KEY FEATURES BEAM DIAGNOSTICS MAIN FUNCTIONS AVAILABLE MODEL. CMOS Beam Profiling Camera. 1 USB 3.0 for the Fastest Transfer Rates
 POWER DETECTORS ENERGY DETECTORS MONITORS SPECIAL PRODUCTS OEM DETECTORS THZ DETECTORS PHOTO DETECTORS HIGH POWER DETECTORS CAMERA PROFIL- CMOS Beam Profiling Camera KEY FEATURES ERS 1 USB 3.0 for the
NDT Supply.com 7952 Nieman Road Lenexa, KS USA
 Durr NDT ScanX Computed Radiography System The Workhorse of Portable Digital Radiography in NDT There are 2 models available: ScanX Discover HR ScanX Discover HC ScanX Discover HR ScanX Discover HC The
BEAMAGE KEY FEATURES AVAILABLE MODELS. CMOS Beam Profiling Cameras
 BEAM DIAGNOS TICS Beam Profiling Cameras KEY FEATURES SPECIAL PRODUCTS OEM DETECTORS THZ DETECTORS PHOTO DETECTORS HIGH POWER SOLUTIONS POWER DETECTORS ENERGY DETECTORS MONITORS AVAILABLE MODELS Beamage-3.0
DOSE REDUCTION BY USE OF DIGITAL X-RAY DETECTORS. Bernhard REDMER
 14.03.2016 DOSE REDUCTION BY USE OF DIGITAL X-RAY DETECTORS Bernhard REDMER Digital Technology and Networking Imaging Plates Scanner for Imaging Plates Data Transmission Reporting Computed Radiography
ACIS ( , ) total e e e e-11 1.
 total e e e e-11 1.") 1 SUMMARY 1 SNR 0509-68.7 1 Summary Common Name: N 103B Distance: 50 kpc (distance to LMC, Westerlund(1990) ) Center of X-ray emission (J2000): ( 05 08 59.7, -68 43 35.5 ) X-ray size: 32 x 30 Description:??
1 SUMMARY 1 SNR 0509-68.7 1 Summary Common Name: N 103B Distance: 50 kpc (distance to LMC, Westerlund(1990) ) Center of X-ray emission (J2000): ( 05 08 59.7, -68 43 35.5 ) X-ray size: 32 x 30 Description:??
Image Processing for feature extraction
 Image Processing for feature extraction 1 Outline Rationale for image pre-processing Gray-scale transformations Geometric transformations Local preprocessing Reading: Sonka et al 5.1, 5.2, 5.3 2 Image
Tokyo University of Science, 2641 Yamazaki, Noda,Chiba , Japan b Departument of physics, Faculty of Science and Technology,
 SNSN-323-63 August 27, 2018 Study of the basic performance of the XRPIX for the future astronomical X-ray satellite arxiv:1507.06868v1 [physics.ins-det] 24 Jul 2015 Koki Tamasawa a, Takayoshi Kohmura a,
Microprobe Power User Part 3: X-Ray Maps
 Microprobe Power User Part 3: X-Ray Maps Mike Spilde Spring IOM Seminar September 17, 2008 X-Ray Mapping Why use X-ray maps? Characterize the sample at microscopic scales with relatively high sensitivity.
Applications of Micro XRF for the Analysis of Traditional Japanese "Ainu" Glass Beads and other Artifacts
 161 161 Applications of Micro XRF for the Analysis of Traditional Japanese "Ainu" Glass Beads and other Artifacts K.Sugihara 1, M.Satoh 1, Y.Hayakawa 2, A.Saito 3 and T.Sasaki 4 1 Seiko Instruments Inc.,
Interpixel crosstalk in a 3D-integrated active pixel sensor for x-ray detection
 Interpixel crosstalk in a 3D-integrated active pixel sensor for x-ray detection The MIT Faculty has made this article openly available. Please share how this access benefits you. Your story matters. Citation
Strategies for processing mega-pixel X-ray fluorescence hyperspectral data: a case study on a version of Caravaggio's painting Supper at Emmaus
 PAPER Cite this: J. Anal. At. Spectrom., 2015, 30, 777 Strategies for processing mega-pixel X-ray fluorescence hyperspectral data: a case study on a version of Caravaggio's painting Supper at Emmaus Matthias
Radionuclide Imaging MII Single Photon Emission Computed Tomography (SPECT)
") Radionuclide Imaging MII 3073 Single Photon Emission Computed Tomography (SPECT) Single Photon Emission Computed Tomography (SPECT) The successful application of computer algorithms to x-ray imaging in
Radionuclide Imaging MII 3073 Single Photon Emission Computed Tomography (SPECT) Single Photon Emission Computed Tomography (SPECT) The successful application of computer algorithms to x-ray imaging in
CRISATEL High Resolution Multispectral System
 CRISATEL High Resolution Multispectral System Pascal Cotte and Marcel Dupouy Lumiere Technology, Paris, France We have designed and built a high resolution multispectral image acquisition system for digitizing
Breast Tomosynthesis. Bob Liu, Ph.D. Department of Radiology Massachusetts General Hospital And Harvard Medical School
 Breast Tomosynthesis Bob Liu, Ph.D. Department of Radiology Massachusetts General Hospital And Harvard Medical School Outline Physics aspects of breast tomosynthesis Quality control of breast tomosynthesis
IBEX TECHNOLOGY APPLIED TO DIGITAL RADIOGRAPHY
 WHITE PAPER: IBEX TECHNOLOGY APPLIED TO DIGITAL RADIOGRAPHY IBEX Innovations Ltd. Registered in England and Wales: 07208355 Address: Discovery 2, NETPark, William Armstrong Way, Sedgefield, UK Patents:
 R AMP TEK Landed on Mars July 4, 1997 All Solid State Design No Liquid Nitrogen Be Window FET Detector Temperature Monitor Cooler Mounting Stud FEATURES Si-PIN Photodiode Thermoelectric Cooler Beryllium
The user should already be familiar with operation of the instrument in STEM mode, use of the Microscope Control interface, and TIA.
 FEI Tecnai F20 S/TEM: EDS system operation Nicholas G. Rudawski ngr@ufl.edu (805) 252-4916 (352) 392-3077 Last updated: 01/22/18 The user should already be familiar with operation of the instrument in
Radiology Physics Lectures: Digital Radiography. Digital Radiography. D. J. Hall, Ph.D. x20893
 Digital Radiography D. J. Hall, Ph.D. x20893 djhall@ucsd.edu Background Common Digital Modalities Digital Chest Radiograph - 4096 x 4096 x 12 bit CT - 512 x 512 x 12 bit SPECT - 128 x 128 x 8 bit MRI -
COFFEE LABORATORY WHITE STONE VA Tel (804)
") COFFEE LABORATORY USA FOR THE PARTICLE SIZE ANALYSIS OF COFFEE GROUND COFFEE COFFEE BEAN GRADING CLICK HERE PRODUCT DEMONSTRAION Reference code: OCC63 Occhio Zephyr ESR Particle size range (30 microns
COFFEE LABORATORY USA FOR THE PARTICLE SIZE ANALYSIS OF COFFEE GROUND COFFEE COFFEE BEAN GRADING CLICK HERE PRODUCT DEMONSTRAION Reference code: OCC63 Occhio Zephyr ESR Particle size range (30 microns
Mod. 2 p. 1. Prof. Dr. Christoph Kleinn Institut für Waldinventur und Waldwachstum Arbeitsbereich Fernerkundung und Waldinventur
 Histograms of gray values for TM bands 1-7 for the example image - Band 4 and 5 show more differentiation than the others (contrast=the ratio of brightest to darkest areas of a landscape). - Judging from
Fast Laser Raman Microscope RAMAN
 Fast Laser Raman Microscope RAMAN - 11 www.nanophoton.jp Fast Raman Imaging A New Generation of Raman Microscope RAMAN-11 developed by Nanophoton was created by combining confocal laser microscope technology
Evaluating the Performance of a Commercial Silicon Drift Detector for X-ray Microanalysis
 Evaluating the Performance of a Commercial Silicon Drift Detector for X-ray Microanalysis Edward A. Kenik Materials Science & Technology Division, Oak Ridge National Laboratory, Oak Ridge, TN 37831 kenikea@ornl.gov
X-Ray Spectroscopy with a CCD Detector. Application Note
 X-Ray Spectroscopy with a CCD Detector In addition to providing X-ray imaging solutions, including CCD-based cameras that image X-rays using either direct detection (0.5-20 kev) or indirectly using a scintillation
LYNXEYE XE-T. < 380 ev. Innovation with Integrity. Energy. Resolution. High-Resolution Position Sensitive Detector with Superb Energy Resolution XRD
 Energy < 380 ev Resolution High-Resolution Position Sensitive Detector with Superb Energy Resolution The is the next generation "Compound Silicon Strip" detector with superb energy resolution for ultrafast
Damage-free failure/defect analysis in electronics and semiconductor industries using micro-atr FTIR imaging
 Damage-free failure/defect analysis in electronics and semiconductor industries using micro-atr FTIR imaging Application note Electronics and Semiconductor Authors Dr. Mustafa Kansiz and Dr. Kevin Grant
Introduction. Chapter 16 Diagnostic Radiology. Primary radiological image. Primary radiological image
 Introduction Chapter 16 Diagnostic Radiology Radiation Dosimetry I Text: H.E Johns and J.R. Cunningham, The physics of radiology, 4 th ed. http://www.utoledo.edu/med/depts/radther In diagnostic radiology
Information & Instructions
 KEY FEATURES 1. USB 3.0 For the Fastest Transfer Rates Up to 10X faster than regular USB 2.0 connections (also USB 2.0 compatible) 2. High Resolution 4.2 MegaPixels resolution gives accurate profile measurements
μscope Microscopy Software
 μscope Microscopy Software Pixelink μscope Essentials (ES) Software is an easy-to-use robust image capture tool optimized for productivity. Pixelink μscope Standard (SE) Software had added features, making
Image Processing Tutorial Basic Concepts
 Image Processing Tutorial Basic Concepts CCDWare Publishing http://www.ccdware.com 2005 CCDWare Publishing Table of Contents Introduction... 3 Starting CCDStack... 4 Creating Calibration Frames... 5 Create
Fastest high definition Raman imaging. Fastest Laser Raman Microscope RAMAN
 Fastest high definition Raman imaging Fastest Laser Raman Microscope RAMAN - 11 www.nanophoton.jp Observation A New Generation in Raman Observation RAMAN-11 developed by Nanophoton was newly created by
Manual: MasTracker for ImageJ
 Manual: MasTracker for ImageJ Martin Storath 3. Juli 2007 1 1 Introduction The following are instructions for the tracking plug-in MasTracker for ImageJ. MasTracker was implemented by Martin Storath as
Nuclear Associates EZ CR-DIN Phantoms
 Nuclear Associates 07-605-7777 EZ CR-DIN Phantoms Users Manual August 2006 Manual No. 07-605-7777-1 Rev. 4 2006 Fluke Corporation, All rights reserved. Printed in U.S.A. All product names are trademarks
WORKSHOP. Fiber Optic Reflectance Spectrometry for pigments identification in paintings. Marco Gargano Department of Physics
 WORKSHOP Fiber Optic Reflectance Spectrometry for pigments identification in paintings Marco Gargano Department of Physics Light and Colors Primary source of color Incandescence luminescence Scattering
QUANTAX. Innovation with Integrity. EDS with Slim-line Technology for SEM and TEM EDS
 QUANTAX EDS with Slim-line Technology for SEM and TEM Innovation with Integrity EDS Excellence in X-ray Analysis for the Electron Microscope The new generation of QUANTAX EDS features slim-line technology
Fast Laser Raman Microscope RAMAN
 Fast Laser Raman Microscope RAMAN - 11 www.nanophoton.jp Fast Raman Imaging A New Generation of Raman Microscope RAMAN-11 developed by Nanophoton was created by combining confocal laser microscope technology
Living Image 3.2 Software Release Notes New Features and Improvements
 Living Image 3.2 Software Release Notes New Features and Improvements 1 Purpose This document is a brief overview of the new features and improvements in the Living Image software that accompanies the
Digital Image Processing Introduction
 Digital Processing Introduction Dr. Hatem Elaydi Electrical Engineering Department Islamic University of Gaza Fall 2015 Sep. 7, 2015 Digital Processing manipulation data might experience none-ideal acquisition,
Practical Image and Video Processing Using MATLAB
 Practical Image and Video Processing Using MATLAB Chapter 10 Neighborhood processing What will we learn? What is neighborhood processing and how does it differ from point processing? What is convolution
Finer Points of ICP-OES Setup and Operation
 Finer Points of ICP-OES Setup and Operation (Part 1) James Bartos Office of Indiana State Chemist Challenges with Fertilizers Broad conc ranges from low ppm to upper % level Want to test all nutrient elements
GigE MV Cameras - XCG
 GigE MV Cameras - XCG Gig-E Camera Line-Up - XCG Speed EXview HAD High IR sensitive ICX-625 (Super HAD) ICX-274 (Super HAD) ICX-285 (EXView HAD) ICX-424 (HAD) XCG-V60E B&W, 1/3 VGA, 90fps XCG-SX97E SX99E
Supplementary Figure S1: Schematic view of the confocal laser scanning STED microscope used for STED-RICS. For a detailed description of our
 Supplementary Figure S1: Schematic view of the confocal laser scanning STED microscope used for STED-RICS. For a detailed description of our home-built STED microscope used for the STED-RICS experiments,
LYNXEYE XE. Innovation with Integrity. High-Resolution Energy-Dispersive Detector for 0D, 1D, and 2D Diffraction XRD
 High-Resolution Energy-Dispersive Detector for 0D, 1D, and 2D Diffraction The is the first energy dispersive 0D, 1D, and 2D detector operating at room temperature for ultra fast X-ray diffraction measurements.
XRF Instrumentation. Introduction to spectrometer
 XRF Instrumentation Introduction to spectrometer AMPTEK, INC., Bedford, MA 01730 Ph: +1 781 275 2242 Fax: +1 781 275 3470 sales@amptek.com 1 Instrument Excitation source Sample X-ray tube or radioisotope
COMPUTED RADIOGRAPHY CHAPTER 4 EFFECTIVE USE OF CR
 This presentation is a professional collaboration of development time prepared by: Rex Christensen Terri Jurkiewicz and Diane Kawamura New Technology https://www.youtube.com/watch?v=ptkzznazb 7U COMPUTED
USER MANUAL. ScanFlex AUTOMATED SCANNING DEVICE SCANFLEX Rev 5.0
 USER MANUAL ScanFlex AUTOMATED SCANNING DEVICE 05-12-17 SCANFLEX 3.1.4 Rev 5.0 Culturing Cells in a Mechanically Active Environment Flexcell International Corporation 2730 Tucker Street, Suite 200 Burlington,
Chapter 4 SPEECH ENHANCEMENT
 44 Chapter 4 SPEECH ENHANCEMENT 4.1 INTRODUCTION: Enhancement is defined as improvement in the value or Quality of something. Speech enhancement is defined as the improvement in intelligibility and/or
SCIEX Presentation. Name of Speaker, Identification. QTRAP Functionalities. Alexandre Paccou Name of Speaker, Identification. SCIEX Presentation.
 SCIEX Presentation Alexandre Paccou Name of Speaker, Identification Date SCIEX Presentation QTRAP Functionalities Hardware and Software Tipps und Tricks, Name of Speaker, Identification Date For Research
MOXTEK S NEW ULTRA-LITE X-RAY SOURCES: PERFORMACE CHARACTERIZATIONS
 Copyright JCPDS-International Centre for Diffraction Data 2013 ISSN 1097-0002 202 MOXTEK S NEW ULTRA-LITE X-RAY SOURCES: PERFORMACE CHARACTERIZATIONS S. Cornaby, S. Morris, J. Smith, D. Reynolds, K. Kozaczek
Digital radiography: Practical advantages of Digital Radiography. Practical Advantages in image quality
 Digital radiography: Digital radiography is set to become the most common form of processing radiographic images in the next 10 years. This is due to a number of practical and image quality issues. Practical
3D light microscopy techniques
 3D light microscopy techniques The image of a point is a 3D feature In-focus image Out-of-focus image The image of a point is not a point Point Spread Function (PSF) 1D imaging 2D imaging 3D imaging Resolution
Principles of Pulse-Doppler Radar p. 1 Types of Doppler Radar p. 1 Definitions p. 5 Doppler Shift p. 5 Translation to Zero Intermediate Frequency p.
 Preface p. xv Principles of Pulse-Doppler Radar p. 1 Types of Doppler Radar p. 1 Definitions p. 5 Doppler Shift p. 5 Translation to Zero Intermediate Frequency p. 6 Doppler Ambiguities and Blind Speeds
Application Note. ipix A Gamma imager to support various applications. Introduction. An easy to carry and deploy instrument
 Application Note ipix A Gamma imager to support various applications Introduction ipix is a unique gamma imager that quickly locates low level radioactive sources from a distance and estimates the dose
Exploring Color Mysteries in the United States Large and Small Numeral Postage Due stamps using X-ray Fluorescence Spectrometry
 Exploring Color Mysteries in the United States Large and Small Numeral Postage Due stamps using X-ray Fluorescence Spectrometry Harry K. Charles, Jr., Ph. D. 3rd International Symposium on Analytical Methods
CR35-SP+ Computed Radiography (CR) System. Innovations in Digital Imaging
 System. Innovations in Digital Imaging") CR35-SP+ Computed Radiography (CR) System Innovations in Digital Imaging Solution for Quantum Medical Imaging CR35-SP+ Package An Agfa Healthcare Solution for Quantum Medical Imaging The CR35-SP+ Package
CR35-SP+ Computed Radiography (CR) System Innovations in Digital Imaging Solution for Quantum Medical Imaging CR35-SP+ Package An Agfa Healthcare Solution for Quantum Medical Imaging The CR35-SP+ Package
IBEX MATERIALS DETECTION TECHNOLOGY
 WHITE PAPER: IBEX MATERIALS DETECTION TECHNOLOGY IBEX Innovations Ltd. Registered in England and Wales: 07208355 Address: Discovery 2, NETPark, William Armstrong Way, Sedgefield, TS21 3FH, UK Patents held
Digital Image Processing
 Digital Image Processing 1 Patrick Olomoshola, 2 Taiwo Samuel Afolayan 1,2 Surveying & Geoinformatic Department, Faculty of Environmental Sciences, Rufus Giwa Polytechnic, Owo. Nigeria Abstract: This paper