Statistical Software for Process Validation. Featuring Minitab
|
|
|
- Estella White
- 6 years ago
- Views:
Transcription


1 Statistical Software for Process Validation Featuring Minitab
2 Regulatory Requirements 21 CFR 820 Subpart O--Statistical Techniques Sec Statistical techniques. (a) Where appropriate, each manufacturer shall establish and maintain procedures for identifying valid statistical techniques required for establishing, controlling, and verifying the acceptability of process capability and product characteristics. (b) Sampling plans, when used, shall be written and based on a valid statistical rationale. Each manufacturer shall establish and maintain procedures to ensure that sampling methods are adequate for their intended use and to ensure that when changes occur the sampling plans are reviewed. These activities shall be documented. -Code of Federal Regulations, Title 21, Volume 8, Subchapter H Medical Devices, Part 820 Quality System Regulation
3 Statistical Requirements 1. Stability 2. Capability 3. Normality
4 1. Stability Total Variation Target

5 First the process must be stable Xbar and r charts IMR charts theory
6 X bar-r charts Variables data Subgroups 8 Monitors the mean and variation of a process. Control limits on the Xbar chart are estimates only. Confirm process variation is stable using R chart first.
7
8 I-MR charts Variables data No subgroups Monitors the mean and variation of a process Control limits on the I chart are estimates only. Confirm process variation is stable using MR chart first.

9
10 2. Capability Cpk: capability of the process at a point in time (present) Ppk: capability of the process over time (future) Copyright GCI, Inc. 2006
11 P pk versus C pk P pk C pk Uses total standard deviation Measures performance of the process (what the process is actually doing) Uses within subgroup standard deviation Measures what the process is capable of doing if it were stable
12 P pk P pk is a measure of how close the process is to the nearest spec relative to the variation P pk = Distance from mean to nearest spec 3 s Copyright GCI, Inc. 2006
13 P pk LSL Numerator Denominator USL Target
14 Pp P p = USL - LSL 6 s s is standard deviation (total) Compares width of process (6 s) to width of spec (USL - LSL) P p is similar to C p but uses total rather than within subgroup standard deviation Copyright GCI, Inc. 2006
15 P pk when P p =2 USL P pk = 2 P pk = 1.5 P pk = 1.5 P pk = 1 P pk = 1 P pk = 0.5 P pk = 0.5 LSL
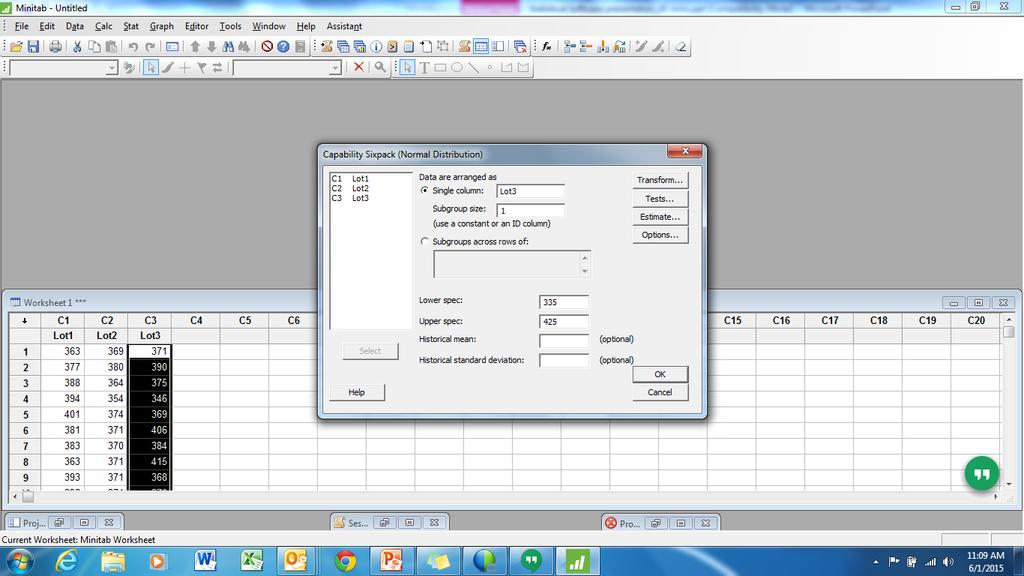
16 3. Normality Variables sampling plans use the normal distribution to predict the percentage of units outside of spec LSL USL 2.3% Out of Spec
17 Normality Assumption Requires a separate normality test Requires a stable process It is possible to transform non-normal data to normal data, but it is not always appropriate to do so.
18 Normality Testing Required For: Design Verification and Process Validation Receiving and In-Process Inspections When Using: Variables Sampling Plans Capability Studies Hypothesis Testing
19 Example LTPD = 0.3% Variables 2-sided 95% Confidence Parameters AQL LTPD 0.05 n=15, P pk =1.37, P p = % (P pk =1.82) 0.3% (P pk =0.92) n=20, P pk =1.29, P p = % (P pk =1.69) 0.3% (P pk =0.92) n=30, P pk =1.21, P p = % (P pk =1.48) 0.3% (P pk =0.92) n=40, P pk =1.16, P p = % (P pk =1.39) 0.3% (P pk =0.92) n=50, P pk =1.13, P p = % (P pk =1.33) 0.3% (P pk =0.92) n=60, P pk =1.11, P p = % (P pk =1.29) 0.3% (P pk =0.92) n=80, P pk =1.08, P p = % (P pk =1.23) 0.3% (P pk =0.92) n=100, P pk =1.06, P p = % (P pk =1.19) 0.3% (P pk =0.92)
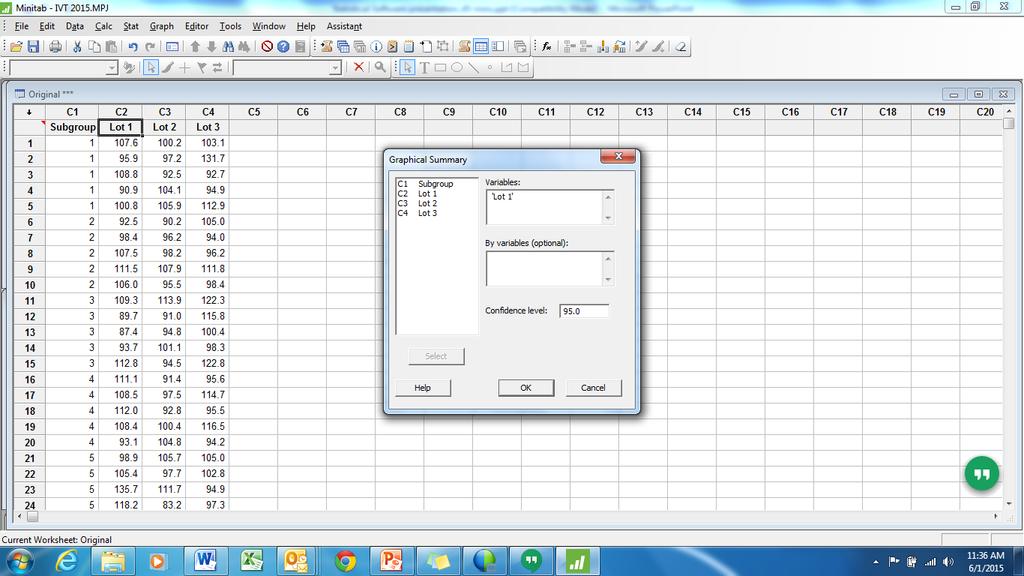
20 Minitab

21 Graphical Summary
22 Normality Established
23 Capability Analysis

24
25
26 Conclusion P pk = 1.35 which is above the required value of P pk = 1.29 PASS P p = 1.38 which is above the required value of P p = PASS

27 Skewness and Kurtosis
28 Transformations Lognormal Weibull Box-Cox transformations Procedure in Minitab for identifying which of a family of transformations might work Johnson family of distributions Transformation can be selected for any skewnesskurtosis combination
29 Non-normal Example LTPD = 0.3% Variables 2-sided 95% Confidence Parameters AQL LTPD 0.05 n=15, P pk =1.37, P p = % (P pk =1.82) 0.3% (P pk =0.92) n=20, P pk =1.29, P p = % (P pk =1.69) 0.3% (P pk =0.92) n=30, P pk =1.21, P p = % (P pk =1.48) 0.3% (P pk =0.92) n=40, P pk =1.16, P p = % (P pk =1.39) 0.3% (P pk =0.92) n=50, P pk =1.13, P p = % (P pk =1.33) 0.3% (P pk =0.92) n=60, P pk =1.11, P p = % (P pk =1.29) 0.3% (P pk =0.92) n=80, P pk =1.08, P p = % (P pk =1.23) 0.3% (P pk =0.92) n=100, P pk =1.06, P p = % (P pk =1.19) 0.3% (P pk =0.92)

30 Minitab

31 Test Normality
32

33 Normality Test Fails

34 Identify the Distribution

35 Choose Distributions to Test

36 Probability Plots


37 Check p Values

38 Non-normal Capability Analysis

39 Select Lognormal
40 Data and Specs Transformed
41 Conclusion P pk = 1.06 which is at the required value of P pk = 1.06 PASS P p = 1.20 which is above the required value of P p = PASS

42 Contact me with Questions Roberta Goode, MSBE, CQE x310
Design For Manufacturing. Design Documents. Gage R&R DFM
 rev.8. 1 Contents Purpose of the Abloy Part Approval Process is: 1. To provide the evidence that all customer engineering designs and required specifications are properly understood and fulfilled by manufacturing..
Seven Basic Quality Control Tools HISTOGRAM TOOL
 Frequency Frequency Seven Basic Quality Control Tools HISTOGRAM TOOL QUALITY TOOLS Histogram Description of Histogram: The frequency histogram (or distribution) is a statistical tool for presenting numerous
Data and Graphical Analysis Participant Workbook
 Data and Graphical Analysis Participant Workbook 2014 The Quality Group All Rights Reserved ver. 5.0 DATA AND GRAPHICAL ANALYSIS - 1 1992, 1995, 2008, 2012, 2014 by The Quality Group. All rights reserved.
I STATISTICAL TOOLS IN SIX SIGMA DMAIC PROCESS WITH MINITAB APPLICATIONS
 Six Sigma Quality Concepts & Cases- Volume I STATISTICAL TOOLS IN SIX SIGMA DMAIC PROCESS WITH MINITAB APPLICATIONS Chapter 7 Measurement System Analysis Gage Repeatability & Reproducibility (Gage R&R)
Advanced Engineering Statistics. Jay Liu Dept. Chemical Engineering PKNU
 Advanced Engineering Statistics Jay Liu Dept. Chemical Engineering PKNU Statistical Process Control (A.K.A Process Monitoring) What we will cover Reading: Textbook Ch.? ~? 2012-06-27 Adv. Eng. Stat., Jay
Assessing Measurement System Variation
 Assessing Measurement System Variation Example 1: Fuel Injector Nozzle Diameters Problem A manufacturer of fuel injector nozzles installs a new digital measuring system. Investigators want to determine
Measurement Systems Analysis
 Measurement Systems Analysis Measurement Systems Analysis (MSA) Reference Manual, AIAG, 1995. (www.aiag.org) Copyright, Pat Hammett, University of Michigan. All Rights Reserved. 1 Topics I. Components
Chapter 5 Exercise Solutions
 -bar R Chapter Eercise Solutions Notes:. Several eercises in this chapter differ from those in the th edition. An * indicates that the description has changed. A second eercise number in parentheses indicates
I STATISTICAL TOOLS IN SIX SIGMA DMAIC PROCESS WITH MINITAB APPLICATIONS
 Six Sigma Quality Concepts & Cases- Volume I STATISTICAL TOOLS IN SIX SIGMA DMAIC PROCESS WITH MINITAB APPLICATIONS Chapter 7 Measurement System Analysis Gage Repeatability & Reproducibility (Gage R&R)
Acceptance Charts. Sample StatFolio: acceptance chart.sgp
 Acceptance Charts Summary The Acceptance Charts procedure creates control charts with modified control limits based on both the standard deviation of the process and on specification limits for the variable
One-Sample Z: C1, C2, C3, C4, C5, C6, C7, C8,... The assumed standard deviation = 110
 SMAM 314 Computer Assignment 3 1.Suppose n = 100 lightbulbs are selected at random from a large population.. Assume that the light bulbs put on test until they fail. Assume that for the population of light
An Evaluation of Artifact Calibration in the 5700A Multifunction Calibrator
 An Evaluation of Artifact Calibration in the 57A Multifunction Calibrator Application Note Artifact Calibration, as implemented in the Fluke Calibration 57A Multifunction Calibrator, was a revolutionary
ANALYZE. Lean Six Sigma Black Belt. Chapter 2-3. Short Run SPC Institute of Industrial Engineers 2-3-1
 Chapter 2-3 Short Run SPC 2-3-1 Consider the Following Low production quantity One process produces many different items Different operators use the same equipment These are all what we refer to as short
Outline Process Control. Variation: Common and Special Causes. What is quality? Common and Special Causes (cont d)
") . Process Control Outline. Optimization. Statistical Process Control 3. In-Process Control What is quality? Variation: Common and Special Causes Pieces vary from each other: But they form a pattern that,
. Process Control Outline. Optimization. Statistical Process Control 3. In-Process Control What is quality? Variation: Common and Special Causes Pieces vary from each other: But they form a pattern that,
Measurement Systems Analysis
 11 Measurement Systems Analysis Measurement Systems Analysis Overview, 11-2, 11-4 Gage Run Chart, 11-23 Gage Linearity and Accuracy Study, 11-27 MINITAB User s Guide 2 11-1 Chapter 11 Measurement Systems
Assessing Measurement System Variation
 Example 1 Fuel Injector Nozzle Diameters Problem A manufacturer of fuel injector nozzles has installed a new digital measuring system. Investigators want to determine how well the new system measures the
The Intraclass Correlation Coefficient
 Quality Digest Daily, December 2, 2010 Manuscript No. 222 The Intraclass Correlation Coefficient Is your measurement system adequate? In my July column Where Do Manufacturing Specifications Come From?
Toolwear Charts. Sample StatFolio: toolwear chart.sgp. Sample Data: STATGRAPHICS Rev. 9/16/2013
 Toolwear Charts Summary... 1 Data Input... 2 Toolwear Chart... 5 Analysis Summary... 6 Analysis Options... 7 MR(2)/R/S Chart... 8 Toolwear Chart Report... 10 Runs Tests... 10 Tolerance Chart... 11 Save
The Statistical Cracks in the Foundation of the Popular Gauge R&R Approach
 The Statistical Cracks in the Foundation of the Popular Gauge R&R Approach 10 parts, 3 repeats and 3 operators to calculate the measurement error as a % of the tolerance Repeatability: size matters The
MULTIPLE CHOICE. Choose the one alternative that best completes the statement or answers the question. B) Blood type Frequency
 Blood type Frequency") MATH 1342 Final Exam Review Name Construct a frequency distribution for the given qualitative data. 1) The blood types for 40 people who agreed to participate in a medical study were as follows. 1) O A
MATH 1342 Final Exam Review Name Construct a frequency distribution for the given qualitative data. 1) The blood types for 40 people who agreed to participate in a medical study were as follows. 1) O A
A Contractor s View of PWL (Michigan Experience)
") A Contractor s View of PWL (Michigan Experience) Peter Capon Rieth-Riley Construction Co., Inc. January 10, 2007 PWL View - New way of thinking - Needs a different approach - Learn how Acceptance Criteria
A Contractor s View of PWL (Michigan Experience) Peter Capon Rieth-Riley Construction Co., Inc. January 10, 2007 PWL View - New way of thinking - Needs a different approach - Learn how Acceptance Criteria
DATUM TRANSFORMATION ANALYSIS FOR PRODUCTION PART APPROVAL USING 3D NON-CONTACT MEASUREMENT
 UMTRI-2008-35 DATUM TRANSFORMATION ANALYSIS FOR PRODUCTION PART APPROVAL USING 3D NON-CONTACT MEASUREMENT Patrick C. Hammett, Ph.D. 1 Amir Fallahi 2 Steven W. Geddes 1 Kwanghan Lee 1 1 University of Michigan
QUALITY CONTROL INSTRUCTIONS
 QUALITY CONTROL INSTRUCTIONS QCI NO. 100 REVISION E SPC PROCEDURE WRITTEN BY: R. Zielinski DATE: 2/3/92 APPROVED BY: APPROVED BY: Department Manager Quality Assurance Manager DATE: DATE: SF 118 1 CHANGE
Issue 89 November 2016
 Voltage Contrast Part 1 By Christopher Henderson In this presentation, we discuss voltage contrast, one of a number of techniques that use scanning electron microscopy to aid in fault isolation. Voltage
Assignment 8 Sampling, SPC and Control chart
 Instructions: Assignment 8 Sampling, SPC and Control chart 1. Total No. of Questions: 25. Each question carries one point. 2. All questions are objective type. Only one answer is correct per numbered item.
Inspection and Measurement
 Inspection and Measurement Inspection An action to insure what is being manufactured conforms to the specifications by attributes use of gages: go or no-go by variables use of calibrated instruments Measurement
Chapter 9 Introduction to Statistical Quality Control, 6 th Edition by Douglas C. Montgomery. Copyright (c) 2009 John Wiley & Sons, Inc.
 2009 John Wiley & Sons, Inc.") 1 2 Learning Objectives Chapter 9 Introduction to Statistical Quality Control, 6 th Edition by Douglas C. Montgomery. 3 9.1 The Cumulative Sum Control Chart Chapter 9 4 5 The Cumulative Sum Control Chart
1 2 Learning Objectives Chapter 9 Introduction to Statistical Quality Control, 6 th Edition by Douglas C. Montgomery. 3 9.1 The Cumulative Sum Control Chart Chapter 9 4 5 The Cumulative Sum Control Chart
The Problem of Long-Term Capability
 Quality Digest Daily, July 8, 2013 Manuscript 257 The Problem of Long-Term Capability Poor labels lead to incorrect ideas Donald J. Wheeler Based on some recent inquiries there seems to be some need to
PPAP 3rd Edition Check List
 PPAP 3rd Edition Check List Supplier: PPAPKIT_F01 Rev. A (May_03) Date: Submission Level: Part #: Eng. Chg. Level: Reviewed By: Yes No N/A Comments 1. Design Records / Drawings 2. Eng. Chg. Documents On
What Is a Histogram? A bar graph that shows the distribution of data A snapshot of data taken from a process HISTOGRAM VIEWGRAPH 1
 What Is a Histogram? 100 80 60 40 20 0 0 5 10 15 20 25 30 35 40 45 50 55 60 A bar graph that shows the distribution of data A snapshot of data taken from a process HISTOGRAM VIEWGRAPH 1 When Are Histograms
GW5BTF27K00. Light Emitting Diode Module. Spec No. DG A. Product Type. Model No.
 Spec No. Issue DG-099008A 16-Apr-10 Product Type Light Emitting Diode Module Model No. GW5BTF27K00 These specifications contain 14 pages including the cover and appendix. If you have any objections, please
Exploring Data Patterns. Run Charts, Frequency Tables, Histograms, Box Plots
 Exploring Data Patterns Run Charts, Frequency Tables, Histograms, Box Plots 1 Topics I. Exploring Data Patterns - Tools A. Run Chart B. Dot Plot C. Frequency Table and Histogram D. Box Plot II. III. IV.
Lessons Learned in Integrating Risk Management and Process Validation
 Lessons Learned in Integrating Risk Management and Process Validation Medical Device Congress Harvard March 2007 Jim Handzo Senior Manager QA Innovative Spinal Technologies Fran Akelewicz Principal Practical
Summary... 1 Sample Data... 2 Data Input... 3 C Chart... 4 C Chart Report... 6 Analysis Summary... 7 Analysis Options... 8 Save Results...
 C Chart Summary... 1 Sample Data... 2 Data Input... 3 C Chart... 4 C Chart Report... 6 Analysis Summary... 7 Analysis Options... 8 Save Results... 9 Summary The C Chart procedure creates a control chart
Trial version. Resistor Production. How can the outcomes be analysed to optimise the process? Student. Contents. Resistor Production page: 1 of 15
 Resistor Production How can the outcomes be analysed to optimise the process? Resistor Production page: 1 of 15 Contents Initial Problem Statement 2 Narrative 3-11 Notes 12 Appendices 13-15 Resistor Production
Percent Within Limits The NDOT Story
 Percent Within Limits The NDOT Story By Steve Hale, P.E. Quality Assurance Engineer Nevada Transportation Conference May 2 nd & 3 rd, 2017 Reno, Nevada Outline What is Percent Within Limits (PWL)? How
Additions, Revisions, or Updates
 1 10 10-14 SUBJECT DATE SPN 2623 (CPC) (GHG14) October 2014 Additions, Revisions, or Updates Publication Number / Title Platform Section Title Change SPN 2623/FMI 2 - DDC-SVC-MAN-0084 GHG14 DD Platform
Geostatistical estimation applied to highly skewed data. Dr. Isobel Clark, Geostokos Limited, Alloa, Scotland
 "Geostatistical estimation applied to highly skewed data", Joint Statistical Meetings, Dallas, Texas, August 1999 Geostatistical estimation applied to highly skewed data Dr. Isobel Clark, Geostokos Limited,
An Investigation into Printing Miniaturised Devices for the Automotive and Industrial Manufacturing Sectors
 As originally published in the IPC APEX EXPO Conference Proceedings. An Investigation into Printing Miniaturised Devices for the Automotive and Industrial Manufacturing Sectors Clive Ashmore Mark Whitmore
IE 361 Module 13. Control Charts for Counts ("Attributes Data") Reading: Section 3.3 of Statistical Quality Assurance Methods for Engineers
 Reading: Section 3.3 of Statistical Quality Assurance Methods for Engineers") IE 361 Module 13 Control Charts for Counts ("Attributes Data") Reading: Section 3.3 of Statistical Quality Assurance Methods for Engineers Prof. Steve Vardeman and Prof. Max Morris Iowa State University
IE 361 Module 13 Control Charts for Counts ("Attributes Data") Reading: Section 3.3 of Statistical Quality Assurance Methods for Engineers Prof. Steve Vardeman and Prof. Max Morris Iowa State University
Quality Improvement for Steel Wire Coating by the Hot-Dip Galvanizing Process to A Class Standard: A Case Study in a Steel Wire Coating Factory
 Kasetsart J. (Nat. Sci.) 47 : 447-452 (2013) Quality Improvement for Steel Wire Coating by the Hot-Dip Galvanizing Process to Class Standard: Case Study in a Steel Wire Coating Factory Pongthorn Ruksorn*
Steady State Operating Curve Voltage Control System
 UTC Engineering 39 Steady State Operating Curve Voltage Control System Michael Edge Partners: Michael Woolery Nathan Holland September 5, 7 Introduction A steady state operating curve was created to show
Lens Impact Resistance Testing Plan Revised,
 Forward Lens Impact Resistance Testing Plan Revised, 2013-12 The Vision Council (TVC) has developed a plan for labs that need to impact test plastic lenses in accordance with FDA requirements. The step-by-step
CHAPTER 6 ON-LINE TOOL WEAR COMPENSATION AND ADAPTIVE CONTROL
 98 CHAPTER 6 ON-LINE TOOL WEAR COMPENSATION AND ADAPTIVE CONTROL 6.1 INTRODUCTION There is lot of potential for improving the performance of machine tools. In order to improve the performance of machine
Granite State ASQ 0104 MSA an alternative method for estimating % Tolerance April 18, 2012 Jack Meagher - NHBB
 Granite State ASQ 00 MSA an alternative method for estimating % Tolerance April 8, 0 Jack Meagher - NHBB New Hampshire Ball Bearings Founded in 96 in Peterborough, NH Acquired by Minebea (Japan) in 98
Math 58. Rumbos Fall Solutions to Exam Give thorough answers to the following questions:
 Math 58. Rumbos Fall 2008 1 Solutions to Exam 2 1. Give thorough answers to the following questions: (a) Define a Bernoulli trial. Answer: A Bernoulli trial is a random experiment with two possible, mutually
WirelessUSB LS Radio Module FCC Testing & Verification - AN4006
 WirelessUSB LS Radio Module FCC Testing & Verification - AN4006 Introduction One of the bottlenecks that many product developers encounter in incorporating any radio communication device is facing the
INTERNATIONAL STANDARD
 INTERNATIONAL STANDARD IEC 62539 First edition 2007-07 IEEE 930 Guide for the statistical analysis of electrical insulation breakdown data Commission Electrotechnique Internationale International Electrotechnical
Statistical Process Control and Computer Integrated Manufacturing. The Equipment Controller
 Statistical Process Control and Computer Integrated Manufacturing Run to Run Control, Real-Time SPC, Computer Integrated Manufacturing. 1 The Equipment Controller Today, the operation of individual pieces
Gage Repeatability and Reproducibility (R&R) Studies. An Introduction to Measurement System Analysis (MSA)
 Studies. An Introduction to Measurement System Analysis (MSA)") Gage Repeatability and Reproducibility (R&R) Studies An Introduction to Measurement System Analysis (MSA) Agenda Importance of data What is MSA? Measurement Error Sources of Variation Precision (Resolution,
Gage Repeatability and Reproducibility (R&R) Studies An Introduction to Measurement System Analysis (MSA) Agenda Importance of data What is MSA? Measurement Error Sources of Variation Precision (Resolution,
Automotive core tool: MSA. Everyone is muted. We will start at 7pm EST. Kush Shah, Chairman ASQ Automotive Division
 Automotive core tool: MSA Everyone is muted. We will start at 7pm EST. Kush Shah, Chairman ASQ Automotive Division Agenda Housekeeping Items About ASQ Automotive Division Our Vision Webinar Series Automotive
Combination Products Verification, Validation & Human Factors Sept. 12, 2017
 Combination Products Verification, Validation & Human Factors Sept. 12, 2017 Speaker Scott Thiel Director, Navigant Consulting Regulatory consulting in Life Sciences industry with focus on medical devices,
TRANSMITTER MODEL: KAS-2030M
 Page 1 of 16 FCC PART 15, SUBPART B and C TEST REPORT for TRANSMITTER MODEL: KAS-2030M Prepared for WILDLIFE TECHNOLOGIES 115 WOLCOTT STREET MANCHESTER, NEW HAMPSHIRE 03103 Prepared by: KYLE FUJIMOTO Approved
SAMPLING DISTRIBUTION MODELS TODAY YOU WILL NEED: PENCIL SCRATCH PAPER A PARTNER (YOUR CHOICE) ONE THUMBTACK PER GROUP Z-SCORE CHART
 ONE THUMBTACK PER GROUP Z-SCORE CHART") SAMPLING DISTRIBUTION MODELS TODAY YOU WILL NEED: PENCIL SCRATCH PAPER A PARTNER (YOUR CHOICE) ONE THUMBTACK PER GROUP Z-SCORE CHART FLIPPING THUMBTACKS PART 1 I want to know the probability that, when
SAMPLING DISTRIBUTION MODELS TODAY YOU WILL NEED: PENCIL SCRATCH PAPER A PARTNER (YOUR CHOICE) ONE THUMBTACK PER GROUP Z-SCORE CHART FLIPPING THUMBTACKS PART 1 I want to know the probability that, when
IE 361 Module 17. Process Capability Analysis: Part 1. Reading: Sections 5.1, 5.2 Statistical Quality Assurance Methods for Engineers
 IE 361 Module 17 Process Capability Analysis: Part 1 Reading: Sections 5.1, 5.2 Statistical Quality Assurance Methods for Engineers Prof. Steve Vardeman and Prof. Max Morris Iowa State University Vardeman
NATIONAL RADIO SYSTEMS COMMITTEE
 NRSC GUIDELINE NATIONAL RADIO SYSTEMS COMMITTEE NRSC-G202-A FM IBOC Total Digital Sideband Power for Various Configurations April 2016 NAB: 1771 N Street, N.W. 1919 South Eads Street Washington, DC 20036
Many applications. Mismatched Load Characterization for High-Power RF Amplifiers PA CHARACTERIZATION. This article discusses the
 From April 2004 High Frequency Electronics Copyright 2004 Summit Technical Media, LLC Mismatched Load Characterization for High-Power RF Amplifiers By Richard W. Brounley, P.E. Brounley Engineering Many
AHRI Standard Standard for Performance Rating of Modulating Positive Displacement Refrigerant Compressors
 AHRI Standard 545 2017 Standard for Performance Rating of Modulating Positive Displacement Refrigerant Compressors IMPORTANT SAFETY RECOMMENDATIONS AHRI does not set safety standards and does not certify
Capability Control Chart for Variables
 Capability Control Chart for Variables Revised: 10/10/2017 Summary... 1 Data Input... 3 Analysis Options... 4 Analysis Summary... 5 Control Chart... 6 Chart Report... 8 Runs Tests... 9 OC Curve... 11 ARL
Operations Management
 10-1 Quality Control Operations Management William J. Stevenson 8 th edition 10-2 Quality Control CHAPTER 10 Quality Control McGraw-Hill/Irwin Operations Management, Eighth Edition, by William J. Stevenson
Chapter 1. Picturing Distributions with Graphs
 Chapter 1. Picturing Distributions with Graphs 1 Chapter 1. Picturing Distributions with Graphs Definition. Individuals are the objects described by a set of data. Individuals may be people, but they may
Ultrasonics. Introduction
 Ultrasonics Introduction Ultrasonics is the term used to describe those sound waves whose frequency is above the audible range of human ear upward from approximately 20kHz to several MHz. The ultrasonics
Specifying, predicting and testing:
 Specifying, predicting and testing: Three steps to coverage confidence on your digital radio network EXECUTIVE SUMMARY One of the most important properties of a radio network is coverage. Yet because radio
BE540 - Introduction to Biostatistics Computer Illustration. Topic 1 Summarizing Data Software: STATA. A Visit to Yellowstone National Park, USA
 BE540 - Introduction to Biostatistics Computer Illustration Topic 1 Summarizing Data Software: STATA A Visit to Yellowstone National Park, USA Source: Chatterjee, S; Handcock MS and Simonoff JS A Casebook
Transmission Availability Data System Phase II Final Report
 Transmission Availability Data System Phase II Final Report Prepared by the Transmission Availability Data System Task Force for the NERC Planning Committee Approved by the Planning Committee on: Table
micro-gloss The new intelligence in gloss measurement Brilliant color display: easy to read - easy to use Auto diagnosis: Standard OK - Calibration OK
 micro-gloss The new intelligence in gloss measurement The micro-gloss has been the unsurpassed industry standard in gloss measurement for many years. It is the only glossmeter combining the highest accuracy,
CHAPTER MACHINE TOOL ACCURACY
 CHAPTER 12 MACHINE TOOL ACCURACY 12.1 Introduction 12.2 Glossary 12.3 Measuring Tools 12.4 Coordinate Measuring Machines 12.5 Machine Tool Accuracy 12.6 Workpiece Accuracy & Processing Considerations 12.7
Coherent PowerLine. High-Power Structured Light Pattern Generating Laser FEATURES
 Coherent PowerLine High-Power Structured Light Pattern Generating Laser Coherent s PowerLine structured light laser is a line generator developed for demanding industrial machine vision and scientific
Chapter 6 Introduction to Statistical Quality Control, 6 th Edition by Douglas C. Montgomery. Copyright (c) 2009 John Wiley & Sons, Inc.
 2009 John Wiley & Sons, Inc.") 1 2 Learning Objectives Chapter 6 Introduction to Statistical Quality Control, 6 th Edition by Douglas C. Montgomery. 3 4 5 Subgroup Data with Unknown μ and σ Chapter 6 Introduction to Statistical Quality
1 2 Learning Objectives Chapter 6 Introduction to Statistical Quality Control, 6 th Edition by Douglas C. Montgomery. 3 4 5 Subgroup Data with Unknown μ and σ Chapter 6 Introduction to Statistical Quality
06-011r0 Towards a SAS-2 Physical Layer Specification. Kevin Witt 11/30/2005
 06-011r0 Towards a SAS-2 Physical Layer Specification Kevin Witt 11/30/2005 Physical Layer Working Group Goal Draft a Specification which will: 1. Meet the System Designers application requirements, 2.
Comparing Means. Chapter 24. Case Study Gas Mileage for Classes of Vehicles. Case Study Gas Mileage for Classes of Vehicles Data collection
 Chapter 24 One-Way Analysis of Variance: Comparing Several Means BPS - 5th Ed. Chapter 24 1 Comparing Means Chapter 18: compared the means of two populations or the mean responses to two treatments in
G59/3 TYPE TEST VERIFICATION REPORT
 MATERIALS & SAFETY R&D TR 141110T Page 1 of 10 G59/3 TYPE TEST VERIFICATION REPORT This Type Test sheet shall be used to record the results of the type testing of Generating Unit between 16A per phase
Lab Report 4: Root Locus and Proportional Controller
 Lab Report 4: Root Locus and Proportional Controller University of Tennessee at Chattanooga Engineering 32 Blue Team Kevin Schrumpf Justin Anchanattu Justin Rehagen April 1, 212 Introduction The first
Describing Data Visually. Describing Data Visually. Describing Data Visually 9/28/12. Applied Statistics in Business & Economics, 4 th edition
 A PowerPoint Presentation Package to Accompany Applied Statistics in Business & Economics, 4 th edition David P. Doane and Lori E. Seward Prepared by Lloyd R. Jaisingh Describing Data Visually Chapter
Agricultural Data Verification Protocol for the Chesapeake Bay Program Partnership
 Agricultural Data Verification Protocol for the Chesapeake Bay Program Partnership December 3, 2012 Summary In response to an independent program evaluation by the National Academy of Sciences, and the
The MPB150 product line is approved to the latest international regulatory standards, and displays the CE Mark.
 The MPB150 Series incorporates patented high efficiency circuitry, high power density and active Power Factor Correction (PFC) to meet the requirements of networking and data communications systems, as
The History of Design Controls
 OCTOBER 5, 2016 The History of Design Controls P R E S E N T E D B Y : Joseph P. Sener, P.E. V.P. Quality, Device Engineering Hospira, a Pfizer Company Agenda The evolution of Engineering to System Engineering
Geometrical product specifications (GPS) Dimensional measuring equipment. Part 1: Plain limit gauges of linear size
 Dimensional measuring equipment. Part 1: Plain limit gauges of linear size") Provläsningsexemplar / Preview INTERNATIONAL STANDARD ISO 1938-1 First edition 2015-11-01 Geometrical product specifications (GPS) Dimensional measuring equipment Part 1: Plain limit gauges of linear size
Provläsningsexemplar / Preview INTERNATIONAL STANDARD ISO 1938-1 First edition 2015-11-01 Geometrical product specifications (GPS) Dimensional measuring equipment Part 1: Plain limit gauges of linear size
Fitting Probability Distribution Curves to Reliability Data
 AF Fitting Probability Distribution Curves to Reliability Data TransGrid Fitting probability distribution curves to reliability data 31 March 2014 Document information Client: TransGrid Title: Fitting
It includes the Generating Units supplier declaration of compliance with the requirements of Engineering Recommendation G59/3
 MATERIALS & SAFETY R&D TR170801S Page 1 of 8 G59/3 Type Verification Test Report This Type Test sheet shall be used to record the results of the type testing of Generating Unit between 16A per phase and
EUROPEAN GUIDANCE MATERIAL ON CONTINUITY OF SERVICE EVALUATION IN SUPPORT OF THE CERTIFICATION OF ILS & MLS GROUND SYSTEMS
 EUR DOC 012 EUROPEAN GUIDANCE MATERIAL ON CONTINUITY OF SERVICE EVALUATION IN SUPPORT OF THE CERTIFICATION OF ILS & MLS GROUND SYSTEMS First Edition Approved by the European Air Navigation Planning Group
roduction art pproval rocess IHLE3232xxERxxxM5A Generic PPAP Generic PPAP
 roduction art pproval rocess IHLE3232xxERxxxM5A Generic PPAP Generic PPAP Page 8/3/27 Production Part Approval Process The following PPAP documentation is assembled according to AIAG, 4 th Edition PPAP
Analog Lowpass Filter Specifications
 Analog Lowpass Filter Specifications Typical magnitude response analog lowpass filter may be given as indicated below H a ( j of an Copyright 005, S. K. Mitra Analog Lowpass Filter Specifications In the
Investigating the Component Assembly Process Requirements
 Investigating the 01005-Component Assembly Process Requirements Rita Mohanty, Vatsal Shah, Arun Ramasubramani, Speedline Technologies, Franklin, MA Ron Lasky, Tim Jensen, Indium Corp, Utica, NY Abstract
Process Behavior Charts
 CHAPTER 8 Process Behavior Charts Control Charts for Variables Data In statistical process control (SPC), the mean, range, and standard deviation are the statistics most often used for analyzing measurement
Process Control Limits in a CMOS ASIC Fabrication Process K. Jayavel, K.S.R.C.Murthy
 Process Control Limits in a CMOS ASIC Fabrication Process K. Jayavel, K.S.R.C.Murthy Society for Integrated circuit Technology and Applied Research Centre (SITAR), 1640, Doorvaninagar, Bangalore, Karnataka,
OUTDOOR SOUND MODULE/TRANSMITTER MODEL: THE BANDIT
 Page 1 of 16 FCC PART 15, SUBPART B and C TEST REPORT for OUTDOOR SOUND MODULE/TRANSMITTER MODEL: THE BANDIT Prepared for MINASKA OUTDOORS 6517 PLATTE AVENUE LINCOLN, NEBRASKA 68507 Prepared by: KYLE FUJIMOTO
FIBER OPTICS. Prof. R.K. Shevgaonkar. Department of Electrical Engineering. Indian Institute of Technology, Bombay. Lecture: 24. Optical Receivers-
 FIBER OPTICS Prof. R.K. Shevgaonkar Department of Electrical Engineering Indian Institute of Technology, Bombay Lecture: 24 Optical Receivers- Receiver Sensitivity Degradation Fiber Optics, Prof. R.K.
Chapter 11. Sampling Distributions. BPS - 5th Ed. Chapter 11 1
 Chapter 11 Sampling Distributions BPS - 5th Ed. Chapter 11 1 Sampling Terminology Parameter fixed, unknown number that describes the population Example: population mean Statistic known value calculated
University of Tennessee at. Chattanooga
 University of Tennessee at Chattanooga Step Response Engineering 329 By Gold Team: Jason Price Jered Swartz Simon Ionashku 2-3- 2 INTRODUCTION: The purpose of the experiments was to investigate and understand
Reducing Proximity Effects in Optical Lithography
 INTERFACE '96 This paper was published in the proceedings of the Olin Microlithography Seminar, Interface '96, pp. 325-336. It is made available as an electronic reprint with permission of Olin Microelectronic
DESIGN AND PROCESS CONSIDERATIONS FOR THICK FILM SURGE RESISTORS TO INCREASE RELIABILITY
 DESIGN AND PROCESS CONSIDERATIONS FOR THICK FILM SURGE RESISTORS TO INCREASE RELIABILITY Dennis Raesner CTS Corporation Resistor Networks SBU 406 Parr Road Berne, IN 46711 Phone: 219-589-3111 Fax: 219-589-3243
Introduction. Descriptive Statistics. Problem Solving. Inferential Statistics. Chapter1 Slides. Maurice Geraghty
 Inferential Statistics and Probability a Holistic Approach Chapter 1 Displaying and Analyzing Data with Graphs This Course Material by Maurice Geraghty is licensed under a Creative Commons Attribution-ShareAlike
Using Reference Multimeters for Precision Measurements
 Using Reference Multimeters for Precision Measurements Advanced techniques for improved confidence in metrology Teleconference: US & Canada Toll Free Dial-In Number: 1-(866) 230-5936 International Dial-In
SURVEY ON USE OF INFORMATION AND COMMUNICATION TECHNOLOGY (ICT)
") 1. Contact SURVEY ON USE OF INFORMATION AND COMMUNICATION TECHNOLOGY (ICT) 1.1. Contact organization: Kosovo Agency of Statistics KAS 1.2. Contact organization unit: Social Department Living Standard Sector
1. Contact SURVEY ON USE OF INFORMATION AND COMMUNICATION TECHNOLOGY (ICT) 1.1. Contact organization: Kosovo Agency of Statistics KAS 1.2. Contact organization unit: Social Department Living Standard Sector
Why Should We Care? Everyone uses plotting But most people ignore or are unaware of simple principles Default plotting tools are not always the best
 Elementary Plots Why Should We Care? Everyone uses plotting But most people ignore or are unaware of simple principles Default plotting tools are not always the best More importantly, it is easy to lie
Please Turn Over Page 1 of 7
 . Page 1 of 7 ANSWER ALL QUESTIONS Question 1: (25 Marks) A random sample of 35 homeowners was taken from the village Penville and their ages were recorded. 25 31 40 50 62 70 99 75 65 50 41 31 25 26 31
Application Note No. 149
 Application Note, Rev. 1.2, February 2008 1.8 V, 2.6 ma Low Noise Amplifier for 1575 MHz GPS L1 Frequency with the BFP405 RF Transistor Small Signal Discretes Edition 2008-02-22 Published by Infineon Technologies
Data Sheet. VMMK to 4 GHz GaAs High Linearity LNA in Wafer Level Package. Features. Description. Specifications (Vdd = 3.
 VMMK-243 2 to 4 GHz GaAs High Linearity LNA in Wafer Level Package Data Sheet Description Avago s VMMK-243 is an easy-to-use, high linearity low noise amplifier in a miniaturized wafer level package (WLP).
GOMR OCS Subsea Pipelines Regulatory Perspectives. Pipeline Section, Regional Field Operations Gulf of Mexico Region Chief, Angie D.
 GOMR OCS Subsea Pipelines Regulatory Perspectives Pipeline Section, Regional Field Operations Gulf of Mexico Region Chief, Angie D. Gobert Overview Governing Regulations & Guidance Documents GOMR Pipeline