Basic spectrometer types
|
|
|
- Virginia Lang
- 5 years ago
- Views:
Transcription
1 Spectroscopy
2 Basic spectrometer types Differential-refraction-based, in which the variation of refractive index with wavelength of an optical material is used to separate the wavelengths, as in a prism spectrometer. Interference-based, in which the light is divided so a phase-delay can be imposed on a portion. When the light is re-combined, interference between the two components is at different phases depending on the wavelength, allowing extraction of spectral information. The most widely used examples are diffraction grating, Fabry-Perot, and Fourier spectrometers. Heterodyne spectroscopy also falls into this category, but we will delay discussing it until we reach the submillimeter Bolometrically, in which the number of charge carriers generated when a photon is absorbed in the detector, or the energy of that photon, are sensed. These methods are widely applied in the X-ray.
3 Data Cubes In addition to spectral information, most spectrometers also provide at least some information about the distribution of the light on the sky. Where a full image can be obtained along with the spectral data for each point in the image, we imagine a three dimensional space called a data cube, with spectra running in the z direction and such that any slice in an x,y place produces an image of the source at a specific color. The ability of spectrometers to produce data cubes varies. Simple grating or prism spectrometers usually use a slit to avoid overlap of the dispersed beam sections and therefore only provide spatial information in one direction, that is they produce the x,z part of the data cube directly. To some extent this shortcoming can be mitigated with an image slicer or integral field unit (IFU) that rearranges the image of the source so part of it in the direction perpendicular to the slit can enter the spectrometer and be dispersed.
4 (2) ) ( C B C B A n The simplest type of spectrometer is based on a prism. Just apply Snell s Law with a varying index of refraction to get dispersion. To get good optical performance requires the symmetric arrangement above.
5 Here is how a prism spectrometer might look. Why all the optics?
6 Consider the two lenses separately. The second one is the camera it works just like a camera! camera
 onto the detector array (to right).")
7 The first one is the collimator. collimator camera Together they just reimage the telescope focal plane (to left) onto the detector array (to right). The focal lengths of the lenses determine the scale of the image, input compared with output.
8 To prevent mixing spatial and spectral information, we need to put a field stop at the telescope focal plane that limits the field of view along the direction of the dispersion. Since it is narrow, it is called a slit.
9 What determines the spectral resolution? A B If the used diameter on the camera lens is small, then the spectrum is imaged to a short length at the focal plane of the camera (heavy black line) and the spectral resolution is low.
10 If the used diameter on the camera lens is large, then the spectrum is imaged to a larger length at the focal plane of the camera (heavy black line) and the spectral resolution is higher. What determines the spectral resolution? A B
11 Here is another version of the same concept:
12 If the used diameter on the camera lens is large, then the spectrum is imaged to a larger length at the focal plane of the camera (heavy black line) and the spectral resolution is higher. What determines the spectral resolution? A We can increase the used diameter by adjusting the optical design or by selecting a more dispersive material for the prism So the larger the used diameter of the camera lens, the higher the spectral resolution B
13 Increasing the diameter of the collimated beam tends to increase the used diameter of the camera lens. We can also improve the resolution by narrowing the slit.
14 What else can we do to increase the spectral resolution??
15 Nothing!!!!

16 Prism spectrometers are not very adaptable in design because we have to settle for the dispersive characteristics of transparent optical materials. More options are available if we use a diffraction grating in place of a prism. Here is such a spectrometer. Except for the grating, it is hardly changed!
17 How a grating works. Consider a series of slits illuminated by parallel light. The interference pattern that results will have an envelope due to the diffraction pattern of a slit, and within it will have constructive interference peaks at orders 0, 1, 2, etc. corresponding to 0, 1, 2 etc. wavelengths of retardation
18 (3) sin sin d i d p (6) sin sin sin sin 2) / ( sin 2) / ( sin ) ( d d N a N a AA I (7) sin sin sin ) ( w w I a I slit More mathematically (additional details in the book), the path difference between successive slits is leading to the interference pattern between slits of within the envelope of the diffraction of a single slit:
19 Diffraction Gratings To use this effect as a spectrometer, we want >> 0, that is we want to work at an order > 0. See equation (6) if = 0, the dependence disappears. But from equation (7), as grows, the intensity drops. To solve this problem, we replace the slits with a bunch of little tilted mirrors, all arranged parallel to each other. We now have a diffraction grating! Equation (3) becomes m d(sin sin ) (8) where we have substituted m for p, and m is the order. This is the famous grating equation!

20 Here is a real grating operated in different orders. Note also the polarization dependence.
21 Here is the entire optical system (schematically). We need to separate the orders, for example with a filter. The arrangement works best with the grating at a pupil. The spectral resolution is (see book for derivation), with the slit width: R D 1 (sin sin ) D cos (12)
22 At extreme illumination angles, anamorphic magnification lets the camera beam be significantly larger than the collimated beam.
23 This remains simple, just as we found for the prism spectrograph. For example, The resolution: 1.) goes inversely as the size of the telescope (assuming equal projected slit width); 2.) increases with increasing tilt of the grating; 3.) goes inversely as the field projected onto the sky, i.e., the slit width; and 4.) goes in proportion to the diameter of the beam delivered to the camera. In exchange for our designer disperser we have to separate its orders.

24 In addition, we have to learn how to make a grating. Here is an article by a very determined amateur on how to do so: But maybe it would be smarter just to order one from Richardson Labs. If so, you will probably get a replica cast from a grating that was actually ruled. Master gratings can also be manufactured holographically. In this case, an interference pattern is projected onto a light sensitive coating on the grating substrate. After exposure, this coating is developed to remove the unexposed regions, leaving a series of grooves. Because there is no mechanical removal of material, holographic gratings have low levels of scattering. However, it is difficult to blaze them as effectively as for ruled gratings and consequently they generally have lower efficiency.


25 Historic ruled gratings (used by Herzberg)

26 A modern ruled grating

27 A simple holographic grating made by exposing a periodic pattern on a photoresist and then using chemical methods to develop the resulting grooves:

28 Shimadzu process to blaze a holographic grating
29 Volume phase gratings use holographic techniques to produce a periodic variation of the index of refraction in the bulk of a transparent material. If these fringes are perpendicular to the surface, the VPG acts as a transmission grating. A VPG can have high efficiency and be packaged between glass plates to make it rugged.
30 VPH gratings have high efficiency, but relatively narrow spectral range (from TNG, Telescopio Nationale Galileo) Table 1: The main characteristics of the new VPH grisms installed on TNG. V390 V486 V510 V589 V656 V860 VHRV VHRR VHRI O HeII 4670 H? 4861 OIII 5007 Mg5200 Na D 5890 Ha 6563 Ca 8600 / / / gr/mm Eff. Lmed Lmin Lmax Rs

31 Sometimes it is useful to have a way to disperse light without deflecting it. This can be done with a grism the deflection of the prism is countered by that of the grating. Placing a grism at the pupil in a suitably designed camera (and a slit in the focal plane) produces a spectrometer, albeit of modest spectral resolution.
32 Echelle gratings are another useful variant. They operate at high incidence angle and high order (50 100). They are commonly used in high spectral resolution instruments, and usually with some kind of cross disperser to get more than one order on the detector at a time.
33 (a) Ebert-Fastie (b) Czery-Turner (c) Littrow (d) Rowland Circle
34 Top: simple spectrometer Bottom: GMOS optical train (Gemini Multi-Object Spectrograph)

35 GMOS on Gemini
36 What s Inside the Box

37 1 5mm, 3 arcmin FOV, 6.5-m telescope

38 What it looks like:
39 This one is not so simple because it has to reimage to get the right scale for its multi-aperture unit.

40 NIRSpec reimaged focal plane
, corrected for all major")
41 And it uses all-reflective optics: the basic optical unit is a threemirror anastigmat (TMA), corrected for all major aberrations.
 blocks the light, off axis it can work.")
42 Here is the basic idea behind a TMA. Light comes from the left to a folded three-mirror telescope as we showed when discussing telescopes. The image is formed to the right. Although the full symmetric version (top) blocks the light, off axis it can work. Recall that these designs can correct all the low order aberrations over a reasonably wide field.


43 This instrument features multi-apertures via microshutters Coated with a magnetic film, each microshutter has an electrode on the shutter surface as well as on the back wall. A magnet is swept across the array, pulling each shutter toward the magnet. When the shutter is opened, a voltage potential is applied between the surface of the shutter and the back wall. This potential difference holds the shutter in the open position once the magnet has passed. Once all the shutters are placed in the open (or latched) position, the voltage potentials can be selectively removed from the shutters that need to be closed.
44 Grating Spectrometer Warts Grating spectrographs are subject to all the standard aberrations: spherical, coma, astigmatism. In many cases, slight degradations of the images are hidden because of the relatively large pixels and the effects of the slit and spectral dispersion. Distortion, however, is critical. The extreme f/numbers required for good matching of the pixels of the detector to the projected slit can result in a substantial level of distortion. Distortion must be corrected very carefully in data reduction. A key step in the analysis of spectroscopic data is to conduct a fit to the apparent wavelengths of lines from a calibration source and to correct the spectra for the indicated errors in the wavelength scale.
45 Ghosts There can also be optical issues associated directly with the grating. Periodic errors in the groove spacing produce spurious lines offset from the real one and that are called ghosts. Rowland ghosts result from large-scale periodic errors, on the scales of millimeters. They are located symmetrically around the real line, spaced from it according to the period of the error and with intensity that increases with the amplitude of the error. Lyman ghosts are farther from the real line and result from periodic errors on smaller scales, just a few times the groove spacing. Satellite lines are close to the real one and arise from a small number of randomly misplaced grooves The relative intensity of some forms of ghosts grows fairly rapidly with increasing order of the real line, so although they are unimportant in low-order instruments they may be significant with high-order echelle gratings.
46

47 Here is a ghost with a volume phase holographic gratinsg
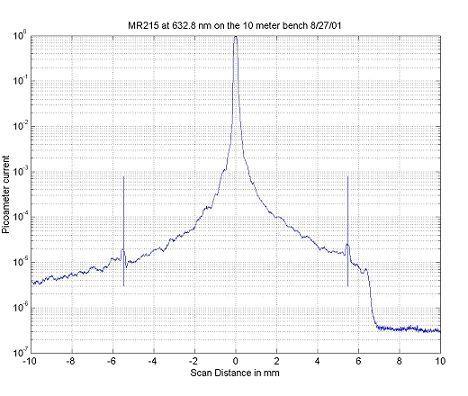
48 Scattered Light Spectrometers are also subject to scattered light. Unlike imagers, where the twodimensional character of the data allows removing scattered light as a natural process during data reduction, spectrometers are basically one-dimensional instruments and it can persist into the final reduced spectra and be difficult to identify. A spectrograph with significant scattered light in its spectra can give erroneous readings for fundamental properties such as equivalent widths of spectral lines; the scattered light will be removed from the lines and spread into a pseudocontinuum. Scattered light can be measured by putting a filter into the beam that blocks all light short (or long) of some wavelength and then measuring any residual spectrum in the blocked range.
49
50

51
52
53

54
55

56 Fiber Fed Spectrometers Fibers are an efficient way to transmit optical and near infrared light (at least to H-band) over many-meter-distances. Total internal reflection results from the appropriate choice of materials with indices of refraction n 1 and n 2 :
57

58 The Hectospec fiber positioner on the MMT. There are 300 fibers, positioned sequentially by two robots.
59

60 Schematic diagrams of three types of IFU:

61

62 MIRI (JWST) all-reflective IFU

63 MIRI Image Slicer
64
65 Processing spectrometer data Carry out standard image reduction steps Dark and flatfield frames require extra attention because of 1.) the low signal levels; and 2.) the effects of the slit Assuming you have dithered the image along the slit, difference the images at two dither positions Removes sky, dark current (but still need dark for flatfield) Combine the two spectra

66

67
68 Trace the spectrum to allow fitting any distortions in its shape along the dispersion direction Extract it, and extract similar signals along sky ; if necessary, subtract sky from the spectrum (if the first differencing worked well this may not be needed) Apply the flatfield frame (after subtracting the dark) Put the reference star spectrum through the same steps Divide the target spectrum by the reference star spectrum Do a wavelength fit to a calibration lamp exposure (or in the NIR, the OH lines from the sky) Use the fit to adjust the wavelengths in the observed spectrum Multiply by a template spectrum of the reference star
69

70
71 If the slit and instrument transmission functions are well-known, the resulting spectrum can be used for line ratios (where all the relevant lines appear in a single spectrum) Often, though, we want to flux calibrate the spectrum. Rough values can be obtained with care using the spectrometer as if it did photometry However, slit losses are usually variable It can be better to obtain an image and use it to normalize synthetic photometry obtained from the spectrum This approach can be critical to getting calibrated results on an extended object.

72 Fabry Perot Spectrometers The Fabry Perot spectrometer obtains spectral information by dividing the photons into two beams using partially reflecting mirrors, delaying one of these beams relative to the other, and then bringing them together to interfere. This device is based on two parallel plane plates with reflecting surfaces. At the surface to the right, a portion of the input beam is transmitted and a portion reflected, and the reflected portion is again partially transmitted and reflected at the left surface. However, interference modifies this simple picture. If the spacing, l, causes a 180 o phase shift between the incoming ray and R 1, then there will be no light escaping to the left. Under this condition, the phase shift at T 2 will be 360 o and the interference at T 2 will be constructive, so the light will escape there. As the spacing between the surfaces is changed, the amount of light escaping to the right will be changed as varying amounts of constructive interference occur at the right side reflective surface.

73 Now consider the reflection and transmission between two such surfaces. The amplitude for the emerging light is the sum of the contributions of each emerging ray: where is the phase difference imposed by the reflections, where n is the refractive index of the material between the reflecting surfaces. (17)... ' ' ' ' i i i i e r att e r att e r att att Ae (18) cos 4 d n We get the emerging intensity (see notes): R = r 2 is the reflected intensity. (20) cos 2 sin ) ( sin ) (1 4 1 cos 2 1 ) (1 ) ( 1 ) ( dn R R I r r I r r r I r e e r r a I i i out
74 Equation (20) shows that I out has maxima when m 2d ncos (21) where m is the order. It is also apparent that the these maxima are narrower in spectral range the closer R is to 1 (the closer the reflectivity of the surfaces is to being complete). The finesse of the device is R 1 R (22) (valid for R > 0.5). The spectral resolution to full width at half power of the transmission profile is R res m (23) and the free spectral range between transmission orders is the finesse times.
75 Transfer functions for plate reflectivities of 0.1, 0.42, 0.75, and 0.91; high reflectivities increase the finesse of the interferometer
76 Much of the performance of a Fabry Perot depends on the flatness of the plates and the quality of the coatings on them. Because of the many reflections, the plates need to be very flat. It is difficult to make coatings that have flat, high reflection over more than an octave of the spectrum. The tunable filter for JWST had a creative solution with plates that work from about 1.5 to 2.8, and then from 3.2 to about 4.6mm. However, technical problems killed this instrument.

77 A perfectly aligned Fabry Perot makes a bulls eye of alternating constructive and destructive interference, resulting in transmission and blocking of light.
78 If we place a detector at the center of the bulls eye and scan the distance between the plates, the fringes move from the center outward (or inward) and the wavelengths of maximum transmission scan along the spectrum. The scanning can be by moving one plate relative to another, or (for a solid FP), by tilting. It most be done very precisely to maintain parallelism.

79 As the finesse is increased, e.g. by using high reflectivity plate coatings, the Fabry Perot fringes become sharper
80 The transmission bands can be made sharper and particularly the blocking between them can be made stronger by multiple passes. These figures show the effect of a single pass and three passes. To the left, finesse = 50; to the right, finesse = 500.
81 To eliminate unwanted orders, it is common to use two Fabry Perot interferometers in tandem

82 This is what a Fabry Perot looks like:
83 Layout of the Fabry Perot spectrometer for SALT This instrument provides imaging spectroscopy over a 3 field and at spectral resolution from 2500 to 250,000.

84 As we go to longer wavelengths, the scale of a high resolution grating spectrometer goes as the wavelength. Here is TEXES, R = 100,000 at 10 microns.
85 It is based on an extreme angle echelle grating, 36 inches long.
 0.03 inch groove height 84.")
86 Here are some of the grading specifications: 0.3 inch groove spacing (0.131 grooves / mm) 0.03 inch groove height 84.3 degree angle of incidence
 An alternative to")
87 This technology is clearly not going to scale well to 100 microns, or even worse to 1mm! (Remember that the throughput must go up with the wavelength as well as the grating length, so grating width and the diameter of the optics also must scale) An alternative to get high resolution is a Fabry Perot with plate reflectivity close to 1 (high finesse).

88 Here is a sub- and mm-wave spectrometer that uses a Fabry Perot for high resolution and a grating to separate its orders. FIBRE is being built for use on SOFIA. It provides spectral resolution of about 1200 within a cube about 8 inches on a side. The same resolution would require a huge grating spectrometer.

89 Interference filters are basically stacks of solid Fabry Perot spectrometers. Each one is called a cavity.

90 Stacking cavities gives a high level of blocking and sharp onsets of the transmission band.
91 Filter wavelengths change with tilt (and weakly with temperature). n o is the refractive index outside the filter and n e is the effective index in the filter.
92

93 The relation between the transform and the spectrum is not intuitively obvious.
94 Because the scan must be stopped at some path length, the spectral lines (after transformation) have feet. They can be suppressed by apodizing the transform, systematically reducing its high frequencies. The compromise is that the spectral resolution is reduced.

95 The SPIRE imaging Fourier Transform Spectrometer

96 The SPIRE imaging Fourier Transform Spectrometer
97 Spectroscopy and Adaptive Optics from good to bad.
98 Atmospheric Seeing... the Air through which we look upon the Stars, is in a perpetual Tremor... all these illuminated Points [from different portions of the telescope] constitute one broad lucid Point, composed of these many trembling Points confusedly and insensibly mixed with one another by very short and swift Tremors and thereby cause the Star to appear broader than it is, and without any trembling of the whole. Long telescopes may cause Objects to appear brighter and larger than short ones can do, but they cannot be so formed to take away the confusion of Rays which arises from the Tremors of the Atmosphere. The only remedy is a most serene and quiet Air, such as may perhaps be found on the tops of the highest Mountains above the grosser Clouds. Isaac Newton

99 Seeing results from turbulence in the atmosphere plus the dependence of the index of refraction of air on pressure and temperature:

100 On a large telescope, the image is complex. The envelope has a diameter of /r 0 - the diffraction limit for a telescope of aperture r 0. Within that envelope there are complex interference patterns with structures down to the diffraction limit of the telescope, /D. Given typical high-level wind velocities, the pattern changes on a time scale of 10 msec.
101 Two simple ways to get diffraction limited information out of this image: Speckle interferometry Take many images with exposures of < 10 ms Look at the structure of the image in terms of spatial frequencies For example, compute Fourier transforms and power spectra The differing structures of sources will appear in spatial frequency behavior Problems: short exposures are not good for faint sources, complex sources may give ambiguous results Lucky imaging Take many images with exposures of < 10 ms Use a computer to sort through them and pick the very best Add them to improve signal to noise This in principle gives something approximating a true image of the source Problems: short exposures again, also very inefficient Both of these techniques rely on after-the-fact processing and are not useful for applications such as concentrating the light onto the slit of a spectrometer

102 Adaptive Optics Compensate for turbulence in real time Simplest form uses a natural guide (reference) star to determine the wavefront errors induced by the atmosphere A deformable mirror is controlled by wavefront control electronics so its shape compensates for these errors This only works if the target is close to the reference star, within the isoplanatic angle How close? Define the fiducial wavefront error to be one radian (/2) The Marechal criterion gives the Strehl as a function of wavefront error: S is therefore 1/e at one radian wavefront error

103 It is no longer possible to correct the wavefront errors when the path of the light from the reference star does not overlap sufficiently with the path from the target This gives us a simple relation with h = 5km and r 0 = 10cm, 0 ~ 1.3 arcsec (!!!) (in the visible) However, r 0 6/5, so there is hope in the infrared Still, one has to compensate the wavefront on a scale of r 0 over the entire telescope aperture and do it on a timescale of 1 msec
104 A natural guide star (NGS) AO system and the image it can produce The correction is centered on one layer of the atmosphere, described as the deformable mirror being conjugated to that layer. AO can allow much narrower slits in a spectrometer Higher resolution Smaller size
105 End of Spectroscopy
Basic spectrometer types
 Spectroscopy Basic spectrometer types Differential-refraction-based, in which the variation of refractive index with wavelength of an optical material is used to separate the wavelengths, as in a prism
Observational Astronomy
 Observational Astronomy Instruments The telescope- instruments combination forms a tightly coupled system: Telescope = collecting photons and forming an image Instruments = registering and analyzing the
UV/Optical/IR Astronomy Part 2: Spectroscopy
 UV/Optical/IR Astronomy Part 2: Spectroscopy Introduction We now turn to spectroscopy. Much of what you need to know about this is the same as for imaging I ll concentrate on the differences. Slicing the
instruments Solar Physics course lecture 3 May 4, 2010 Frans Snik BBL 415 (710)
") Solar Physics course lecture 3 May 4, 2010 Frans Snik BBL 415 (710) f.snik@astro.uu.nl www.astro.uu.nl/~snik info from photons spatial (x,y) temporal (t) spectral (λ) polarization ( ) usually photon starved
Solar Physics course lecture 3 May 4, 2010 Frans Snik BBL 415 (710) f.snik@astro.uu.nl www.astro.uu.nl/~snik info from photons spatial (x,y) temporal (t) spectral (λ) polarization ( ) usually photon starved
Astr 535 Class Notes Fall
 Astr 535 Class Notes Fall 2017 86 4. Observing logs: summary program informtion, weather information, calibration data, seeing information, exposure information. COMMENTS are critical. READABILITY is critical
DESIGN NOTE: DIFFRACTION EFFECTS
 NASA IRTF / UNIVERSITY OF HAWAII Document #: TMP-1.3.4.2-00-X.doc Template created on: 15 March 2009 Last Modified on: 5 April 2010 DESIGN NOTE: DIFFRACTION EFFECTS Original Author: John Rayner NASA Infrared
An integral eld spectrograph for the 4-m European Solar Telescope
 Mem. S.A.It. Vol. 84, 416 c SAIt 2013 Memorie della An integral eld spectrograph for the 4-m European Solar Telescope A. Calcines 1,2, M. Collados 1,2, and R. L. López 1 1 Instituto de Astrofísica de Canarias
Spectroscopic Instrumentation
 Spectroscopic Instrumentation Theodor Pribulla Astronomical Institute of the Slovak Academy of Sciences, Tatranská Lomnica, Slovakia Spectroscopic workshop, February 6-10, 2017, PřF MU, Brno Principal
Big League Cryogenics and Vacuum The LHC at CERN
 Big League Cryogenics and Vacuum The LHC at CERN A typical astronomical instrument must maintain about one cubic meter at a pressure of
GPI INSTRUMENT PAGES
 GPI INSTRUMENT PAGES This document presents a snapshot of the GPI Instrument web pages as of the date of the call for letters of intent. Please consult the GPI web pages themselves for up to the minute
Diffraction. Interference with more than 2 beams. Diffraction gratings. Diffraction by an aperture. Diffraction of a laser beam
 Diffraction Interference with more than 2 beams 3, 4, 5 beams Large number of beams Diffraction gratings Equation Uses Diffraction by an aperture Huygen s principle again, Fresnel zones, Arago s spot Qualitative
Astro 500 A500/L-20 1
 Astro 500 1 Lecture Outline Spectroscopy from a 3D Perspective ü Basics of spectroscopy and spectrographs ü Fundamental challenges of sampling the data cube Approaches and example of available instruments
Gemini 8m Telescopes Instrument Science Requirements. R. McGonegal Controls Group. January 27, 1996
 GEMINI 8-M Telescopes Project Gemini 8m Telescopes Instrument Science Requirements R. McGonegal Controls Group January 27, 1996 GEMINI PROJECT OFFICE 950 N. Cherry Ave. Tucson, Arizona 85719 Phone: (520)
GMT Instruments and AO. GMT Science Meeting - March
 GMT Instruments and AO GMT Science Meeting - March 2008 1 Instrument Status Scientific priorities have been defined Emphasis on: Wide-field survey science (cosmology) High resolution spectroscopy (abundances,
1.6 Beam Wander vs. Image Jitter
 8 Chapter 1 1.6 Beam Wander vs. Image Jitter It is common at this point to look at beam wander and image jitter and ask what differentiates them. Consider a cooperative optical communication system that
Applications of Optics
 Nicholas J. Giordano www.cengage.com/physics/giordano Chapter 26 Applications of Optics Marilyn Akins, PhD Broome Community College Applications of Optics Many devices are based on the principles of optics
Introduction to the operating principles of the HyperFine spectrometer
 Introduction to the operating principles of the HyperFine spectrometer LightMachinery Inc., 80 Colonnade Road North, Ottawa ON Canada A spectrometer is an optical instrument designed to split light into
Physics 308 Laboratory Experiment F: Grating Spectrometer
 3/7/09 Physics 308 Laboratory Experiment F: Grating Spectrometer Motivation: Diffraction grating spectrometers are the single most widely used spectroscopic instrument. They are incorporated into many
Improving the Collection Efficiency of Raman Scattering
 PERFORMANCE Unparalleled signal-to-noise ratio with diffraction-limited spectral and imaging resolution Deep-cooled CCD with excelon sensor technology Aberration-free optical design for uniform high resolution
Chapter Ray and Wave Optics
 109 Chapter Ray and Wave Optics 1. An astronomical telescope has a large aperture to [2002] reduce spherical aberration have high resolution increase span of observation have low dispersion. 2. If two
Performance Comparison of Spectrometers Featuring On-Axis and Off-Axis Grating Rotation
 Performance Comparison of Spectrometers Featuring On-Axis and Off-Axis Rotation By: Michael Case and Roy Grayzel, Acton Research Corporation Introduction The majority of modern spectrographs and scanning
PHYS 202 OUTLINE FOR PART III LIGHT & OPTICS
 PHYS 202 OUTLINE FOR PART III LIGHT & OPTICS Electromagnetic Waves A. Electromagnetic waves S-23,24 1. speed of waves = 1/( o o ) ½ = 3 x 10 8 m/s = c 2. waves and frequency: the spectrum (a) radio red
Chapter 34 The Wave Nature of Light; Interference. Copyright 2009 Pearson Education, Inc.
 Chapter 34 The Wave Nature of Light; Interference 34-7 Luminous Intensity The intensity of light as perceived depends not only on the actual intensity but also on the sensitivity of the eye at different
Reflectors vs. Refractors
 1 Telescope Types - Telescopes collect and concentrate light (which can then be magnified, dispersed as a spectrum, etc). - In the end it is the collecting area that counts. - There are two primary telescope
a simple optical imager
 Imagers and Imaging a simple optical imager Here s one on our 61-Inch Telescope Here s one on our 61-Inch Telescope filter wheel in here dewar preamplifier However, to get a large field we cannot afford
Cascaded holographic spectrographs for astronomical applications
 Cascaded holographic spectrographs for astronomical applications advanced modelling and experimental proof Eduard Muslimov Postdoc, group RnD, LAM RnD seminars, September 28 th 2017 Outline of the talk
Physics 431 Final Exam Examples (3:00-5:00 pm 12/16/2009) TIME ALLOTTED: 120 MINUTES Name: Signature:
 TIME ALLOTTED: 120 MINUTES Name: Signature:") Physics 431 Final Exam Examples (3:00-5:00 pm 12/16/2009) TIME ALLOTTED: 120 MINUTES Name: PID: Signature: CLOSED BOOK. TWO 8 1/2 X 11 SHEET OF NOTES (double sided is allowed), AND SCIENTIFIC POCKET CALCULATOR
Physics 431 Final Exam Examples (3:00-5:00 pm 12/16/2009) TIME ALLOTTED: 120 MINUTES Name: PID: Signature: CLOSED BOOK. TWO 8 1/2 X 11 SHEET OF NOTES (double sided is allowed), AND SCIENTIFIC POCKET CALCULATOR
SOAR Integral Field Spectrograph (SIFS): Call for Science Verification Proposals
: Call for Science Verification Proposals") Published on SOAR (http://www.ctio.noao.edu/soar) Home > SOAR Integral Field Spectrograph (SIFS): Call for Science Verification Proposals SOAR Integral Field Spectrograph (SIFS): Call for Science Verification
Published on SOAR (http://www.ctio.noao.edu/soar) Home > SOAR Integral Field Spectrograph (SIFS): Call for Science Verification Proposals SOAR Integral Field Spectrograph (SIFS): Call for Science Verification
ECEN. Spectroscopy. Lab 8. copy. constituents HOMEWORK PR. Figure. 1. Layout of. of the
 ECEN 4606 Lab 8 Spectroscopy SUMMARY: ROBLEM 1: Pedrotti 3 12-10. In this lab, you will design, build and test an optical spectrum analyzer and use it for both absorption and emission spectroscopy. The
Some of the important topics needed to be addressed in a successful lens design project (R.R. Shannon: The Art and Science of Optical Design)
") Lens design Some of the important topics needed to be addressed in a successful lens design project (R.R. Shannon: The Art and Science of Optical Design) Focal length (f) Field angle or field size F/number
Lens design Some of the important topics needed to be addressed in a successful lens design project (R.R. Shannon: The Art and Science of Optical Design) Focal length (f) Field angle or field size F/number
Application Note (A11)
") Application Note (A11) Slit and Aperture Selection in Spectroradiometry REVISION: C August 2013 Gooch & Housego 4632 36 th Street, Orlando, FL 32811 Tel: 1 407 422 3171 Fax: 1 407 648 5412 Email: sales@goochandhousego.com
Application Note (A11) Slit and Aperture Selection in Spectroradiometry REVISION: C August 2013 Gooch & Housego 4632 36 th Street, Orlando, FL 32811 Tel: 1 407 422 3171 Fax: 1 407 648 5412 Email: sales@goochandhousego.com
!!! DELIVERABLE!D60.2!
 www.solarnet-east.eu This project is supported by the European Commission s FP7 Capacities Programme for the period April 2013 - March 2017 under the Grant Agreement number 312495. DELIVERABLED60.2 Image
Chapter 25. Optical Instruments
 Chapter 25 Optical Instruments Optical Instruments Analysis generally involves the laws of reflection and refraction Analysis uses the procedures of geometric optics To explain certain phenomena, the wave
Guide to SPEX Optical Spectrometer
 Guide to SPEX Optical Spectrometer GENERAL DESCRIPTION A spectrometer is a device for analyzing an input light beam into its constituent wavelengths. The SPEX model 1704 spectrometer covers a range from
EE119 Introduction to Optical Engineering Spring 2002 Final Exam. Name:
 EE119 Introduction to Optical Engineering Spring 2002 Final Exam Name: SID: CLOSED BOOK. FOUR 8 1/2 X 11 SHEETS OF NOTES, AND SCIENTIFIC POCKET CALCULATOR PERMITTED. TIME ALLOTTED: 180 MINUTES Fundamental
R.B.V.R.R. WOMEN S COLLEGE (AUTONOMOUS) Narayanaguda, Hyderabad.
 Narayanaguda, Hyderabad.") R.B.V.R.R. WOMEN S COLLEGE (AUTONOMOUS) Narayanaguda, Hyderabad. DEPARTMENT OF PHYSICS QUESTION BANK FOR SEMESTER III PAPER III OPTICS UNIT I: 1. MATRIX METHODS IN PARAXIAL OPTICS 2. ABERATIONS UNIT II
R.B.V.R.R. WOMEN S COLLEGE (AUTONOMOUS) Narayanaguda, Hyderabad. DEPARTMENT OF PHYSICS QUESTION BANK FOR SEMESTER III PAPER III OPTICS UNIT I: 1. MATRIX METHODS IN PARAXIAL OPTICS 2. ABERATIONS UNIT II
Presented by Jerry Hubbell Lake of the Woods Observatory (MPC I24) President, Rappahannock Astronomy Club
 President, Rappahannock Astronomy Club") Presented by Jerry Hubbell Lake of the Woods Observatory (MPC I24) President, Rappahannock Astronomy Club ENGINEERING A FIBER-FED FED SPECTROMETER FOR ASTRONOMICAL USE Objectives Discuss the engineering
Presented by Jerry Hubbell Lake of the Woods Observatory (MPC I24) President, Rappahannock Astronomy Club ENGINEERING A FIBER-FED FED SPECTROMETER FOR ASTRONOMICAL USE Objectives Discuss the engineering
Radiometric Solar Telescope (RaST) The case for a Radiometric Solar Imager,
 The case for a Radiometric Solar Imager,") SORCE Science Meeting 29 January 2014 Mark Rast Laboratory for Atmospheric and Space Physics University of Colorado, Boulder Radiometric Solar Telescope (RaST) The case for a Radiometric Solar Imager,
SORCE Science Meeting 29 January 2014 Mark Rast Laboratory for Atmospheric and Space Physics University of Colorado, Boulder Radiometric Solar Telescope (RaST) The case for a Radiometric Solar Imager,
THE WASATCH ADVANTAGE
 THE WASATCH ADVANTAGE Increasing demand for lightweight, portable instruments, along with improvements in optical design and manufacturing technologies, is leading to the development of a new generation
Chapter 29/30. Wave Fronts and Rays. Refraction of Sound. Dispersion in a Prism. Index of Refraction. Refraction and Lenses
 Chapter 29/30 Refraction and Lenses Refraction Refraction the bending of waves as they pass from one medium into another. Caused by a change in the average speed of light. Analogy A car that drives off
Preview. Light and Reflection Section 1. Section 1 Characteristics of Light. Section 2 Flat Mirrors. Section 3 Curved Mirrors
 Light and Reflection Section 1 Preview Section 1 Characteristics of Light Section 2 Flat Mirrors Section 3 Curved Mirrors Section 4 Color and Polarization Light and Reflection Section 1 TEKS The student
Applied Optics. , Physics Department (Room #36-401) , ,
 , ,") Applied Optics Professor, Physics Department (Room #36-401) 2290-0923, 019-539-0923, shsong@hanyang.ac.kr Office Hours Mondays 15:00-16:30, Wednesdays 15:00-16:30 TA (Ph.D. student, Room #36-415) 2290-0921,
Applied Optics Professor, Physics Department (Room #36-401) 2290-0923, 019-539-0923, shsong@hanyang.ac.kr Office Hours Mondays 15:00-16:30, Wednesdays 15:00-16:30 TA (Ph.D. student, Room #36-415) 2290-0921,
A novel tunable diode laser using volume holographic gratings
 A novel tunable diode laser using volume holographic gratings Christophe Moser *, Lawrence Ho and Frank Havermeyer Ondax, Inc. 85 E. Duarte Road, Monrovia, CA 9116, USA ABSTRACT We have developed a self-aligned
Southern African Large Telescope. Prime Focus Imaging Spectrograph. Instrument Acceptance Testing Plan
 Southern African Large Telescope Prime Focus Imaging Spectrograph Instrument Acceptance Testing Plan Eric B. Burgh University of Wisconsin Document Number: SALT-3160AP0003 Revision 2.2 29 April 2004 1
EE119 Introduction to Optical Engineering Fall 2009 Final Exam. Name:
 EE119 Introduction to Optical Engineering Fall 2009 Final Exam Name: SID: CLOSED BOOK. THREE 8 1/2 X 11 SHEETS OF NOTES, AND SCIENTIFIC POCKET CALCULATOR PERMITTED. TIME ALLOTTED: 180 MINUTES Fundamental
Performance Factors. Technical Assistance. Fundamental Optics
 Performance Factors After paraxial formulas have been used to select values for component focal length(s) and diameter(s), the final step is to select actual lenses. As in any engineering problem, this
Two Fundamental Properties of a Telescope
 Two Fundamental Properties of a Telescope 1. Angular Resolution smallest angle which can be seen = 1.22 / D 2. Light-Collecting Area The telescope is a photon bucket A = (D/2)2 D A Parts of the Human Eye
Chemistry Instrumental Analysis Lecture 7. Chem 4631
 Chemistry 4631 Instrumental Analysis Lecture 7 UV to IR Components of Optical Basic components of spectroscopic instruments: stable source of radiant energy transparent container to hold sample device
Order Overlap. A single wavelength constructively interferes in several directions A given direction can receive multiple wavelengths.
 Order Overlap A single wavelength constructively interferes in several directions A given direction can receive multiple wavelengths. Spectral Calibration TripleSpec Users Guide Spectral Calibration TripleSpec
The predicted performance of the ACS coronagraph
 Instrument Science Report ACS 2000-04 The predicted performance of the ACS coronagraph John Krist March 30, 2000 ABSTRACT The Aberrated Beam Coronagraph (ABC) on the Advanced Camera for Surveys (ACS) has
Anti-reflection Coatings
 Spectral Dispersion Spectral resolution defined as R = Low 10-100 Medium 100-1000s High 1000s+ Broadband filters have resolutions of a few (e.g. J-band corresponds to R=4). Anti-reflection Coatings Significant
Modern Instrumental Methods of Analysis Prof. Dr. J.R. Mudakavi Department of Chemical Engineering Indian Institute of Science, Bangalore
 Modern Instrumental Methods of Analysis Prof. Dr. J.R. Mudakavi Department of Chemical Engineering Indian Institute of Science, Bangalore Module No. # 02 Lecture No. # 08 Ultraviolet and Visible Spectrophotometry
Chapters 1 & 2. Definitions and applications Conceptual basis of photogrammetric processing
 Chapters 1 & 2 Chapter 1: Photogrammetry Definitions and applications Conceptual basis of photogrammetric processing Transition from two-dimensional imagery to three-dimensional information Automation
Better Imaging with a Schmidt-Czerny-Turner Spectrograph
 Better Imaging with a Schmidt-Czerny-Turner Spectrograph Abstract For years, images have been measured using Czerny-Turner (CT) design dispersive spectrographs. Optical aberrations inherent in the CT design
Imaging Systems Laboratory II. Laboratory 8: The Michelson Interferometer / Diffraction April 30 & May 02, 2002
 1051-232 Imaging Systems Laboratory II Laboratory 8: The Michelson Interferometer / Diffraction April 30 & May 02, 2002 Abstract. In the last lab, you saw that coherent light from two different locations
PHYS 3153 Methods of Experimental Physics II O2. Applications of Interferometry
 Purpose PHYS 3153 Methods of Experimental Physics II O2. Applications of Interferometry In this experiment, you will study the principles and applications of interferometry. Equipment and components PASCO
Will contain image distance after raytrace Will contain image height after raytrace
 Name: LASR 51 Final Exam May 29, 2002 Answer all questions. Module numbers are for guidance, some material is from class handouts. Exam ends at 8:20 pm. Ynu Raytracing The first questions refer to the
Exoplanet transit, eclipse, and phase curve observations with JWST NIRCam. Tom Greene & John Stansberry JWST NIRCam transit meeting March 12, 2014
 Exoplanet transit, eclipse, and phase curve observations with JWST NIRCam Tom Greene & John Stansberry JWST NIRCam transit meeting March 12, 2014 1 Scope of Talk NIRCam overview Suggested transit modes
Chemistry 524--"Hour Exam"--Keiderling Mar. 19, pm SES
 Chemistry 524--"Hour Exam"--Keiderling Mar. 19, 2013 -- 2-4 pm -- 170 SES Please answer all questions in the answer book provided. Calculators, rulers, pens and pencils permitted. No open books allowed.
Lithography. 3 rd. lecture: introduction. Prof. Yosi Shacham-Diamand. Fall 2004
 Lithography 3 rd lecture: introduction Prof. Yosi Shacham-Diamand Fall 2004 1 List of content Fundamental principles Characteristics parameters Exposure systems 2 Fundamental principles Aerial Image Exposure
High Contrast Imaging
 High Contrast Imaging Suppressing diffraction (rings and other patterns) Doing this without losing light Suppressing scattered light Doing THIS without losing light Diffraction rings arise from the abrupt
ECEN 4606, UNDERGRADUATE OPTICS LAB
 ECEN 4606, UNDERGRADUATE OPTICS LAB Lab 2: Imaging 1 the Telescope Original Version: Prof. McLeod SUMMARY: In this lab you will become familiar with the use of one or more lenses to create images of distant
Physics 3340 Spring Fourier Optics
 Physics 3340 Spring 011 Purpose Fourier Optics In this experiment we will show how the Fraunhofer diffraction pattern or spatial Fourier transform of an object can be observed within an optical system.
Section 1: Sound. Sound and Light Section 1
 Sound and Light Section 1 Section 1: Sound Preview Key Ideas Bellringer Properties of Sound Sound Intensity and Decibel Level Musical Instruments Hearing and the Ear The Ear Ultrasound and Sonar Sound
Improved Spectra with a Schmidt-Czerny-Turner Spectrograph
 Improved Spectra with a Schmidt-Czerny-Turner Spectrograph Abstract For years spectra have been measured using traditional Czerny-Turner (CT) design dispersive spectrographs. Optical aberrations inherent
Optical Components for Laser Applications. Günter Toesko - Laserseminar BLZ im Dezember
 Günter Toesko - Laserseminar BLZ im Dezember 2009 1 Aberrations An optical aberration is a distortion in the image formed by an optical system compared to the original. It can arise for a number of reasons
Binocular and Scope Performance 57. Diffraction Effects
 Binocular and Scope Performance 57 Diffraction Effects The resolving power of a perfect optical system is determined by diffraction that results from the wave nature of light. An infinitely distant point
EE119 Introduction to Optical Engineering Spring 2003 Final Exam. Name:
 EE119 Introduction to Optical Engineering Spring 2003 Final Exam Name: SID: CLOSED BOOK. THREE 8 1/2 X 11 SHEETS OF NOTES, AND SCIENTIFIC POCKET CALCULATOR PERMITTED. TIME ALLOTTED: 180 MINUTES Fundamental
Conceptual design for the High Resolution Optical Spectrograph on the Thirty-Meter Telescope: a new concept for a ground-based highresolution
 Conceptual design for the High Resolution Optical Spectrograph on the Thirty-Meter Telescope: a new concept for a ground-based highresolution optical spectrograph Cynthia Froning *a, Steven Osterman a,
Low aberration monolithic diffraction gratings for high performance optical spectrometers
 Low aberration monolithic diffraction gratings for high performance optical spectrometers Peter Triebel, Tobias Moeller, Torsten Diehl; Carl Zeiss Spectroscopy GmbH (Germany) Alexandre Gatto, Alexander
Chapter 17: Wave Optics. What is Light? The Models of Light 1/11/13
 Chapter 17: Wave Optics Key Terms Wave model Ray model Diffraction Refraction Fringe spacing Diffraction grating Thin-film interference What is Light? Light is the chameleon of the physical world. Under
Photonics and Optical Communication
 Photonics and Optical Communication (Course Number 300352) Spring 2007 Dr. Dietmar Knipp Assistant Professor of Electrical Engineering http://www.faculty.iu-bremen.de/dknipp/ 1 Photonics and Optical Communication
Spectroscopy in the UV and Visible: Instrumentation. Spectroscopy in the UV and Visible: Instrumentation
 Spectroscopy in the UV and Visible: Instrumentation Typical UV-VIS instrument 1 Source - Disperser Sample (Blank) Detector Readout Monitor the relative response of the sample signal to the blank Transmittance
Lecture 2: Geometrical Optics. Geometrical Approximation. Lenses. Mirrors. Optical Systems. Images and Pupils. Aberrations.
 Lecture 2: Geometrical Optics Outline 1 Geometrical Approximation 2 Lenses 3 Mirrors 4 Optical Systems 5 Images and Pupils 6 Aberrations Christoph U. Keller, Leiden Observatory, keller@strw.leidenuniv.nl
Computer Generated Holograms for Optical Testing
 Computer Generated Holograms for Optical Testing Dr. Jim Burge Associate Professor Optical Sciences and Astronomy University of Arizona jburge@optics.arizona.edu 520-621-8182 Computer Generated Holograms
OPTICS DIVISION B. School/#: Names:
 OPTICS DIVISION B School/#: Names: Directions: Fill in your response for each question in the space provided. All questions are worth two points. Multiple Choice (2 points each question) 1. Which of the
Testing Aspherics Using Two-Wavelength Holography
 Reprinted from APPLIED OPTICS. Vol. 10, page 2113, September 1971 Copyright 1971 by the Optical Society of America and reprinted by permission of the copyright owner Testing Aspherics Using Two-Wavelength
Section 1: SPECTRAL PRODUCTS
 Section 1: Optical Non-dispersive Wavelength Selection Filter Based Filter Filter Fundamentals Filter at an Incidence Angle Filters and Environmental Conditions Dispersive Instruments Grating and Polychromators
Use of Computer Generated Holograms for Testing Aspheric Optics
 Use of Computer Generated Holograms for Testing Aspheric Optics James H. Burge and James C. Wyant Optical Sciences Center, University of Arizona, Tucson, AZ 85721 http://www.optics.arizona.edu/jcwyant,
Lecture 2: Geometrical Optics. Geometrical Approximation. Lenses. Mirrors. Optical Systems. Images and Pupils. Aberrations.
 Lecture 2: Geometrical Optics Outline 1 Geometrical Approximation 2 Lenses 3 Mirrors 4 Optical Systems 5 Images and Pupils 6 Aberrations Christoph U. Keller, Leiden Observatory, keller@strw.leidenuniv.nl
BEAM HALO OBSERVATION BY CORONAGRAPH
 BEAM HALO OBSERVATION BY CORONAGRAPH T. Mitsuhashi, KEK, TSUKUBA, Japan Abstract We have developed a coronagraph for the observation of the beam halo surrounding a beam. An opaque disk is set in the beam
Scaling relations for telescopes, spectrographs, and reimaging instruments
 Scaling relations for telescopes, spectrographs, and reimaging instruments Benjamin Weiner Steward Observatory University of Arizona bjw @ asarizonaedu 19 September 2008 1 Introduction To make modern astronomical
Fundamentals of Radio Interferometry
 Fundamentals of Radio Interferometry Rick Perley, NRAO/Socorro Fourteenth NRAO Synthesis Imaging Summer School Socorro, NM Topics Why Interferometry? The Single Dish as an interferometer The Basic Interferometer
ABC Math Student Copy. N. May ABC Math Student Copy. Physics Week 13(Sem. 2) Name. Light Chapter Summary Cont d 2
 Name. Light Chapter Summary Cont d 2") Page 1 of 12 Physics Week 13(Sem. 2) Name Light Chapter Summary Cont d 2 Lens Abberation Lenses can have two types of abberation, spherical and chromic. Abberation occurs when the rays forming an image
Page 1 of 12 Physics Week 13(Sem. 2) Name Light Chapter Summary Cont d 2 Lens Abberation Lenses can have two types of abberation, spherical and chromic. Abberation occurs when the rays forming an image
Chapter 36: diffraction
 Chapter 36: diffraction Fresnel and Fraunhofer diffraction Diffraction from a single slit Intensity in the single slit pattern Multiple slits The Diffraction grating X-ray diffraction Circular apertures
Optics and Lasers. Matt Young. Including Fibers and Optical Waveguides
 Matt Young Optics and Lasers Including Fibers and Optical Waveguides Fourth Revised Edition With 188 Figures Springer-Verlag Berlin Heidelberg New York London Paris Tokyo Hong Kong Barcelona Budapest Contents
New opportunities of freeform gratings using diamond machining
 New opportunities of freeform gratings using diamond machining Dispersing elements for Astronomy: new trends and possibilities 11/10/17 Cyril Bourgenot Ariadna Calcines Ray Sharples Plan of the talk Introduction
Interference [Hecht Ch. 9]
![Interference [Hecht Ch. 9]](/thumbs/79/79365345.jpg "Interference [Hecht Ch. 9]") Interference [Hecht Ch. 9] Note: Read Ch. 3 & 7 E&M Waves and Superposition of Waves and Meet with TAs and/or Dr. Lai if necessary. General Consideration 1 2 Amplitude Splitting Interferometers If a lightwave
Interference [Hecht Ch. 9] Note: Read Ch. 3 & 7 E&M Waves and Superposition of Waves and Meet with TAs and/or Dr. Lai if necessary. General Consideration 1 2 Amplitude Splitting Interferometers If a lightwave
TSBB09 Image Sensors 2018-HT2. Image Formation Part 1
 TSBB09 Image Sensors 2018-HT2 Image Formation Part 1 Basic physics Electromagnetic radiation consists of electromagnetic waves With energy That propagate through space The waves consist of transversal
06SurfaceQuality.nb Optics James C. Wyant (2012) 1
 1") 06SurfaceQuality.nb Optics 513 - James C. Wyant (2012) 1 Surface Quality SQ-1 a) How is surface profile data obtained using the FECO interferometer? Your explanation should include diagrams with the appropriate
06SurfaceQuality.nb Optics 513 - James C. Wyant (2012) 1 Surface Quality SQ-1 a) How is surface profile data obtained using the FECO interferometer? Your explanation should include diagrams with the appropriate
arxiv: v1 [astro-ph.im] 26 Mar 2012
![arxiv: v1 [astro-ph.im] 26 Mar 2012](/thumbs/72/66395735.jpg "arxiv: v1 [astro-ph.im] 26 Mar 2012") The image slicer for the Subaru Telescope High Dispersion Spectrograph arxiv:1203.5568v1 [astro-ph.im] 26 Mar 2012 Akito Tajitsu The Subaru Telescope, National Astronomical Observatory of Japan, 650 North
The image slicer for the Subaru Telescope High Dispersion Spectrograph arxiv:1203.5568v1 [astro-ph.im] 26 Mar 2012 Akito Tajitsu The Subaru Telescope, National Astronomical Observatory of Japan, 650 North
Telescopes and their configurations. Quick review at the GO level
 Telescopes and their configurations Quick review at the GO level Refraction & Reflection Light travels slower in denser material Speed depends on wavelength Image Formation real Focal Length (f) : Distance
PHY 431 Homework Set #5 Due Nov. 20 at the start of class
 PHY 431 Homework Set #5 Due Nov. 0 at the start of class 1) Newton s rings (10%) The radius of curvature of the convex surface of a plano-convex lens is 30 cm. The lens is placed with its convex side down
LEOK-3 Optics Experiment kit
 LEOK-3 Optics Experiment kit Physical optics, geometrical optics and fourier optics Covering 26 experiments Comprehensive documents Include experiment setups, principles and procedures Cost effective solution
CHAPTER 5 FINE-TUNING OF AN ECDL WITH AN INTRACAVITY LIQUID CRYSTAL ELEMENT
 CHAPTER 5 FINE-TUNING OF AN ECDL WITH AN INTRACAVITY LIQUID CRYSTAL ELEMENT In this chapter, the experimental results for fine-tuning of the laser wavelength with an intracavity liquid crystal element
End-of-Chapter Exercises
 End-of-Chapter Exercises Exercises 1 12 are conceptual questions designed to see whether you understand the main concepts in the chapter. 1. Red laser light shines on a double slit, creating a pattern
Oriel MS260i TM 1/4 m Imaging Spectrograph
 Oriel MS260i TM 1/4 m Imaging Spectrograph MS260i Spectrograph with 3 Track Fiber on input and InstaSpec CCD on output. The MS260i 1 4 m Imaging Spectrographs are economical, fully automated, multi-grating
Department of Mechanical and Aerospace Engineering, Princeton University Department of Astrophysical Sciences, Princeton University ABSTRACT
 Phase and Amplitude Control Ability using Spatial Light Modulators and Zero Path Length Difference Michelson Interferometer Michael G. Littman, Michael Carr, Jim Leighton, Ezekiel Burke, David Spergel
Potential benefits of freeform optics for the ELT instruments. J. Kosmalski
 Potential benefits of freeform optics for the ELT instruments J. Kosmalski Freeform Days, 12-13 th October 2017 Summary Introduction to E-ELT intruments Freeform design for MAORY LGS Free form design for
Exercise 8: Interference and diffraction
 Physics 223 Name: Exercise 8: Interference and diffraction 1. In a two-slit Young s interference experiment, the aperture (the mask with the two slits) to screen distance is 2.0 m, and a red light of wavelength