Presented by Jerry Hubbell Lake of the Woods Observatory (MPC I24) President, Rappahannock Astronomy Club
|
|
|
- Brice Stokes
- 6 years ago
- Views:
Transcription

1 Presented by Jerry Hubbell Lake of the Woods Observatory (MPC I24) President, Rappahannock Astronomy Club ENGINEERING A FIBER-FED FED SPECTROMETER FOR ASTRONOMICAL USE
2 Objectives Discuss the engineering issues associated with integrating a fiber-fed spectrometer into an astronomical imaging system Describe the workings of a modern miniaturized fiberfed spectrometer Describe the fiber-optic cable interface to the astrograph Explain the engineering involved in the fiber-head optical interface to the astrograph Describe how to engineer a guiding system for the fiberhead Discuss the software and procedures to acquire, calibrate, and process the spectral data
3 Engineering Issues Several engineering issues must be addressed when coupling a fiber-fed spectrometer to an astrograph. First, how do you focus the star on the end of the fiber-optic cable? How do you know the light entering the fiber cable is collimated correctly and has the correct focal ratio? What is the Numerical Aperture (NA), and what is the proper value for your astrograph? How do you feed the light from your astrograph so that you collect data and also guide accurately to keep the light on the end of the fiber?
4 Engineering Issues What is the procedure to focus the light on a 500-micron fiber? A 200-micron fiber? What are the design requirements for aligning and sizing the elements in the fiber-optic head? How sensitive is the linear CCD used to collect data from the light spread out into a spectrum? How does the sensitivity of the CCD affect your science goals and the objects you can effectively observe? What is the limiting magnitude for the objects you can observe? How do you calibrate the spectrometer?
5 Engineering Issues How do you know that the wavelengths you want to collect are entering the spectrometer? How do you know that the guide camera is getting enough light to guide effectively? How do you measure and adjust for the linear CCD response curve? How do you measure the resolution of the resultant spectra? Etc
6 Engineering Issues As you can see, there are myriad issues when designing, building, and integrating a fiberfed spectrometer into your astrograph Each of these issues can be resolved and addressed in a methodical way


7 A New Instrument for Amateurs Professional observatories use fiber-fed spectrometers to acquire high-resolution spectra of stars and other objects. Typically, these instruments are very expensive. Generally, amateurs who get into spectroscopy use a simple transmission grating mounted in a filter holder, such as the Star Analyzer 100 made by Paton Hawksley. However, spectroscopy is a new field for amateur astronomers and is ripe for innovation. Courtesy Paton Hawksley, Field Tested Software, and Science-Surplus
8 A New Instrument for Amateurs The fiber-fed spectrometer is a different animal altogether. It consists of several components, all integrated into a very small package. The basic elements include: Fiber-optic cable interface Imaging Slit Collimating mirror High-resolution diffraction grating Focusing mirror Linear CCD chip Processing electronics to feed the data from the CCD to the computer

9 Fiber-Fed Spectrometer Optical Bench 4-inches Diffraction Grating Fiber Interface - Slit Linear CCD Collimating Mirror Focusing Mirror Courtesy Science-Surplus
 of 0.22.")
10 Fiber-Fed Spectrometer Optical Bench The optical bench of the spectrometer is a crossed Czerny- Turner design This folded light configuration is very compact and is flexible enough to provide various linear dispersion designs. It expects an entrance light cone of > f/3. This spectrometer is fed by a multimode fiber-optic cable with a Numerical Aperture (NA) of The optimal light cone is calculated by: Focal Ratio = 1/(2*NA) In this case, F/2.27 (more on this later) Courtesy BWTek, Inc.
11 Fiber-Optic Head The fiber-optic head is designed to interface the light coming into the astrograph to the fiber-optic connection between itself and the spectrometer slit The fiber-optic head performs 3 essential functions: 1. Brings the light of the desired wavelength band to the end of the fiber-optic cable 2. Splits the light to feed the fiber-optic cable and the guide camera simultaneously 3. Brings the light to the proper focus position for both the fiber-optic cable and the guide camera
12 Fiber-Optic Head The fiber-optic head also performs two other functions: Enables a solid connection to the astrograph focuser to minimize the slop and movement of the fiberoptic cable in relation to the entering light beam Provides a solid, precisely aligned and accurate distance setting for the guide camera to bring the fiber and camera into focus simultaneously Both functions are necessary to maximize the amount of light fed into the fiber-optic cable while providing enough light to the guide camera to track the object under study

13 Fiber-Optic Head Cold Mirror

14 Fiber-Optic Head Cold Mirror The cold mirror splits the light to feed the fiber-optic cable and the CCD guide camera simultaneously The component that generally performs this function is a beam-splitter. The cold mirror, on the other hand, splits the light based on the wavelength The light is split so that some goes straight through, along the astrograph s optical axis, and the rest is reflected 90 degrees to the optical axis of the astrograph Courtesy Edmund Optics
15 Fiber-Optic Head Cold Mirror The cold mirror selected is produced by Edmund Optical and is model mm square (45 Deg AOI) It reflects light from 4000 Å 6700Å and transmits infrared light (above 6700Å) straight through as shown at the right Courtesy Edmund Optics
16 Fiber-Optic Head Fiber Cable As mentioned previously, the light cone coming into the spectrometer is an important consideration for the design of the fiber-optic head The design of the spectrometer expects a light cone of >f/3. The multimode fiber-optic cable has a Numerical Aperture (NA) of 0.22 The NA of an optical system is basically a number that characterizes the range of angles over which that system can accept or emit light For this astrograph application, the light cone is determined by the focal ratio (FR) of the astrograph and the value of the light cone acceptable to the fiber optic cable
17 Fiber-Optic Head FRD Focal Ratio Degradation (FRD) is an effect that occurs when the light cone entering a fiber-optic cable is not optimized to its NA When the light cone focal ratio (FR) is not optimized, the light transmission rate falls from nearly 100% down to almost 50% or less The goal is to maximize the amount of light coming into the spectrometer by minimizing the amount of light lost in the fiber-optic cable This is done by using the NA of the fiber to determine the best FR for the fiber and adjusting the light cone FR accordingly
18 Fiber-Optic Head FRD Courtesy SAO/NASA Astrophysics Data System (ADS) "Focal ratio degradation in optical fibers of astronomical interest" Ramsey, L. W. 1998ASPC R
19 Fiber-Optic Head Fiber Cable To review: The multimode fiber-optic cable NA value is 0.22 The equation that converts the NA value to the optimum light cone f-ratio is: 1/(2*NA) Therefore: For the cable I am using, the optimum f-ratio is f/2.27 The focal ratios of my astrograph are f/7.5 when using my refractor and f/8.0 for my Ritchey-Chrétien Cassegrain The Czerny-Turner design expects > f/3 What do we do to adapt the astrograph light cone to provide the fiber and spectrometer what they expect?

20 Fiber-Optic Head Adjusting FR In this case, I used 0.5x focal reducer to change the FR from F/8 or F/7.5 down to F/4 or F/3.75, respectively
21 Fiber-Optic Head Adjusting FR The focal reducer changes the astrograph s effective focal ratio by a factor of 0.5. This provides the required light cone into the fiber-optic cable to minimize losses caused by FRD Adding the focal reducer also shortens the distance from the mirror to the fiber-optic SMA connector so that it is less than the distance from the CCD camera to the mirror It is critical to calculate these distances to bring the light to focus at the fiber and on the focal plane of the camera simultaneously The result is the CCD camera is imaging at F/8 or F/7.5, and the fiber is imaging at F/4 or F/3.75, respectively
22 Engineering the Auto-Guider The CCD camera receiving the infrared (IR) image of the object under study, typically a star, is the source for realtime data to feed the auto-guiding software The auto-guiding software allows you to select a bright object in the frame, and it calculates the center of the object using the centroid calculation Once you tell the software to lock on to a calculated position, it sends commands to your mount s auto-guiding port to move the mount in Right Ascension and Declination to keep the object as close to the initial calculated coordinates as possible Being able to guide on the IR signal while the visible wavelengths are feeding through fiber-optic cable is a real benefit and simplifies your work
23 Object Alignment Focusing When initially imaging a bright star, Capella for example, I made the assumption that I had performed the calculations for the distances correctly so that when I focused the star, it would be smaller than the size of the fiber Typically when doing deep sky images, for example, a star image with 3 4 arcseconds of seeing, the FWHM of the star image would cover an area 3 4 pixels in diameter Because each pixel on my camera is 5.4 microns square, the star would cover an area of about 20 microns in diameter at FWHM Because the size of the fiber is 500 microns, it should be fairly easy to keep the star on the fiber end since the fiber is basically 25 times bigger in diameter than a focused star In reality, the star focused in the IR and distorted by the cold mirror is probably closer to 200 microns in diameter. This is equivalent to about 45 arcseconds in diameter


24 Object Alignment Focusing Capella α Auriga V-band magnitude: 0.08
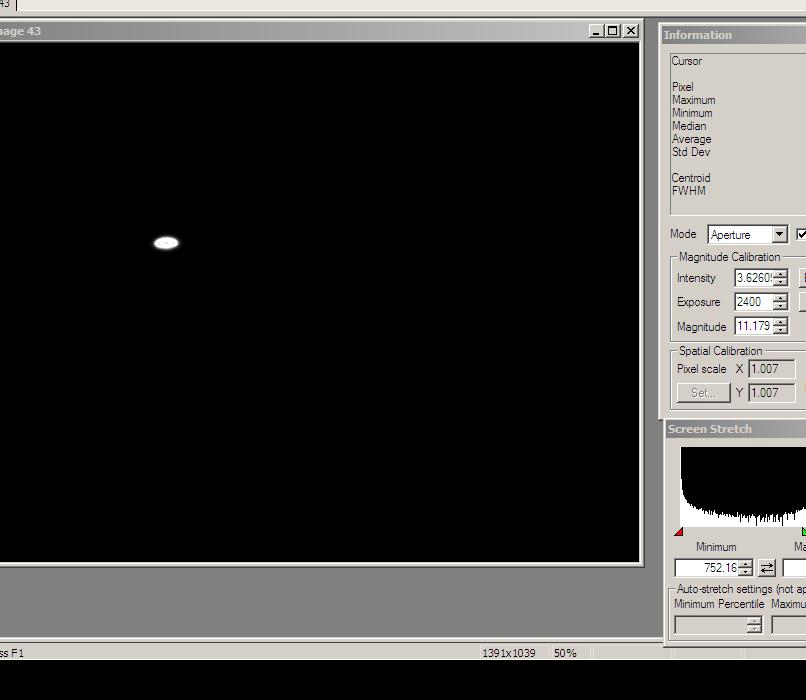
25 Object Alignment Initially, the flip mirror was aligned pretty well to center the object, but there is an offset owing to the refraction of the IR light passing through the 45 angled piece of glass Through a trial-and-error process of moving the star image around the CCD and monitoring the real-time output of the spectrometer, I finally located the CCD pixel coordinates that matched the location of the fiber The CCD chip is 1391 x 1039, and when used in the Bin x2 mode is 695 x 519 The pixel location I finally settled on was 200 x 200 ±10 pixels
26 Auto-Guiding on the Object The intent was to start auto-guiding on the star once it was placed in the correct spot to feed light into the fiber-optic cable However, because my mount s periodic error (PE) was less than the size of the star image on the CCD, my mount s tracking was good enough to keep the star on the fiber. I always have the option to auto-guide if necessary The focusing may have been off some, so depending on the object, auto-guiding may become necessary Auto-guiding is absolutely necessary if you want to take a series of exposures with the spectrometer over a 30 to 60 minute period auto-guiding will compensate for a small declination drift caused by a not quite perfect polar alignment of your mount
27 Acquiring the Spectral Data
28 Spectrometer Specifications The Science-Surplus Spectrometer is delivered as a DIY kit the user must align the optical bench to make sure it covers the spectral wavelengths desired The Sony ILX511 linear CCD chip is a 2048-pixel chip. The pixel size is 14 microns x 200 microns with a 14-micron pitch. It is sensitive from below 4000Å to above 9000Å. The peak sensitivity is 4500Å The spectrometer comes with its own data acquisition software and communicates over a serial connection to the computer. The documentation includes basic operation and alignment of the optical bench, and also the serial command language useful in creating your own software I wrote my own software to acquire the data in the way I wanted it formatted so that I could store the data in the FITS file format as an image file
29 Spectrometer Performance The controller on the spectrometer puts certain limits on its operation the main limit involves the data acquisition parameters The spectrometer can only be set to take exposures from 50 milliseconds to 64,000 milliseconds Typically spectral data takes a long time to acquire because you are spreading out the light across the CCD, and consequently, the photons are diluted by a factor of 250 to 500. This is equivalent to about 6 or 7 magnitudes in brightness What this means is that if we typically can image 12th magnitude stars in 60 seconds with a signal-to-noise ratio (SNR) of 100, then we would only be able to acquire the spectrum (peak value) of a 6th magnitude star. If we want the spectral range of 5000Å to 6000Å to have an SNR of at least 100, then we would be limited to 4th or 5th magnitude stars
30 Spectrometer Data Acquisition
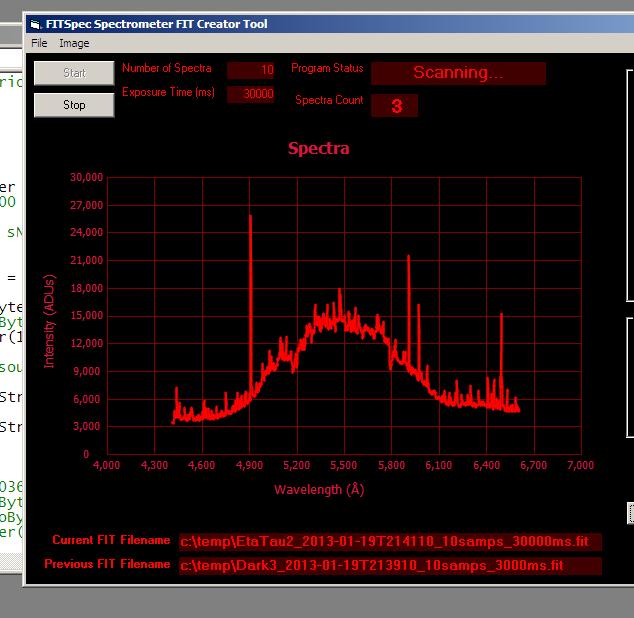
31 Spectrometer Data Acquisition The software I have developed allows me to set the spectrometer s data acquisition parameters (exposure time, number of spectra, filename to store data) and compiles the data into a 3D array stored using the FITS data file format The data is presented as a 2D image file, with each row in the image a complete 2,048 element spectrum the X-axis representing the wavelength of the spectrum The Y-axis represents the time axis, with time zero at the top of the image and each row representing a certain exposure time, typically 60 seconds. So 10 rows would represent 10 total data acquisition times The data is acquired in 16-bit format, so the amplitude of the spectrum is a value from 0 65,535 counts or ADUs The data acquired is the raw values from the linear CCD chip and has several systematic errors that must be removed. Among these are the Thermal Noise, Hot Pixels, and Readout Noise. All these must be removed before calibration is performed
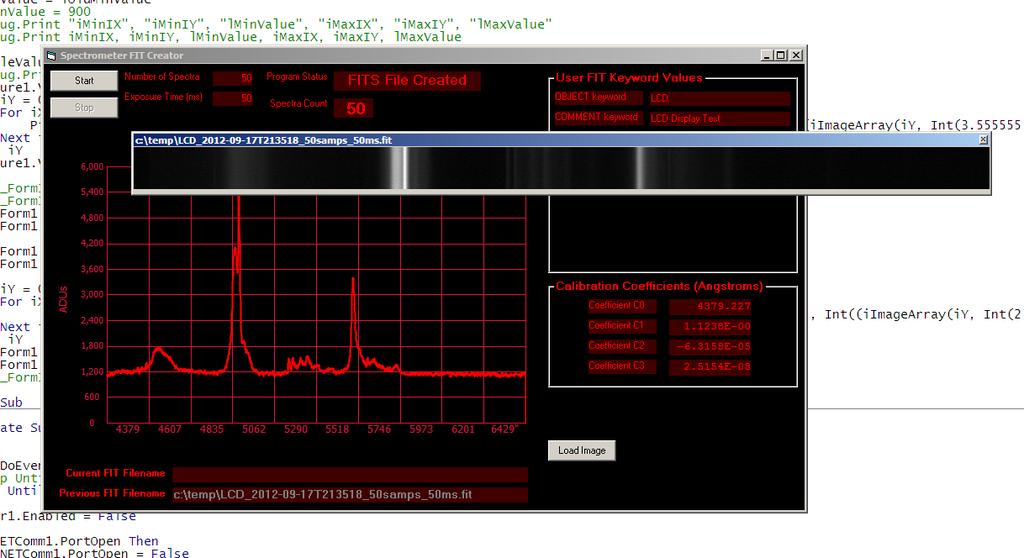
32 Spectrum Calibration The wavelength axis must be calibrated using a reference source I have used a fluorescent light source as a calibration source because it has peaks in the Blue, Green, and Red wavelength regions. I have also used the solar spectrum with its associated Balmer Lines as a calibration source The procedure is to measure the peak pixel location for a given spectral line, and using at least 3 pixel wavelength pairs, perform a 2nd or 3rd order polynomial fit to apply to the data Once the polynomial is applied to the raw data, then the identification of peaks can begin
33 Spectrum Calibration
34 Calibration and Normalization I use another spectrum analysis software RSpec for the final processing (Calibration and CCD Response Curve Normalization) RSpec was written by Tom Field of Field Tested Software, LLC If you recall, Tom gave a talk over the Internet last year in January about spectroscopy RSpec has several functions that make it easy to calibrate and normalize your raw spectroscopy data CCD Response Curve Normalization is a process where you normalize your raw curve to the response of the CCD. CCD responses are non-linear over the wavelength band, which means that the CCD is more sensitive at some wavelengths and not so sensitive at others
35 CCD Response Curve ILX511 Response Curve Courtesy Sony - ILX511 Datasheet
36 CCD Response Curve Generation The procedure to generate a CCD response curve is very straightforward All that is necessary is to acquire the spectrum of a given star of a known spectral type Then, after doing dark subtraction of the raw data, divide the dark subtracted data by a reference spectrum of the same star spectral type What this leaves you with (as a residual) is the CCD response curve that affected the original data

37 CCD Response Curve Generation Red Curve / Blue Curve α Tau vs. K5iii
38 Results I started this project in August 2012 and have been working on it off and on since then. A large part of the work was software development done while waiting for various parts to arrive I had hoped to have more results to demonstrate thus far, but the time to integrate the system has taken longer than expected I have measured the light from the Sun, Moon, Jupiter, and various stars such as Alpha Tau, Eta Tau, Alpha Ari, Alpha Gem, and Alpha And

39 Results Jupiter

40 Results Aldebaran

41 Results Aldebaran BLUE K5iii Reference Spectra RED Measured α Tau Spectra
42 Parts List Science-Surplus Spectrometer $200 Orion Flip Mirror $170 Edmund Optical Cold Mirror $50 Fiber-Optic Cable Adapter (SMA) $80 ATIK 314e CCD Camera $1,300 (other cameras can be substituted, of course!) Time Invested Probably hours
43 Questions?
Improving the Collection Efficiency of Raman Scattering
 PERFORMANCE Unparalleled signal-to-noise ratio with diffraction-limited spectral and imaging resolution Deep-cooled CCD with excelon sensor technology Aberration-free optical design for uniform high resolution
QE65000 Spectrometer. Scientific-Grade Spectroscopy in a Small Footprint. now with. Spectrometers
 QE65000 Spectrometer Scientific-Grade Spectroscopy in a Small Footprint QE65000 The QE65000 Spectrometer is the most sensitive spectrometer we ve developed. Its Hamamatsu FFT-CCD detector provides 90%
GPI INSTRUMENT PAGES
 GPI INSTRUMENT PAGES This document presents a snapshot of the GPI Instrument web pages as of the date of the call for letters of intent. Please consult the GPI web pages themselves for up to the minute
HR2000+ Spectrometer. User-Configured for Flexibility. now with. Spectrometers
 Spectrometers HR2000+ Spectrometer User-Configured for Flexibility HR2000+ One of our most popular items, the HR2000+ Spectrometer features a high-resolution optical bench, a powerful 2-MHz analog-to-digital
Improved Spectra with a Schmidt-Czerny-Turner Spectrograph
 Improved Spectra with a Schmidt-Czerny-Turner Spectrograph Abstract For years spectra have been measured using traditional Czerny-Turner (CT) design dispersive spectrographs. Optical aberrations inherent
Observational Astronomy
 Observational Astronomy Instruments The telescope- instruments combination forms a tightly coupled system: Telescope = collecting photons and forming an image Instruments = registering and analyzing the
Better Imaging with a Schmidt-Czerny-Turner Spectrograph
 Better Imaging with a Schmidt-Czerny-Turner Spectrograph Abstract For years, images have been measured using Czerny-Turner (CT) design dispersive spectrographs. Optical aberrations inherent in the CT design
ECEN. Spectroscopy. Lab 8. copy. constituents HOMEWORK PR. Figure. 1. Layout of. of the
 ECEN 4606 Lab 8 Spectroscopy SUMMARY: ROBLEM 1: Pedrotti 3 12-10. In this lab, you will design, build and test an optical spectrum analyzer and use it for both absorption and emission spectroscopy. The
Gemini 8m Telescopes Instrument Science Requirements. R. McGonegal Controls Group. January 27, 1996
 GEMINI 8-M Telescopes Project Gemini 8m Telescopes Instrument Science Requirements R. McGonegal Controls Group January 27, 1996 GEMINI PROJECT OFFICE 950 N. Cherry Ave. Tucson, Arizona 85719 Phone: (520)
Simultaneous Infrared-Visible Imager/Spectrograph a Multi-Purpose Instrument for the Magdalena Ridge Observatory 2.4-m Telescope
 Simultaneous Infrared-Visible Imager/Spectrograph a Multi-Purpose Instrument for the Magdalena Ridge Observatory 2.4-m Telescope M.B. Vincent *, E.V. Ryan Magdalena Ridge Observatory, New Mexico Institute
UV/Optical/IR Astronomy Part 2: Spectroscopy
 UV/Optical/IR Astronomy Part 2: Spectroscopy Introduction We now turn to spectroscopy. Much of what you need to know about this is the same as for imaging I ll concentrate on the differences. Slicing the
Reflectors vs. Refractors
 1 Telescope Types - Telescopes collect and concentrate light (which can then be magnified, dispersed as a spectrum, etc). - In the end it is the collecting area that counts. - There are two primary telescope
"Internet Telescope" Performance Requirements
 "Internet Telescope" Performance Requirements by Dr. Frank Melsheimer DFM Engineering, Inc. 1035 Delaware Avenue Longmont, Colorado 80501 phone 303-678-8143 fax 303-772-9411 www.dfmengineering.com Table
Olivier Thizy François Cochard
 Alpy guiding User Guide Olivier Thizy (olivier.thizy@shelyak.com) François Cochard (francois.cochard@shelyak.com) DC0017B : feb. 2014 Alpy guiding module User Guide Olivier Thizy (olivier.thizy@shelyak.com)
DESIGN NOTE: DIFFRACTION EFFECTS
 NASA IRTF / UNIVERSITY OF HAWAII Document #: TMP-1.3.4.2-00-X.doc Template created on: 15 March 2009 Last Modified on: 5 April 2010 DESIGN NOTE: DIFFRACTION EFFECTS Original Author: John Rayner NASA Infrared
1.6 Beam Wander vs. Image Jitter
 8 Chapter 1 1.6 Beam Wander vs. Image Jitter It is common at this point to look at beam wander and image jitter and ask what differentiates them. Consider a cooperative optical communication system that
Maya2000 Pro Spectrometer
 now with triggering! Maya2000 Pro Our Maya2000 Pro Spectrometer offers you the perfect solution for applications that demand low light-level, UV-sensitive operation. This back-thinned, 2D FFT-CCD, uncooled
Performance Comparison of Spectrometers Featuring On-Axis and Off-Axis Grating Rotation
 Performance Comparison of Spectrometers Featuring On-Axis and Off-Axis Rotation By: Michael Case and Roy Grayzel, Acton Research Corporation Introduction The majority of modern spectrographs and scanning
Puntino. Shack-Hartmann wavefront sensor for optimizing telescopes. The software people for optics
 Puntino Shack-Hartmann wavefront sensor for optimizing telescopes 1 1. Optimize telescope performance with a powerful set of tools A finely tuned telescope is the key to obtaining deep, high-quality astronomical
On Axis Guiding and Real Time Autofocus Solutions
 On Axis Guiding and Real Time Autofocus Solutions Southwest Astrophotography Seminar 2014 Dr. Gaston Baudat Innovations, LLC 1 Astro-photography challenges A target must stay still for successful long
Cerro Tololo Inter-American Observatory. CHIRON manual. A. Tokovinin Version 2. May 25, 2011 (manual.pdf)
") Cerro Tololo Inter-American Observatory CHIRON manual A. Tokovinin Version 2. May 25, 2011 (manual.pdf) 1 1 Overview Calibration lamps Quartz, Th Ar Fiber Prism Starlight GAM mirror Fiber Viewer FEM Guider
Cerro Tololo Inter-American Observatory CHIRON manual A. Tokovinin Version 2. May 25, 2011 (manual.pdf) 1 1 Overview Calibration lamps Quartz, Th Ar Fiber Prism Starlight GAM mirror Fiber Viewer FEM Guider
DESIGNING AND IMPLEMENTING AN ADAPTIVE OPTICS SYSTEM FOR THE UH HOKU KE`A OBSERVATORY ABSTRACT
 DESIGNING AND IMPLEMENTING AN ADAPTIVE OPTICS SYSTEM FOR THE UH HOKU KE`A OBSERVATORY University of Hawai`i at Hilo Alex Hedglen ABSTRACT The presented project is to implement a small adaptive optics system
An integral eld spectrograph for the 4-m European Solar Telescope
 Mem. S.A.It. Vol. 84, 416 c SAIt 2013 Memorie della An integral eld spectrograph for the 4-m European Solar Telescope A. Calcines 1,2, M. Collados 1,2, and R. L. López 1 1 Instituto de Astrofísica de Canarias
a simple optical imager
 Imagers and Imaging a simple optical imager Here s one on our 61-Inch Telescope Here s one on our 61-Inch Telescope filter wheel in here dewar preamplifier However, to get a large field we cannot afford
Oriel MS260i TM 1/4 m Imaging Spectrograph
 Oriel MS260i TM 1/4 m Imaging Spectrograph MS260i Spectrograph with 3 Track Fiber on input and InstaSpec CCD on output. The MS260i 1 4 m Imaging Spectrographs are economical, fully automated, multi-grating
UM1380/ UM2380 UM1390/ UM2390 Datasheet
 UM1380/ UM2380 UM1390/ UM2390 Datasheet Description UM1380/ UM2380/ UM1390/ UM2390 spectro-module is a new OtO optical platform with 50% footprint down size compared to UM1280/UM2280 series. Besides the
A Software Implementation of Data Acquisition Control and Management for Czerny Turner Monochromator
 A Software Implementation of Data Acquisition Control and Management for Czerny Turner Monochromator HAI-TRIEU PHAM, JUNG-BAE HWANG, YONGGWAN WON Department of Computer Engineering, Chonnam National University
Instructions for the Experiment
 Instructions for the Experiment Excitonic States in Atomically Thin Semiconductors 1. Introduction Alongside with electrical measurements, optical measurements are an indispensable tool for the study of
MS260i 1/4 M IMAGING SPECTROGRAPHS
 MS260i 1/4 M IMAGING SPECTROGRAPHS ENTRANCE EXIT MS260i Spectrograph with 3 Track Fiber on input and InstaSpec IV CCD on output. Fig. 1 OPTICAL CONFIGURATION High resolution Up to three gratings, with
Spectral and Polarization Configuration Guide for MS Series 3-CCD Cameras
 Spectral and Polarization Configuration Guide for MS Series 3-CCD Cameras Geospatial Systems, Inc (GSI) MS 3100/4100 Series 3-CCD cameras utilize a color-separating prism to split broadband light entering
Radiometric Solar Telescope (RaST) The case for a Radiometric Solar Imager,
 The case for a Radiometric Solar Imager,") SORCE Science Meeting 29 January 2014 Mark Rast Laboratory for Atmospheric and Space Physics University of Colorado, Boulder Radiometric Solar Telescope (RaST) The case for a Radiometric Solar Imager,
SORCE Science Meeting 29 January 2014 Mark Rast Laboratory for Atmospheric and Space Physics University of Colorado, Boulder Radiometric Solar Telescope (RaST) The case for a Radiometric Solar Imager,
F/48 Slit Spectroscopy
 1997 HST Calibration Workshop Space Telescope Science Institute, 1997 S. Casertano, et al., eds. F/48 Slit Spectroscopy R. Jedrzejewski & M. Voit Space Telescope Science Institute, Baltimore, MD 21218
Southern African Large Telescope. RSS CCD Geometry
 Southern African Large Telescope RSS CCD Geometry Kenneth Nordsieck University of Wisconsin Document Number: SALT-30AM0011 v 1.0 9 May, 2012 Change History Rev Date Description 1.0 9 May, 2012 Original
A new Infra-Red Camera for COAST. Richard Neill - PhD student Supervisor: Dr John Young
 A new Infra-Red Camera for COAST Richard Neill - PhD student Supervisor: Dr John Young The Cambridge Optical Aperture-Synthesis Telescope: COAST is a
Kit for building your own THz Time-Domain Spectrometer
 Kit for building your own THz Time-Domain Spectrometer 16/06/2016 1 Table of contents 0. Parts for the THz Kit... 3 1. Delay line... 4 2. Pulse generator and lock-in detector... 5 3. THz antennas... 6
CHARGE-COUPLED DEVICE (CCD)
") CHARGE-COUPLED DEVICE (CCD) Definition A charge-coupled device (CCD) is an analog shift register, enabling analog signals, usually light, manipulation - for example, conversion into a digital value that
CHARGE-COUPLED DEVICE (CCD) Definition A charge-coupled device (CCD) is an analog shift register, enabling analog signals, usually light, manipulation - for example, conversion into a digital value that
Miniature Spectrometer Technical specifications
 Miniature Spectrometer Technical specifications Ref: MSP-ISI-TEC 001-02 Date: 2017-05-05 Contact Details Correspondence Address: Email: Phone: IS-Instruments Ltd. Pipers Business Centre 220 Vale Road Tonbridge
Exercise 8: Interference and diffraction
 Physics 223 Name: Exercise 8: Interference and diffraction 1. In a two-slit Young s interference experiment, the aperture (the mask with the two slits) to screen distance is 2.0 m, and a red light of wavelength
Technical Notes. Integrating Sphere Measurement Part II: Calibration. Introduction. Calibration
 Technical Notes Integrating Sphere Measurement Part II: Calibration This Technical Note is Part II in a three part series examining the proper maintenance and use of integrating sphere light measurement
Spark Spectral Sensor Offers Advantages
 04/08/2015 Spark Spectral Sensor Offers Advantages Spark is a small spectral sensor from Ocean Optics that bridges the spectral measurement gap between filter-based devices such as RGB color sensors and
Microscope-Spectrometer
 20 Micro-spectrometer ToupTek s spectrometer is applicable for spectral detection within the wavelength range between 200nm and 1100nm. Due to their high stability and performance, these portable instruments
UltraGraph Optics Design
 UltraGraph Optics Design 5/10/99 Jim Hagerman Introduction This paper presents the current design status of the UltraGraph optics. Compromises in performance were made to reach certain product goals. Cost,
First steps with a Slit Spectroscope
 First steps with a Slit Spectroscope Ken M Harrison September 2012 Ok, you ve taken the quantum leap and moved into your first slit spectroscope. Your initial experiences may have been with a grating (Star
Spectroscopic Instrumentation
 Spectroscopic Instrumentation Theodor Pribulla Astronomical Institute of the Slovak Academy of Sciences, Tatranská Lomnica, Slovakia Spectroscopic workshop, February 6-10, 2017, PřF MU, Brno Principal
AgilOptics mirrors increase coupling efficiency into a 4 µm diameter fiber by 750%.
 Application Note AN004: Fiber Coupling Improvement Introduction AgilOptics mirrors increase coupling efficiency into a 4 µm diameter fiber by 750%. Industrial lasers used for cutting, welding, drilling,
instruments Solar Physics course lecture 3 May 4, 2010 Frans Snik BBL 415 (710)
") Solar Physics course lecture 3 May 4, 2010 Frans Snik BBL 415 (710) f.snik@astro.uu.nl www.astro.uu.nl/~snik info from photons spatial (x,y) temporal (t) spectral (λ) polarization ( ) usually photon starved
Solar Physics course lecture 3 May 4, 2010 Frans Snik BBL 415 (710) f.snik@astro.uu.nl www.astro.uu.nl/~snik info from photons spatial (x,y) temporal (t) spectral (λ) polarization ( ) usually photon starved
Order Overlap. A single wavelength constructively interferes in several directions A given direction can receive multiple wavelengths.
 Order Overlap A single wavelength constructively interferes in several directions A given direction can receive multiple wavelengths. Spectral Calibration TripleSpec Users Guide Spectral Calibration TripleSpec
GMT Instruments and AO. GMT Science Meeting - March
 GMT Instruments and AO GMT Science Meeting - March 2008 1 Instrument Status Scientific priorities have been defined Emphasis on: Wide-field survey science (cosmology) High resolution spectroscopy (abundances,
Supplementary Materials
 Supplementary Materials In the supplementary materials of this paper we discuss some practical consideration for alignment of optical components to help unexperienced users to achieve a high performance
OtO Photonics. Light Source Datasheet. Description. Balance Light Series LS-BA. Halogen Light Series LS-HA
 OtO Photonics Light Source Datasheet Description OtO Photonics provide many kinds of light sources to meet customer's need. Our light sources offer the stable and wide-band spectral output and proper for
Very short introduction to light microscopy and digital imaging
 Very short introduction to light microscopy and digital imaging Hernan G. Garcia August 1, 2005 1 Light Microscopy Basics In this section we will briefly describe the basic principles of operation and
INTRODUCTION TO CCD IMAGING
 ASTR 1030 Astronomy Lab 85 Intro to CCD Imaging INTRODUCTION TO CCD IMAGING SYNOPSIS: In this lab we will learn about some of the advantages of CCD cameras for use in astronomy and how to process an image.
Spectral Transmission Measurements on various Astronomical Filters.
 Spectral Transmission Measurements on various Astronomical Filters. Andreas Bartels - June 2008 Thanks to my friend Olivier, who provided the Spectrometer, I was able to do some spectral transmission measurements
University of Wisconsin Chemistry 524 Spectroscopic Components *
 University of Wisconsin Chemistry 524 Spectroscopic Components * In journal articles, presentations, and textbooks, chemical instruments are often represented as block diagrams. These block diagrams highlight
Spectroscopy of Ruby Fluorescence Physics Advanced Physics Lab - Summer 2018 Don Heiman, Northeastern University, 1/12/2018
 1 Spectroscopy of Ruby Fluorescence Physics 3600 - Advanced Physics Lab - Summer 2018 Don Heiman, Northeastern University, 1/12/2018 I. INTRODUCTION The laser was invented in May 1960 by Theodor Maiman.
Application Note (A11)
") Application Note (A11) Slit and Aperture Selection in Spectroradiometry REVISION: C August 2013 Gooch & Housego 4632 36 th Street, Orlando, FL 32811 Tel: 1 407 422 3171 Fax: 1 407 648 5412 Email: sales@goochandhousego.com
Application Note (A11) Slit and Aperture Selection in Spectroradiometry REVISION: C August 2013 Gooch & Housego 4632 36 th Street, Orlando, FL 32811 Tel: 1 407 422 3171 Fax: 1 407 648 5412 Email: sales@goochandhousego.com
Chemistry 524--"Hour Exam"--Keiderling Mar. 19, pm SES
 Chemistry 524--"Hour Exam"--Keiderling Mar. 19, 2013 -- 2-4 pm -- 170 SES Please answer all questions in the answer book provided. Calculators, rulers, pens and pencils permitted. No open books allowed.
How-to guide. Working with a pre-assembled THz system
 How-to guide 15/06/2016 1 Table of contents 0. Preparation / Basics...3 1. Input beam adjustment...4 2. Working with free space antennas...5 3. Working with fiber-coupled antennas...6 4. Contact details...8
Conceptual design for the High Resolution Optical Spectrograph on the Thirty-Meter Telescope: a new concept for a ground-based highresolution
 Conceptual design for the High Resolution Optical Spectrograph on the Thirty-Meter Telescope: a new concept for a ground-based highresolution optical spectrograph Cynthia Froning *a, Steven Osterman a,
Feasibility and Design for the Simplex Electronic Telescope. Brian Dodson
 Feasibility and Design for the Simplex Electronic Telescope Brian Dodson Charge: A feasibility check and design hints are wanted for the proposed Simplex Electronic Telescope (SET). The telescope is based
Spectral Analysis of the LUND/DMI Earthshine Telescope and Filters
 Spectral Analysis of the LUND/DMI Earthshine Telescope and Filters 12 August 2011-08-12 Ahmad Darudi & Rodrigo Badínez A1 1. Spectral Analysis of the telescope and Filters This section reports the characterization
IST IP NOBEL "Next generation Optical network for Broadband European Leadership"
 DBR Tunable Lasers A variation of the DFB laser is the distributed Bragg reflector (DBR) laser. It operates in a similar manner except that the grating, instead of being etched into the gain medium, is
Your Complete Astro Photography Solution
 Your Complete Astro Photography Solution Some of this course will be classroom based. There will be practical work in the observatory and also some of the work will be done during the night. Our course
Light gathering Power: Magnification with eyepiece:
 Telescopes Light gathering Power: The amount of light that can be gathered by a telescope in a given amount of time: t 1 /t 2 = (D 2 /D 1 ) 2 The larger the diameter the smaller the amount of time. If
SOAR Integral Field Spectrograph (SIFS): Call for Science Verification Proposals
: Call for Science Verification Proposals") Published on SOAR (http://www.ctio.noao.edu/soar) Home > SOAR Integral Field Spectrograph (SIFS): Call for Science Verification Proposals SOAR Integral Field Spectrograph (SIFS): Call for Science Verification
Published on SOAR (http://www.ctio.noao.edu/soar) Home > SOAR Integral Field Spectrograph (SIFS): Call for Science Verification Proposals SOAR Integral Field Spectrograph (SIFS): Call for Science Verification
Applications of Steady-state Multichannel Spectroscopy in the Visible and NIR Spectral Region
 Feature Article JY Division I nformation Optical Spectroscopy Applications of Steady-state Multichannel Spectroscopy in the Visible and NIR Spectral Region Raymond Pini, Salvatore Atzeni Abstract Multichannel
Scaling relations for telescopes, spectrographs, and reimaging instruments
 Scaling relations for telescopes, spectrographs, and reimaging instruments Benjamin Weiner Steward Observatory University of Arizona bjw @ asarizonaedu 19 September 2008 1 Introduction To make modern astronomical
Comparison of FRD (Focal Ratio Degradation) for Optical Fibres with Different Core Sizes By Neil Barrie
 for Optical Fibres with Different Core Sizes By Neil Barrie") Comparison of FRD (Focal Ratio Degradation) for Optical Fibres with Different Core Sizes By Neil Barrie Introduction The purpose of this experimental investigation was to determine whether there is a dependence
Comparison of FRD (Focal Ratio Degradation) for Optical Fibres with Different Core Sizes By Neil Barrie Introduction The purpose of this experimental investigation was to determine whether there is a dependence
THE CALIBRATION OF THE OPTICAL IMAGER FOR THE HOKU KEA TELESCOPE. Jamie L. H. Scharf Physics & Astronomy, University of Hawai i at Hilo Hilo, HI 96720
 THE CALIBRATION OF THE OPTICAL IMAGER FOR THE HOKU KEA TELESCOPE Jamie L. H. Scharf Physics & Astronomy, University of Hawai i at Hilo Hilo, HI 96720 ABSTRACT I have been calibrating the science CCD camera
Measurement and alignment of linear variable filters
 Measurement and alignment of linear variable filters Rob Sczupak, Markus Fredell, Tim Upton, Tom Rahmlow, Sheetal Chanda, Gregg Jarvis, Sarah Locknar, Florin Grosu, Terry Finnell and Robert Johnson Omega
Be aware that there is no universal notation for the various quantities.
 Fourier Optics v2.4 Ray tracing is limited in its ability to describe optics because it ignores the wave properties of light. Diffraction is needed to explain image spatial resolution and contrast and
STEM Spectrum Imaging Tutorial
 STEM Spectrum Imaging Tutorial Gatan, Inc. 5933 Coronado Lane, Pleasanton, CA 94588 Tel: (925) 463-0200 Fax: (925) 463-0204 April 2001 Contents 1 Introduction 1.1 What is Spectrum Imaging? 2 Hardware 3
Astro-photography. Daguerreotype: on a copper plate
 AST 1022L Astro-photography 1840-1980s: Photographic plates were astronomers' main imaging tool At right: first ever picture of the full moon, by John William Draper (1840) Daguerreotype: exposure using
OPAL Optical Profiling of the Atmospheric Limb
 OPAL Optical Profiling of the Atmospheric Limb Alan Marchant Chad Fish Erik Stromberg Charles Swenson Jim Peterson OPAL STEADE Mission Storm Time Energy & Dynamics Explorers NASA Mission of Opportunity
UNIVERSITY OF HAWAII Institute for Astronomy. f/31 High Angular Resolution Imaging Spectrograph HARIS USER MANUAL update June 10, 1997
 UNIVERSITY OF HAWAII Institute for Astronomy f/31 High Angular Resolution Imaging Spectrograph HARIS USER MANUAL update June 10, 1997 To print more copies of this document, type: dvi2ps 88inch/mkoman/haris/haris
Paper Synopsis. Xiaoyin Zhu Nov 5, 2012 OPTI 521
 Paper Synopsis Xiaoyin Zhu Nov 5, 2012 OPTI 521 Paper: Active Optics and Wavefront Sensing at the Upgraded 6.5-meter MMT by T. E. Pickering, S. C. West, and D. G. Fabricant Abstract: This synopsis summarized
Company synopsis. MSU series
 MSU series 1 2 Company synopsis Majantys, part of Pleiades Group along with Pleiades Instruments, is an optoelectronic system maker, designing and manufacturing for specific systems such as photometric
FLAMINGOS at the KPNO 2.1-m
 FLAMINGOS at the KPNO 2.1-m Telescope Console Control Panels & GUIs used for Guiding Nick Raines & Richard Elston Version 0.1, 2003 October 21 FLAMINGOS at the 2.1-m: Guider Controls Page 1 of 10 Introduction
VATTSpec Instructions Rev. 10/23/2015
 VATTSpec Instructions Rev. 10/23/2015 Introduction VATTSpec is a medium resolution CCD range spectrograph with a skinny chip having excellent cosmetics. Its UA ITL chip, Serial Number 8228, has a gain
The DSI for Autostar Suite
 An Introduction To DSI Imaging John E. Hoot President Software Systems Consulting 1 The DSI for Autostar Suite Meade Autostar Suite Not Just A Project, A Mission John E. Hoot System Architect 2 1 DSI -
IMAGE SENSOR SOLUTIONS. KAC-96-1/5" Lens Kit. KODAK KAC-96-1/5" Lens Kit. for use with the KODAK CMOS Image Sensors. November 2004 Revision 2
 KODAK for use with the KODAK CMOS Image Sensors November 2004 Revision 2 1.1 Introduction Choosing the right lens is a critical aspect of designing an imaging system. Typically the trade off between image
Light, Color, Spectra 05/30/2006. Lecture 17 1
 What do we see? Light Our eyes can t t detect intrinsic light from objects (mostly infrared), unless they get red hot The light we see is from the sun or from artificial light When we see objects, we see
Exoplanet transit, eclipse, and phase curve observations with JWST NIRCam. Tom Greene & John Stansberry JWST NIRCam transit meeting March 12, 2014
 Exoplanet transit, eclipse, and phase curve observations with JWST NIRCam Tom Greene & John Stansberry JWST NIRCam transit meeting March 12, 2014 1 Scope of Talk NIRCam overview Suggested transit modes
3D light microscopy techniques
 3D light microscopy techniques The image of a point is a 3D feature In-focus image Out-of-focus image The image of a point is not a point Point Spread Function (PSF) 1D imaging 1 1 2! NA = 0.5! NA 2D imaging
Astronomy 341 Fall 2012 Observational Astronomy Haverford College. CCD Terminology
 CCD Terminology Read noise An unavoidable pixel-to-pixel fluctuation in the number of electrons per pixel that occurs during chip readout. Typical values for read noise are ~ 10 or fewer electrons per
Camera Requirements For Precision Agriculture
 Camera Requirements For Precision Agriculture Radiometric analysis such as NDVI requires careful acquisition and handling of the imagery to provide reliable values. In this guide, we explain how Pix4Dmapper
Chemistry Instrumental Analysis Lecture 10. Chem 4631
 Chemistry 4631 Instrumental Analysis Lecture 10 Types of Instrumentation Single beam Double beam in space Double beam in time Multichannel Speciality Types of Instrumentation Single beam Requires stable
An Optical Characteristic Testing System for the Infrared Fiber in a Transmission Bandwidth 9-11μm
 An Optical Characteristic Testing System for the Infrared Fiber in a Transmission Bandwidth 9-11μm Ma Yangwu *, Liang Di ** Center for Optical and Electromagnetic Research, State Key Lab of Modern Optical
Cornerstone 260 1/4 m Monochromators
 Cornerstone /4 m Monochromators The Oriel Cornerstone is a high performance, economical and user-friendly monochromator an ideal instrument for research and OEM applications. Oriel has made it easy to
EXPRIMENT 3 COUPLING FIBERS TO SEMICONDUCTOR SOURCES
 EXPRIMENT 3 COUPLING FIBERS TO SEMICONDUCTOR SOURCES OBJECTIVES In this lab, firstly you will learn to couple semiconductor sources, i.e., lightemitting diodes (LED's), to optical fibers. The coupling
!!! DELIVERABLE!D60.2!
 www.solarnet-east.eu This project is supported by the European Commission s FP7 Capacities Programme for the period April 2013 - March 2017 under the Grant Agreement number 312495. DELIVERABLED60.2 Image
Camera Requirements For Precision Agriculture
 Camera Requirements For Precision Agriculture Radiometric analysis such as NDVI requires careful acquisition and handling of the imagery to provide reliable values. In this guide, we explain how Pix4Dmapper
The USB 2000 Spectrometer
 The USB 2000 Spectrometer J. R. Graham, UCB, updated 8/28/2008 The USB 2000 spectrometer is a simple optical instrument based on a diffraction grating and a one-dimensional CCD array. The array has 2048
THE WASATCH ADVANTAGE
 THE WASATCH ADVANTAGE Increasing demand for lightweight, portable instruments, along with improvements in optical design and manufacturing technologies, is leading to the development of a new generation
LED Lighting Flux and Color Measurement System (LFC)
") LED Lighting Flux and Color Measurement System (LFC) Fast, accurate and complete System for research and production LFC System is a high cost efficiency light measurement system. The system is designed
LED Lighting Flux and Color Measurement System (LFC) Fast, accurate and complete System for research and production LFC System is a high cost efficiency light measurement system. The system is designed
MASSACHUSETTS INSTITUTE OF TECHNOLOGY Department of Electrical Engineering and Computer Science
 Student Name Date MASSACHUSETTS INSTITUTE OF TECHNOLOGY Department of Electrical Engineering and Computer Science 6.161 Modern Optics Project Laboratory Laboratory Exercise No. 3 Fall 2005 Diffraction
BaySpec SuperGamut OEM
 BaySpec SuperGamut OEM Spectrographs & Spectrometers RUGGED SOLID STATE HIGH RESOLUTION OPTIMIZED COOLING COST EFFECTIVE HIGH THROUGHPUT www.bayspec.com Specifications Model UV-NIR VIS-NIR NIR 900-1700nm
Chapter 16 Light Waves and Color
 Chapter 16 Light Waves and Color Lecture PowerPoint Copyright The McGraw-Hill Companies, Inc. Permission required for reproduction or display. What causes color? What causes reflection? What causes color?
Nonlinearity in the Detector used in the Subaru Telescope High Dispersion Spectrograph
 Nonlinearity in the Detector used in the Subaru Telescope High Dispersion Spectrograph Akito Tajitsu Subaru Telescope, National Astronomical Observatory of Japan, 650 North A ohoku Place, Hilo, HI 96720,
Big League Cryogenics and Vacuum The LHC at CERN
 Big League Cryogenics and Vacuum The LHC at CERN A typical astronomical instrument must maintain about one cubic meter at a pressure of