WIYN High-Resolution Infrared Camera (WHIRC)
|
|
|
- Lesley Leonard
- 5 years ago
- Views:
Transcription


1 WIYN High-Resolution Infrared Camera (WHIRC) Quick Guide to Data Reduction Dick Joyce Version 1.03, 2009 August 24 WHIRC Data Reduction Manual Version 1.03, 2009 August 24 1
2 ACRONYMS AND ABBREVIATIONS: INTRODUCTION DATA PREPARATION INITIAL STEPS GENERATING DOME FLATS GENERATING SKY FLATS ARTIFACT REMOVAL BAD PIXELS PUPIL GHOST FRINGES DATA REDUCTION STANDARDS OR POINTLIKE OBJECTS EXTENDED OBJECTS OR CROWDED FIELDS COMBINING IMAGES INTO A MOSAIC LARGER MOSAICS DISTORTION CORRECTION APPENDICES APPENDIX A OBSERVATIONAL TEST OF PUPIL GHOST REMOVAL Acronyms and Abbreviations: DHE FITS GUI IAS IRAF MOP PAN OA TCS WHIRC WIYN WHOCS WHOMP WTTM Detector Head Electronics (MONSOON system) Flexible Image Transport System (image standard) Graphical User Interface Instrument Adapter System Image Reduction and Analysis Facility MONSOON Observing Platform Pixel Acquisition Node (computer), controls MONSOON Observing Associate Telescope Control System WIYN High Resolution InfraRed Camera Wisconsin Indiana Yale NOAO (Observatory consortium) WHIRC Observation Control System WHIRC Observation Manager and Planner WIYN Tip/Tilt Module WHIRC Data Reduction Manual Version 1.03, 2009 August 24 2
3 WIYN High-Resolution Infrared Camera (WHIRC) Data Reduction Guide 1.0 Introduction This document is a quick guide to reducing data taken with the WIYN High Resolution Infrared Camera (WHIRC). Data reduction is a highly personal process, so one should keep in mind the procedures described here are biased by the author s personal preferences and experience. Many WHIRC users may have their own (possibly superior) means of reducing data, or use reduction platforms other than IRAF. Suggestions from the user community will be welcomed. As noted in the User Manual, the high and variable sky (and telescope) background in the infrared results in background flux levels on the detector which are often far larger than the astronomical signals which one is attempting to detect. In addition, the architecture of infrared arrays is one of independently read out pixels, rather than the charge transfer utilized with CCDs. Dead or hot pixels (with high dark current) therefore show up as isolated features on infrared images. As with CCDs, observations of a uniformly illuminated target (flatfields) are used to calibrate the pixel sensitivity function of the images. Both the high sky background and the problem of isolated dead or hot pixels are addressed by taking multiple images of a field, moving the telescope a small distance between integrations. This technique, referred to as nodding or dithering, results in sampling a target at several locations on the array, so the effects of bad pixels can be minimized. Except in very crowded fields or those with extended structure, one is also measuring the sky level on every pixel by moving the sources around after each individual exposure. 2.0 Data Preparation During a night of observing, one will generally obtain the following types of observations: 1. Flatfields: We recommend a series of dome flats in each of the filters used, at least 10 each with the lights on and an equal number with the lights off. The latter will serve as the bias and dark subtraction. One can also generate sky flats using sky frames generated from the observations and a series of darks of the same integration time. Sky flats may be more used for reduction in the H and Ks filters, where there is significant thermal background. One may also use twilight observations for sky flats in the J filter. Nighttime observations in the narrowband filters will generally not accumulate sufficient flux for high S/N sky flats, and even twilight flats in the narrowband filters must be WHIRC Data Reduction Manual Version 1.03, 2009 August 24 3
4 obtained within a fairly narrow time window. We strongly suggest that observers who generate sky flats also obtain dome flats as a backup. 2. Science Observations: These can be a series of dithered observations on the source field (for standards and pointlike sources) or a set of dithered observations on the source and a set of dithered observations at an off-source sky location. 3. Darks: These are not really required for data reduction, because the process of sky subtraction will also subtract out any dark current or bias structure. However, a series of at least 10 short (5 s) darks is a useful diagnostic for evaluating the read noise. If one generates sky flats, darks at the same integration time are needed. 2.1 Initial Steps Independent of the reduction platform or individual techniques used for reduction, there are several steps which should be carried out on all of the data frames prior to any reduction. 1. Trimming: The raw data frames are pixels in size, with 96 columns of reference pixels (Fig. 2.1) on the right side and two rows at the top which are presently of no use and will just make things ugly during the reduction. We suggest trimming these off of all of the data frames; e.g., imcopy *.fits[1:2048,1:2048] *.%fits%tr.fits% Figure 2.1: Raw Ks band image before (left panel) and after (right panel) trimming. There is one bad column [97] and row [286] on the detector. The bright spot in the center of the field is the pupil ghost. WHIRC Data Reduction Manual Version 1.03, 2009 August 24 4
5 2. Scaling: If any of the data were taken with Fowler-4 mode, the pixel values must be normalized by a factor of 4 prior to any linearity correction. The Fowler-4 mode adds all of the four readouts but does not divide by 4 to avoid possible noise digitization in the integer output format. So for the Fowler-4 data only: will do this in place. imarith *.tr.fits / 4. *.tr.fits A safer way to do this is to write all of the data to a list, generate a list of the Fowler samples for all of the data, then divide: files *.tr.fits > trlist fowler yes > flist / 3. Linearity correction: As the wells in the array fill up, the gain changes slightly, resulting in a slightly sublinear response, which is approximately 4% at ADU. We have carried out a quadratic fit to the linearity function for 0.7 v bias up to a value of ADU. By inverting this function, one can derive a linearity correction function so that the corrected signal S is related to the raw signal S by S = S * (A + B*S + C*S 2 ), where A = A = B = B = C = C = The IRAF task irlincor is specifically designed to carry out this correction; the coefficients A, B and C above are the irlincor values. It is critical that linearity correction be performed on the raw data, prior to any sky or dark subtraction, but after any scaling for multiple Fowler sampling. Do an epar irlincor and enter the above values for A, B, and C into the parameter file (control-d to exit), then irlincor *.tr.fits *.%tr%lc%.fits 4. At this point you will have three sets of data; you may want to archive the original raw data somewhere, and the trimmed (.tr.fits) data can be deleted; the trimmed/scaled/linearized data (.lc.fits) will be used for reduction. 5. The IRAF script wprep.cl, which can be downloaded from the WHIRC web page, will automatically carry out all of these steps. In addition, it will check the ROTOFF value in the image header and recalculate the WCS parameters so that the sky coordinates are WHIRC Data Reduction Manual Version 1.03, 2009 August 24 5
6 correctly displayed on the image display. ROTOFF is normally 0.0, but at some telescope orientations, the WIYN instrument rotator has to rotate by 180 degrees because of the limited cable loop. Also, observers may intentionally rotate the instrument to a non-cardinal orientation to fit an elongated target onto the array. These offsets are properly recorded in the ROTOFF keyword, but not in the raw image display at the telescope. After executing wprep.cl, the celestial coordinates will be properly oriented on the image. 5.1 Download the script wprep.cl from the WHIRC webpage and put it in a directory such as the IRAF home directory containing the login.cl file (e.g., /home/user/iraf). 5.2 Edit the loginuser.cl file to source the task when IRAF is started up: task wprep = /home/user/iraf/wprep.cl 5.3 Put the raw WHIRC images into a list (e.g., files *.fits > inlist). We strongly recommend that you keep a backup copy of the raw images prior to any reduction, to be safe. 5.4 Execute the script with wprep. You will be prompted for the input data (@inlist in the present case) and the output data. One may create an output list of the same length as the input list, but with different image names (such as a different extension to the name), in which case one would enter the file name (@outlist). Alternatively, one can enter an extension (such as.wp), and the script will automatically create new output images with the basename extension appended. It is possible to execute the task in place (e.g., for both the input and output), but this will lead to confusion with the unprocessed raw data backup, which would have the same image names. 5.5 Images which have been processed with wprep.cl will have a keyword WPREP = 1 added to the header, so one can verify whether data have been processed. 5.6 One can also quickly verify the process by comparing imstats of the raw and processed data. The processed data will have fewer pixels ( vs ), and the maximum pixel value will be larger because of the linearity correction. In addition, data taken in Fowler-4 mode will be divided by Generating Dome Flats It is generally a good idea to run imstat on the flats just to identify any possible bad frames and eliminate them from the input data. 1. For each of the on/off sets in the filters, imcombine each set into a single image (e.g., flat.k.on, etc.). One can generally use average, with avsigclip rejection, although median should work as well. For the lamp on images, one can scale the images using the mean of a large subregion [500:1500,500:1500] to take out the effects of any drift in the lamp intensity during the observation. The lamp off data generally do not require scaling, since the numbers are small. WHIRC Data Reduction Manual Version 1.03, 2009 August 24 6

7 Figure 2.2: Flatfield images at Ks with the flat lamp on (left panel) and off (right panel). Note there is substantial thermal background flux even with the lamp off. 2. Subtract the lamp off from the lamp on image to yield a dark-bias subtracted flat. 3. It is useful to normalize the flats to 1.0 using a fairly large subregion such as [500:1500,500:1500] to keep the science data values from changing too much after the flatfielding operation. Since all data (science and calibrations) are divided by the same flat, the scaling integrity should be preserved. 4. It is also worthwhile to use the IRAF routine imreplace to eliminate very small or negative numbers from the flat so one does not get enormous numbers in the flatfielded science images. I typically use a replacement value of 1.0 and an upper limit of 0.02, keeping the lower level at INDEF. 5. Correct for artifacts if necessary. Since this procedure may apply to both dome flats and sky flats, this is discussed separately in section 2.4. At the end of this procedure, you will have a normalized flatfield for each of the filters. WHIRC Data Reduction Manual Version 1.03, 2009 August 24 7

8 Figure 2.3: Normalized flat for Ks (left panel) and J (right panel). The significant difference in the two emphasizes the need to obtain dedicated flats in each filter used for observing. The pupil ghost in the J band is much less prominent, but there is a noticeable fingerprint artifact, probably resulting from a defect in the antireflection coating on the array. Note that the bad column has been set to a value of 1.0 by imreplace. 2.3 Generating Sky Flats We have not yet determined whether sky flats or dome flats are better for data reduction. Except for the H and Ks bands, though, the nighttime sky flux is generally much too small to generate high S/N flats. We have generated J band twilight flats by taking a series of images once the sky level had fallen below the saturation level and combining them with scaling and a median algorithm, much as is done in the visible. In the Ks band, thermal background from the telescope and WTTM optics will contribute to the background and the pupil ghost, whereas the lights on lights off procedure for dome flats will subtract out this common signal. Since sky flats can be generated from the target observations, it is safer to get dome flats in any case. 1. Sky flats are best generated from a series of observations which give an appreciable (several thousand ADU) sky level. This pretty much restricts nighttime observations to the H and Ks filters. Twilight flats can be taken in the J and (perhaps) narrowband filters, but the rapid onset of twilight in the infrared leaves limited time for this procedure. H band sky flats may show fringing from the OH lines, which will complicate the process (section 2.4.3). 2. Take a series (~ 10) of dark frames (using the OPAQUE filter) at the same integration time as used for the observations being used to generate the sky flat; this will subtract out any bias and/or dark current. Average the dark frames, perhaps with average sigma clipping to prune out maverick pixel values. WHIRC Data Reduction Manual Version 1.03, 2009 August 24 8
9 3. Generate a sky image as described in section 3.1. Ideally, one should use a large number of images (10 or more), at more or less the same airmass, with several thousand ADU of background. 4. Subtract the averaged dark frame from the sky frame. Normalize and correct for artifacts as for the dome flats. 2.4 Artifact Removal WHIRC images contain several types of artifacts, some of which are intrinsic to the detector, others of which result from multiple reflections within the optics. Correction for these remains a work in progress, but some techniques are discussed in this section. Because infrared arrays utilize a unit-cell architecture, the pixels are effectively independent of each other, unlike those in a CCD Bad Pixels Like all arrays, the detector in WHIRC is not perfect and has several types of cosmetic imperfections. Some of these can be corrected to a degree during the data reduction High Dark Current Pixels These are scattered throughout the array, with certain areas, such as the upper right, having a higher concentration. These show up as bright pixels, particularly against a low background such as a dark or narrowband sky. These pixels may also be characterized as maverick pixels, since the signal is not necessarily proportional to the frame time, as a true dark current would be. The procedure of sky subtraction does seem to remove most of the elevated signal level, although the noise in these pixels may be higher than in others. Otherwise, there is no remedy for these artifacts Dimples A well-illuminated image such as a flat (Fig 2.3) shows numerous circular artifacts which appear to be dead pixels. However, closer inspection reveals that these are not dead, but areas of decreased response which appear to flatfield out reasonably well (Figs. 2.4, 2.5). The smooth variation evident in a cut through one of the dimples (Fig. 2.5) would make pixel correction algorithms (such as fixpix ) based on nearest neighbor averaging problematic. WHIRC Data Reduction Manual Version 1.03, 2009 August 24 9
 to within 1 2 %. Figure 2.")

10 Figure 2.4: Expanded subregion of H band image, showing some of the dimples on the detector (left panel). These are not dead pixels and appear to divide out using a flatfield (right panel) to within 1 2 %. Figure 2.5: Line plot through one of the dimples (left panel), illustrating that they are smoothly varying regions of decreased response. The same dimple after flatfielding shows that they divide out to within 1 2 % (right panel) Dead Pixels There are a number of unresponsive pixels in the array, including one row [286] and one column [97] and several clumps which appear to be digs or scratches in the detector surface. There are various techniques for making bad pixel maps described in the IRAF literature. One technique which seems to identify most of the dead pixels is to divide two flatfield images at the same filter and integration times at two different signal levels (either dome flats at different illumination levels or during a twilight sky flat sequence) and use imreplace to set the pixels deviating from what should be a narrow distribution to the bad pixel value in the image. Typically bad pixel maps utilize a value of 1 for bad pixels and 0 for good pixels. WHIRC Data Reduction Manual Version 1.03, 2009 August 24 10
11 In addition, one can generate a bad pixel file (which typically has a.pl extension) to identify specific pixels or regions which are bad. Each line in the file identifies the limits of the bad region by the values x1, x2, y1, y2; thus the entry identifies the region between columns 326 and 349 and rows 255 and 278 as bad. This technique is useful for identifying regions, such as PEDs (section ) which produce some signal and may not be completely identified through the flatfield ratio technique. IRAF reduction tasks will accept either a bad pixel image or file (or both) Photo-emitting Defects Photo-emitting defects (PEDs) are generally pixels which become shorted during the hybridization process. They draw significant current during the bias reset and emit light. PEDs are generally identified during the testing stage by the vendor and cauterized using a laser. This produces a region of limited sensitivity approximately 20 pixels in diameter, surrounded by a bright annulus. The WHIRC detector has at least two PEDs, centered near [337:266] and [839:1804]. The first of these appears to still emit some light and may be responsible for the region of elevated dark current known as the palmprint. Because these regions are not completely dead, the technique of generating a bad pixel image by the flatfield ratio technique does not seem to encompass the entire PED, so using a bad pixel file to identify these regions is good insurance Pupil Ghost As noted in section 2.2, WHIRC images feature a bright region near the center of the detector. This pupil ghost is a common feature of on-axis refractive optical imagers and is a result of multiple internal reflections within the optical train. Unlike the MOSAIC imager pupil ghost, which arises within the corrector and appears as a highly defocused image of the telescope exit pupil, the WHIRC ghost probably arises within both the collimator and camera optics and shows up as a broad central peak (Fig 2.3). Because the pupil ghost arises from the total background flux, it is seen in both sky and dome flat images. Under reasonably constant sky background conditions, the technique of sky subtraction will effectively remove the pupil ghost from the science data. However, the lights on lights off technique for producing dome flats will subtract off dark current and any common-mode signal, such as thermal emission from the telescope and WTTM optics in the K band, but not the pupil ghost from the flatfield lights. As a result, the pupil ghost appears in the reduced flat. Because, this does not represent a true response peak, using a flatfield with the pupil ghost will result in an artificially reduced signal level in the central region of the detector. It is therefore necessary to remove this artifact for accurate calibration of science data. The IRAF package mscred, designed for reducing MOSAIC data, has routines for modeling the pupil ghost and removing it from the data. Unfortunately, the modeling task works only for ghosts with a central obscuration, as seen with MOSAIC, and is not effective for the centrally peaked WHIRC ghost. Applying a smoothing function using a WHIRC Data Reduction Manual Version 1.03, 2009 August 24 11

 may be an accurate template for the ghost (the J-band fingerprint lies well outside the region of interest).")
 Ratio of reduced dome flats in Ks and J.")
12 task such as fmedian appears to be a reasonable approach, but a careful inspection of the flats in Fig. 2.3 shows a bright region in the vicinity of [1250:1250] which appears in both the J and Ks flats at the same apparent level, and probably represents a true response variation which must remain in the final flat. Since the pupil ghost is stronger at Ks than at J, the ratio of the reduced flatfields after bad pixel correction (Fig. 2.6a) may be an accurate template for the ghost (the J-band fingerprint lies well outside the region of interest). Isolating the central pixel region and smoothing with fmedian using a pixel box produces a promising pupil image template (Fig. 2.6b). Using gauss with sigma=31 gave a similar result; observers may want to try both of these strategies. Fig 2.6: (left panel) Ratio of reduced dome flats in Ks and J. Note that the bright region near [1250:1250] cancels out of the ratio, suggesting it is a response variation common to both wavelengths. (right panel) The central pixel region of the ratio, smoothed to 21 pixels using fmedian. Fig. 2.7: Dome flat for Ks before (left panel) and after (right panel) removal of bad pixels and the pupil ghost. Note the bright region near [1250:1250] remains. WHIRC Data Reduction Manual Version 1.03, 2009 August 24 12
13 The pupil template can then be used with the task mscred.rmpupil to remove the pupil ghost from the flat (Fig. 2.7). A representative pupil template (whircpupil.fits) can be downloaded from the WHIRC webpage, although observers may wish to create their own. The pupil mask (pupmask.pl, also on the webpage) is a four-line file which restricts the rmpupil task to the central pixel region. The outtype parameter should be set to sdiff since one is subtracting the ghost, and the 5 pixel smoothing for row and columns seems to be good. The extfit parameter should be set to (null) because the WHIRC files are not multi-extension FITS. Observational tests appear to verify this strategy to be effective in removing the effects of the pupil ghost (Appendix A) Fringes In at least three of the WHIRC filters (Paβ, Paβ45, and H), Newton s Rings fringes have been seen in on-sky images. These almost certainly arise from OH emission lines in the atmosphere and are thus not seen in dome flats (although they may appear in H band sky flats). The optical configuration within WHIRC which produces these fringes is not known, but they are textbook Newton s Rings centered at the same location on the detector in all filters where they are seen. The Paβ and Paβ45 fringes appear monochromatic, whereas the H band fringes show amplitude modulation suggesting several wavelengths are contributing (most likely the strong OH Q-branch lines in the H band). Unfortunately, unlike the pupil ghost, the fringe patterns differ for each filter in both spacing (wavelength-dependent) and phase. In addition, fringe patterns seen in a given filter appear to vary slightly in phase from one night to another. Therefore, one cannot use a generic template to attempt removal of the fringe pattern, but must use the data from the same night. Because the strength of the OH lines varies during the night, fringes may not be seen in the sky frame (see section 3.1) for any given target, but they may very well appear in a supersky generated from all of the observations during a given night. This is often the case in the H band; in the Paβ and Paβ45 filters, the fringes will almost always be prominent since the continuum sky background is negligible and science exposures tend to be long. The MOSAIC reduction task mscred.rmfringe appears to do a credible job of removing these fringes from the sky frame. As with the rmpupil task, one needs a template of the pattern, which will then be amplitude fitted to the fringes in the data and subtracted. Since a generic template cannot be used, one must generate the template from the science observations. Refer to sections 3.1 and 3.2 following, since the fringe removal will be carried out during these steps of the data reduction. It is logical to apply the fringe removal to the sky-subtracted data, since the sky subtraction may remove most, if not all, of the fringing, and it is generally preferable to reduce any artifacts to the extent possible before applying additional reduction steps. WHIRC Data Reduction Manual Version 1.03, 2009 August 24 13

![Since the sky level will probably be changing, one should scale the image using the median value of a large subregion such as [500:1500,500:1500].](/docs-images/82/85316628/images/14-1.jpg "Ideally, this will result in a sky image from which all of the stars have been eliminated. This may not work in extremely crowded fields.")
14 Generating the fringe template is similar to making a sky flat (without the flat), so one will require, in addition to the science data, a dome flat in the same filter and a series of darks taken at the same integration time as the science data. 1. Create a sky image using imcombine on all of the images in a given filter on each target field with median filtering. Since the sky level will probably be changing, one should scale the image using the median value of a large subregion such as [500:1500,500:1500]. Ideally, this will result in a sky image from which all of the stars have been eliminated. This may not work in extremely crowded fields. For very crowded fields or those containing an extended source, one should take dedicated sky observations (see section 3.1). If one observed several fields through the filter at the same integration time, one may generate a master sky image by imcombining all of these images; this may enhance the fringe visibility as well as increasing the S/N of the resulting frame. The result will look something like Fig. 2.8a. 2. Average the dark frames (as in making a sky flat, section 2.3) and subtract from the average sky frame (Fig. 2.8b). Figure 2.8: Average of sky images in the Paβ filter (left panel), showing evident fringes. After subtraction of dark frame (right panel). 3. At this point most of the dark current will be removed, except for occasional mavericks, but the frame still has the low spatial frequency structure and the central pupil ghost. Dividing by the dome flat and running fixpix with the bad pixel mask will remove most of the structure and clean up the image (Fig. 2.9a). 4. The fringe template for rmfringe has (ideally) a minimum value near zero, so one can at this point subtract off a constant value to achieve this. Running fmedian with a fairly small box (3 3) appears to enhance the S/N without affecting the spatial resolution of the template (Fig. 2.9b). WHIRC Data Reduction Manual Version 1.03, 2009 August 24 14

 Paβ sky image from Fig. 2.8b after dividing by a dome flat and cleaning up bad pixels. Some of the palmprint can still be seen.")

 and Paβ45 templates and the amplitude modulation in the H template. 5.")
15 For comparison, we show in Fig fringe templates for the Paβ45 and H filters, to show the need for filter and time-specific fringe information. While the Paβ45 pattern seems similar to the Paβ pattern, one can see a phase difference in the central fringe. The fringe visibility in the H band varies, suggesting that several emission lines contribute to the fringes. Figure 2.9: (left panel) Paβ sky image from Fig. 2.8b after dividing by a dome flat and cleaning up bad pixels. Some of the palmprint can still be seen. (right panel): After subtracting the background and smoothing, one has an adequate fringe template. The white blobs are probably artifacts from bright stars in the original images which were not completely removed by the median filtering. Figure 2.10: Fringe templates derived from sky data in the Paβ45 (left panel) and H (right panel) filters. Note the phase shift in the central fringe between the Paβ (Fig. 2.9b) and Paβ45 templates and the amplitude modulation in the H template. 5. Using the appropriate fringe template, the task rmfringe can then be used to remove the fringes. Figure 2.11 illustrates this for a H band sky on a night where fringing was WHIRC Data Reduction Manual Version 1.03, 2009 August 24 15
. 3.0 Data Reduction 3.1 Standards or Pointlike Objects 1.")
16 evident. In practice, one would operate on a sky-subtracted image, where the fringe pattern should be much less evident. Fig. 2.11: H band sky image (left panel) on a night when fringing was evident. After processing with the rmfringe task, the fringes are almost completely eliminated (right panel). 3.0 Data Reduction 3.1 Standards or Pointlike Objects 1. One will generally have several images of the field with different telescope pointings. Depending on the sky stability, the sky level may be somewhat different in each of the images. 2. Create a sky image using imcombe on all of the images in a given filter on each target field with median filtering, as described in section Since the sky level will probably be changing, one should scale the image using the median value of a large subregion such as [500:1500,500:1500]. Ideally, this will result in a sky image from which all of the stars have been eliminated. This may not work in extremely crowded fields. For very crowded fields or those containing an extended source, one should take dedicated sky observations (see below). 3. Inspect the sky image and if it looks OK, generate sky-subtracted images by subtracting the sky image from each of the original images. If the sky level had changed during the observation series, some of the sky levels may be positive, some negative. Keep going. Fringe removal, if necessary, can be done at this stage. 4. Divide each sky-subtracted image by the flat for that filter. This should result in images in which the (non-zero) sky level is uniform across the image. One can subtract WHIRC Data Reduction Manual Version 1.03, 2009 August 24 16
17 this offset out by measuring the median level of the image and subtracting that number. If one is doing aperture photometry, the sky level should be automatically subtracted during that process. 5. One may analyze the results from each image separately or combine them, using upsqiid or other custom routines. If making a large mosaic of images, distortion correction may be needed to ensure good overlap of the stars different images (section 3.3.2). 3.2 Extended Objects or Crowded Fields 1. As with the pointlike fields, one should have several dithered images of the science field, but also a set of dithered images taken at a not too distant sky position relatively devoid of stars. 2. Combine the off-target sky images as above using median filtering. 3. Subtract the sky image from each of the target images to yield the sky-subtracted image. 4. Flatfield the sky-subtracted images as above. 5. One may analyze the results from each image separately or combine them, using upsqiid or other custom routines. 3.3 Combining Images into a Mosaic For IRAF users, the upsqiid package written by Mike Merrill can be used to align and combine the images into a single image. This is primarily useful for deep imaging, where one is observing the same field with relatively small dither amplitudes, since it relies on locating star(s) common to all images for alignment. Although this package was written primarily for data from the 4-color imager SQIID, the routines for aligning and combining individual images into a mosaic are applicable for WHIRC images. A description of the upsqiid package, as well as instructions for downloading the package into IRAF, can be found at Three basic tasks which have been found useful for combining images are: xyget Find common stars in the images and create a registration database zget Find intensity offsets from overlap regions in the registration database nircombine Combine the registration database into a composite image For mosaics involving large dither amplitudes, distortion correction may be advisable to ensure proper overlap of the star images in different fields. See section for details. WHIRC Data Reduction Manual Version 1.03, 2009 August 24 17
 Sky image obtained by combining the nine input images with a median filtering algorithm. (lower left) Difference of the top two images.")

18 Figure 3.1: (upper left) Image of the NGC 7790 field at Ks, after trimming. This is one of nine images of the field, taken in a 3 3 grid with 50 arcsec spacing. (upper right) Sky image obtained by combining the nine input images with a median filtering algorithm. (lower left) Difference of the top two images. Note that the sky subtraction reduces the residual background to near zero. (lower right) After flatfielding, the nine images are combined into a single composite using the upsqiid package. Note that the noise is higher in the periphery of the image where only a single image contributes to the mosaic. Combining images with extended nebulosity may require some individualized fine tuning of the intensity levels, since the algorithm used in the zget task uses the statistics of the common overlap area. While this should in theory produce good matching at the periphery of overlapped regions, sometimes it is necessary to tweak the levels in the individual images to get a better match. Even with perfect matching of the intensity levels, one can detect the overlap transitions because the noise will be lower in the central parts of the mosaic, where more images were combined. WHIRC Data Reduction Manual Version 1.03, 2009 August 24 18
 Sky image obtained by combining the five images of a nearby sparse field with a median filtering algorithm. (lower left) Difference of the top two images.")
 After flatfielding, the five images are combined into a single composite using the upsqiid package.")

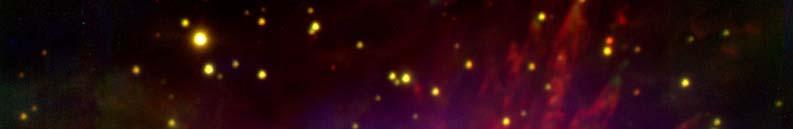
19 Figure 3.2: (upper left) Image of the M42 field in the narrowband H2 filter, after trimming. This is one of five images of the field, taken in a plus pattern with 50 arcsec spacing. (upper right) Sky image obtained by combining the five images of a nearby sparse field with a median filtering algorithm. (lower left) Difference of the top two images. Note that the sky subtraction reduces the residual background to near zero. (lower right) After flatfielding, the five images are combined into a single composite using the upsqiid package. Note that the noise is higher in the periphery of the image where only a single image contributes to the mosaic. This image is displayed using a logarithmic scaling to bring out faint details. Observations courtesy M. Meixner Larger Mosaics Maps covering a larger area may be generated using the more generic IRAF tasks in the noao.imred.irred package. In particular, the tasks irmosaic, iralign and irmatch2d can be used in a manner analogous to the upsqiid tasks noted above, except that the iralign task WHIRC Data Reduction Manual Version 1.03, 2009 August 24 19
20 works in the overlap region between two adjacent images only. The only precondition is that the input images have some spatial overlap with their neighbors. The irmosaic task combines the input images into a single N x M mosaic, in the same geometry that they were taken on the sky. One then uses iralign to identify pairs of stars common to adjacent images until all nearest neighbors have been matched. The separations between these stars in the mosaic image is written to a database. The irmatch2d task shifts the images in the original mosaic to that the adjacent stars match up, creating a single composite image. NOTE: Because WHIRC is designed to exploit the good seeing at WIYN, particularly once WTTM is operational, it is expected that it will be used mostly for deep mapping of relatively small areas. Other instruments, such as NEWFIRM, are better suited to widefield surveys Distortion Correction Because WTTM utilizes off-axis reflective optics, the plate scale is different in the x and y coordinates on the detector ( and arcsec/pixel, respectively). In addition, there is a small amount of field distortion at the input to WHIRC. The distortion is asymmetric (keystone) and is less than 1%. The additional distortion from WHIRC is very small and is negligibly dependent on wavelength. During the design of WHIRC, the entire optical system (WIYN telescope, WTTM, and WHIRC) was modeled using Zemax, and optical distortion maps were generated in the J, H, and Ks filters. These files were used as input to the IRAF routine geomap to generate third-order polynomial fits with an rms error ~ 0.1 pixel. The files whirc.distort.<filter>.txt and whirc.distort.<filter>.db produced by geomap can be downloaded from the WHIRC webpage and used in the routine geotran to produce distortion-corrected images which can then be combined into a large mosaic with good registration to the edges of the field (Fig. 3.3). The chromatic effects on distortion are extremely small, so the distortion files are almost identical. NOTE: Because geotran remaps each pixel slightly, one should carry out the distortion correction on images which have already been processed by sky subtraction and flatfielding. We have not investigated the effects of distortion correction on surface brightness measurements of extended sources. The geotran routine should preserve flux when the fluxconserve flag is set to yes. Until we gain more practical experience in quantitative evaluation, we suggest that observers be conservative, or at least cognizant, of the potential effects of distortion correction on photometry. Programs utilizing deep imaging of a small field using small dither amplitudes probably do not require correction. Imaging over a more extended field, even with small dither amplitudes, may benefit from distortion correction when using PSF-fitting photometry. WHIRC Data Reduction Manual Version 1.03, 2009 August 24 20
21 Figure 3.3: Mosaic of five images of the M13 field in the H band. The images, offset by 50 arcsec in a + pattern, were corrected using geotran prior to mosaicking. The 2MASS point source catalog is overlaid on the field. Except for multiple sources mistakenly cataloged as a single 2MASS source, the positional fit is excellent to the edge of the field. WHIRC Data Reduction Manual Version 1.03, 2009 August 24 21
22 4.0 Appendices 4.1 Appendix A Observational Test of Pupil Ghost Removal On the (apparently) photometric night of 9 July 2009 UT we tested the pupil ghost removal technique described in section by sampling a region approximately 80 arcsec square centered on the array. An arbitrary star (Ks ~ 11) on the outskirts of M13 was measured using four 5 5 dither sequences of amplitude 10 arcsec, each of which was offset by 18 arcsec in both RA and DEC from the center of the array in the four possible directions. This gave high spatial sampling of the area around the center of the pupil ghost (approximately [1032:1002] on the array). The experiment was done in the Ks filter where the pupil ghost is most pronounced. The focus was checked between each of the four sequences to ensure that the image quality did not drift significantly during the experiment; seeing was modest ( arcsec). Data reduction was done in the standard way. The 100 frames were median combined to generate a sky frame, which was subtracted from each of the input frames to yield the sky-subtracted images. Good quality dome flats in the J and Ks filters were obtained using the standard lights on, lights off technique, subtracted and then corrected for bad pixels using the fixpix task and the WHIRC bad pixel mask. The flats were normalized using regions [400:600,400:1600] and [1400:1600,400:1600], which avoids the pupil ghost area, and any other pixels of value < 0.02 were set to 1.0 to avoid arithmetic blowup in the flattened images. These flats, which contain the pupil ghost, are referred to as the uncorrected flats. The template for removal of the pupil ghost was generated as follows: The normalized Ks and J band flats were ratioed to give a flat ratio image A new image with pixel value = 1.0 was generated with mkimage The central of the flat ratio image centered on the pupil ghost [625:1424,601:1400] was copied into the new image The image was smoothed using the gauss task with sigma = 31 Subtract 1.0 from the result to yield the pupil ghost template image The uncorrected flats were run through the rmpupil task using the pupil ghost template image as the pupil, and the pupil mask file pupmask.pl as the pupilmask to restrict the procedure to the central 600 pixels [725:1324,725:1324]. The parameter outtype was set to sdiff, since one is subtracting the ghost, and the column and line smoothing were set to 20. The resulting flats were the nopupil flats. WHIRC Data Reduction Manual Version 1.03, 2009 August 24 22
23 The sky subtracted images were flattened with both the uncorrected and nopupil flats, yielding three datasets of 100 images each: Sky-subtracted, unflattened images Uncorrected flattened images Pupil corrected flattened images The selected star was measured using apphot with a fairly large (4 arcsec diameter) aperture to minimize the effects of seeing or focus drifts for all three datasets. The X and Y coordinates were translated to radial distance from the pupil ghost center at [1032:1002]; this was used as the abscissa for plotting the measured signal levels (Fig. 4.1). The figure illustrates that the uncorrected flat does have the anticipated effect of reducing the point to point scatter in the measured flux, but introduces a very significant (0.15 mag) systematic artifact as a result of the pupil ghost. The additional illumination in the ghost results in signal levels which are too faint. The bottom panel of the figure demonstrates that the pupil removal procedure has effectively eliminated this artifact. The rms scatter in the pupil-corrected flattened images (0.024 mag) is significantly less than that in the unflattened images (0.035 mag), but is still larger than earlier tests with a 9 x 9 raster of a standard star field had yielded. The current experiment of measuring 100 positions over a 40 minute time frame does make assumptions about photometric stability over this time frame during a time of year not known for clear weather. A plot of the data with time (Fig. 4.2) does appear to show some systematic variation, as well as a slope which is probably a result of atmospheric extinction (Δz ~ 0.2) during the sequence. The p-p scatter around a low-order fit is ~ mag, equivalent to an rms ~ mag. An alternative approach is to image a field which is sufficiently crowded to spatially sample the area within and around the pupil ghost, as this would not be sensitive to changes in sky transparency. Unfortunately, real-life stellar fields of sufficient density are usually confusion limited with many fainter sources contributing a background which calls into question the photometric reliability of relatively coarse resolution surveys such as 2MASS. WHIRC Data Reduction Manual Version 1.03, 2009 August 24 23
24 Figure 4.1: Plots of the magnitude of a Ks ~ 11 star measured in a 4 arcsec aperture using the IRAF task apphot over a 10 x 10 raster centered on the WHIRC pupil ghost. The magnitude scale is not calibrated to a photometric standard. The same dataset is plotted for the sky-subtracted, unflattened data (top panel), data flattened with no correction for the pupil ghost (middle panel), and data flattened with correction for the pupil ghost (bottom panel). WHIRC Data Reduction Manual Version 1.03, 2009 August 24 24
25 Figure 4.2: The pupil-corrected flattened data from the lower panel of Fig. 4.1, but plotted as a function of time, in the order the data were obtained. The line is a linear fit to the data and probably represents atmospheric extinction, since the airmass increased over the span of the observations by approximately WHIRC Data Reduction Manual Version 1.03, 2009 August 24 25
The IRAF Mosaic Data Reduction Package
 Astronomical Data Analysis Software and Systems VII ASP Conference Series, Vol. 145, 1998 R. Albrecht, R. N. Hook and H. A. Bushouse, eds. The IRAF Mosaic Data Reduction Package Francisco G. Valdes IRAF
Cross-Talk in the ACS WFC Detectors. II: Using GAIN=2 to Minimize the Effect
 Cross-Talk in the ACS WFC Detectors. II: Using GAIN=2 to Minimize the Effect Mauro Giavalisco August 10, 2004 ABSTRACT Cross talk is observed in images taken with ACS WFC between the four CCD quadrants
This release contains deep Y-band images of the UDS field and the extracted source catalogue.
 ESO Phase 3 Data Release Description Data Collection HUGS_UDS_Y Release Number 1 Data Provider Adriano Fontana Date 22.09.2014 Abstract HUGS (an acronym for Hawk-I UDS and GOODS Survey) is a ultra deep
Calibrating VISTA Data
 Calibrating VISTA Data IR Camera Astronomy Unit Queen Mary University of London Cambridge Astronomical Survey Unit, Institute of Astronomy, Cambridge Jim Emerson Simon Hodgkin, Peter Bunclark, Mike Irwin,
Optical Photometry. The crash course Tomas Dahlen
 The crash course Tomas Dahlen Aim: Measure the luminosity of your objects in broad band optical filters Optical: Wave lengths about 3500Å 9000Å Typical broad band filters: U,B,V,R,I Software: IRAF & SExtractor
Observation Data. Optical Images
 Data Analysis Introduction Optical Imaging Tsuyoshi Terai Subaru Telescope Imaging Observation Measure the light from celestial objects and understand their physics Take images of objects with a specific
Making a Panoramic Digital Image of the Entire Northern Sky
 Making a Panoramic Digital Image of the Entire Northern Sky Anne M. Rajala anne2006@caltech.edu, x1221, MSC #775 Mentors: Ashish Mahabal and S.G. Djorgovski October 3, 2003 Abstract The Digitized Palomar
A Guide to Reducing Near-IR Images
 A Guide to Reducing Near-IR Images Kenneth Hinkle NOAO Including contributions from Richard Joyce NOAO ABSTRACT This document reviews the steps needed to reduce near-infrared imaging data. Data from the
Astronomy 341 Fall 2012 Observational Astronomy Haverford College. CCD Terminology
 CCD Terminology Read noise An unavoidable pixel-to-pixel fluctuation in the number of electrons per pixel that occurs during chip readout. Typical values for read noise are ~ 10 or fewer electrons per
TIRCAM2 (TIFR Near Infrared Imaging Camera - 3.6m Devasthal Optical Telescope (DOT)
") TIRCAM2 (TIFR Near Infrared Imaging Camera - II) @ 3.6m Devasthal Optical Telescope (DOT) (ver 4.0 June 2017) TIRCAM2 (TIFR Near Infrared Imaging Camera - II) is a closed cycle cooled imager that has been
TIRCAM2 (TIFR Near Infrared Imaging Camera - II) @ 3.6m Devasthal Optical Telescope (DOT) (ver 4.0 June 2017) TIRCAM2 (TIFR Near Infrared Imaging Camera - II) is a closed cycle cooled imager that has been
Aperture Photometry with CCD Images using IRAF. Kevin Krisciunas
 Aperture Photometry with CCD Images using IRAF Kevin Krisciunas Images must be taken in a sensible manner. Ask advice from experienced observers. But remember Wallerstein s Rule: Four astronomers, five
OmegaCAM calibrations for KiDS
 OmegaCAM calibrations for KiDS Gijs Verdoes Kleijn for OmegaCEN & KiDS survey team Kapteyn Astronomical Institute University of Groningen A. Issues common to wide field imaging surveys data processing
CCD reductions techniques
 CCD reductions techniques Origin of noise Noise: whatever phenomena that increase the uncertainty or error of a signal Origin of noises: 1. Poisson fluctuation in counting photons (shot noise) 2. Pixel-pixel
Photometry. La Palma trip 2014 Lecture 2 Prof. S.C. Trager
 Photometry La Palma trip 2014 Lecture 2 Prof. S.C. Trager Photometry is the measurement of magnitude from images technically, it s the measurement of light, but astronomers use the above definition these
Photometry. Variable Star Photometry
 Variable Star Photometry Photometry One of the most basic of astronomical analysis is photometry, or the monitoring of the light output of an astronomical object. Many stars, be they in binaries, interacting,
WFC3 TV3 Testing: IR Channel Nonlinearity Correction
 Instrument Science Report WFC3 2008-39 WFC3 TV3 Testing: IR Channel Nonlinearity Correction B. Hilbert 2 June 2009 ABSTRACT Using data taken during WFC3's Thermal Vacuum 3 (TV3) testing campaign, we have
Properties of a Detector
 Properties of a Detector Quantum Efficiency fraction of photons detected wavelength and spatially dependent Dynamic Range difference between lowest and highest measurable flux Linearity detection rate
a simple optical imager
 Imagers and Imaging a simple optical imager Here s one on our 61-Inch Telescope Here s one on our 61-Inch Telescope filter wheel in here dewar preamplifier However, to get a large field we cannot afford
Southern African Large Telescope. RSS CCD Geometry
 Southern African Large Telescope RSS CCD Geometry Kenneth Nordsieck University of Wisconsin Document Number: SALT-30AM0011 v 1.0 9 May, 2012 Change History Rev Date Description 1.0 9 May, 2012 Original
The 0.84 m Telescope OAN/SPM - BC, Mexico
 The 0.84 m Telescope OAN/SPM - BC, Mexico Readout error CCD zero-level (bias) ramping CCD bias frame banding Shutter failure Significant dark current Image malting Focus frame taken during twilight IR
WFC3 Thermal Vacuum Testing: UVIS Broadband Flat Fields
 WFC3 Thermal Vacuum Testing: UVIS Broadband Flat Fields H. Bushouse June 1, 2005 ABSTRACT During WFC3 thermal-vacuum testing in September and October 2004, a subset of the UVIS20 test procedure, UVIS Flat
M67 Cluster Photometry
 Lab 3 part I M67 Cluster Photometry Observational Astronomy ASTR 310 Fall 2009 1 Introduction You should keep in mind that there are two separate aspects to this project as far as an astronomer is concerned.
INTRODUCTION TO CCD IMAGING
 ASTR 1030 Astronomy Lab 85 Intro to CCD Imaging INTRODUCTION TO CCD IMAGING SYNOPSIS: In this lab we will learn about some of the advantages of CCD cameras for use in astronomy and how to process an image.
High Contrast Imaging using WFC3/IR
 SPACE TELESCOPE SCIENCE INSTITUTE Operated for NASA by AURA WFC3 Instrument Science Report 2011-07 High Contrast Imaging using WFC3/IR A. Rajan, R. Soummer, J.B. Hagan, R.L. Gilliland, L. Pueyo February
Observational Astronomy
 Observational Astronomy Instruments The telescope- instruments combination forms a tightly coupled system: Telescope = collecting photons and forming an image Instruments = registering and analyzing the
FLAT FIELD DETERMINATIONS USING AN ISOLATED POINT SOURCE
 Instrument Science Report ACS 2015-07 FLAT FIELD DETERMINATIONS USING AN ISOLATED POINT SOURCE R. C. Bohlin and Norman Grogin 2015 August ABSTRACT The traditional method of measuring ACS flat fields (FF)
CCD Image Processing of M15 Images Estimated time: 4 hours
 CCD Image Processing of M15 Images Estimated time: 4 hours For this part of the astronomy lab, you will use the astronomy software package IRAF (Image Reduction and Analysis Facility) to perform the basic
ARRAY CONTROLLER REQUIREMENTS
 ARRAY CONTROLLER REQUIREMENTS TABLE OF CONTENTS 1 INTRODUCTION...3 1.1 QUANTUM EFFICIENCY (QE)...3 1.2 READ NOISE...3 1.3 DARK CURRENT...3 1.4 BIAS STABILITY...3 1.5 RESIDUAL IMAGE AND PERSISTENCE...4
What an Observational Astronomer needs to know!
 What an Observational Astronomer needs to know! IRAF:Photometry D. Hatzidimitriou Masters course on Methods of Observations and Analysis in Astronomy Basic concepts Counts how are they related to the actual
Wide-field Infrared Survey Explorer (WISE)
") Wide-field Infrared Survey Explorer (WISE) Latent Image Characterization Version 1.0 12-July-2009 Prepared by: Deborah Padgett Infrared Processing and Analysis Center California Institute of Technology
Wide-field Infrared Survey Explorer (WISE) Latent Image Characterization Version 1.0 12-July-2009 Prepared by: Deborah Padgett Infrared Processing and Analysis Center California Institute of Technology
Master sky images for the WFC3 G102 and G141 grisms
 Master sky images for the WFC3 G102 and G141 grisms M. Kümmel, H. Kuntschner, J. R. Walsh, H. Bushouse January 4, 2011 ABSTRACT We have constructed master sky images for the WFC3 near-infrared G102 and
Total Comet Magnitudes from CCD- and DSLR-Photometry
 European Comet Conference Ondrejov 2015 Total Comet Magnitudes from CCD- and DSLR-Photometry Thomas Lehmann, Weimar (Germany) Overview 1. Introduction 2. Observation 3. Image Reduction 4. Comet Extraction
Photometry of the variable stars using CCD detectors
 Contrib. Astron. Obs. Skalnaté Pleso 35, 35 44, (2005) Photometry of the variable stars using CCD detectors I. Photometric reduction. Š. Parimucha 1, M. Vaňko 2 1 Institute of Physics, Faculty of Natural
Cerro Tololo Inter-American Observatory. CHIRON manual. A. Tokovinin Version 2. May 25, 2011 (manual.pdf)
") Cerro Tololo Inter-American Observatory CHIRON manual A. Tokovinin Version 2. May 25, 2011 (manual.pdf) 1 1 Overview Calibration lamps Quartz, Th Ar Fiber Prism Starlight GAM mirror Fiber Viewer FEM Guider
Cerro Tololo Inter-American Observatory CHIRON manual A. Tokovinin Version 2. May 25, 2011 (manual.pdf) 1 1 Overview Calibration lamps Quartz, Th Ar Fiber Prism Starlight GAM mirror Fiber Viewer FEM Guider
DBSP Observing Manual
 DBSP Observing Manual I. Arcavi, P. Bilgi, N.Blagorodnova, K.Burdge, A.Y.Q.Ho June 18, 2018 Contents 1 Observing Guides 2 2 Before arrival 2 2.1 Submit observing setup..................................
Optical Imaging. (Some selected topics) Richard Hook ST-ECF/ESO
 Richard Hook ST-ECF/ESO") Optical Imaging (Some selected topics) http://www.stecf.org/~rhook/neon/archive_garching2006.ppt Richard Hook ST-ECF/ESO 30th August 2006 NEON Archive School 1 Some Caveats & Warnings! I have selected
Optical Imaging (Some selected topics) http://www.stecf.org/~rhook/neon/archive_garching2006.ppt Richard Hook ST-ECF/ESO 30th August 2006 NEON Archive School 1 Some Caveats & Warnings! I have selected
XMM OM Serendipitous Source Survey Catalogue (XMM-SUSS2.1)
") XMM OM Serendipitous Source Survey Catalogue (XMM-SUSS2.1) 1 Introduction The second release of the XMM OM Serendipitous Source Survey Catalogue (XMM-SUSS2) was produced by processing the XMM-Newton Optical
XMM OM Serendipitous Source Survey Catalogue (XMM-SUSS2.1) 1 Introduction The second release of the XMM OM Serendipitous Source Survey Catalogue (XMM-SUSS2) was produced by processing the XMM-Newton Optical
The predicted performance of the ACS coronagraph
 Instrument Science Report ACS 2000-04 The predicted performance of the ACS coronagraph John Krist March 30, 2000 ABSTRACT The Aberrated Beam Coronagraph (ABC) on the Advanced Camera for Surveys (ACS) has
Temperature Dependent Dark Reference Files: Linear Dark and Amplifier Glow Components
 Instrument Science Report NICMOS 2009-002 Temperature Dependent Dark Reference Files: Linear Dark and Amplifier Glow Components Tomas Dahlen, Elizabeth Barker, Eddie Bergeron, Denise Smith July 01, 2009
WFC3 TV2 Testing: UVIS Filtered Throughput
 WFC3 TV2 Testing: UVIS Filtered Throughput Thomas M. Brown Oct 25, 2007 ABSTRACT During the most recent WFC3 thermal vacuum (TV) testing campaign, several tests were executed to measure the UVIS channel
F/48 Slit Spectroscopy
 1997 HST Calibration Workshop Space Telescope Science Institute, 1997 S. Casertano, et al., eds. F/48 Slit Spectroscopy R. Jedrzejewski & M. Voit Space Telescope Science Institute, Baltimore, MD 21218
Simultaneous Infrared-Visible Imager/Spectrograph a Multi-Purpose Instrument for the Magdalena Ridge Observatory 2.4-m Telescope
 Simultaneous Infrared-Visible Imager/Spectrograph a Multi-Purpose Instrument for the Magdalena Ridge Observatory 2.4-m Telescope M.B. Vincent *, E.V. Ryan Magdalena Ridge Observatory, New Mexico Institute
Guide to the Imaging Observation with MOIRCS
 Guide to the Imaging Observation with MOIRCS For the Upgraded MOIRCS (since 2016) 2016-07-27 Introduction This document describes how to prepare an OPE file for Imaging Observation by MOIRCS. Please first
SPACE TELESCOPE SCIENCE INSTITUTE Operated for NASA by AURA
 SPACE TELESCOPE SCIENCE INSTITUTE Operated for NASA by AURA Instrument Science Report WFC3 2010-08 WFC3 Pixel Area Maps J. S. Kalirai, C. Cox, L. Dressel, A. Fruchter, W. Hack, V. Kozhurina-Platais, and
WEBCAMS UNDER THE SPOTLIGHT
 WEBCAMS UNDER THE SPOTLIGHT MEASURING THE KEY PERFORMANCE CHARACTERISTICS OF A WEBCAM BASED IMAGER Robin Leadbeater Q-2006 If a camera is going to be used for scientific measurements, it is important to
"Internet Telescope" Performance Requirements
 "Internet Telescope" Performance Requirements by Dr. Frank Melsheimer DFM Engineering, Inc. 1035 Delaware Avenue Longmont, Colorado 80501 phone 303-678-8143 fax 303-772-9411 www.dfmengineering.com Table
Stellar Photometry: I. Measuring. Ast 401/Phy 580 Fall 2014
 What s Left (Today): Introduction to Photometry Nov 10 Photometry I/Spectra I Nov 12 Spectra II Nov 17 Guest lecture on IR by Trilling Nov 19 Radio lecture by Hunter Nov 24 Canceled Nov 26 Thanksgiving
Errata to First Printing 1 2nd Edition of of The Handbook of Astronomical Image Processing
 Errata to First Printing 1 nd Edition of of The Handbook of Astronomical Image Processing 1. Page 47: In nd line of paragraph. Following Equ..17, change 4 to 14. Text should read as follows: The dark frame
Information for users of the SOAR Goodman Spectrograph Multi-Object Slit (MOS) mode. César Briceño and Sean Points
 mode. César Briceño and Sean Points") Information for users of the SOAR Goodman Spectrograph Multi-Object Slit (MOS) mode César Briceño and Sean Points CTIO, June 2014 The Goodman Spectrograph has been offered for use in MOS mode starting
Information for users of the SOAR Goodman Spectrograph Multi-Object Slit (MOS) mode César Briceño and Sean Points CTIO, June 2014 The Goodman Spectrograph has been offered for use in MOS mode starting
Photometric Calibration for Wide- Area Space Surveillance Sensors
 Photometric Calibration for Wide- Area Space Surveillance Sensors J.S. Stuart, E. C. Pearce, R. L. Lambour 2007 US-Russian Space Surveillance Workshop 30-31 October 2007 The work was sponsored by the Department
Astro-photography. Daguerreotype: on a copper plate
 AST 1022L Astro-photography 1840-1980s: Photographic plates were astronomers' main imaging tool At right: first ever picture of the full moon, by John William Draper (1840) Daguerreotype: exposure using
Scientific Image Processing System Photometry tool
 Scientific Image Processing System Photometry tool Pavel Cagas http://www.tcmt.org/ What is SIPS? SIPS abbreviation means Scientific Image Processing System The software package evolved from a tool to
New Bad Pixel Mask Reference Files for the Post-NCS Era
 The 2010 STScI Calibration Workshop Space Telescope Science Institute, 2010 Susana Deustua and Cristina Oliveira, eds. New Bad Pixel Mask Reference Files for the Post-NCS Era Elizabeth A. Barker and Tomas
Chasing Faint Objects
 Chasing Faint Objects Image Processing Tips and Tricks Linz CEDIC 2015 Fabian Neyer 7. March 2015 www.starpointing.com Small Objects Large Objects RAW Data: Robert Pölzl usually around 1 usually > 1 Fabian
WFC3 Thermal Vacuum Testing: UVIS Science Performance Monitor
 WFC3 Thermal Vacuum Testing: UVIS Science Performance Monitor H. Bushouse and O. Lupie May 24, 2005 ABSTRACT During WFC3 thermal-vacuum testing in September and October 2004, the UVIS28 test procedure,
GPI INSTRUMENT PAGES
 GPI INSTRUMENT PAGES This document presents a snapshot of the GPI Instrument web pages as of the date of the call for letters of intent. Please consult the GPI web pages themselves for up to the minute
Abstract. Preface. Acknowledgments
 Contents Abstract Preface Acknowledgments iv v vii 1 Introduction 1 1.1 A Very Brief History of Visible Detectors in Astronomy................ 1 1.2 The CCD: Astronomy s Champion Workhorse......................
A repository of precision flatfields for high resolution MDI continuum data
 Solar Physics DOI: 10.7/ - - - - A repository of precision flatfields for high resolution MDI continuum data H.E. Potts 1 D.A. Diver 1 c Springer Abstract We describe an archive of high-precision MDI flat
Flat Fields. S. Eikenberry Obs Tech
 Flat Fields S. Eikenberry Obs Tech 23 Sep 2014 Review median combination Basic algorithm: Read in im1, im2, im3,, im9 Loop over 1 array dimension, index i Loop over 2 nd dimension, index j imf(i,j)=median([im1(i,j),
ISIS A beginner s guide
 ISIS A beginner s guide Conceived of and written by Christian Buil, ISIS is a powerful astronomical spectral processing application that can appear daunting to first time users. While designed as a comprehensive
Observing*Checklist:*A3ernoon*
 Ay#122a:# Intro#to#Observing/Image#Processing# (Many&slides&today& c/o&m.&bolte)& Observing*Checklist:*A3ernoon* Set*up*instrument*(verify*and*set*filters,*gra@ngs,*etc.)* Set*up*detector*(format,*gain,*binning)*
WFC3/IR Channel Behavior: Dark Current, Bad Pixels, and Count Non-Linearity
 The 2010 STScI Calibration Workshop Space Telescope Science Institute, 2010 Susana Deustua and Cristina Oliveira, eds. WFC3/IR Channel Behavior: Dark Current, Bad Pixels, and Count Non-Linearity Bryan
WFC3 SMOV Program 11427: UVIS Channel Shutter Shading
 Instrument Science Report WFC3 2009-25 WFC3 SMOV Program 11427: UVIS Channel Shutter Shading B. Hilbert June 23, 2010 ABSTRACT A series of internal flat field images and standard star observations were
Image Processing Tutorial Basic Concepts
 Image Processing Tutorial Basic Concepts CCDWare Publishing http://www.ccdware.com 2005 CCDWare Publishing Table of Contents Introduction... 3 Starting CCDStack... 4 Creating Calibration Frames... 5 Create
WFC3/IR Bad Pixel Table: Update Using Cycle 17 Data
 Instrument Science Report WFC3 2010-13 WFC3/IR Bad Pixel Table: Update Using Cycle 17 Data B. Hilbert and H. Bushouse August 26, 2010 ABSTRACT Using data collected during Servicing Mission Observatory
A Guide to NEWFIRM Data Reduction with IRAF
 NOAO SDM Document A Guide to NEWFIRM Data Reduction with IRAF Mark Dickinson and Francisco Valdes National Optical Astronomy Observatory Science Data Management Draft version: 1 June 2009 NOAO Science
PACS data reduction for the PEP deep extragalactic survey
 PACS data reduction for the PEP deep extragalactic survey D. Lutz, P. Popesso, S. Berta and the PEP reduction team Herschel map making workshop Jan 28-31 2013 Ugly! Boring! how do we detect yet more of
New Bad Pixel Mask Reference Files for the Post-NCS Era
 Instrument Science Report NICMOS 2009-001 New Bad Pixel Mask Reference Files for the Post-NCS Era Elizabeth A. Barker and Tomas Dahlen June 08, 2009 ABSTRACT The last determined bad pixel masks for the
Chapter 2 DECam Imager
 Chapter 2 DECam Imager Version 0.0, Aug 2011 In This Chapter Instrument Overview... 2-1 Data Products... 2-7 Calibration.(TBD) Sources of Error.(TBD) References & Further Information 2-14 NOAO DATA The
Presented by Jerry Hubbell Lake of the Woods Observatory (MPC I24) President, Rappahannock Astronomy Club
 President, Rappahannock Astronomy Club") Presented by Jerry Hubbell Lake of the Woods Observatory (MPC I24) President, Rappahannock Astronomy Club ENGINEERING A FIBER-FED FED SPECTROMETER FOR ASTRONOMICAL USE Objectives Discuss the engineering
Presented by Jerry Hubbell Lake of the Woods Observatory (MPC I24) President, Rappahannock Astronomy Club ENGINEERING A FIBER-FED FED SPECTROMETER FOR ASTRONOMICAL USE Objectives Discuss the engineering
VERY LARGE TELESCOPE
 EUROPEAN SOUTHERN OBSERVATORY VERY LARGE TELESCOPE NAOS-CONICA Calibration Plan Doc. No. VLT-PLA-ESO-14200-2664 Issue 80 March 03, 2007 N. Ageorges, C. Lidman Prepared..........................................
WFC3/IR Cycle 19 Bad Pixel Table Update
 Instrument Science Report WFC3 2012-10 WFC3/IR Cycle 19 Bad Pixel Table Update B. Hilbert June 08, 2012 ABSTRACT Using data from Cycles 17, 18, and 19, we have updated the IR channel bad pixel table for
On spatial resolution
 On spatial resolution Introduction How is spatial resolution defined? There are two main approaches in defining local spatial resolution. One method follows distinction criteria of pointlike objects (i.e.
Exoplanet Observing Using AstroImageJ
 Exoplanet Observing Using AstroImageJ Dennis M. Conti Chair, AAVSO Exoplanet Section Copyright Dennis M. Conti 2017 1 AstroImageJ (AIJ) All-in-one freeware developed and maintained by Dr. Karen Collins
Southern African Large Telescope. RSS UW Commissioning Activities,
 Southern African Large Telescope RSS UW Commissioning Activities, 2014-1 Kenneth Nordsieck University of Wisconsin v 1.1 5 Nov, 2014 Change History Rev Date Description 1.0 3 Nov, 2014 Original 1.1 5 Nov,
Pixel Response Effects on CCD Camera Gain Calibration
 1 of 7 1/21/2014 3:03 PM HO M E P R O D UC T S B R IE F S T E C H NO T E S S UP P O RT P UR C HA S E NE W S W E B T O O L S INF O C O NTA C T Pixel Response Effects on CCD Camera Gain Calibration Copyright
Basic data reduction steps - a skeleton tutorial for HLCO (See also A Userʼs Guide to CCD Reductions with IRAF on class website)
") Basic data reduction steps - a skeleton tutorial for HLCO (See also A Userʼs Guide to CCD Reductions with IRAF on class website) Before you begin, make sure that you have your data properly organized.
Basic data reduction steps - a skeleton tutorial for HLCO (See also A Userʼs Guide to CCD Reductions with IRAF on class website) Before you begin, make sure that you have your data properly organized.
Temperature Reductions to Mitigate the WF4 Anomaly
 Instrument Science Report WFPC2 2007-01 Temperature Reductions to Mitigate the WF4 Anomaly V. Dixon, J. Biretta, S. Gonzaga, and M. McMaster April 18, 2007 ABSTRACT The WF4 anomaly is characterized by
A Test of non-standard Gain Settings for the NICMOS Detectors
 Instrument Science Report NICMOS 23-6 A Test of non-standard Gain Settings for the NICMOS Detectors Chun Xu & Torsten Böker 2 May, 23 ABSTRACT We report on the results of a test program to explore the
Flux Calibration Monitoring: WFC3/IR G102 and G141 Grisms
 Instrument Science Report WFC3 2014-01 Flux Calibration Monitoring: WFC3/IR and Grisms Janice C. Lee, Norbert Pirzkal, Bryan Hilbert January 24, 2014 ABSTRACT As part of the regular WFC3 flux calibration
Photometry using CCDs
 Photometry using CCDs Signal-to-Noise Ratio (SNR) Instrumental & Standard Magnitudes Point Spread Function (PSF) Aperture Photometry & PSF Fitting Examples Some Old-Fashioned Photometers ! Arrangement
SOAR Integral Field Spectrograph (SIFS): Call for Science Verification Proposals
: Call for Science Verification Proposals") Published on SOAR (http://www.ctio.noao.edu/soar) Home > SOAR Integral Field Spectrograph (SIFS): Call for Science Verification Proposals SOAR Integral Field Spectrograph (SIFS): Call for Science Verification
Published on SOAR (http://www.ctio.noao.edu/soar) Home > SOAR Integral Field Spectrograph (SIFS): Call for Science Verification Proposals SOAR Integral Field Spectrograph (SIFS): Call for Science Verification
CCD Characteristics Lab
 CCD Characteristics Lab Observational Astronomy 6/6/07 1 Introduction In this laboratory exercise, you will be using the Hirsch Observatory s CCD camera, a Santa Barbara Instruments Group (SBIG) ST-8E.
ObsAstro Documentation
 ObsAstro Documentation Release 0.1 Matthew Craig, Juan Cabanela & Linda Winkler February 18, 2014 Contents i ii Contents: Contents 1 2 Contents CHAPTER 1 Basic image statistics Contents: 1.1 Before you
ObsAstro Documentation
 ObsAstro Documentation Release 0.1 Matthew Craig, Juan Cabanela & Linda Winkler February 18, 2014 Contents 1 Basic image statistics 3 1.1 Before you begin.............................................
Bias errors in PIV: the pixel locking effect revisited.
 Bias errors in PIV: the pixel locking effect revisited. E.F.J. Overmars 1, N.G.W. Warncke, C. Poelma and J. Westerweel 1: Laboratory for Aero & Hydrodynamics, University of Technology, Delft, The Netherlands,
Annual Report on CCD Imaging at the OAN-SPM 2007
 Annual Report on CCD Imaging at the OAN-SPM 2007 Michael Richer & Alan Watson November 2007 1 Introduction This is a report on the state of CCDs and small telescopes of the OAN-SPM. It is based on measurements
WFC3 TV2 Testing: UVIS Shutter Stability and Accuracy
 Instrument Science Report WFC3 2007-17 WFC3 TV2 Testing: UVIS Shutter Stability and Accuracy B. Hilbert 15 August 2007 ABSTRACT Images taken during WFC3's Thermal Vacuum 2 (TV2) testing have been used
Persistence Characterisation of Teledyne H2RG detectors
 Persistence Characterisation of Teledyne H2RG detectors Simon Tulloch European Southern Observatory, Karl Schwarzschild Strasse 2, Garching, 85748, Germany. Abstract. Image persistence is a major problem
Stitching MetroPro Application
 OMP-0375F Stitching MetroPro Application Stitch.app This booklet is a quick reference; it assumes that you are familiar with MetroPro and the instrument. Information on MetroPro is provided in Getting
Light gathering Power: Magnification with eyepiece:
 Telescopes Light gathering Power: The amount of light that can be gathered by a telescope in a given amount of time: t 1 /t 2 = (D 2 /D 1 ) 2 The larger the diameter the smaller the amount of time. If
WFC Zeropoints at -80C
 WFC Zeropoints at -80C J. Mack, R. L. Gilliland, J. Anderson, & M. Sirianni May 2, 2007 ABSTRACT Following the recovery of ACS with the side-2 electronics in July 2006, the temperature of the WFC detector
Comparing Aperture Photometry Software Packages
 Comparing Aperture Photometry Software Packages V. Bajaj, H. Khandrika April 6, 2017 Abstract Multiple software packages exist to perform aperture photometry on HST data. Three of the most used softwares
Image Enhancement (from Chapter 13) (V6)
 (V6)") Image Enhancement (from Chapter 13) (V6) Astronomical images often span a wide range of brightness, while important features contained in them span a very narrow range of brightness. Alternatively, interesting
Image Enhancement (from Chapter 13) (V6) Astronomical images often span a wide range of brightness, while important features contained in them span a very narrow range of brightness. Alternatively, interesting
CCD Image Calibration Using AIP4WIN
 CCD Image Calibration Using AIP4WIN David Haworth The purpose of image calibration is to remove unwanted errors caused by CCD camera operation. Image calibration is a very import first step in the processing
A PSF-fitting Photometry Pipeline for Crowded Under-sampled Fields. M. Marengo & Jillian Neeley Iowa State University
 A PSF-fitting Photometry Pipeline for Crowded Under-sampled Fields M. Marengo & Jillian Neeley Iowa State University What, and Why Developed to extract globular cluster photometry for Spitzer/IRAC Carnegie
1.6 Beam Wander vs. Image Jitter
 8 Chapter 1 1.6 Beam Wander vs. Image Jitter It is common at this point to look at beam wander and image jitter and ask what differentiates them. Consider a cooperative optical communication system that
Department of Mechanical and Aerospace Engineering, Princeton University Department of Astrophysical Sciences, Princeton University ABSTRACT
 Phase and Amplitude Control Ability using Spatial Light Modulators and Zero Path Length Difference Michelson Interferometer Michael G. Littman, Michael Carr, Jim Leighton, Ezekiel Burke, David Spergel
6. Very low level processing (radiometric calibration)
") Master ISTI / PARI / IV Introduction to Astronomical Image Processing 6. Very low level processing (radiometric calibration) André Jalobeanu LSIIT / MIV / PASEO group Jan. 2006 lsiit-miv.u-strasbg.fr/paseo
Master ISTI / PARI / IV Introduction to Astronomical Image Processing 6. Very low level processing (radiometric calibration) André Jalobeanu LSIIT / MIV / PASEO group Jan. 2006 lsiit-miv.u-strasbg.fr/paseo
WHITE PAPER. Methods for Measuring Flat Panel Display Defects and Mura as Correlated to Human Visual Perception
 Methods for Measuring Flat Panel Display Defects and Mura as Correlated to Human Visual Perception Methods for Measuring Flat Panel Display Defects and Mura as Correlated to Human Visual Perception Abstract