GEOSPATIAL DATA CONTENT, ANALYSIS, AND PROCEDURAL STANDARDS FOR CULTURAL RESOURCES SITE MONITORING
|
|
|
- Hilary Sherman
- 6 years ago
- Views:
Transcription
1 GEOSPATIAL DATA CONTENT, ANALYSIS, AND PROCEDURAL STANDARDS FOR CULTURAL RESOURCES SITE MONITORING DRAFT by Elizabeth Burson 2001 Performed under contract with U.S. Army Corps of Engineers Vicksburg District 4155 Clay Street Vicksburg, Mississippi and U.S. Army Engineer Research and Development Center Building 8000, Room Halls Ferry Road Vicksburg, Mississippi Contract No. DACW38-98-D-0003 Delivery Order No MISCELLANEOUS REPORTS OF INVESTIGATIONS NUMBER 218 Geo-Marine, Inc. 550 East 15th Street Duane E. Peter Plano, Texas Principal Investigator GMI Project # 1003-A11
2 TABLE OF CONTENTS ACKNOWLEDGMENTS... viii 1. INTRODUCTION...1 Overview of Goals and Needs...1 Industry Experts...3 An Introduction to Photogrammetry...4 Photogrammetry History and Development SOFTCOPY PHOTOGRAMMETRIC METHOD AND PROCESS...7 Processing Digital Imagery...8 Typical Softcopy Photogrammetry...11 Close-Range Softcopy Photogrammetry...11 Hybrid 3D Scanning...13 Two-Dimensional Photogrammetry and Single-Image Registration PHOTOGRAMMETRY IN CULTURAL RESOURCES...16 Parameters in Choosing System and Methods...18 Skill and Usability...18 Cost...19 Flexibility...19 Accuracy EXISTING DATA CONTENT STANDARDS: THEIR APPLICABILITY TO CULTURAL/NATURAL RESOURCE SITE MONITORING...22 CIPA (ICOMOS/ISPRS) Standards...23 ASPRS Standards...25 NPS Standards...27 FGDC Standards...27 Coordinate System and Datums...28 Data Quality DEVELOPMENT OF INDUSTRY STANDARDS FOR OBTAINING FIELD AND LABORATORY PHOTOGRAPHS...32 Field Documentation...34 Recommended Two-Dimensional Rectification Techniques...35 ii
3 Table of Contents (cont d) Recommended Two-Dimensional Rectification Workflow...36 Camera Set-Up...37 Control...37 Image Capture...37 Measurement...37 Computer Processing...37 Recommended Two-Dimensional Rectification Equipment...38 Three-Dimensional Photogrammetry...39 Recommended Stereo Photogrammetry Techniques...40 Recommended Stereo Photogrammetry Workflow...41 Camera Calibration...41 Scaffolding...41 Control...42 Image Capture...42 Measurement...43 Computer Processing...44 Recommended Stereo Photogrammetry Equipment Specifications...47 Recommended Multistation Monoscopic Convergent PhotogrammetryTechniques...47 Recommended Multistation Monoscopic Convergent Photogrammetry Workflow...48 Control...48 Image Capture...49 Measurement...49 Computer Processing/Model Production...49 Recommended Multistation Monoscopic Convergent Photogrammetry Equipment Specifications...50 Lasergrammetry for Improved Geospatial Control...50 Laboratory Documentation...53 Recommended Stereo Photogrammetry Techniques...53 Recommended Stereo Photogrammetry Workflow...54 Camera Calibration...54 Control...55 Object Preparation...55 Image Capture...55 Computer Processing...56 Recommended Stereo Photogrammetry Equipment Specifications...56 Recommended Automated Convergent Photogrammetry Techniques...57 Recommended Automated Convergent Photogrammetry Workflow...59 Calibration...59 Image Capture...60 Computer Processing/Model Production...60 Recommended Automated Convergent Photogrammetry Equipment Specifications...61 Error Analysis...61 Single Image Registration...63 iii
4 Table of Contents (cont d) Stereo Photogrammetry...63 Multistation Monoscopic Convergent Photogrammetry...64 Hybrid 3D Scanning DEVELOPMENT OF STANDARD PROCEDURES FOR ANALYSIS OF GEOSPATIALLY REFERENCED PHOTOGRAPHY...67 Techniques...67 Workflow STANDARDIZED METHODS FOR STORAGE AND INDEXING OF GEOSPATIALLY REFERENCED DATA IN A RELATIONAL DATABASE...73 Data Storage and File Serving...73 Recommended Data Schema, Features, Attributes, and Domains...74 Recommended Metadata SUMMARY RECOMMENDATIONS...79 Parameters...79 Summary Workflow Specifications...83 Conclusions...85 REFERENCES CITED...87 GLOSSARY...93 APPENDICES A: Expert Responses... B: NSSDA Accuracy Statistic Worksheets... C: Sample Triangulation Report, Orthobase... D: Resolution No. 2 Concerning Photogrammetric Archives... E: Optimal Practice in Archaeological Photogrammetry Surveys... F: FGDC Metadata Layout and Example... iv
5 LIST OF FIGURES 1. End lap and side lap of imagery along flight lines in aerial photography Ground control points visible in photographs and defined by x,y,z coordinates Relationship of object coordinates to image coordinates, showing omega, phi and kappa rotation angles An oriented block of stereo pairs, compiled from eight photographs and 18 control points (a) Stereo photography consisting of overlapping images along a flight line ; (b) multistation monoscopic convergent photography, consisting of images taken from all sides of an object towards the center Measurement precision and accuracy, where the center of the bull s eye is the true positional value Decision-making flow chart for the use of various photogrammetric approaches An excavated grave in situ (left), in the laboratory (center), and photogrammetrically rendered (right) (a) Rectified perpendicular photograph, using 12 GCPs; and (b) oblique photograph, using 18 GCPs Scaffolding supporting a flight-line over a target feature Image capture for stereo photogrammetric analysis The camera base/object distance concept Total Station used to survey grave location VirtualGIS view of the orthorectified image mosaic and DEM The Cyrax (operated by L3D Corp.) scanning a grave excavation, and the results The Freedman s Cemetery Memorial arch, photographed (left) and scanned (right) Camera mounts and structures designed by CAST: (a) mount for horizontal and vertical close-range stereo photography; and (b) vertical photography control structure A 5-cm long projectile point (left) and the scanning results (right) as a three-dimensional model in Rhino A Coca-Cola bottle with some mud, shown as a three-dimensional model in VRML format Four measurements collected, and two measurements shown as measured digitally Conducting quantitative analysis in the Rhino NURBS environment Quantitative analysis using Stereo Analyst within ESRI s ArcView application...71 v
6 List of Figures (cont d) 23. Sample file storage hierarchy for cultural resources tables SDS relational database dependencies and links, based on the media_id key Graphic illustration of parameters in selecting a photogrammetric approach: (a) object sizes and complexity conducive to each photogrammetric approach; (b) object sides necessary for model production and dimensional complexity of models; and (c) relative accuracy and software cost...82 vi
7 LIST OF TABLES 1. The CIPA 3x3 Rules for Close-Range Photogrammetric Field Recordation Selected Classes of Photogrammetric Information and Attributes ASPRS Class 1 Horizontal Positional Accuracy Standards for Large Scale Maps Entities, Tables, and Join Fields for Cultural Resources Imagery Comparison of Photogrammetry Approaches for the Field and Laboratory...80 vii
8 ACKNOWLEDGMENTS The author wishes to acknowledge several people for their guidance during the project. Duane Peter, Vice President of Cultural Resources, Geo-Marine, Inc. (GMI), provided resources and advice throughout. Andy Zusmanis and ERDAS in general offered great assistance for some aspects of the research. Christopher Dore of Archaeological Mapping Specialists, Peter Borges of Documenta Architectural Photogrammetry, and Tony O Dempsey of ESRI South Asia were especially helpful through relating their own experience. Melissa Green and Steve Hunt, both from GMI, and Eva Bunker offered constructive criticism and logical arguments. Mr. Hunt also assisted in equipment setup for the pilot projects. Peter Gehring of GMI produced some illustrations, helped in photogrammetric trials, provided advice and criticism, and contributed to the discussion of data structure. Denise Pemberton formatted and produced the report. viii
9 CHAPTER 1 INTRODUCTION OVERVIEW OF GOALS AND NEEDS Most archaeologists currently use a combination of photography, hand drawings, and survey to record and interpret cultural resources sites, features, and artifacts. Increasingly, archaeologists are incorporating digital technologies such as geographic information systems (GIS), computer aided design (CAD), remote sensing, and virtual reality into their repertoire. By applying digital technologies to archaeological recordation, archaeologists stand to greatly improve the quality and accessibility of their data. The U.S. Army Corps of Engineers CADD/GIS Technology Center hopes to establish recording standards for geospatial photogrammetric documentation methods for documenting complex three-dimensional archaeological and architectural features. Geo-Marine, Inc. (GMI), of Plano, Texas was contracted to research and develop such standards. There is a growing need for efficient, effective, and economical recordation methodologies. Many Department of Defense (DOD) military installations and the U.S. Army Corps of Engineers Civil Works activities require compliance issues involving documentation of archaeological features, rock art panels, and artifacts to be repatriated in order to satisfy the requirements of the National Environmental Policy Act, the National Historic Preservation Act, and the Native American Graves Protection and Repatriation Act. Traditional recording methodologies, such as photography and illustrations, meet recording requirements; however, these approaches do not provide the accuracy or efficiency of digital photogrammetric methodologies and related geospatial technologies. The recordation of complex, geospatially referenced, three-dimensional features is tedious, time-consuming, and labor intensive with traditional methods such as hand 1
10 sketches and paper forms. These traditional methods also fail to provide analysts an easily accessible medium for comparative purposes. Therefore, the development of standards for recordation is imperative for the development of long-term, comparative geospatial databases. This project will ensure that through automation, the various cultural resource compliance requirements can be met in an efficient and cost-effective manner. Criteria for recommended digital photography, photogrammetric methodologies, and related geospatial technologies include:! accuracy, efficiency, and cost-effectiveness! ability to record complex, geospatially referenced, three-dimensional features! wide accessibility to clients, analysts, and others! long-term comparative geospatial databasing Following these guidelines, GMI has researched and developed a set of recommended standards through literature reviews, interviews with experts worldwide, and research and experimental studies using a variety of techniques. Although the superiority of high-end equipment such as expensive software and metric cameras is acknowledged, the object of this study is to identify cost effective digital solutions for non-photogrammetrists, and is therefore limited to low- to moderately-priced, user-friendly equipment. The following document presents a general explanation of the technology of photogrammetry, the various approaches currently available to cultural resources managers, existing content standards, and recommended standards for recordation, processing, analysis, and storage. These topics were established within the project scope as five explicit tasks, listed below. Task 1. Research, review, and document existing industry data content standards for digital geospatial photogrammetry in cultural resources, by consulting industry experts, if they exist. The results of this research are described in Chapters 4 and 8. 2
11 Task 2. Research, review, document, and adapt industry standard workflows for obtaining field and laboratory digital geospatial photogrammetry. Provide recommended procedures, equipment specifications and error analysis of the procedures. The results of this research are described in Chapters 5 and 8. Task 3. Research, review, document, and adapt industry standard techniques, workflows, and procedures for analyzing geospatially referenced photography of cultural resource objects. The results of this research are presented in Chapters 6 and 8. Tasks 4 and 5. Develop a standardized method for storing and indexing the geospatially referenced photography in a relational database, compliant with the Spatial Data Standards (SDS) model, including schema. Recommend any modifications to the Cultural and Natural Entity Sets in the current SDS structure. The results of this research are presented in Chapter 7. INDUSTRY EXPERTS A number of industry experts were contacted for guidance in developing content standards and standard methods for digital geospatial photography and cultural resources. These experts fell into two basic categories: archaeologists experimenting with photogrammetry, and photogrammetrists conducting cultural resources documentation. An attempt was made to gather responses from representatives of private, academic, and governmental entities, in order to present a cross-section of cost, accuracy, flexibility, and skill levels; however academic photogrammetrists and private archaeology and photogrammetry firms were much more likely to participate in the survey than government agencies. A total of 19 experts were contacted around the world. Of these, seven were professors in geomatics or photogrammetry at universities, nine were representatives of private photogrammetry or related geospatial technology firms, two were employees of federal natural resources agencies, and one was both a university professor and owner of a private firm. Several of the experts contacted did not reply to repeated requests for participation, and several were dropped from the survey after initial interviews, due to lack of an in-depth understanding of the topic. The remaining eight experts represent a range of backgrounds, experience, and needs. Their input helped shape the direction of the research 3
12 presented in this document, and occasionally their opinions are directly referenced in the text. Their names, affiliation, and responses to 10 simple questions are presented in Appendix A. AN INTRODUCTION TO PHOTOGRAMMETRY The American Society for Photogrammetry and Remote Sensing defines photogrammetry as the art, science, and technology of obtaining reliable information about physical objects and the environment through processes of recording, measuring, and interpreting photographic images and patterns of recorded radiant electromagnetic energy and other phenomena (Wolf and DeWitt 2000). Put simply, photogrammetry involves the interpretation and analysis of features and scenes from photographs. In its broadest sense, photogrammetry includes both two-dimensional and three-dimensional analysis, and both quantitative and qualitative data extraction (Gisiger et al. 1996). For the purposes of this document, two-dimensional image analysis, while encompassed within the broader definition of photogrammetry, should be considered separately from more sophisticated three-dimensional analysis, because it cannot be fully geospatially referenced. During the past three decades the advent of powerful desktop computers and sophisticated viewing software has resulted in the increased popularity of digital or softcopy photogrammetry, which uses digital rather than analog images. Even more recently, photogrammetrists have begun developing the capability to capture and analyze close-range photography taken at both vertical and oblique angles. While the central principals of photogrammetry are universal, this examination will focus on softcopy photogrammetry technology, as well as related geospatial technologies such as emerging laser image capture devices and hybrid technology. The two primary approaches to softcopy photogrammetry, namely stereo photogrammetry and multistation monoscopic convergent photogrammetry, will both be discussed in depth. Related lasergrammetry technologies will also be evaluated, as they are having a significant impact on the development of close-range softcopy photogrammetry. 4
13 PHOTOGRAMMETRY HISTORY AND DEVELOPMENT Historically, photogrammetry has focused on the use of photographs in topographic mapping. Colonel Aimé Laussedat of the French Army Corps of Engineers did extensive research in this field in the 1850s, and his methods were soon adopted in the U.S. and Canada. In the early twentieth century, German photogrammetrist Carl Pulfrich introduced the concept of overlapping, or stereo, pairs of photographs. World Wars I and II brought extensive use of aerial photography to the field, and this continues to comprise the vast majority of photogrammetric work, both analog (hardcopy) and digital (Wolf and Dewitt 2000). Classic analog aerial photography is typically captured using a specially calibrated metric large format camera mounted on an airplane. The airplane follows a planned flight path made up of a series of parallel passes called flight strips (Figure 1). Each image in each flight strip overlaps the adjacent images on either end (end lap) and either side (side lap) by 30 to 60 percent. Aerial photography is usually captured vertically, but can also be taken at a low oblique or high oblique orientation, up to approximately a 45 degree angle. 1. End lap and side lap of imagery along flight lines in aerial photography Figure 1. End lap and side lap of imagery along flight lines in aerial photography. The resulting imagery consists of 9-x-9-inch film diapositives, each with a set of imprinted markers, called fiducials, around the edges. Two overlapping photographs can be viewed in stereo using a stereoscope, or with a stereoplotter. Using the stereoscope, the analyst examines adjacent images simultaneously, which makes parallactic angles evident in areas of overlap, thus permitting the user to perceive depth. 5
14 After photographic images have been captured, any internal distortion (within the camera) must be identified. This is done by comparing the locations of markers on the film, called fiducial marks, with the calibration data for the camera. Next, each photograph must be geo-referenced based on accurate control points visible in the photographs and measured precisely on the earth s surface. After registration, the actual ground dimensions of any two overlapping images can be measured and analyzed by the operator. Analog stereo photogrammetry is still frequently used, though it requires expensive equipment and significant training. However, the introduction of softcopy photogrammetry has caused a shift in production methods and expectations in the field of photogrammetry. Softcopy photogrammetry, which is conducted digitally using a desktop computer, provides faster, easier, and more thorough processing, and costs less than typical analogue methods. It is also more flexible than earlier methods, while at the same time automating many time-consuming functions, making it a desirable tool for photogrammetrists and non-photogrammetrists alike. 6
15 CHAPTER 2 SOFTCOPY PHOTOGRAMMETRIC METHOD AND PROCESS Softcopy photogrammetry refers to photogrammetric input, analysis, and output that are digital rather than analog. While the technology of softcopy photogrammetry was developed in the 1950s and 60s, the practice did not gain wide acceptance until the 1980s. Softcopy photogrammetry was initially developed to allow faster, more accurate, automated aerial photogrammetric mapping. Most softcopy applications are designed to be used by non-specialists with moderate training. Aerial imagery is still the primary focus of softcopy photogrammetry, but the automated and inexpensive qualities of the process have attracted a variety of other users. In softcopy photogrammetry, high-powered computer workstations replace stereoplotters, greatly reducing equipment costs. Technicians no longer view images through a stereoscope, but rather through the use of one of a variety of digital effects. For example, a polarizing computer screen and polarizing filter glasses can be used to toggle polarity between the operator s left and right eyes, alternating the display of left and right images to display a perceived stereo pair. Another approach uses LCD viewing glasses, which when synchronized with the refresh rate of the computer monitor, also alternates the display of the left and right images and creates a stereo display (Wolf and Dewitt 2000). The outstanding advantage of softcopy photogrammetry is automation. Sophisticated softcopy processing software can process large batches of overlapping imagery, applying error correction, aerial triangulation, and orthorectification, with less operator input than analog processing. Softcopy systems also usually allow a greater range of input devices, including metric and nonmetric still cameras, and a variety of image orientations, including horizontal and oblique 7
16 photography. Additionally, using softcopy photogrammetry has the advantage of taking into account the characteristics of a specific camera during processing, which can provide more accurate results (Gisiger et al. 1996). PROCESSING DIGITAL IMAGERY Softcopy photogrammetry begins with image capture. Vertical aerial imagery captured with a metric camera is the most easily processed. However, imagery from non-metric off-the-shelf (OTS) digital, film, and video cameras can also be used. At least two images are necessary to produce a stereo product, and at least three are needed for multistation monoscopic convergent photogrammetry, which is discussed later in this chapter. Accompanying each image must be basic camera information such as focal length. Digital imagery can be entered directly into softcopy photogrammetric software, but film images must first be scanned into digital format. Ground control points (GCPs) are necessary to transform the image coordinates into real world coordinates. These points must be clearly visible on the photographic image, and recorded to approximately the desired final accuracy of the photogrammetry product (Figure 2). Both horizontal (x,y) and vertical (z) values must be carefully measured. For topographic mapping, global positioning system (GPS) coordinates are usually used as GCPs, but for large-scale maps, survey lasers must be used. Interior orientation, the relationship of the image to the camera settings, must be performed after opening imagery within the photogrammetric software application. Interior orientation accounts for both camera settings and distortion within the image capture device. Focal length is taken into account, as well as film curvature in a film camera, or lens (radial) distortion in an off-theshelf camera. Camera calibration, an important component of interior orientation, can be done by a professional or fairly easily by the operator, simply by photographing a well-known object and observing distortion on the image. Free software, for instance Camera Calibration Toolbox for Matlab, is now available to aid in camera calibration. 8

17 2. Ground control points visible in photographs and defined by x,y,z coordinates Figure 2. Ground control points visible in photographs and defined by x,y,z coordinates. Once interior orientation has been completed, the GCPs are used to register the image s x,y film coordinates to their actual x,y,z ground locations, and to relate overlapping images to one another. This is called exterior orientation (or absolute orientation and relative orientation), and consists of defining six elements of location: x, y, and z, and rotation angles called omega, phi, and kappa (Figure 3). Generally 3-6 GCPs, or more in areas of high relief, must be identified in each image. Additional points providing only horizontal or vertical control coordinates, and tie points (shared identifiable features between images), also contribute to exterior orientation. Triangulation is then performed by the software to estimate the x,y,z locations of tie points, the position and rotation of each image in relation to others, and any residual sources of error (Figure 4). 9

18 3. Relationship of object coordinates to image coordinates, showing omega, phi and kappa rotation angles Figure 3. Relationship of object coordinates to image coordinates, showing omega, phi and kappa rotation angles. 4. An oriented block of stereo pairs, compiled from eight photographs and 18control points Figure 4. An oriented block of stereo pairs, compiled from eight photographs and 18 control points. 10
19 Orthorectification removes distortion in the imagery due to error and topographic relief displacement and gives a photographic image with the planimetric accuracy of a map. Orthorectified imagery is produced using a set of points gathered either automatically or by hand across the topography of the image. Because both horizontal and vertical coordinates must be calculated, this is generally done with stereo images so the operator can calculate the depth of each point. A surface is then generated from the points, creating a digital elevation model (DEM) of the terrain. This DEM, when applied to the photo imagery, results in orthorectified photographs, also called orthophotos. Typical Softcopy Photogrammetry Aerial photogrammetric mapping is still by far the prevailing application of softcopy photogrammetry. Using softcopy technology, oriented imagery can generate DEMs, which are extremely useful in topographic mapping, geographic information systems (GIS), and in the orthorectification of aerial photographic images. While many tedious processes in photogrammetric mapping have been automated in softcopy, photogrammetrists are currently attempting to further streamline and automate the softcopy process, developing reliable methods of automated feature extraction and more accurate triangulation. Close-Range Softcopy Photogrammetry Close-range softcopy photogrammetry, one of the fastest-growing fields of softcopy photogrammetry, describes photography taken within 300 m of the target. For the most part, close-range softcopy photogrammetry is more flexible than traditional aerial photogrammetry. Photos may be taken at almost any angle as in an example of horizontal close-range photogrammetry where a metric camera was used to survey building facades, with measurements to 2 cm in accuracy (Carbonnell 1989). Photos can be imported from almost any format, from still and video digital media to scanned photographs or historical photographs. As softcopy photogrammetry processing software becomes more sophisticated, less exterior and interior information is necessary to produce a quality photogrammetric model. In general, basic camera specifications and either a few xyz-referenced ground control points or several common tie-points between the images are all that is necessary. 11

20 The rise in popularity of close-range softcopy photogrammetry has helped develop two major approaches to close-range recordation. The first approach, called stereo close-range softcopy photogrammetry, closely resembles aerial softcopy photogrammetry. The second approach, multistation monoscopic convergent photogrammetry, relies on different input and processing, and produces a significantly different output. Both techniques have valid strengths and weaknesses, and are appropriate for different situations. The most widely known and researched form of close-range softcopy photogrammetry is stereo close-range softcopy photogrammetry, which, like traditional photogrammetry, uses overlapping images to simulate depth (Figure 5a). All the rules of more typical softcopy photogrammetry apply to its close-range equivalent. Photographs must be captured with appropriate side- and end lap, and a sufficient number of control points must be recorded to adequately orient the image. Camera characteristics and object distance are used to perform interior orientation. As with aerial mapping, a DEM is generated from points collected within a stereo view, then used to orthorectify the block of images. The resulting model resembles a topographic map, except that the topographic relief is a representation of the surface of an object or scene, rather than a geographic region. Since the operator cannot see underneath the scene, this method is often described as two-and-a-half-dimensional. 5. (a) Stereo photography consisting of overlapping images along a flight line ; (b) multistation monoscopic convergent photography, consisting of images taken from all sides of an object towards the center a b Figure 5. (a) Stereo photography consisting of overlapping images along a flight line ; (b) multistation monoscopic convergent photography, consisting of images taken from all sides of an object towards the center. 12
21 While stereo photogrammetry is well known, convergent photogrammetry is widely recognized to be more geometrically accurate. A method called multistation monoscopic convergent photogrammetry creates a 3D geometric model from several single photographs taken from sides of a target (Figure 5b). Instead of specifically overlapping photographs, all photographic perspectives converge at object center. This method is not intended to be performed with conventional photogrammetric packages, but can be performed inexpensively manually or with various automated systems (see hybrid laser scanning, below). For manual production using a simple PC-based software application such as PhotoModeler Pro, any series of overlapping photographs is registered to one another with tie points, and the operator defines surfaces and edges around the object of the imagery. From the tie point and supplementary information, a geometric model of the object is generated. Little camera or locational information is necessary, but for good model creation photo stations must be as widely divergent as possible, and all views of the object must be recorded. Convergent photogrammetry therefore allows greater flexibility in image sources and camera information, but requires thorough coverage of an object. Where stereo photogrammetry is referred to as two-and-a-half-dimensional, convergent technology results in a truly three-dimensional model. It should be noted here that stereo imagery could, with some foresight, be combined to produce convergent models. However, convergent photogrammetry cannot be used to produce stereo pairs. Hybrid 3D Scanning Hybrid 3D scanning is an automated laser/video convergent photogrammetry modeling technique, which has emerged only in the last two years. Traditional fine-grained laser scanning has been widely used for the past two decades in medicine and engineering, but only recently have developers adapted the technology for primarily photographic data collection. Because it was developed within the computer gaming industry, some photogrammetrists refer to hybrid scanning as Nintendogrammetry. The method combines photography and laser scanning in a hybrid scanning system to create fairly accurate three-dimensional models of objects. Most hybrid scanning systems rely on a turntable, back- and floodlighting, a laser device, and a digital video camera. Using software on an attached desktop computer, the system creates a three-dimensional model of an object by 13
22 collecting silhouette and texture information with a video camera, and a laser. The process is largely automated, inexpensive, and very accurate; however, because it was designed to aid game makers in the production of realistic character models, hybrid scanning is usually geared toward small objects. Such scanning also cannot be performed on in situ objects, and so is not appropriate for field recordation. Two-Dimensional Photogrammetry and Single-Image Registration Two-dimensional photogrammetry is actually a much-simplified adaptation of true photogrammetry. The process often utilizes only one photograph, which is registered to a planar surface. Stereo viewing and geometric model generation cannot be performed, but because of it s ease-of-production and flexibility, two-dimensional image rectification is often used by nonphotogrammetrists. Some researchers actually recommend rectifying single photos of essentially flat features for measurement, due to the high cost of stereo measurements (Gisiger et al. 1996), but the approach is controversial. Heinz Rüther (1997) writes that there is a great misconception among non-photogrammetrists about image rectification. Many inexpensive software packages offer image registration and rectification via rubber-sheeting, which essentially stretches and warps an image to reach coordinates indicated by the operator. This process, according to Rüther, is not photogrammetric and does not produce a truly photogrammetric image. In one example of non-photogrammetric image rectification, the technician uses the Image Analysis extension in ESRI s ArcView GIS software to define three or more known points on a scanned drawing or photograph. The application stretches and distorts the image to fit the defined points, therefore georeferencing previously undefined areas of the image. The technician can then conduct some measurement analysis on the rectified image. Since this approach is not true rectification, in which interior and exterior orientation are performed, the use of the term rectified can mislead users as to subsequent accuracy. Nevertheless, many archaeologists and architectural historians regularly use single-image (nonstereo) registration for pseudo-photogrammetric purposes. Archaeologist Christopher Dore of Archaeological Mapping Specialists has used such simple technology to get reasonably accurate 14
23 measurable photographs of simple objects such as a metate. Dore has also successfully registered photographs of graves in two dimensions, with x,y accuracy as fine as a few millimeters. Virtually no input information is necessary to successfully perform single-image registration, so casual photographs and imagery from unknown or archival sources may be utilized. No orientation or calibration is conducted, and the typical photogrammetric output formats, (orthophotos, stereo-models, and digital elevation models), cannot be generated. Since some planar measurements and qualitative analysis can be conducted from very simple input, the utility of such pseudo-photogrammetry to fields such as cultural resources should not be underestimated. However, above all, despite its somewhat high return for invested effort, it must be emphasized that this approach does not meet the requirements of the current scope to record complex three-dimensional features. 15
24 CHAPTER 3 PHOTOGRAMMETRY IN CULTURAL RESOURCES Cultural resources management, and particularly archaeological excavation, is unique in that data recovery and analysis are often destructive (ACHP 1999, King 2000). Discovery, excavation, removal, analysis, and even curation all contribute to the overall loss of integrity of objects, features, and context. The nature of cultural resources legislation compounds the problem. Often survey and recordation are mandated as part of a salvage effort, due to the impending obliteration of the resource. Artifacts retrieved from the field must be curated at appropriate facilities, or expediently repatriated to tribal authorities according to the Native American Graves Protection and Repatriation Act (NAGPRA). Once out of archaeologists hands, artifacts are removed not only from potential comparative collections, but also from any meaningful geospatial context. The fast pace of field excavation, coupled with the varied and unpredictable range of archaeological environments, has helped establish somewhat of a lowest common denominator standard in archaeological recordation. Sites and features are usually recorded by any combination of the following simple field techniques: photography, measured drawings, sketch maps, Total Station survey, and global positioning system (GPS) mapping. Unfortunately, the extent and thoroughness of any one of these techniques is subjective and often poorly correlated with the others. There is a clear need in cultural resources recordation for a more consolidated, objective approach. As Forte (1997) warned, the problem for archaeology is to retrieve the maximum possible amount of information from the material culture... It is important, therefore, not to waste information or lose access to it. In this process of acquisition, restoration and representation the assistance of computers and other technology has become vital, and it is here that 16
25 the term virtual archaeology becomes valid. The quality of archaeological information and classification will in the future create the basis of a new cognitive science. In fact, for at least the past decade, many archaeologists have begun to transform their previous qualitative photogrammetric analysis (comparison of historic photographs, analysis of aerial photographs), into somewhat geospatially-referenced imagery, allowing quantitative analysis. Two-dimensional image rectification is commonplace within geographic information systems (GIS) software applications, and some digital image quality manipulation helps improve interpretation, as done with pictographs (Texas Parks and Wildlife 1999). However, a tremendous amount of three-dimensional data are discarded in such analysis. Given the capabilities of most GIS applications, and the increasing demands for accuracy and detail, traditional methods are insufficient for efficiently and accurately recording, storing, and relating the evidence that is quantitatively large, architecturally complex, and three-dimensional in nature (Daniels 1997). Almost any form of softcopy photogrammetric recordation, from high-end to simple inexpensive techniques, has obvious applications in cultural resources management, NAGPRA repatriation, change detection, education, and data sharing. Imagery can be easily maintained, analyzed, and distributed for research, education, and outreach. Because it is quick, objective, and complete, it is worth incorporating into field and lab work. Photography and measurement are already incorporated into all field recordation, but by simply correlating the two and following a few basic guidelines, measurable images of complex three-dimensional features can be generated, then stored in geospatial databases with existing GIS map data. GIS compatibility and georeferencing are increasingly important in cultural resources, for as Konnie Wescott (2000) writes, GIS is emerging as a fundamental component of archaeological method, and is likely to have an increasing impact on archaeological theory. GIS is proving itself to be a powerful and efficient managerial tool for spatial data sets, allowing the land or resource manager the ability to access, analyze, and interpret large amounts of archaeological data in a fraction of the time previously required. 17
26 PARAMETERS IN CHOOSING SYSTEM AND METHODS A vast array of recordation and photogrammetric analysis techniques can be used in cultural and natural resources, depending upon the operator s training, skill, and desired results. Patias (2001) points out that increasingly, photogrammetry is called upon to offer its services in a variety of levels and in all possible combinations of scientific procedures, quality requirements, usage of final products, time restrictions and budget limitations. While recognizing the wide range of issues involved in choosing a softcopy system, this document considers four major issues in assessing the myriad methods available. These issues skill/usability, cost, flexibility, and accuracy reflect the needs of the U.S. Army Corps of Engineers, which has requested an emphasis on accuracy, efficiency, cost effectiveness, and accessibility. Skill and Usability Two fundamental hurdles in incorporating photogrammetric methods into cultural resources recordation and analysis are usability and skill level. This topic addresses both the skill necessary to collect and produce photogrammetric material, and the skill and resources needed by others to view and analyze the product. It should be noted that one softcopy photogrammetry expert interviewed, Peter Borges of Documenta Architectural Photogrammetry, disapproves strongly of a generalized or simplified approach for two major reasons. First a rigorous standard of accuracy cannot be maintained using mainstream equipment. Second, non-photogrammetrists are not necessarily capable of recording and producing quality photogrammetric products properly. For architecture, Borges recommends that experienced photogrammetry firms be used for at least the primary recordation phase, after which less trained technicians may be permitted to build upon the initial framework. This will afford much greater attainable accuracy. Despite this caveat, the majority of experts consulted felt that there is a need and application for low-tech softcopy photogrammetry. Standards and guidelines are now particularly important as very inexpensive, basic photogrammetric equipment becomes available to the masses. Softcopy photogrammetry is already more accessible than conventional photogrammetry. Additionally, for the purposes of this document, GMI limited its assessments to methods and techniques that could be reasonably adopted by non-photogrammetrists with moderate training. Constraints included user-friendly equipment, limited calibration and correction of camera distortion, moderate but not 18
27 excessive post-processing, and distributable multi-platform end products. In practical terms, skill and usability dictate that mainstream, commonly available equipment such as off-the-shelf cameras and industry-leader (and preferably multi-purpose) software be used whenever possible. Cost The cost of photogrammetric recordation and analysis systems might seem to be at odds with other requirements of automation, accuracy, and flexibility, but low cost is becoming increasingly important to cultural resources photogrammetrists. In fact, as noted at a recent international conference on the subject concurrent with the destruction of sites in Afghanistan, the special endangering of cultural heritage... by [the] potential effect of violence and... by lack of resources for the protection and the preservation of the cultural monuments asks for low-cost methods for their rapid documentation... The bare propagating of high-end solutions to the satisfaction of our own scientific needs will not really contribute to the solution of these problems (Hanke 2001). While sophisticated, accurate photogrammetry will probably not be available to all, costs should be feasible for firms and entities currently already dedicated to other accurate digital technologies such as GPS, CAD, and remote sensing, and therefore cost no more than $20,000 or roughly one-fifth the cost of conventional methods. For this reason, this document does not assess the use of metric cameras or high-end photogrammetric workstations for close-range softcopy photogrammetry. While these techniques admittedly often provide more accurate data, they are not within the scope of the current project. Flexibility Cultural and natural resources management are by nature ever-changing and unpredictable. Thus, viable methods and technologies for production and analysis of photogrammetric imagery must be extremely flexible. At the same time it is clear that no single methodology or technology is appropriate for all situations. It is currently the practice of a few cultural resources firms to use a combination of applicable recordation methods, depending upon the object, time and budget constraints, and the desired results. In this document, distinctions are made between the field environment and the lab environment, in order to refine the use of more specific techniques in each. In general, flexibility defines the range in scope and scale for which a given approach can 19
28 be effectively used. Archaeologists have already discovered, for instance, that the use of digital cameras simplifies field recordation greatly. Heinz Rüther (2001), after some research, stated that for a large architectural project... in recognition of the flexibility and favourable metric performance of modern low cost, off-the-shelf digital cameras, a decision was made to accomplish the 3D measurement of significant feature points... by photogrammetric means... A further consequence of the use of amateur charge-coupled device (CCD) cameras as metric imaging devices is that on a [large] project... there can be expected to be no shortage of cameras. Additionally, recordation equipment such as camera mounts and braces must be adaptable to a wide range of scales and orientations; thus simple, inexpensive, and expandable materials are more desirable than specialized devices. Accuracy This document does not attempt to strictly regulate image accuracy by establishing a threshold level. GMI recognizes that accuracy needs differ depending upon the photographic environment, the type of project, and the anticipated use of the final product. As Clive Fraser (personal communication 2001, see Appendix A) of the University of Melbourne pointed out I believe it would be quite problematic to generate generic accuracy ratings given all the variables involved. I would support, however, much more emphasis on accuracy & precision. While a good faith attempt at high accuracy should be made by all photogrammetric image users, it is more important at this time simply to identify levels of accuracy and report accuracy using a standard method and terminology. Accuracy need not be compromised in order to achieve the above goals of usability, flexibility, and cost. As the field of close-range softcopy photogrammetry expands, the tools necessary to achieve acceptable accuracy in photographic imagery become both less expensive and more accessible. In some cases, fairly inexpensive equipment rivals conventional equipment in accuracy. An example of this is the recent generation of megapixel digital CCD cameras. Traditional film cameras often experience film warping or curvature, which is a major source of error in photogrammetry. Non-metric film cameras cannot keep film flat within the camera magazine, and it has a tendency to curl; thus, the object is recorded on a curved surface and a 20
29 deformed image is created (Gisiger et al. 1996; Wolf and Dewitt 2000). Expensive metric cameras have several methods for drawing or pressing the film against the focal plane; however, this is not possible with an off-the-shelf camera. CCD cameras, where images are recorded on the CCD array (flat and constant), rather than on film, do not suffer from this problem. An appropriate digital camera can currently be purchased for less than $700. Off-the-shelf cameras exhibit radial distortion in which lens imperfections blur and warp the image, but this distortion is regular and replicable, so simple, free, calibration can be conducted to alleviate the problem. From recent studies, it is clear that with camera calibration and softcopy photogrammetry software applications, it is possible to get nearly the accuracy of some metric cameras. In fact, in a joint Canadian-Chinese study in late 2000, photogrammetrists found that significantly higher accuracies were achieved in the adjustment results for the digital camera images than for the scanned hardcopy images, in spite of the fact that the scanned images have a higher resolution than the digital camera images. This phenomenon is an encouragement to using the fast developing digital cameras in close-range photogrammetry (Deng and Faig 2001). 21
30 CHAPTER 4 EXISTING DATA CONTENT STANDARDS: THEIR APPLICABILITY TO CULTURAL/NATURAL RESOURCE SITE MONITORING Data content standards provide semantic definitions of a set of objects, such as processing, accuracy, reporting, and applications considerations, for a given topic. In the case of this document, existing data content standards were researched in relation to close-range softcopy photogrammetry in cultural/natural resources. In recent years, researchers have recognized the increasing need for content standards applicable to digital imagery, stating,... until recently, existing accuracy standards such as the National Map Accuracy Standards... focused on testing paper maps, not digital data (LMIC 1999). With growing demands for digital imagery that can be integrated into existing digital geospatial databases, Rüther (1997) said... there is a need to make users of photogrammetric and related technologies aware of accuracy, reliability, and general quality control issues. These areas appear to be of low priority to some users. There are several existing sources of content standards for very large-scale photogrammetric mapping in cultural resources. These include the International Council on Monuments and Sites (ICOMOS), the International Society for Photogrammetry and Remote Sensing (ISPRS), the American Society for Photogrammetry and Remote Sensing (ASPRS), and the Comité Internationale Photogrammetrie Architecturale (CIPA) for procedural standards, as well as some accuracy requirements. Several Federal Geographic Data Committee (FGDC) geospatial positioning standards, including the National Standard for Spatial Data Accuracy (NSSDA), contain content standards largely for accuracy and metadata reporting. The NSSDA, developed by the FGDC, was designed to provide methods for estimating positional accuracy in both digital 22
31 and printed geographic data. The NSSDA provides a statistic to describe positional accuracy, a method to test for spatial accuracy, and recommends a common language for describing accuracy in metadata. The aims and applications of the NSSDA are clearly described in plain language in the document Positional Accuracy Handbook, distributed by the Minnesota Planning Land Management Information Center (LMIC). The existing FGDC content standards for orthoimagery, and the upcoming content standard for digital geospatial metadata in remote sensing, cover some processing and data quality standards. For detailed descriptions of these standards and metadata outlines, the reader is referred to the FGDC standards publications, available from the Federal Geographic Data Committee and at their web site ( The National Park Service (NPS) publishes a number of guidelines and standards for conducting and submitting Historic American Building Surveys (HABS) and Historic American Engineering Records (HAER), and maintains its own CAD/Photogrammetry Laboratory. CIPA (ICOMOS/ISPRS) STANDARDS The International Council on Monuments and Sites (ICOMOS) is a non-governmental organization committed to the conservation of global cultural heritage. ICOMOS has both U.S. and international committees focusing on a variety of cultural preservation issues, and has developed a Guideline for the Recording of Historic Buildings. The ISPRS is also a nongovernmental organization, which is dedicated to research and publication in the areas of photogrammetry and remote sensing. The ISPRS sponsors several technical commissions, including Commission V, Close-Range and Visualization Techniques, headed by Prof. Petros Patias of Greece. In conjunction with ICOMOS, it also sponsors CIPA, the Comité Internationale Photogrammetrie Architecturale, which consists of eight working groups and two task groups covering many imaging issues in cultural resources management. One of CIPA s most outstanding publications on photogrammetric standards is the document Optimum Practice in Architectural Photogrammetry Surveys (CIPA 1993, see Appendix E). While advocating the continued investigation of softcopy photogrammetry, this document is designed for traditional analogue close-range architectural photogrammetry. It contains specific 23
32 recommendations for accuracy and scale. For whole buildings, where the hardcopy map scale is 1:50, positional accuracy must exceed 1-2 cm. For details, where the hardcopy map scale is 1:10-1:20, accuracy must exceed cm. For scales of 1:100, positional accuracy of 3-5 cm is permitted. In addition, photographic scale should not be too small in relation to the final printed hardcopy product (1:8 is the greatest acceptable level). Several of CIPA s task groups have missions directly related to photogrammetry and data content standards in cultural resources. Working Group 3 - Simple Methods for Architectural Photogrammetry, is hoping to encourage low-end photogrammetric recordation using simple software packages under $10,000 such as PhotoModeler Pro. Working Group 4 - Digital Image Processing, studies and encourages new digital technology use, such as CCD cameras, computer vision, simulation, and other potential digital photogrammetric tools. Working Group 5 - Archaeology and Photogrammetry, is headed by Professors Michael Doneus of Austria and Cliff Ogleby of Australia. This working group is less concerned with absolute accuracy per se and more interested in accelerating field recordation. The most instructive output of the CIPA Working Groups are the CIPA 3x3 Rules (Table 1), which cover nine points in three categories (geometry, photography, and organization) of field recordation, with the goal of encouraging careful, conscientious collection (Oglby and Wandhausl 1994). Table 1 The CIPA 3x3 Rules for Close-Range Photogrammetric Field Recordation Category Task Directions Geometric Prepare control information Measure lengths of several dimensions Take photographs over the entire feature 50%+ overlap Take stereo-pairs Maintain constant base-distance ratio Photographic Maintain interior geometry Don t zoom or shift camera optics Maintain homogeneous illumination Choose time of day and setting carefully, correct lighting if necessary Use a stable, large format camera Metric, medium format is best Organizational Make proper sketches Include footprint, elevations, photo positions Record all pertinent information Include feature and camera type and data Do a final check in the field Double-check numbers, records 24
33 Aside from the 3x3 Rules, no specific standards have been produced by the CIPA Working Groups. However, all of the groups are currently developing standards with the goal of wide dissemination; therefore, future CIPA publications should be monitored. CIPA Task Group 2 - Single Images in Conservation addresses the uses of single images, amateur photographs, and historical photos in cultural resources, including single image rectification. This group has published on its web site a few initial data attributes it considers important in metadata and database documentation (Table 2). Table 2 Selected Classes of Photogrammetric Information and Attributes Class Attributes Class Attributes Image Original, enlargement, metric, amateur, analogue photographic, analogue video, digital full format, part of frame External control Full, none, partial, assumed: distances, directions, angles, proportions, symmetries and repeated patterns (allowing use of techniques like single image stereometry or pseudomirror-photogrammetry ) etc. Surface Planar, polyhedral, mathematical, arbitrary (known or unknown) Interior orientation Known, unknown, partly known Object Fully destroyed, partly damaged or modified Purpose and required accuracy Reconstruction, restoration, general documentation, artificial study or comparison Product Analogue, vector, raster (rectification; orthophotography; development; projection) ASPRS STANDARDS The most recent ASPRS standards for photogrammetry, the Draft Standards for Aerial Photography published in 1995, stipulates camera formats, calibration, filters, flying conditions, aircraft requirements, aerial film type, storage, and processing, photo indexing, film diapositive quality, ownership, and documentation (ASPRS 1995). Unfortunately, the standards apply only to analogue, large format aerial photographs and cannot be applied to close-range softcopy photogrammetry. In 1987, the ASPRS published a document entitled ASPRS Interim Accuracy 25
34 Standards for Large-Scale Maps, which provided accuracy tolerances for maps of 1:20,000 or greater scale. Scale in digital photography is not described as it is in hardcopy maps. As lamented by GIS professionals, in the digital world, scale is not stable, not communicated well, and not protected (Slonecker and Tosta 1992). This is not to say that scale is irrelevant in digital imagery, but unlike standard analog maps, where one map unit translates to a specified number of ground units (e.g., 1[foot]:24,000[feet]), digital imagery scale is computed from the camera focal length and the object distance (or flying height). In other words, an image taken with a camera set to a 4.8 mm focal length, 15 m from the object of interest, is at a scale of 1:3000. Likewise, an image taken from 450 m, with a focal length of 150 mm, is also at a scale of 1:3000. This characteristic of digital geospatial imagery complicates the discussion and application of standards. In any case, the ASPRS Accuracy Standards calls for classes of accuracy (Class 1, Class 2, or Class 3), where accuracy is measured by root mean square error (RMSE). Class 2 has twice the allowable positional accuracy of Class 1, and Class 3 has three times the allowable positional accuracy of Class 1. Horizontal accuracy standards for Class 1 are shown below (Table 3) for a few common image scales (FGDC 1998a). Table 3 ASPRS Class 1 Horizontal Positional Accuracy Standards for Large Scale Maps Class 1 Planimetric Accuracy Limiting RMSE (meters) Map Scale : : : : : : : :20,000 26
35 Maps meeting the accuracy standards are labeled This map was compiled to meet the ASPRS standard for Class (1, 2, 3) map accuracy (FGDC 1998a). However, the ASPRS now defers to the Federal Geographic Data Committee National Standards, compiled in the 1990s, stating that the document contains... material more relevant to today's digital processes; and is also more complete and up-to-date (ASPRS 2000). NPS STANDARDS The National Park Service supports the use of photogrammetry in building and site documentation, but cautions against viewing softcopy photogrammetry as a panacea in cultural feature recordation (Burns 2000). Most of the NPS instructional handbooks contain detailed descriptions of proper photographic format and submission requirements, and in some cases dictate 35 mm film cameras and black and white film (NPS 1996). Rectified photography for aiding line drawings of planar building elements is also suggested, but only analogue products are discussed (Burns 1989; NPS 1996). The reader is referred to documents such as Recording Historic Structures & Sites for the Historic American Engineering Record (NPS 1996) for explanations of field photographs and photograph logs, and to the NPS publication Recording Historic Structures (1989) for a description of analyzing analogue imagery two-dimensionally and in stereo. Very recently, the NPS has addressed softcopy photogrammetry for HABS/HAER documentation (Burns 2000; Croteau 1997). The CAD-Photogrammetry laboratory uses embedded two- and three-dimensional softcopy photogrammetry extensions within AutoCAD to aid in producing line drawings. Said Deputy Chief John Burns (2000), Our standards are performance standards; our products, what we call formal documentation, are hard copy. We use digital technologies as a tool to produce documentation, but not as a final product. FGDC STANDARDS The goal of the FGDC standards is to provide a consistent means to directly compare the content and positional accuracy of spatial data obtained by different methods for the same point and thereby facilitate interoperability of spatial data. While many FGDC standards are still in the 27
36 draft and review stages, several, including standards for metadata, geodetic control, environmental, and infrastructure data, are being used by many federal agencies already. Coordinate System and Datums While latitude and longitude are preferable because they can be easily converted to any projected reference system (FGDC 1999), most base maps (notably USGS topographic quadrangles), and site data are distributed in Universal Transverse Mercator (UTM) projection, expressed in easting, northing, and elevation, in meters. For extremely large scale (close-range) imagery, any influences of the earth s curvature on the imagery will be imperceptible; therefore, UTM is recommended. For map datums, the FGDC (1998b) recommends,... horizontal coordinate values should preferably be referenced to the North American Datum of 1983 (NAD 83). Vertical coordinate values should preferably be referenced to North American Vertical Datum of 1988 (NAVD 88). Unfortunately, most base maps and site data are currently distributed using NAD 27 as the horizontal datum. The FGDC (1998c) recognizes that,... many legacy maps and geospatial data are referenced to older national datums, such as the North American Datum of 1927 (NAD 27) and the National Geodetic Vertical Datum of 1929 (NGVD 29). Therefore, whatever horizontal and vertical datums are used should be noted in metadata. Data Quality The FGDC Spatial Data Transfer Standard divides data quality into five data characteristics (FGDC 1998b):! Positional accuracy: how near coordinate descriptions correspond to actual locations! Attribute accuracy: how complete and correct data features are described! Logical consistency: the extent of inconsistencies and problems in the data! Completeness: the extent and thoroughness of the data set! Lineage: the contributors and tools used to process the data 28

37 The concept of accuracy is often confused with the concepts of precision and error. Precision, which is the reliability of values collected by taking repeated measurements of a photogrammetric image, is not addressed by existing data content standards but could fall into the lineage category. Error is a measure of the difference between a measured value and its true value due to mistakes or random or systematic error. Error is addressed by current FGDC standards under logical consistency, lineage, and completeness. Accuracy is defined as the degree of conformity of a measured value to the true value. A value which is very close to the true value has high accuracy, and a value that is far from true has low accuracy. A comparison of precision and accuracy is illustrated below (Figure 6) 6. Measurement precision and accuracy, where the center of the bull s eye is the true positional value Figure 6. Measurement precision and accuracy, where the center of the bull s eye is the true positional value. In their recent book, Wolf and Dewitt (2000) point out that since the true value for a continuous physical quantity is never known, accuracy is likewise never known; therefore, it can only be estimated. An acceptable method for assessing accuracy is by checking against an independent, higher-accuracy standard. The FGDC requests that accuracy be described using horizontal and vertical root mean square error (RMSE). Sophisticated softcopy photogrammetry processing software calculates horizontal and vertical accuracy RMSE during the triangulation process. However, it is also possible to determine RMSE manually, by testing the measured GCP locations against their known ground coordinates. Horizontal and vertical accuracy statistics worksheets published by the FGDC are provided in Appendix B. To determine horizontal positional accuracy, the measured x and y coordinates of at least 20 points in the image are subtracted from the known locations (gathered 29
38 from an independent source) of these points (FGDC 1998a). The difference between these coordinates is squared and added together, resulting in the RMSE. As expressed below: Sqrrt((Xindependent-Xmeasured) 2 + (Yindependent-Ymeasured) 2 )= RMSE To determine the 95 percent confidence level, the horizontal RMSE is multiplied by Vertical accuracy is similarly calculated, subtracting the measured z coordinate from the known location, then squaring the result, providing the RMSE. The 95 percent confidence level is the result of the vertical RMSE multiplied by In the FGDC metadata, the 95 percent confidence level RMSE horizontal accuracy statistics are entered in field , and vertical accuracy in field Line (Horizontal_Position_Accuracy_Explanation), should read National Standard for Spatial Data Accuracy. The FGDC prefers that accuracy values be reported in metric units (FGDC 1998d), but in cases when dataset coordinates are expressed in feet, such as the State Plane Coordinate system, accuracy values should be correspondingly expressed in feet. Generally the FGDC references the photogrammetry standards of the ASPRS. However, in its standards for engineering, construction, and facility management projects, the FGDC specifies horizontal and vertical feature position accuracy of 5 mm at a map scale of 1:10 for archaeological close range photogrammetry (FGDC 1998e). In addition to accuracy, a large proportion of data integrity management is error control. Types of problematic errors in image data include incompleteness, attribute mistakes, and logical or geometric errors. Missing data layers and missing features or associated attributes within a data layer all contribute to incompleteness. It is important that all the layers of data that should be in the file are present but not redundant. Individual features in imagery files should be examined for quality. Attribute errors, include mis-recorded or missing values within data fields, and omitted data fields themselves, must be identified through review and comparison to a known accurate source. 30
39 For orthoimagery, the FGDC requires that all systematic and random errors be removed to the extent that accuracy standards are met. Additionally, image smears due to stretching of occluded views in areas of high relief must be corrected as much as possible. Image brightness values between images should be matched as closely as possible (FGDC 1999). Gaps in images and image mosaics should be identified using visual verification and corrected if possible (FGDC 1999). Lineage contributes to overall data quality through image resolution and format, but most importantly in accuracy. As recently observed, final model accuracy is not only a function of the capabilities of the field measurement device, but also of the... sampling strategy during the data capture phase of constructing a model... [and] the hardware constraints or the final presentation medium of the model (Jeffrey 2001). 31
40 CHAPTER 5 DEVELOPMENT OF INDUSTRY STANDARDS FOR OBTAINING FIELD AND LABORATORY PHOTOGRAPHS This chapter describes the results of research and review of current techniques and workflows for obtaining field and laboratory photographs for the photogrammetric process. Because closerange softcopy photogrammetry is an emerging technology, few explicit procedural guidelines have been developed, with a few notable exceptions (Gisiger et al. 1996; Rüther et al. 2001). The goal of developing industry standards for field and laboratory workflows is to provide affordable, rapid, straightforward and flexible approaches that can be incorporated into existing recordation, analysis, and data storage. These approaches must emphasize the accurate geospatiallyreferenced recordation of complex three-dimensional features; for that reason, while twodimensional image rectification is discussed, more sophisticated techniques are recommended whenever possible. Paul Bryan of English Heritage provides a very simple description of the photogrammetric process. Essentially there are two phases; the fieldwork, which involves the gathering of imagery and scaling information from the object, and photogrammetric processing, which involves the analysis of that imagery and scaling information to generate the required data (Bryan 1999). All planned photogrammetric fieldwork begins with the creation of a control field around the area to be recorded. Control fields usually consist of small targets, pins, or reflectors placed at a range of horizontal and vertical locations and measured using extremely accurate measurement devices such as survey lasers, EDMs, or laser scanners. Next, images are collected at specific locations and angles, and measurements are recorded. During the processing phase, imagery is corrected 32
41 and registered using computer software, then developed into stereo models, geometric models, or DEMs and orthophotos. As discussed below, a range of photogrammetric techniques is currently in use, depending mainly upon the constraints of the object or scene to be recorded. Of the three three-dimensional photogrammetric techniques considered in this project, each is suited for different circumstances and desired output, and the reader will often want to determine the most appropriate technique for a given project. To aid in decision-making, a flow-chart is provided below (Figure 7). Field 7. Decision-making flow chart for the use of various photogrammetric approaches. Lab Object has multifacial exposure? yes Size > 1 meter? no yes no Object is complex or detailed? no yes Stereo Softcopy Object is complex or detailed? yes Need accuracy >1:1700? yes no Need a geometric model (as opposed to a DEM)? no Need a geometric model (as opposed to a DEM)? no yes Hybrid Scanning PhotoModeler yes no yes Need accuracy >1:1700? no Figure 7. Decision-making flow chart for the use of various photogrammetric approaches. 33

.")
, in the laboratory (center), and photogrammetrically rendered (right) Figure 8.")
42 FIELD DOCUMENTATION Close-range softcopy photogrammetry raises the bar for recordation of complex objects and features in the field. Not only does it allow fast and thorough documentation in a wide range of environments, it provides a reliable format for later analysis, curation, and distribution. Significantly, certain analysis is actually only feasible using photogrammetric images. For example, grave removal and transport are fairly destructive, and many fragile bones do not survive the process (Figure 8). Change analysis (comparing photographs of a scene or object over time) must also be done photogrammetrically. 8. An excavated grave in situ (left), in the laboratory (center), and photogrammetrically rendered (right) Figure 8. An excavated grave in situ (left), in the laboratory (center), and photogrammetrically rendered (right). Photogrammetry preserves a replica of a feature long after the feature has been destroyed, relocated, or repatriated. This replica can then itself be curated, used as part of a virtual comparative collection, or shared with colleagues for risk-free detailed analysis. Examples in which photogrammetry is necessary and cost-effective are: 1) grave removal, where time is short and features are fragile; 2) change analysis of petroglyphs, mound sites, structures, or murals; and 3) production of extremely accurate virtual scenes with true photographic texture. 34
43 Cultural resources data collection and recordation in the field is probably the most important and complicated challenge for the photogrammetric approach. Not only does the size, complexity, and orientation of the object vary, but the topography, accessibility, and coverage of the field environment is also varied and unpredictable. Therefore, the challenge of field collection is to adequately record photographic and geospatial information in order to obtain photogrammetric, repeatable measurements at an acceptable level of error. Field methods and workflows must be flexible, scalable, and straightforward in order to facilitate standardization. A number of cultural and natural resources scientists have developed methods for image and geospatial data collection in the field. Techniques and workflows vary according to environment, scale, and desired results. The CIPA Rules discussed in the previous chapter (Ogleby and Wandhausl 1994) advocate the use of stereo pairs in recordation, but overall simply recommend thoroughness in the field. In practice, archaeologists are currently implementing all of the approaches previously discussed, from two-dimensional rectification to stereo and multistation monoscopic convergent photogrammetry. Recommended Two-Dimensional Rectification Techniques There are several instances in which cultural resources professionals may need to use single images for measurement and analysis. Instances include old historic photographs or postcards, and flat or simple features of minor importance recorded less thoroughly in the field. The use and analysis of two-dimensional imagery in cultural resources is significant enough to warrant a CIPA working group (Task Group 2), with members worldwide. Besides allowing reasonably accurate planimetric measurements, two-dimensional images can aid in temporal change analysis (by registering two images taken at different times), and mosaicing (knitting two or more images together to create a seamless aggregate). Many cultural resources professionals have performed two-dimensional single-image rectification for cultural resources features. In one notable example, the University of Virginia photographed the walls of a structure at Pompeii, simply by recording a number of reflective targets with a total station survey laser, then shooting many very large-scale photographs, and registering each image to the survey data. While accuracy was reported to be as good as.07 mm for the resulting model, 35
44 this in fact described the measurement precision of the digital image. That high accuracy was lacking is evidenced by later, more rigorous three-dimensional modeling in subsequent years (Eiteljorg 1995). Nevertheless, archaeologists and architects regularly use single-image rectification to derive fairly accurate and useful two-dimensional measurements with very little geospatial control. Archaeologists at Archaeological Mapping Specialists perform single-image rectification using four or more target pins as a control field (Dore, personal communication 2001). GMI conducted a simple pilot study with an off-the-shelf digital camera to assess the twodimensional image rectification technique. Photographs were taken from directly above an excavated grave, as well as from various angles up to 45 degrees around the grave. For geospatial control, a number of GCPs were recorded with a Total Station survey laser. The images were imported into ESRI s ArcView as Image Analysis layers, and registered to true geographic space using the GCPs as a point theme. The pilot study was somewhat successful in rectifying images taken perpendicular to the plane of interest, but performed poorly with oblique photographs. Even after registration of an ideal image, image GCPs deviated from their known x,y locations by between 1 and 3 cm. Understandably, simple horizontal measurements were relatively accurate considering the minimal processing, often matching known coordinates within 1 cm. However, oblique measurements introduced error of up to 200 percent. Other image rectification applications might be better suited to such material; however, the fact remains that only very limited measurements and analysis can be performed on such material. Thus, the most important aspect of field collection for two-dimensional image rectification is clearly that the images be recorded perpendicular to the most important surface. Oblique and angled photographs have at best limited metric utility. Recommended Two-Dimensional Rectification Workflow The workflow for collection of two-dimensional images for photogrammetric use is made up of five steps: camera set-up, control field placement, image capture, control point measurement, and image processing. Guidelines for thoughtful and accurate photography and processing are also clearly described by the National Park Service (Burns 1989; NPS 1996). 36
45 Camera Set-Up For two-dimensional image rectification, photographs must be taken as close to perpendicular as possible. Scaffolding, a tripod, or another secure structure should be used to ensure a good perpendicular angle. Control At least three ground control points (GCPs) must be defined in each image for rectification. Small, well-marked targets or easily-recognizable features on the object should be laid out prior to photography, taking care to spread GCPs to the edge of each photo frame. Image Capture During image capture, the camera settings should be maintained constant if possible. Lighting, object distance, angle, and scale must be homogeneous between multiple images, if they are to be mosaicked or otherwise combined. Measurement As specified in the CIPA 3x3 Rules, at least two linear measurements should be collected while in the field for later reference. Additionally, each GCP coordinate must be measured with an accurate measuring device such as a Total Station. The Total Station coordinates must be referenced into a real-world coordinate system, either by tying the survey to a known benchmark or to a GPS point. The accuracy of this benchmark or GPS reading will determine the overall absolute accuracy of the feature s geospatial location. Computer Processing After field collection, images are imported into an image rectification application, such as the Image Analysis extension within ESRI ArcView. After any color balancing or other image 37
46 correction, the image is rubber-sheeted by specifying the coordinate locations of the measured GCPs (Figure 9). 9. (a) Rectified perpendicular photograph, using 12 GCPs; and (b) oblique photograph, using 18 GCPs a b Figure 9. (a) Rectified perpendicular photograph, using 12 GCPs; and (b) oblique photograph, using 18 GCPs. Red lines indicate RMSE values, which are unacceptably large in the oblique image on the right. Supplementary field measurements can be used for blunder-checking. The rectified image can then be saved under a new name, and exported in almost any image format, including.jpg and.tiff. In a computer aided design (CAD) program (AutoCAD or Microstation) or the GIS, the image may be used as a base map for two-dimensional line drawings (Burns 2000). Recommended Two-Dimensional Rectification Equipment Camera: Software: Workstation: A 3 megapixel or better digital camera is recommended, but any still camera may be used The Image Analysis extension in ESRI ArcView is commonly used, but many other CAD and imaging programs can also be used Any modern desktop PC may be used 38
47 Point collection: A Total Station is recommended for point collection. Other devices may provide better results (see Lasergrammetry, discussed below) Three-Dimensional Photogrammetry Using three-dimensional photogrammetric technology, a few well-funded institutions have successfully documented very large cultural resources. The University of Melbourne and Chulalongkorn University in Bangkok developed, over several years, detailed three-dimensional models of the ancient city of Ayutthaya, Thailand, using photogrammetry. Their approach utilized both stereo and multistation monoscopic convergent photographic techniques, and used close-range and aerial photography. Control points consisted of numbered targets and known features measured with a survey laser, as well as GPS measurements taken for absolute geospatial control (Ogleby 2001). Another multinational university team has recorded architectural structures using off-the-shelf digital cameras, and utilizing numbered targets and known features as control points. The crew calibrated all digital cameras at preset focal lengths prior to use, to account for radial distortion. Simple multistation monoscopic convergent photogrammetry software (Photomodeler and Australis) helped create an accurate three-dimensional model, with photogrammetric triangulation accuracy of about 1.5 cm (Rüther et al. 2001). In experiments with feature-level documentation, a Japanese team recorded a large stone turtle feature using a heterogeneous methodology. Their procedure consisted of measurement, data processing, and integration. The team used a total station survey laser and a laser scanning device to collect measurement data and minimal texture information, then used stereo photogrammetry to complete the imaging process. A series of targets placed across the feature aided in image matching. The project resulted in a three-dimensional model in both CAD and VRML formats (Imura et al. 2001). 39
48 Recommended Stereo Photogrammetry Techniques Stereo close-range photogrammetry is a flexible photogrammetric approach, in that it can record objects of almost any size and shape. By overlapping photography of an object or scene, then referencing points in the overlapping regions to a number of well-defined control points, the data can be used to create either a topographic surface of the object, or a stereo model to be viewed through 3D glasses. Archaeologists all over the world are already using stereo close-range photogrammetry to document, analyze, and reconstruct cultural resources. Seyed Yousef Sadjadi of the University of Glasgow conducted a feasibility study for close-range photogrammetric recordation of cultural monuments, photographing for a variety of potential photogrammetric transformations, but focusing on stereo pairs. Sadjadi (1998) used digital cameras and a total station survey device to successfully record an historic abbey. GMI conducted its own pilot study to assess stereo close-range softcopy photogrammetric recordation in the field. A feature-sized object was selected for recordation. While objects of smaller size are technically feasible for stereo photogrammetric recordation, measuring control points to an acceptable accuracy on a small object presents challenges. Objects over a large area and at many different angles would present additional challenges for set-up, lighting, and angle. An excavated historic grave was chosen as the subject, and standard construction scaffolding provided a structure for photography. For image capture, technicians used an off-the-shelf 3.3 megapixel digital camera (Olympus 3030). GMI processed the imagery using ERDAS relatively inexpensive mainstream remote sensing software, which has softcopy photogrammetry capabilities; however, the similarly-priced Image Processing Software softcopy photogrammetry software could also be used. A Dell Precision 420 graphics workstation, with a 730 MHz processor, 1 Gb RAM, and a 30 Gb hard drive was used for processing. A 3D graphics card was necessary for viewing in stereo, as well as stereoscopic glasses and an emitter. The pilot study resulted in the successful production of both stereo and topographic models of the grave that rivaled hand measurements for accuracy, and that could be converted to a variety of file formats. Because of the complexity of processing close-range data, novice/nonspecialists probably cannot effectively perform stereo softcopy photogrammetry without some initial guidance. Image processing requires some understanding of the principals of photogrammetry, as well as experience with the software. However, field collection is fairly straightforward and could certainly be performed by anyone given a few hours training. 40
49 Recommended Stereo Photogrammetry Workflow The workflow for collection of stereo images for photogrammetric use is made up of six steps: camera calibration, scaffolding set-up, control field placement, image capture, measurement, and image processing. Camera Calibration Camera calibration is strongly recommended for off-the-shelf cameras, to alleviate distortion issues such as radial distortion common in low-end cameras. For traditional metric photogrammetric cameras, calibration is done semi-annually by professionals. However, simple in-house camera calibration can easily be done for any off-the-shelf camera. Zhengyou Zhang of Microsoft Research has developed one simple technique for calibration (Zhang 1999). Several small shareware applications are also freely available to users for in-house camera calibration, including Camera Calibration Toolbox for Matlab, available at bougueti/calib_doc. Calibration is a relatively simple process. A three-dimensional target is fabricated (e.g., a board with blocks secured to it), and very dense and accurate positional control data are taken for the target. The camera is then set to the desired focal length, (which must then be maintained throughout image capture in the field), and photographs are taken. The software guides the user through the image rectification process, which determines the amount of distortion in the camera and produces a calibration file. This calibration file information will then be imported during any image orientation process. Scaffolding The first step once in the field is to arrange a structure around the object or feature that allows the placement of flight-lines along or over it. A rigid beam or pipe can be used to create the flight line. The camera is then secured to the beam and moved along the flight-line. Scaffolding makes a desirable structure because it is strong and can be expanded to almost any scale (Figure 10). 41

50 10. Scaffolding supporting a flight-line over a target feature Figure 10. Scaffolding supporting a flight-line over a target feature. Control A control grid must be created throughout the area of interest, including all areas that will be captured in each photographic frame. Three to six ground control points should fall in each frame, and control points should be distributed across a wide range of x, y, and z values. In areas of great topographic relief, a greater density of ground control points must be placed. Control points should be clearly identifiable targets with an obvious center point. Thumb-tacks with cross-hairs might be used, or smaller, less conspicuous targets can be used for very close range photography. Image Capture After erecting a simple scaffolding apparatus over the feature, operators attach a digital camera to a leveling camera mount suspended underneath a horizontal crossbeam, and the camera is moved down the crossbeam, taking several overlapping sets of photographs (stereo pairs) of the feature (Figure 11). 42
 ratio (Figure 12). This ratio will vary by focal length; with a 6.")
51 11. Image capture for stereo photogrammetric analysis Figure 11. Image capture for stereo photogrammetric analysis. Each stereo pair must overlap at least 60 percent. This is calculated by eye, and by setting the appropriate camera base/object distance (base/distance) ratio (Figure 12). This ratio will vary by focal length; with a 6.5 mm digital (32 mm standard) focal length, a 1:3-1:4 base/distance ratio was sufficient. Focal length and other camera settings must be noted and kept constant throughout the photography process. Image quality should ideally be set to maximum quality.tiff format on the camera. However, lower-resolution images such as.jpg format can also be used. Flying height, or object distance, is determined from a single measurement from the camera body to a control point using a metric tape. Measurement After photography is complete, each ground control point must be carefully measured using a reliable survey device. The smaller the feature, the more accurate the device must be to provide acceptable error in the final product. Trials using a Criterion ranging survey laser on a unipod, though claiming 1-inch accuracy, failed. A Total Station survey laser is well-suited to feature- 43
52 12. The camera base/object distance concept Figure 12. The camera base/object distance concept. level recordation (Figure 13). A small peanut prism minimizes the range of error while shooting each ground control point. A reflectorless Total Station could produce even finer accuracy. The Total Station coordinates must be referenced into a real-world coordinate system, either by tying the survey to a known benchmark or to a GPS point. The accuracy of this benchmark or GPS reading will determine the overall absolute accuracy of the feature s geospatial location. Several additional measurements should be taken while in the field. As recommended in the CIPA 3x3 Rules, measuring the length and width of the feature, as well as a few distances between control points, help in later rectification, error analysis, and blunder checking. Computer Processing Four ERDAS software products are used to process the photographs. OrthoBASE rectifies the photographs to the control point data, StereoAnalyst creates stereo models and is used for measurement and surface point definitions. Imagine performs surfacing and DEM production. VirtualGIS is used for viewing the virtual model. The first step in image processing is image 44

53 13. Total Station used to survey grave location Figure 13. Total Station used to survey grave location. adjustment, during which the user matches colors and brightness throughout the block of images. Next, the images are imported into an OrthoBASE project, where interior and exterior orientation is performed by specifying camera information, any calibration information, and ground control points. Triangulation is run to complete exterior orientation. The triangulation function reports positional accuracy in the form of RMSE, and also produces a report describing iterations, residuals, excluded points, and blunders. In Stereo Analyst, the operator can now do both qualitative and quantitative analysis with the perception of depth. In order to orthorectify the images, the user can define mass points throughout the image to describe the relief of the feature. These mass points are then used to generate a terrain surface, or digital elevation model (DEM) in Imagine. The photographic images can be overlain on top of the DEM in VirtualGIS to see a three-dimensional model of the feature (Figure 14), which can be navigated and exported as an image, movie, or VRML. 45
54 14. VirtualGIS view of the orthorectified image mosaic and DEM Figure 14. VirtualGIS view of the orthorectified image mosaic and DEM. Final products include two basic models. One product consists of stereo models; that is, two rectified overlapping photographs, which, when viewed through proper eyewear, give the impression of depth (the z value), and allow users to measure and analyze objects in 3- dimensional space. The other product is a virtual model created from the combination of a DEM (digital elevation model) of the object and mosaicked photographs of that object. This model can be navigated like geographic topography, transformed into movie footage, or exported in VRML format for unlimited distribution. Technically, multiple DEMs or 3D shapefiles generated from convergent stereo pairs can be combined to create a more complex mode. Field collection depends on the complexity of the subject. Collection for a grave, including setting up and taking down scaffolding, photography, and point collection using a Total Station theodolite, takes a couple of hours. Image processing requires approximately 1.5 days. 46
55 Recommended Stereo Photogrammetry Equipment Specifications Camera: Software: Workstation: Point collection: 3 megapixel or better digital cameras are highly recommended, but any camera may be used ERDAS Imagine plus OrthoBASE, StereoAnalyst, and VirtualGIS, or similar software such as Image Processing Software, Inc. OrthoMapper and Surface Mapper A Pentium II+, running Windows NT or 2000, with 128 Mb+ RAM, 2 Gb+ hard drive space, Open GL 1.1, and Hz screen refresh rate is required A Total Station is highly recommended. Other point collection devices may provide better results (see Lasergrammetry, discussed below) Recommended Multistation Monoscopic Convergent PhotogrammetryTechniques Multistation monoscopic convergent imagery has not been definitively proven to be more accurate or of better quality than carefully-processed stereo imagery. However it has some advantages over stereo photogrammetry in the field. While it is not appropriate for recording excavations and scenes, it works well for documenting large exposed objects. Because it is more geometric in nature, models produced from convergent imagery are often more geometrically correct than stereo models. Convergent imagery is less rigid in camera location and requires no flight-lines. It is also less expensive and requires less equipment than stereo processing. Several software applications have been developed for processing multistation monoscopic convergent imagery into three-dimensional models. EOS Systems PhotoModeler is the most widely-used, but others include Applied Digital Vision, built by Stellacore Corporation, 3D Builder from 3D Construction Company, ShapeQuest s ShapeCapture, and Australis, developed at the University of Melbourne. PhotoModeler is used in archaeology, historic preservation, biology, engineering, and forensics. The approach has been assessed by a number of researchers and found to work favorably when objects can be photographed from many directions, but is significantly less accurate in constrained environments, due to the lack of highly convergent angles (Bottrill et al. 1998). PhotoModeler was assessed in part because of its unparalleled popularity among archaeologists, biologists, and architects for recording both small and very large objects. 47
56 The Delft University of Technology has used multistation monoscopic convergent techniques to record buildings and petroglyphs, using primarily the PhotoModeler package (Heemskerk 1998). Archaeologists from Princeton University have also used convergent photogrammetric documentation for field recordation. Lawrence Desmond and a multinational team documented a Maya arch in the field, and produced line drawings of the arch façade after processing the imagery in PhotoModeler (Desmond et al. 2001). In an attempt to incorporate inexpensive photogrammetric techniques into their existing archaeological site surveys, archaeologists from Brown University successfully used PhotoModeler and a Total Station laser to record the Great Temple at Petra in Jordon, with accuracy between 2 and 10 cm. Through experimentation, the team found that digital camera image capture was more efficient and effective than film cameras (Vote 1999). In comparison to other equivalent software packages, PhotoModeler is considered to be more accurate and automated, but has not been found to have the same image quality as stereo photographs (Mills and Peirson 2001). Says one architectural photogrammetrist, PhotoModeler is good for what it is, which is a modeling program (Borges, personal communication 2001). Recommended Multistation Monoscopic Convergent Photogrammetry Workflow The procedure for collection of multistation monoscopic convergent images for photogrammetric use is made up of four steps: control point placement, image capture, measurement, and image processing. Control A control grid is not necessary to create a convergent model; however, at least one georeferenced point is necessary to georeference the final product, and a few control points will aid in error reduction. Control points should be clearly identifiable targets with an obvious center point. Thumb-tacks with cross-hairs might be used, or smaller, less conspicuous targets can be used for very close range photography. 48
57 Image Capture At least three images must be collected to produce a multistation monoscopic convergent model. During image capture, the camera settings should be maintained constant if possible, and lighting and object distance should be homogeneous between multiple images. Camera focal length absolutely can not be changed during recordation. Camera angles, however, should be as widely divergent as possible. This improves the overall object geometry in model production. Measurement After photography is complete, any ground control points must be carefully measured using a reliable survey device such as a Total Station. The Total Station coordinates must be referenced into a real-world coordinate system, either by tying the survey to a known benchmark or to a GPS point. The accuracy of this benchmark or GPS reading will determine the overall absolute accuracy of the feature s geospatial location. Several additional measurements should be taken while in the field. As recommended in the CIPA 3x3 Rules, measuring the length and width of the feature, as well as a few distances between control points, help in later rectification, error analysis, and blunder checking. Computer Processing/Model Production Collected images are imported as a group into the PhotoModeler Pro application. The user is then prompted to solve interior orientation by photographing a simple two-dimensional target with the field camera at the same settings used to photograph the object. This image is imported as calibration information. Exterior orientation is performed by specifying control points, and by defining a number of tie points between images. The number of tie points varies according to the amount of detail and relief in the area. Lines, surfaces, and simple shapes can be applied to the image, as defined by the operator. When prompted, PhotoModeler attempts to solve the geometry of the photographs, creating a three-dimensional model. Model success, and the estimated positional accuracy of each point, are reported to the operator for review and 49
58 correction. After creation, the model may be measured within PhotoModeler, or exported in a variety of CAD-compatible formats (DXF, 3DS, Wavefront OBJ, IGES, RAW), or as a VRML. Recommended Multistation Monoscopic Convergent Photogrammetry Equipment Specifications Camera: A digital camera is recommended, but any still or video camera may be used Software: PhotoModeler Pro is the most widely used low-end application Workstation: Any modern desktop PC may be used. Pentium processor, 16 Mb RAM, 30 Mb free hard disk space, 800 x 600 screen resolution, and a CD-ROM drive Point collection: Rectification is done by hand with tie points. Control points may be included, and a Total Station is recommended for such point collection. Other devices may provide better results (see Lasergrammetry, discussed below) Lasergrammetry for Improved Geospatial Control Lasergrammetry is the term applied to laser scene capture/laser scanning, and many photogrammetrists are following advances in laser scanning with interest. While similar to photogrammetry in some respects, lasergrammetry operates on the reverse principle. The technique is almost entirely based on the collection of spatial positions using a laser; automated collection of hundreds of thousands of closely-spaced points is performed by a high-end stationary laser device. Much like a surveyor s theodolite, the device emits laser pulses across a specified area, and returns x,y,z locational data as well as reflective qualities expressed as a falsecolor map. Leading laser scanning devices can provide higher relative and absolute geospatial accuracy than photogrammetry; however, for a photorealistic texture, a photograph must be carefully registered to control points in the point cloud. Because lasergrammetry collects reflective data, it technically qualifies as photogrammetry under Wolf and Dewitt s (2000) definition, which includes patterns of recorded radiant electromagnetic energy and other phenomena. However, point density, at a minimum of roughly 1 mm spacing, cannot compete with the more complete photographic image. Also, lasergrammetry equipment costs 10 times that of other methods discussed, and is very 50
59 complicated to process. For cultural resources firms, and for most photogrammetrists, outsourcing or rental is more feasible. Lasergrammetry does have one overwhelming benefit; the laser point cloud data can be used for very dense and accurate DEM production, then used in imagery orthorectification, increasing the overall accuracy and quality of stereo photogrammetric orthorectification. In a recent study, photogrammetrists chose to use lasergrammetry for mass point generation, explaining,... as far as terrestrial applications are concerned, laser scanner devices guarantee different acquisition accuracies ranging from 5 mm (e.g., CYRAX 2500) to 25 mm... These instruments are fully portable sensors, specifically designed for the acquisition of 3D images... the dense DEM generated by a laser scanner device can be considered the optimal solution for a correct and complete 3D description of the shape of a complex object, both from the technical and economical points of view (Boccardo et al. 2001). Cyra Technologies Cyrax laser scanner is probably the most widely-used and notable example of such a device (Figure 15). Cyrax has been used in HABS Level 1 and other historic building recordation (Pahel 2001), and in high-risk oil and gas projects. It is most appropriate when cost is less important than lost time, or when fine resolution and extremely high accuracy are necessary. The Cyrax can collect points as closely-spaced as 1 mm, but is often used at 2-3 cm density. Absolute (on the earth) accuracy is 5 cm (up to about 1,000 feet from the device), but relative (in relation to other points) accuracy is 2 cm or better. Scans are immediately viewable on a laptop computer, during and after scanning. Three hemispherical targets placed around the scene and recorded with a Total Station provide georeferencing. After cleaning and registering the point clouds, the point data are usable in MicroStation, and also with some work in the ESRI products (3D Analyst and ArcScene). However, file size (400,000+ points) makes it poorly-suited for use in the ESRI environment. Lasergrammetry done by the Cyrax is most effective on an architectural or scene scale. Detailed objects less than five feet in size are feasible but not spectacular. Objects such as large statues, arches (Figure 16), buildings, trees, and views (of many grave stones, for instance), are Cyrax forte. 51
 scanning a grave excavation, and the results Figure ) scanning a grave excavation,")
 and scanned (right) Figure")
60 15. The Cyrax (operated by L3D Corp.) scanning a grave excavation, and the results Figure 15. The Cyrax (operated by L3D Corp.) scanning a grave excavation, and the results. 16. The Freedman s Cemetery Memorial arch, photographed (left) and scanned (right) Figure 16. The Freedman s Cemetery Memorial arch, photographed (left) and scanned (right). 52
61 Field collection is rapid, automated, and accurate, and the false-color rendering of each point creates excellent detail. Lasergrammetry is much faster and more accurate than either handmeasurement or traditional survey (with a survey laser). It also creates a much more thorough record than these more subjective alternatives. In dangerous or high (financial) risk environments, lasergrammetry is crucial. Examples of the necessary and cost-effective use of lasergrammetry are: (1) HABS Level 1 building survey; (2) a detailed map of an entire structure, inside and out; and (3) extremely expensive or dangerous engineering surveys and feasibility projects. LABORATORY DOCUMENTATION Archaeologists expect detailed laboratory documentation. Currently, controlled photography and line drawings are done as a matter of course. A variety of inventive documentation techniques have been attempted by archaeologists worldwide. For instance, a Japanese university team successfully recorded a large earthenware artifact by surrounding it with three digital video cameras, calculating the relative positions of each camera, and resolving the geometry of the artifact (Hosomura and Ohta 2001). A British company offers high resolution laser scanning of artifacts. Still stereo photography in a control frame is one straightforward and useful method developed by the Center for Advanced Spatial Technologies (CAST) at the University of Arkansas, Fayetteville. Another emerging technology is hybrid laser scanning, which combines laser data and imagery to automatically generate photorealistic three-dimensional models. Both the two-dimensional and three-dimensional photogrammetric image capture techniques described in Field Documentation are also appropriated for some lab recordation as well. However, the controlled environment of the laboratory setting also facilitates other approaches, discussed below. Recommended Stereo Photogrammetry Techniques In 1996, a team at CAST at the University of Arkansas, Fayetteville, developed a technique for accurately recording both small and large objects in a laboratory setting for stereo photogrammetric processing. Using a prefabricated control grid and camera mount system, a 53
62 variety of objects were recorded to an accuracy of less than a millimeter for beads and pendants, to a centimeter or more on larger artifacts, all at a scale of about 1:20. The project, called Development and Implementation of a Rapid Low-Cost Photogrammetric Data Archival System for Artifact and Osteological Inventory, was intended to be simple and inexpensive (Gisiger et al. 1996). However, while the recordation methods recommended were inexpensive, image processing was carried out on a top of the line system including a photogrammetric workstation and high-resolution scanner. The authors explained that they did not expect organizations to be able to incorporate the processing technology, but that they should start documenting their collections for the day such systems become affordable (Gisiger et al. 1996). Although the experiment did not succeed in developing an entirely low-cost procedure, it did make an important breakthrough in stereo softcopy photogrammetric recordation. The team used off-the-shelf cameras and supplies for image capture referencing, and illustrated the feasibility of recording quantities of artifacts photogrammetrically in a laboratory. Recommended Stereo Photogrammetry Workflow The recommended workflow presented here draws heavily upon the CAST methodology presented in their 1996 document. Two fundamental steps, however, have been modified based on recent advances. First, instead of the high-end photogrammetric workstation used in the CAST project, this document recommends the relatively low-cost systems now available, such as the ERDAS suite (Imagine, OrthoBASE, Stereo Analyst, and Virtual GIS), or Image Processing Software, Inc. s OrthoMapper/Surface Mapper. Secondly, while the CAST team experimented with and recommended film cameras, this document recommends digital image capture devices for two reasons. Film cameras introduce film plane distortion, previously mentioned, and scanning film for digital processing as CAST did is time-consuming, expensive, and introduces additional image degradation. Thus, the recommended stereo photogrammetry workflow includes five basic steps: camera calibration, control frame set-up, object preparation, image capture, and processing. 54
63 Camera Calibration As with image collection in the field, camera calibration will improve final RMSE results during image processing. Calibration can be conducted in the same manner described for field collection, using simple software and in-house techniques. Control A permanent control frame is constructed of glass, plexiglass, or wood, and marked with gridlines or a number of known points. Stacked control objects, such as block pyramids, are used to provide a range of horizontal and vertical control points. Gridline intersections and targets on the blocks serve as ground control points. Object Preparation Depending on the complexity, detail, and texture of the artifact, it must be prepared to provide the best possible image. Cross-hairs can be added to an otherwise uniform object, and different lighting arrangements can minimize reflection and shadows. Detailed descriptions of lighting arrangements and object positioning are given in the CAST report (Gisiger et al. 1996). Image Capture The camera is mounted in a secure track and aligned with the center of the control frame. It is then shifted slightly to either side of that center point, where the images are taken. The CAST team developed an ingenious and simple method for securing the camera on a track both horizontally and vertically, while maintaining a flexible object distance, shown below (Figure 17). A similar frame and a standard jointed leveling camera mount, such as the unit used for field stereo image capture, can also be used. The object distance ( flying height ), is determined from a single measurement from the camera body to a control point, using a metric tape. 55
 mount for horizontal and vertical close-range stereo photography; and (b) vertical photography control structure (from Gisiger et al.")

64 17. Camera mounts and structures designed by CAST: (a) mount for horizontal and vertical close-range stereo photography; and (b) vertical photography control structure a b Figure 17. Camera mounts and structures designed by CAST: (a) mount for horizontal and vertical close-range stereo photography; and (b) vertical photography control structure (from Gisiger et al. 1996:Figures 22 and 23). Computer Processing Photo processing should be conducted similarly to the processing described for field image capture. As with the former example, imagery is imported into the ERDAS software suite and corrected using basic camera information, such as focal length. Exterior orientation is performed using the ground control points defined on the control frame. However, in order to provide realworld coordinates, a known coordinate from the artifact s original provenience must be applied to the local control frame coordinates. This simple transformation will georeference the artifact. In Stereo Analyst, the operator defines mass points across the object surface, from which he generates a DEM. The DEM is applied to the imagery in OrthoBASE, creating orthorectified photographs. Images can be analyzed in Stereo Analyst, or as three-dimensional terrain in Virtual GIS, and converted to VRML files for distribution. Recommended Stereo Photogrammetry Equipment Specifications Camera: 3 megapixel or better digital cameras are recommended; however, CAST recommended 35 mm film cameras and a film scanner Software: ERDAS Imagine plus OrthoBASE, StereoAnalyst, and VirtualGIS, or similar software such as Image Processing Software, Inc. OrthoMapper and Surface Mapper 56
65 Workstation: A Pentium II+, running Windows NT, with 128 Mb+ RAM, 2 Gb+ hard drive space, Open GL 1.1, and Hz screen refresh rate is required Point collection: The control frame, once constructed and measured, provides permanent point collectiion Recommended Automated Convergent Photogrammetry Techniques Automated convergent recordation, which produces a true three-dimensional geometric model of an object, has developed from the field of laser scanning. Laser scanning has been used to record detailed objects in engineering and medicine for many years, but is only recently being incorporated into cultural resources workflows. A number of relatively inexpensive portable scanners are now available that collect hundreds of thousands of positions on the surface of an object by scanning the surface with a laser stripe. This process essentially mirrors large-scale lasergrammetry, in that it creates a very accurate model but does not automatically incorporate photographic data. A few archaeologists around the world offer laser scanning. Stanford University successfully recorded several Michelangelo statues in Florence using Cyberware laser scanners. This project, entitled the Digital Michelangelo Project, was used to do minute evaluation of workmanship on the statues without touching them (National Geographic 2000). Archaeoptics Ltd., in Great Britain, uses a Polhemus handheld laser to scan artifacts and small features to about 1 mm accuracy. Archaeoptics applies this technology to recording, measurement, decay monitoring, and curation (Archaeoptics 2001). The concept of such recordation is interesting because it automatically generates a fine three-dimensional polygonal mesh that can be exported to CAD, 3D modeling programs, and VRML. One of the other primary advantages of scanning is the increased speed at which objects can be recorded. Automation also reduces the amount of training necessary for users. Technicians need not be photogrammetrists or even archaeologists to adequately record a wide variety of artifacts. The process is totally objective and replicable, and should not be operator-dependent, reducing technician-error in artifact recordation and analysis. However, truly photographic, image-based object scanning has not been available until very recently. 57
66 The computer gaming industry is currently developing a new form of automated scanning, called hybrid 3D scanning (or occasionally Nintendogrammetry). Hybrid 3D scanning is a breakthrough in low-cost automated object recordation. The process documents artifacts faster and in greater detail than any previous methodology. Like other close-range softcopy photogrammetry approaches, this technology mitigates the repatriation problem, creating a digital replica of objects that otherwise cannot be retained for later comparison or analysis. Entire collections of artifacts can be stored digitally in a database for later easy access. The technique is cost-effective in any situation in which a number of artifacts must be carefully recorded or drawn. Examples in which hybrid scanning is useful include: (1) curation of comparative collections after artifacts have been curated or repatriated; (2) thorough documentation of very complex objects; and (3) distribution of virtual models for analysis. Immersion Corporation s LightScribe 3D hybrid scanning device, unveiled in November of 2000, is currently the leading hybrid scanner. The LightScribe system consists of a digital video camera and a turntable. The camera automatically photographs the object as it rotates on the turntable. An array of flood- and backlights can be adjusted to provide the best image quality. Dedicated software records the image collection and guides the user through the modeling process. No control points are necessary because the camera is first visually calibrated using an included grid. Additional shape data may be collected with a laser stylus and added to the digital model. The software automatically solves the object s geometry and builds a complex array of polygons representing the surface. Photographic texture collected during the scan is then registered to the surface, resulting in a realistic 3D model. The LightScribe can accommodate objects up to 1 m in size and as small as 5 cm. The LightScribe is appropriate only for the lab environment, as objects must be placed on the turntable for recordation, and controlled lighting and a computer are necessary. This requires that in most cases, artifacts must be removed from the field and recorded in a permanent or mobile laboratory setting. Also, the camera currently available in the LightScribe package unfortunately has below average resolution (640 x 480); therefore images are not particularly sharp. There are a variety of methods one can use to alleviate this problem such as minimizing the number of photo texture frames applied to a fairly bifacial object, but the most impressive improvement will likely come when Immersion offers a better quality camera in the package. 58

67 GMI conducted an assessment of the technique using three artifacts, including two projectile points and an historic Coca-Cola bottle. Production time varied according to the complexity of the object, but scanning and model creation generally averaged under two hours from start to finish. Each object model can be saved in several different file formats for easy analysis in other programs, including.wrl (VRML) and.3ds (3D Studio). Overall, scanning and processing went very smoothly, and was clearly understandable to a novice. The system, while highly automated, is also flexible enough for some image manipulation and model refinement. Accuracy is excellent, but resolution is a little disappointing for very small objects (Figure 18). 18. A 5-cm long projectile point (left) and the scanning results (right) as a three-dimensional model in Rhino Figure 18. A 5-cm long projectile point (left) and the scanning results (right) as a three-dimensional model in Rhino. The 3D models, when viewed on the computer screen, represent a good likeness of the original artifacts, and compared to similarly capable scanning devices, the LightScribe is very affordable. Object scanning and model building went smoothly and rapidly, with manageable file sizes. Using shareware or demonstration copies of more sophisticated applications, files can be distributed on disk or over the Internet to almost anyone. Recommended Automated Convergent Photogrammetry Workflow Calibration The system must first be calibrated using one of three included calibration board, depending on the size of the artifact to be recorded. 59
68 Image Capture The artifact is place on the center of the turntable, on a plastic riser. All lights are dimmed except the backlighting, and using a wizard-driven procedure, the turntable is rotated once while the video camera collects silhouette information. The lights were then turned back on, and the turntable again rotated to collect a series of photo textures of the object. Lighting control is of utmost importance during this step, and determines the final model accuracy and image quality. For complex concave areas, a handheld laser stylus (like a laser pointer) can be used to collect geometric information. Computer Processing/Model Production The LightScribe software guides the user through creating a geometric model in the form of a polygonal mesh from this data. Several hundred thousand points are collected from the silhouette data with which to produce the model. Poor photographs may be deleted manually by frame. The included software allows several different export file types, including Virtual Reality Markup Language (VRML) and all standard modeling formats. End products consist of 3D models in various forms. The simplest format is a VRML model, which cannot be measured, but can be distributed free of charge (Figure 19). Other formats include a variety of CAD and 3D Nurbs Modeling software application formats, which allow measurement, manipulation, and rendering. The resulting models can be rescaled, or rotated in any direction. All characteristics can be measured in the.3ds or.dxf file formats, and photographic image quality can be enhanced and improved using photo editing software. While georeferencing of the object coordinate system cannot be performed during the initial modeling process, it is possible in related applications such as 3D Studio (Wilson, personal communication 2001). 60

69 19. A Coca-Cola bottle with some mud, shown as a three-dimensional model in VRML format Figure 19. A Coca-Cola bottle with some mud, shown as a three-dimensional model in VRML format. Recommended Automated Convergent Photogrammetry Equipment Specifications Camera: A digital video camera is included, with a backlit screen, floodlights, a turntable, calibration equipment, and a laser stylus Software: LightScribe processing software, bundled with the device Workstation: Most cultural resources firms already have the computer equipment needed to process the data collected by the LightScribe. The LightScribe package includes all lighting, cables, and calibration equipment necessary Point collection: Automated, through silhouette data, and manual, using the laser stylus ERROR ANALYSIS The issue of error in photogrammetric imagery is complicated to address, but at the same time is an issue of great concern to many softcopy photogrammetrists. The existing data quality and accuracy standards applicable to close-range softcopy photogrammetry were addressed in Chapter 4. The more qualitative data quality concepts are universal and should be adopted for close-range 61
70 softcopy photogrammetry as well as any geographic mapping projects. Positional accuracy in photogrammetric imagery, however, can be refined for the application of close-range softcopy photogrammetry. A review of experts worldwide drew a range of responses (see Appendix A). Most indicate that an accuracy threshold should not be instituted, due to the wide range of project scales, client needs, and photogrammetry techniques. Those using the PhotoModeler approach are particularly wary of accuracy regulations, as the technique, while not reliably accurate, is the most accessible technology for simple photogrammetric recordation. GMI recommends that the ASPRS Standards for Large-Scale Maps concept be considered as the model for target accuracy levels. Sophisticated softcopy photogrammetric techniques may easily surpass Class I thresholds, while simpler approaches may struggle to reach Class III levels. However, as a consensus cannot, for the time being, be built among experts using the technology in cultural resources, it is more critical to standardize the testing and reporting of positional accuracy, rather than thresholds. With this in mind, the Error Analysis section presents four examples of accuracy research and reports, for two-dimensional image rectification, multistation monoscopic convergent photogrammetry, stereo photogrammetry, and hybrid scanning. These examples should indicate the lower levels of accuracy that might be expected for each technique (except in the case of PhotoModeler, where ideal accuracy is reported), and will illustrate some of the testing and analysis that has already been done with them. It has been noted that some photogrammetrists report their accuracy in the manner 1:1000, 1:5000, etc. This reporting method is called relative error, and is a function of positional accuracy to object distance. GMI recommends that for data reporting and metadata, a combination of image scale, determined from the ratio of focal length to object distance, and the RMSE 95 percent confidence interval, as recommended in NSSDA standards, be used instead. The description of error as 1:[a number] can be confusing to nonphotogrammetrists in its similarity to descriptions of image scales, and it is difficult at first glance to ascertain what the ratio actually means. In fact, the ratio expresses the relationship between error and object distance, e.g., 1 mm positional accuracy at a distance of 2 m is 1:2000 accuracy (Welch and Jordan 1996). This expression can be valuable in the context of published papers, if clearly described as relative error; nevertheless, for FGDC-compliant content and metadata, RMSE and scale must be used. 62
71 Only one recommended approach is not conducive to RMSE assessments. Hybrid laser scanning, because it does not utilize ground-control points or a control frame, cannot be tested for absolute positional accuracy. This is a drawback of the hybrid technology that will hopefully be resolved as the field grows. In the interim, percentage error based on distance measurements should be utilized. Single Image Registration Previous discussion has established that two-dimensional single-image registration does not adequately meet the objective of this document. However, because it is frequently used by most of the experts consulted during this assessment, a simple accuracy result is described here purely to illustrate the wide range of error depending on image perspective. In an experiment using the same photographic input collected for stereo processing, the difference between rectified and actual coordinates was measured across the image. Results were very good for images taken directly perpendicular to the plane of the grave (that is, film plane parallel to reference plane). Orientation residuals were under 2 cm in most cases, and somewhat accurate measurements were possible. For obvious reasons only two-dimensional measurements along the plane of the image could be made. Oblique and vertical measurements were impossible. Results were very poor for images taken at an angle. Orientation residuals often exceeded the smaller dimensions of the grave itself (40 cm or more), and distortion from rubber-sheeting made the image nearly unrecognizable. Stereo Photogrammetry Because close-range stereo softcopy photogrammetry is an emerging technology, very little rigorous accuracy testing has been conducted to date. A series of accuracy studies using closerange methodology and ERDAS processing applications have been conducted in river flume morphology studies, including one in which an international team of geomorphologists and engineers from Canada, the U.S. and England performed a study of river channel geomorphology using close-range oblique stereo photogrammetry processed with ERDAS OrthoBASE. Data were collected with a digital camera and total station. The team found that through processing with this software, good positional accuracy (RMSE=1.9 mm at 1.9 m, 1:1000 relative accuracy) 63
72 could be derived with only 10 minutes of recording (Chandler et al. 2000). Later studies of similar river channel photogrammetry using the same methods and vertical close-range photogrammetry yielded high accuracies (RMSE = 2 mm) at a scale of 1:160 (Chandler, Lane, and Shiono 2001), and 2.6 mm in a second study (Chandler, Shiono, Rameshwanen, and Lane 2001). In GMI s experiments without camera calibration, RMSE averaged about 1 mm (1.5 pixels) at 1 m. Double-blind measurement distance comparisons differed by about 5 percent. Camera calibration can reduce RMSE error by as much as 95 percent (Stein 1997), so calibrated RMSE should easily reach at least.2 mm at 1 m (1:5000 relative accuracy). Clive Fraser, in his stereo photogrammetry work, regularly achieves 1:3000 relative accuracy on architectural projects, and up to 1:20,000 accuracy using stereo/convergent combinations. Others report accuracy of.1 mm at 2-m object distance (1:40,000 relative accuracy). Multistation Monoscopic Convergent Photogrammetry Multistation monoscopic convergent photogrammetry technology using PhotoModeler Pro has been assessed more often, and by a greater range of scientists, than any other single close-range approach. In a University of Innsbruck study, a brick wall covered with an array of control points was recorded and processed in PhotoModeler Pro. RMSE values were low given the fairly great object distance of 12 m (X = 0.53 cm, Y = 0.34 cm, Z = 0.29 cm, or 1:2400 relative accuracy). The Innsbruck study reported relative accuracy (error to object distance) of between 1:1700 and about 1:2500 for non-metric cameras (Hanke 1998). A later study of several objects (Deng and Faig 2001) reported similar results. The combined RMSE of coordinates in a small (17 x 17 mm) test field was 0.17 mm, from a distance of roughly.6 m. The combined RMSE of coordinates in a large (building) test field was 9.3 mm from about 8 m away. Deng and Faig (2001) listed average relative errors as 1:1635 for the small test field and 1:1684 for the large. 64

73 Hybrid 3D Scanning Hybrid three-dimensional scanning has not to date been assessed for accuracy by independent experts. Immersion Corporation has conducted its own accuracy studies, and reports average accuracy to be 1 to 2 percent. That is, modeled objects come within 1 to 2 percent of the actual dimensions of the object as measured by hand. Realistically, RMSE calculations on very small objects may be limited. In order to calculate accuracy, a true measurement must be made using a device of greater accuracy. Surveying instruments may not be accurate enough to record GCPs over an area of less than 10 cm well enough to reliably evaluate discrepancies. The challenge of testing accuracy on small artifacts will ultimately have to be addressed by the scientific community. One somewhat crude way to evaluate the accuracy of small convergent models is to do a series of measurements, both virtually and physically, then evaluate the measurement discrepancies between the average digital and physical results. This sort of testing has been performed in the past (Gisiger et al. 1996) to assess the photogrammetric accuracy on small objects. Limited comparisons seem to indicate that the object geometry degrades very little between the physical artifact and the digital format. GMI tested both the reliability and accuracy of digital measurements by repeatedly measuring four dimensions of a projectile point with calipers, then digitally across a polygonal mesh (Figure 20). 20. Four measurements collected, and two measurements shown as measured digitally Figure 20. Four measurements collected, and two measurements shown as measured digitally. 65
74 The projectile point measured roughly 7 cm by 3.5 cm in size. The range of measurements between analysts, and the difference in median values between physical and digital formats, were recorded. The average error observed during the trial (defined as the difference between mean of measurements digitally and mean of measurements by hand) was.65 mm, with a low of.17 mm. The average error calculated from the outlier-independent median was closer to about.45 mm. With outliers excluded, the measurements varied between.2 mm and 1 mm using the physical model, and.3 mm and.6 mm using the digital model. In other words, in most cases the range of results obtained for a particular measurement was greater than the difference between the average measurements taken physically and digitally. This suggests that quantitative analysis done using a digital model of an artifact introduces little significant error. In this case, GMI calculated the accuracy at just under 3 percent, almost meeting LightScribe s published accuracy claims of 1 to 2 percent. 66
75 CHAPTER 6 DEVELOPMENT OF STANDARD PROCEDURES FOR ANALYSIS OF GEOSPATIALLY REFERENCED PHOTOGRAPHY Digital photogrammetric imagery provides a quality medium for a range of qualitative and quantitative analyses. In many cases, it may provide the only means for analyses, especially when recorded features are subsequently compromised or destroyed. Digital imagery and models, no matter how realistic, cannot replace tactile analysis of material weight, texture, and porosity. However, photogrammetric models provide a stable, accurate, and realistic replica of cultural objects for almost unlimited and repeatable investigation. Four types of analysis that will be frequently conducted on photogrammetric products are error assessments, change analysis, spatial (measurement) analysis, and qualitative analysis. Each of the photogrammetric products described in this document can be analyzed in two ways, either in its native format in the production software, or in third party software in a variety of formats. The best environment for analysis depends on the type of analysis to be done. TECHNIQUES Error assessments (RMSE) are best conducted during processing in the native production software, excepting hybrid scanning, which does not provide this feature. Error assessment for hybrid scanning models can be done in 3D modeling applications such as AutoCAD, MicroStation, 3D Studio, or Rhino. Change analysis is used to assess and monitor the deterioration or alteration of cultural sites and objects over time by comparing the pixel values between two or more photographs. This type of procedure, which can only be performed on flat 67
76 photographic imagery or orthophotographs, must be done in a remote sensing raster GIS software package such as ERDAS Imagine. Spatial analysis, including linear measurements, area and volume quantifications, and elevational and slope measurements, also must be done in a GIS or CAD software package. Stereo pairs can only be measured using a stereo viewer such as Stereo Analyst, either through ERDAS Imagine, ESRI ArcView, or as an autonomous application. Qualitative (or non-geospatial) analysis such as artifact comparison, typing, or teaching, is very flexible and can be conducted in many file formats and software applications. Because accuracy and depth perception are less important in non-quantitative analysis, lossy (compressed or degraded) file formats such as jpegs and VRMLs can be used, and images may be viewed and distributed through shareware software including CosmoPlayer for VRMLs. Image analysis in native software applications has several advantages. First, it is often the only practical way to calculate positional error such as overall RMSE, since this is determined during image orientation. This is the case for both PhotoModeler Pro image modeling and ERDAS OrthoBASE photograph orientation. Secondly, analyzing imagery in its native application minimizes file degradation through compression and translation. Third, native production software in most cases is best equipped to analyze photogrammetric models that it has produced. This is particularly appropriate in the ERDAS software suite, as it has full raster analysis and modeling capabilities. Image analysis in third-party software also has advantages. First, third-party software facilitates distribution to and analysis by a much broader community. Second, in the case of hybrid scanning geometric models, exterior applications must be used for error and quantitative analysis of any kind. Third, it often allows the consolidation of imagery, geospatial data, and photogrammetric models from a wide variety of sources. Finally, exterior software includes GIS applications such as ArcView, which are important in overall geospatial data conflation, indexing, storage, and spatial analysis. When exporting photogrammetric imagery and models to exterior applications, file formats will either be lossy (compressed or degraded), or non-lossy (converted without compromising data). Lossy file formats include jpegs (compressed), and VRMLs (compressed and degraded). Non-lossy file formats include point clouds, polygonal meshes, and imagery in.dxf,.3ds,.tif, or raw formats, or as 3D shapefiles. These file formats are advantageous also because as standard CAD file types, they are not likely to become obsolete within the next decade or so. 68
77 WORKFLOW AutoCAD, Microstation, and CAD-esque NURBS modeling programs must be used to analyze hybrid scanning models, because the LightScribe native application does not have error analysis or quantitative analysis capabilities. However, models can be exported as non-lossy.3ds,.dxf, and.obj files and easily opened in CAD and NURBS programs for analysis. The process is virtually identical for convergent PhotoModeler models. The object is read by these applications as a polygonal mesh with an associated.jpg photographic texture file, which can be applied. Built-in measurement functions within these applications can then be used to conduct a variety of two- and three-dimensional calculations. Rhino, a NURBS modeling program, works very well for quantitative measurements as well as general viewing (Figure 21), although change analysis is not possible. Care must be taken in such applications to observe measurements from all perspectives, in order to accurately position measurement tools; it is easy to inadvertently measure off the surface of the object, since depth is not innately evident. GMI recommends 3D CAD (AutoCAD and Microstation) for experienced CAD users, but 3D modeling applications such as 3D Studio and Rhino are also very powerful applications and require very little training for novice users. 21. Conducting quantitative analysis in the Rhino NURBS environment. Figure 21. Conducting quantitative analysis in the Rhino NURBS environment. 69
78 Compressed, unmeasurable photogrammetric imagery can be distributed widely and inexpensively using various multimedia file formats, including VRMLs,.gifs and.avi movies. These file formats can give viewers quite a good understanding of complex three-dimensional objects or scenes, using only freely-available software such as Windows Media Player and CosmoPlayer. While these environments are not innately geospatially-referenced, they can be linked to georeferenced points in ESRI s ArcView using the hotlink function. They cannot, however, be quantitatively or spatially analyzed in such a format. All photogrammetric models consisting of some type of surface model (polygonal mesh or DEM) and a photographic texture (.jpg or orthophoto mosaic) can be converted to VRML format in the native production software. In PhotoModeler Pro and LightScribe, this is done subsequent to completion of the geometric model. In ERDAS Imagine, the DEM and orthophoto must be opened in VirtualGIS, then exported as a VRML. VRML files consist of a.wrl geometric model file and an associated.jpg texture file. Both files must be stored in the same directory for successful viewing. Using VirtualGIS, virtual fly-throughs of DEM/orthophoto scenes can be recorded as.avi movies for distribution. While such a format facilitates little analysis, it can be used to provide a thorough tour of complex three-dimensional imagery for qualitative assessments. GIS applications such as ESRI s ArcView are probably the most important third-party analysis environment for geospatially referenced photogrammetric models. Compatibility with ArcView is most important because of this application s unparalleled popularity in vector GIS and large market share (35 percent or more) in the GIS community. It is in this environment that most users will attempt to conflate a number of photogrammetric models with existing geospatial data. All three-dimensional photogrammetric models will only be meaningful in ArcView using 3D Analyst, which permits the z (elevational) dimension. Like stereo softcopy photogrammetric models, GIS applications are fundamentally 2.5-dimensional as opposed to truly threedimensional, and are therefore more conducive to DEMs, orthophotographs, and 3D shapefiles than to geometric object models. Nevertheless, any point theme may be imported into the GIS, and as mentioned above, all multimedia files may be linked to geospatially-referenced features using ArcView s hotlink function. Spatial analysis and measurements can be conducted within ArcView on DEMs in the same manner as more common topographic elevation models. In order to conduct extremely precise spatial measurements, however, a stereo viewing environment must be used. 70
.")
79 Photogrammetric stereo pairs can be viewed within ArcView using 3D goggles and the StereoAnalyst extension, or alternately in StereoAnalyst in the ERDAS environment or as an autonomous program. StereoAnalyst provides all the fundamental quantitative measurement functions necessary to measure distances, areas, slopes, and other spatial features (Figure 22). 3D shapefiles can added to the viewer for more complicated analysis, and basic heads-up digitizing and tracing can be done in the viewer as well. GMI recommends that the stereo environment be used for complex measurement analyses whenever feasible, because stereo pairs show depth and facilitate much greater measurement precision. 22. Quantitative analysis using Stereo Analyst within ESRI s ArcView application Figure 22. Quantitative analysis using Stereo Analyst within ESRI s ArcView application. The stereo pair is linked to a GPS point on a topographic quadrangle or a DEM/orthophoto theme within the ArcView project. 71
80 Unfortunately ArcView is primarily a vector GIS application and does not have extensive raster analysis functionality. Therefore for change detection and change analysis, work must be conducted in a raster GIS application such as ERDAS Imagine. Orthorectified imagery can be compared to imagery from previous or later surveys by opening both images in Imagine, linking the viewers, and running the Change Detection function. By specifying pixel spectral tolerances, users can automatically identify regions of significant spectral alteration between imagery. This capability is currently not available in ArcView. In summary, photogrammetric products can be analyzed in either the production software itself, or in third-party software, depending upon the type of analysis desired. In most cases, error analysis must be conducted during initial processing, and therefore within the native software. The only exception to this rule is LightScribe hybrid scanning, which does not offer error analysis; hybrid model accuracy may be measured using alternative methods in CAD or NURBS software. Simple qualitative assessments may be made using low-end applications and small files such as VRMLs and.avi movies. While these environments do not permit measurement or spatial analysis, they are an excellent format for exploring complex three-dimensional models, and can be widely-distributed. Measurements and other quantitative analyses can be performed in CAD or NURBS applications for convergent three-dimensional models consisting of polygonal meshes, or in Stereo Analyst for stereo pairs. When possible, stereo analysis is recommended, due to its superior portrayal of depth. Finally, raster-based analyses such as change detection must be conducted in a raster GIS such as ERDAS Imagine. 72
81 CHAPTER 7 STANDARDIZED METHODS FOR STORAGE AND INDEXING OF GEOSPATIALLY REFERENCED DATA IN A RELATIONAL DATABASE Data storage and file structure describes the storage methods, locations, conventions, standards, and security of spatial data. The concept may be divided into the general categories of data storage and serving, data schema, and metadata standards. The following section discusses basic guidelines for relational database design, file storage, and metadata for integration with a geographic information system (GIS). The reader should be familiar with the Spatial Data Standards/Facility Management Systems (SDS/FMS) database concept and software. For descriptions of linking and populating table from CAD software (Microstation), the reader is referred to the report Aerial Photography Management System (Michael Baker Corporation 2000). DATA STORAGE AND FILE SERVING This discussion assumes that the basic file server and databasing software is already established for the existing GIS. In general, data for a GIS are stored on some sort of file server, accessible to users with permissions, and regularly backed-up. File storage/directory paths mirror database structure. Increasingly, government and private organizations have begun to migrate towards the developing geodatabase concept of an object-oriented relational database management system (ORDBMS), which has been adopted by ESRI. The essence of geodatabasing is the consolidation of all coverages, spatial features and attribute data into a single relational database. This glob data can be stored locally as a personal geodatabase, or ideally on a server as a multi- 73
82 user geodatabase. The geodatabase accommodates object spatial types (as well as the typical point, line, area, image, or surface), which enables the geodatabase to hold non-georeferenced content that is associated with a georeferenced entity. In the ESRI ORDBMS geodatabase model, table attributes can consist of integers, text, date values, unique identifiers, and BLOB values. BLOBs (binary large objects) are any multimedia file, such as imagery, movies, or audio. In these ways the geodatabase can hold and georeference all photogrammetric content. An important aspect of object relational geodatabase compilation is the unique identifying code for each feature in all coverages, which allows the feature to be related to additional attribute and spatial information from any coverage referencing that feature identifier. The unique identifier is discussed later in this section. Microsoft Access can be used to house a personal geodatabase, while Oracle and ArcSDE are necessary for the more powerful, flexible multi-user geodatabase. RECOMMENDED DATA SCHEMA, FEATURES, ATTRIBUTES, AND DOMAINS A relational database management system or RDBMS is a database structure that organizes various tables in a schema, by common characteristics, then relates the tables using linking fields. A RDBMS can be created using Oracle, SQL Server, or on a smaller scale by using Microsoft Access. All governmental agencies must utilize a Department of Defense (DoD) developed standard for geographic data. These standards, the Spatial Data Standards (SDS), dictate data storage, naming conventions, and attribute table population. The Spatial Data Standards are a tool for creating RDBMS schema for geospatial data an evolving set of recommended domains, entities, and classes of data found in geospatial databases, and the relationships between these sets. According to the SDS, all attributes must be stored in an external attribute table. Every data coverage or theme is stored in its own directory based on the type of data it represents. Coverage data (e.g., Road Centerline ) is categorized under a general description (e.g., Transportation ), with a more specific subcategory (e.g., Transportation_Vehicle ). Several other coverages could reside in that subcategory as well (e.g., parking lots and bridges ). An example of the road centerline coverage directory path could be D:/Mapping/Transportation/Transportation_Vehicle /Road_Centerline/trvehrcl, with Trvehrcl as the actual name of the coverage. Each coverage 74
 for reviewing and assessing RDBMS schema, tables, attributes, and domains.")
83 contains only the feature graphics and a unique identifier linking it to the external attribute table. The attribute table has both required and optional fields to be populated. The SDS provides a browser application table generator application (SDSFIE/FMSFIE Browser, now at version 2.0) for reviewing and assessing RDBMS schema, tables, attributes, and domains. Table generators for Access (Access Builder) and SQL (TSSDS Generator) are also provided to assist in RDBMS design and management. Using the SDS Generator applications, technicians can automatically generate tables appropriate to a particular set of data, and link the table to other meaningful tables. In the field of cultural resources, most users will utilize the SDS Entity Set Cultural as their primary category. This entity set (Figure 23) contains four entity classes (archaeological, historic, general, and management), and 17 table types (artifact, milling site, rock art, archaeological site, structure, district, feature, vessel/wrecks, law, reference, sensitivity, survey, etc.). 23. Sample file storage hierarchy for cultural resources tables Figure 23. Sample file storage hierarchy for cultural resources tables. Each of the tables within the entity set may be linked to another table via a primary or foreign key. A primary or foreign key is an attribute in the table that holds a unique identifier. Within the SDS schema, the key is generally common to the same element in different tables. For example, a common primary key site_id might link the tables milling site (crarcmil) and archaeological site (crarcsit). A primary key or foreign key can also be used to link tables in one entity set to tables in another. In the case of cultural resources imagery and threedimensional models, two entity sets will be related via the foreign key media_id (Table 4, Figure 24). 75
84 Table 4 Entities, Tables, and Join Fields for Cultural Resources Imagery Entity Set Entity Class Name Table Name Join field Table Name Cultural Cultural_archaeological Crarcart (artifact) Crarcmil (milling site) Crarcrck (rock art) Crarcsit (site) Entity Set Entity Class Name Cultural Cultural_historic Cultural Cultural_general_fm Cultural Cultural_management Crhiststr (structure) Crhistdtr (district) Crhistfet (feature Crgenchr (characteristics) Crgenhst (chronology) Crgenlaw (law) Crgenlref (reference documentation) Crgenspo (SHPO) Crgenves (vessels or wrecks) Crmgtres (restriction) Crmgtsen (sensitive) Crmgtsrv (survey) Crmgtsty (study site) Media_id Cmmedmed (media) Cmmedimg (image) Cmmedims (image set) Cmmedmul (multimedia) Common Common_media One of the 17 Cultural tables, depending on the subject matter, will be linked to the table Common Media (cmmedmed) through the primary key media_id. This will allow records of items, objects, or sites to be linked to records of imagery, video, and audio. The Common Media table in turn references four child tables (multimedia, common media, imagery, and image sets), which allow records of imagery to reference specific imagery, video, 3D Models, CAD files, and image block files. Most pertinent information describing photogrammetric imagery, including photograph date, coordinates, lineage, focal length, etc., will be recorded in these tables. Currently the Common Media tables do not contain complete attributes for close-range digital imagery. Important missing attributes include object distance, camera make and model, and CCD characteristics (pixel size and resolution). These fields could be considered for addition in the next SDS/FMS release, but in the meantime, can be included in the narrative field in each table. 76

85 24. SDS relational database dependencies and links, based on the media_id key 77 Figure 24. SDS relational database dependencies and links, based on the media_id key.
86 RECOMMENDED METADATA Metadata are textual descriptions of data layers, themes, and databases. Metadata help users understand the origin of the geospatial data, its characteristics, coordinate system, and any type of processing that has been applied to the data. It is important in organizing and maintaining data internally and in clearinghouses, and in providing information for data transfer and use by others. The FGDC has created a widely-adopted standard for metadata, which is made up of seven main sections: identification, data quality, spatial data organization, spatial reference, entity and attribute, distribution, and metadata reference. In addition, the standards contain three supporting sections: citation, time period, and contact. GMI recommends that the FGDC metadata standard be followed for close-range softcopy photogrammetric and associated imagery in cultural resources. For detailed descriptions of FGDC-compliant metadata structure, the reader is referred to the Content Standard for Digital Geospatial Metadata, published by the Federal Geographic Data Committee (1998c). A generalized description of metadata format developed by the United States Department of Agriculture (USDA 1999), and an example of digital orthophotography metadata published by MIT (1994) are provided in Appendix F. Users can build metadata using a number of small applications, include fgdcmeta.aml from the Illinois State Geographical Survey, which creates FGDC compliant metadata in ArcInfo, and ArcView Metadata collector from NOAA, which creates FGDC compliant metadata in ArcView. ESRI s latest generation of GIS applications, ArcGIS, also includes built-in metadata tools. Metadata can be stored in a relational database, but the USGS advises that this is not desirable (Schweitzer 2000). 78
87 CHAPTER 8 SUMMARY RECOMMENDATIONS PARAMETERS In Chapter 3, GMI described four parameters for selecting an effective photogrammetric approach: skill/usability, cost, flexibility, and accuracy. The various photogrammetric approaches rate differently among these parameters, but this document has recommended approaches based on requirements and constraints such as environment, project size and scope, and desired output. The four categories of photogrammetric recordation- two-dimensional single-image rectification, stereo softcopy photogrammetry, multistation monoscopic convergent (using PhotoModeler Pro), and automated convergent/hybrid 3D scanning using LightScribe- are compared in Table 5 below. Two-dimensional single-image rectification, while useful in certain circumstances, does not fulfill the requirement of adequately recording complex threedimensional objects, and has therefore been largely excluded from discussion. For the most accurate and thorough photogrammetric recordation, GMI recommends that technicians use a combination of photogrammetric techniques. In Sadjadi s (1998) close-range photogrammetry feasibility study, the team took care to record in such a manner that all digital photogrammetric techniques for the reconstruction of monuments, including 3D building restitution, stereo photogrammetry, single image rectification, image mosaicing and CAD coverage could be produced. However, GMI also recognizes the need to provide a single bestbet approach for users unwilling or unable to commit to a suite of photogrammetry methodologies. This recommended approach should attempt to meet the greatest breadth of the requirements listed in Chapter 1, as well as rate consistently well among all four parameters discussed in Chapter 3. 79
88 Table 5 Comparison of Photogrammetry Approaches for the Field and Laboratory Scale Control field Stereo Multistation Monoscopic Convergent Hybrid 3d Scanning 2D Rectification Site Good Poor N/A Poor Feature Good Good N/A Good* Building Fair Good N/A Good* Artifact (large) Good Good Very good, to 1 meter Poor Artifact (small) Fair Good Good, to 5 cm Poor Rock art Very good Poor N/A Fair GCPs From control frame No Automated Yes (lab), or Yes (field) Survey No (lab), or Yes (field) No Automated No Modeling Equipment Requirements Image Quality Camera Position Yes No Yes No control Geometric model No Yes Yes No DEM Yes No No No Depth perception Yes No No No Graphics Pentium, 64 Mb+ RAM, No workstation 1 Gb + hard drive space 3D goggles Image capture equipment Specialized production software Pentium II+, 128 Mb+ RAM, 2 Gb+ hard drive space, Open GL 1.1, Hz screen refresh rate Pentium, 16 Mb+ RAM, 30 Mb free disk space, screen resolution, CD-ROM drive For processing and some analysis No No No Off-the-shelf digital Any camera Included digital video Any camera camera camera ERDAS Imagine PhotoModeler Pro LightScribe software ERDAS/ESRI OrthoBASE, Stereo Image Analysis Analyst, Virtual GIS (optional) -or- Image Processing Software, Inc. OrthoMapper and SurfaceMapper Specialized viewing Stereo Analyst, CAD, CAD, 3D Studio, etc. CAD, 3D Studio, Rhino none software etc Manual camera calibration Strongly recommended Included Automated No Pixel resolution Contingent upon camera Contingent upon camera 480 x 480 Contingent upon camera Format Free output VRML, AVI, etc VRML VRML.jpg,.tif, etc. GIS compatible Yes Yes Yes Yes Data storage.tif,.jpg,.blk,.dem,.wrl,.jpg,.obj,.dxf.wrl,.jpg,.obj,.3ds.jpg,.tif,.img.wrl,.shp,.img * applicable only for flat planar objects 80
89 According to the parameters outlined in Chapter 3, the four constraints of flexibility, usability, cost, and accuracy must be considered in the selection of appropriate photogrammetric technology and methodology. A successful photogrammetric approach should allow the greatest possible range in scope and scale of use, utilizing simple, inexpensive, and expandable materials rather than specialized devices. Methods and techniques should be reasonably adopted by nonphotogrammetrists. In other words, mainstream equipment and popular, preferably multi-purpose software should be favored. Costs must be feasible for firms and entities currently already dedicated to other accurate digital technologies. Finally, methods should emphasize accuracy and precision, and accommodate increasing accuracy and precision. Both past assessments (Sadjadi 1998) and the current investigations have determined stereo softcopy photogrammetric recordation to be more generally useful and rigorous than other methods available to non-photogrammetrists. Unlike the other approaches discussed, stereo photogrammetry permits image orthorectification and DEM production. It facilitates accurate and detailed analysis through stereo viewing. Combinations of stereo pairs can be used for convergent modeling, and single components of stereo pairs can be used for single image rectification. Therefore, field and laboratory methodology should emphasize stereo photogrammetry, setting up recordation to be suitable for photogrammetry applying the stereo approach (Sadjadi 1998). To better illustrate the utility of stereo softcopy photogrammetry compared to other potential approaches, the figure below (Figure 25) presents graphic depictions of the types of objects recordable using each method, the input and output dimension requirements, and cost and accuracy constraints. Hybrid 3D scanning seems from limited accuracy assessments to have the greatest potential positional accuracy, and in addition is remarkably rapid and automated. With its moderate cost and user-friendly interface, GMI recommends the hybrid approach for artifact documentation in controlled laboratory environments. However, it s narrow size capabilities (5 cm-1 m) and laboratory set-up constraints limit its overall usability. 81
90 25. Graphic illustration of parameters in selecting a photogrammetric + approach: (a) object sizes and 100complexity conducive to each photogrammetric approach; (b) object sides necessary for model production and dimensional complexity of models; 5 and (c) relative accuracy and 50 software cost Size (m) Plane primitive shape Complexity complex shape Object visibility (required #. faces recorded) a. Input flexibility b. Input and output flexibility D 2.5D 3D Model Dimension 1:10,000 3D Accuracy (Error/ Object distance) 1:5000 1:3000 1:2000 1:1000 1:500 $500 $1000 $5000 $10,000 15,000 2D Image rectification Stereo softcopy photogrammetry Multistation monoscopic convergent (PhotoModeler) Hybrid 3D scanning c. Cost and Accuracy Figure 25. Graphic illustration of parameters in selecting a photogrammetric approach: (a) object sizes and complexity conducive to each photogrammetric approach; (b) object sides necessary for model production and dimensional complexity of models; and (c) relative accuracy and software cost. Most of the experts interviewed use PhotoModeler Pro regularly in photogrammetric analysis and recommend the technology. However, while it is useful for model-making, architectural photogrammetrist Peter Borges makes the salient point that the PhotoModeler approach does not have high attainable accuracy and is not appropriate for very complex objects. PhotoModeler can only be used for objects that are exposed on most sides. PhotoModeler can only interpolate geometric primitives (lines, planes, cylinders), restricting accuracy of points in between. PhotoModeler does not orthorectify photographs nor generate DEMs, and has much lower attainable accuracy with non-metric cameras than hybrid 3D scanning and stereo photogrammetry. Additionally, PhotoModeler does not have professional-grade photogrammetric 82
91 capabilities, limiting it for instance to a 20 Mb initial image size. Finally, without stereo image processing and viewing capabilities, this approach cannot render depth on the computer screenan important aid in measurement and analysis. Many cultural resources professionals steadfastly recommend PhotoModeler technology because of its ease-of-use; few, however, would argue that it could match the power, sophistication, and accuracy of more industrial stereo photogrammetry software. SUMMARY WORKFLOW SPECIFICATIONS Stereo softcopy photogrammetry is the most flexible and potentially accurate method for closerange applications in cultural resources recordation. Stereo softcopy photogrammetry can be used to model simple and very complex objects and scenes of almost any scale, and can produce stereo models, DEMs, orthorectified imagery, and even 2.5-dimensional models using multiple DEMs and orthophotos. Using high-resolution laser data and stereo photogrammetric imagery, even more accurate orthorectified imagery and virtual models can be generated. Low-end multistation monoscopic convergent photogrammetric applications such as PhotoModeler Pro are valuable for a few environments where features can be thoroughly photographed from all sides. PhotoModeler Pro can generate a relatively accurate three-dimensional model, which may be rotated and viewed in 3D modeling programs or as a VRML. For small objects in the laboratory, the LightScribe hybrid scanning system provides faster processing and better accuracy than manual methods, but has size and setting constraints. Two-dimensional image rectification is useful for historical photos or for less important or planar objects, but can produce massive residuals when used improperly. Makers and users of photogrammetric surveys must be knowledgeable of accepted notions of accuracy, and provide objective descriptions of it; furthermore, technicians must be knowledgeable of the photogrammetric survey in order to identify obvious blunders (CIPA 1993). For the most successful photogrammetric image capture, a good-quality 3 megapixel or better digital camera should be used. The camera must be calibrated before image processing by photographing a control field at the camera settings to be used in the field. Camera Calibration Toolbox for Matlab can be used to process the results of the calibration and prepare a calibration file for later import. 83
92 Methodology should be organized to allow a wide range of digital analyses; GMI recommends stereo pairs be collected from a number of angles for possible convergent modeling. Recordation must be carefully planned and conducted in order to maintain at least 60 percent overlap of stereo pairs, as well as appropriate camera base/object distance between images. The CIPA 3x3 Rules are a good qualitative guideline for conscientious image capture. For conventional photogrammetry, CIPA (1993) recommends that the camera base/object distance should be consistent between stereo pairs, and should range between 1/5 to 1/15. This is less of an issue in softcopy photogrammetry, where differing focal lengths allow a greater range. In applications such as the ERDAS suite, it is most important that base distances do not differ widely between two images in a stereo pair. Object distance for one photo should never exceed twice the object distance of its pair. In general, the more homogeneous the base/distance ratio between images and stereo pairs, the better the product. When at all possible, photographs must be taken with the camera film plane parallel to the reference plane minimizing obliquity. Camera settings must be homogeneous throughout recordation, and must be carefully recorded for use during processing. Ground control points, at least 3-6 spread across each image, must be marked and measured with a Total Station. Base distance and reference measurements should also be collected. For better DEM generation, high-end laser scanning data should be used. Unaltered copies of all photographs should be archived for safe-keeping. Working copies, in tiff or.img format, should be renamed logically, e.g., grave23_thorax_left or house_façade_ north, for easier reference during processing. Images should NEVER be rotated, resized, or cropped, as pixel size and image dimensions are critical for solving orientation. In the softcopy photogrammetry software, the images are then imported into a project, the camera parameters set, and any known camera calibration information imported. Geospatial coordinates and map information must conform to FGDC guidelines. Horizontal map datum NAD 83 and vertical map datum NAVD 88 are preferred, but NAD27 and NGVD 29 may be used if necessary. Unprojected (latitude/longitude) or Universal Transverse Mercator projection coordinate systems are the most widely-accepted. During processing, defining tie points per photograph can improve exterior orientation and lower RMSE values. RMSE accuracy should be recorded and be clearly and objectively described according to FGDC 95 percent confidence interval standards in later metadata. Relative accuracy (RMSE:Object Distance, approximately) is useful for some discussions of 84
93 accuracy, but does not need to be included in metadata. Oriented images can be saved as stereo pairs, as a block file, or orthorectified using a DEM and saved as an orthorectified mosaic or as a VRML or avi. Completed imagery should be stored according to media type, and indexed in an object relational database using the field media_id to link imagery to other georeferenced cultural resources GIS data. Imagery and photogrammetric models can be analyzed either in the native softcopy photogrammetry application, or using the Stereo Analyst or 3D Analyst extensions within ArcView, or using CAD applications such as AutoCAD, or 3D Studio or other 3D modeling applications. Qualitative observations can be made in low-end applications, such as CosmoPlayer for VRMLs or Windows Media Player for.avi movies. CONCLUSIONS Clearly there is a growing need for efficient, effective, and economical recordation methodologies in cultural resources documentation and mitigation. Traditional recording methodologies are tedious, time-consuming, and labor-intensive, and do not provide the accuracy or efficiency of emerging digital photogrammetric methodologies and related geospatial technologies. Archaeologists who have formerly used a combination of photography, hand drawings, and survey to record cultural resources are beginning to incorporate digital technologies (GIS, CAD, VR), into their repertoire. By applying digital technologies to archaeological recordation, archaeologists stand to greatly improve the quality and usability of their data. Following the guidelines of the project scope, GMI has researched and developed a set of recommended standards through literature reviews, interviews with experts worldwide, and research and experimental studies using a variety of techniques. GMI concludes that while a photogrammetrically heterogeneous approach to documentation is ideal, stereo softcopy photogrammetry is the most universally beneficial technique. Research and pilot studies indicate that this method provides the automation, flexibility, and attention to accuracy that will meet the requirements of users in the field of cultural resources, at a moderate cost. As cultural resources management migrates into the digital age, close-range softcopy photogrammetry can be incorporated in a straightforward manner. Two- and three-dimensional photogrammetry is in fact 85
94 already being used in archaeology, and with reasonable standardization and effort, this technology can improve the quality and usability of photographic data, and can allow the recordation of previously inaccessible resources. 86
95 REFERENCES CITED Advisory Council on Historic Preservation (ACHP) 1999 Protection of Historic Properties. 36 CFR 800. American Society for Photogrammetry and Remote Sensing (ASPRS) 1995 DRAFT Standards for Aerial Photography. ASPRS Professional Practice Division, Specifications and Standards Committee. standards/photography.htm. Accessed 5/16/ ASPRS Accuracy Standards for Large-Scale Maps. Photogrammetric Engineering & Remote Sensing, Vol 56, No 7, pp Washington D.C. Archaeoptics Ltd Archaeological 3D Scanning. html. Accessed 8/16/2001. Boccardo, P., S. Dequal, A. Lingua, and F. Rinaudo 2001 True Digital Orthophoto for Architectural and Archaeological Applications. International Archives of Photogrammetry, Remote Sensing and Spatial Information Sciences, Volume XXXIV, Part 5/W1. From the International Workshop Recreating the Past: Visualization and Animation of Cultural Heritage, 26 February - 1 March 2001, Ayutthaya, Thailand. Armin Gruen and Shunji Murai, editors. Bottrill, A., G. Peirson, G. Taylor, S. Parsely, and P. Thomas 1998 New and Traditional Methods for Creating Three Dimensional Models of Structures. Surveying World. Vol 6, Issue 5, pp Bryan, P Current Techniques in the Measured Survey of Historic Fabric. Burns, J. A Recording Historic Structures. John A. Burns, Ed., AIA. The AIA Press, Washington, D.C. 87
96 2000 The Digital Revolution and Architectural Records: HABS/HAER at the Threshold of The Twenty-First Century. In Architectural Records Conference Report. arch_records/burns_lecture.htm. Accessed 5/7/2001. Carbonnell, M Architectural Photogrammetry. In Non-Topographic Photogrammetry, edited by H. M. Karara, Chapter 19, pp American Society for Photogrammetry and Remote Sensing, Falls Church, Virginia. Chandler, J.H., S.N. Lane, and P. Ashmore 2000 Measuring river-bed and flume morphology and parameterising bed roughness with a Kodak DCS460 digital camera. Archives of Photogrammetry and Remote Sensing, XXXI, International Society for Photogrammetry and Remote Sensing, Amsterdam. Chandler, J. H., S. N. Lane, and K. Shiono 2001 Acquisition of digital elevation models at high spatial and temporal resolutions using automated digital photogrammetry. HRWallRep.html. Accessed 5/20/2001. Chandler, J. H., K. Shiono, P. Rameshwanen, and S. Lane 2001 Measuring Flume Surfaces for Hydrolics Research Using a Kodak DCS460. Photogrammetric Record, 17(97), pp CIPA 1993 Optimum Practice in Architectural Photogrammetry Surveys. In Architectural Photogrammetry. Sri Lanka National Committee of ICOMOS, Sri Lanka. Croteau, T Documenting Vessels for HABS/HAER using CAD and Photogrammetry. Maritime Park Association. Accessed 9/13/2000. Daniels, R The Need for the Solid Modeling of Structure in the Archaeology of Buildings. Internet Archaeology, Issue 2. Accessed 5/30/2001. Deng, G., and W. Faig 2001 An Evaluation of an Off-the-Shelf Digital Close-Range Photogrammetric Software Package. Photogrammetric Engineering & Remote Sensing, Vol. 67, No. 2, February 2001, pp Desmond, L., P. Collins, T. Gallareta Negron, and J. Callaghan 2001 Gateway into the Past: Photogrammetric Documentation of the Arch, Labna, Yucatan, Mexico. Accessed 5/7/
97 Eiteljorg, H Single-Photo Photogrammetry at Pompeii in pompeii/ann-rpts/95/pg-95.html. Accessed 12/5/2000. Federal Geographic Data Committee (FGDC) 1998a GeoSpatial Positioning Accuracy Standards Part 3: National Standard for Spatial Data Accuracy. FGDC-STD Reston, Virginia. 1998b 1998c GeoSpatial Positioning Accuracy Standards Part 1: Geospatial Positioning Accuracy Standards. FGDC-STD Reston, Virginia. Content Standard for Digital Geospatial Metadata. FGDC-STD Reston, Virginia. 1998d GeoSpatial Positioning Accuracy Standards Part 2: Standards for Geodetic Networks. FGDC-STD Reston, Virginia. 1998e GeoSpatial Positioning Accuracy Standards Part 4: Standards for Architecture, Engineering, Construction (A/E/C) and Facility Management. Public Review Document. Reston, Virginia Content Standards for Digital Orthoimagery. FGDC-STD Reston, Virginia. Forte, M Introduction. In Virtual Archaeology: Great Discoveries Brought to Life Through Virtual Reality, edited by Maurizio Forte and Alberto Siliotti. Thames and Hudson Ltd, London. Gisiger, A., E. Cooper, Y. Yuan, and W. F. Limp 1996 Development and Implementation of a Rapid Low-Cost Photogrammetric Data Archival System for Artifact and Osteological Inventory. Center for Advanced Spatial Technologies. University of Arkansas, Fayetteville. Hanke, K Accuracy Study Project of Eos Systems PhotoModeler. photomodeler.com/study/study3.htm. Accessed 5/20/ Report über den International Workshop on Recreating the Past Visualization and Animation of Cultural Heritage, Ayutthaya, Thailand. Photogrammetrie, Fernerkundung und Geoinformation. June Heemskerk, J Applied Close-Range Photogrammetry: Creating a 3D Model of a Building from Photographs. Accessed 12/05/
98 Hosomura, T., and T. Ohta D Modeling of Earthenware by Using Video Camera. International Archives of Photogrammetry, Remote Sensing and Spatial Information Sciences, Volume XXXIV, Part 5/W1. From the International Workshop Recreating the Past: Visualization and Animation of Cultural Heritage, 26 February 1 March 2001, Ayutthaya, Thailand. Armin Gruen and Shunji Murai, editors. Imura, M., Y. Tabata, I. Kanaya, T. Kuroda, Y. Manabe, O. Oshiro, and K. Chihara 2001 Digital Archiving of Kamegata-Ishi (Turtle Shape Stone) Using Data Fusion of Heterogeneous Measurements. International Archives of Photogrammetry, Remote Sensing and Spatial Information Sciences, Volume XXXIV, Part 5/W1. From the International Workshop Recreating the Past: Visualization and Animation of Cultural Heritage, 26 February- 1 March 2001, Ayutthaya, Thailand. Armin Gruen and Shunji Murai, editors. Jeffrey, S A Simple Technique for Visualising Three Dimensional Models in Landscape Contexts. Internet Archaeology, Issue Accessed 5/30/2001. King, T It s an Adverse Effect to Destroy and Archaeological Site! (Duh): Part Three. Society for American Archaeology Bulletin. Volume 18, No. 3. May Massachusetts Institute of Technology (MIT) 1994 Metadata document for MassGIS Digital Orthophoto Massachusetts Geographic Information System (MassGIS). Cambridge, MA. Michael Baker Corporation 2000 Aerial Photography Management System. Contract Report for the CADD/GIS Technology Center. Jackson, MS. Mills, J., and G. Peirson 2001 Low cost software versus traditional photogrammetric methods for historic building façade measurement. University of Newcastle upon Tyne. uk/research/ projects/english_heritage/engher.htm. Accessed 5/17/2001. Minnesota Planning Land Management Information Center (LMIC) 1999 Positional Accuracy Handbook: Using the National Standard for Spatial Data Accuracy to Measure and Report Geographic Data Quality. Land Management Information Center, St. Paul. National Geographic 2000 Digitizing David : Michelangelo enters the computer age. National Geographic. October National Park Service (NPS) 1996 Recording Historic Structures & Sites for the Historic American Engineering Record. HABS/HAER, National Park Service, Washington, D.C. 90
99 Ogleby, C The Ancient City of Ayutthaya- Explorations in Virtual Reality and Multimedia. International Archives of Photogrammetry, Remote Sensing and Spatial Information Sciences, Volume XXXIV, Part 5/W1. From the International Workshop Recreating the Past: Visualization and Animation of Cultural Heritage, 26 February - 1 March 2001, Ayutthaya, Thailand. Armin Gruen and Shunji Murai, editors. Ogleby, C., and Wandhausl 1994 The CIPA 3x3 Rules. Pahel, J Detailed As-Built of Courthouse Produced Via New Laser Scanning Technology. Professional Surveyor. May Patias, P Caring for the Past, Aiming at the Futures: Plans and policy of ISPRS Commission V. International Archives of Photogrammetry, Remote Sensing and Spatial Information Sciences, Volume XXXIV, Part 5/W1. From the International Workshop Recreating the Past: Visualization and Animation of Cultural Heritage, 26 February - 1 March 2001, Ayutthaya, Thailand. Armin Gruen and Shunji Murai, editors. Rüther, H Report on CIPA International Symposium Göteborg, Sweden, October Accessed 5/7/ Report on CIPA International Symposium Göteborg, Sweden, October Accessed 5/7/2001. Rüther, H., C. Fraser, A. Gruen, and T. Buehrer 2001 The Recording of Bet Giorgis, a 12 th Century Rock-Hewn Church in Ethiopia. International Archives of Photogrammetry, Remote Sensing and Spatial Information Sciences, Volume XXXIV, Part 5/W1. From the International Workshop Recreating the Past: Visualization and Animation of Cultural Heritage, 26 February - 1 March 2001, Ayutthaya, Thailand. Armin Gruen and Shunji Murai, editors. Sadjadi, S. Y An Integration of Close-Range Photogrammetry and CAD System for Cultural Monuments: Preliminary Findings. Department of Geography and Topographic Science, University of Glasgow, UK. Schweitzer, P Frequently Asked Questions on FGDC Metadata. USGS. tools/ metadata/tools/doc/faq.html#5.1. Accessed 08/20/
100 Slonecker, T. E., and N. Tosta 1992 National Map Accuracy Standards: Out of Sync, Out of Time. Geo Info Systems, Vol. 2, No. 1. Stein, G.P Lens Distortion Calibration Using Point Correspondences. MIT Artificial Intelligence Lab. Cambridge, MA. Texas Parks and Wildlife 1999 Computer-Enhanced Photos Uncover Hueco Tanks Rock Art. TPW News, September 13, Texas Parks and Wildlife, Austin. U.S. Department of Agriculture (USDA) 1999 Standard for Geospatial Data Set. Metadata Scientific Standards. Vote, E Photogrammetric Digital Reconstruction in Archaeology: The Great Temple at Petra, Jordan. Brown University. index.html. Accessed 5/20/2001. Welch, R., and T.R. Jordan 1996 Using Scanned Air Photographs. In Raster Imagery in Geographic Information Systems. S. Morain and S.L. Baros, eds. Onward Press. Westcott, K. L Introduction. In Practical Applications of GIS for Archaeologists: A Predictive Modeling Kit, edited by Konnie L. Wescott and R. Joe Brandon. Taylor and Francis, Philadelphia. Wolf, P. R., and B. A. Dewitt 2000 Elements of Photogrammetry, with Applications in GIS. Third Edition McGraw- Hill, Boston. Zhang, Z A Flexible New Technique for Camera Calibration. Technical Report MSR-TR Microsoft Research, Redmond, Washington. 92
101 GLOSSARY accuracy: the degree to which information on a map or in a digital database conforms true or accepted values. In a GIS database, it is possible to consider horizontal and vertical accuracy with respect to geographic position, as well as attribute, conceptual, and logical accuracy. Accuracy is different than precision, which concerns the level of measurement or detail of data in a database. attribute: a characteristic of a geographic feature described by numbers, characters, images and CAD drawings, typically stored in tabular format and linked to the feature by a user-assigned identifier. CAD: acronym for computer-aided design, or computer-aided design and drafting (CADD). An automated system for the design, drafting, and display of graphically oriented information. Although most CAD systems lack certain features essential to GIS analysis, such as the power to manage different spatial coordinate systems and database capabilities, many CAD systems have been developed into full GIS with the addition of necessary functions. calibration: the process of choosing attribute values and computational parameters so that a model properly represents the real-world environment being analyzed. CCD: acronym for charge-coupled device. A light-sensitive semiconductor device manufactured in an array for use in cameras and other sensing applications. convergent photogrammetry: a photogrammetric technique that uses disparate perspectives obtained from (digital) images taken from multiple angles, to calculate relative spatial locations of a set of points. coordinate system: A reference system used to measure horizontal and vertical distances on a map. A coordinate system is usually defined by a map projection, a spheroid of reference, a datum, one or more standard parallels, a central meridian, and possible shifts in the x- and y- directions to locate x,y positions of point, line, and area features. A common coordinate system is used to spatially register geographic data for the same area. 93
102 DEM: acronym for digital elevation model. A digital representation of a continuous variable over a two- dimensional surface by a regular array of z (elevation) values referenced to a common datum. Digital elevation models are typically used to represent terrain relief. Also referred to as digital terrain model (DTM). DTM: acronym for digital terrain model. A method of transforming elevation data into a contoured two-dimensional surface or a three-dimensional display. error: the difference between a particular value and the true or correct value, including random errors, systematic errors, and mistakes. ESRI: Environmental Systems Research Institute, Redlands, CA. GIS market leaders and makers of ArcView, ArcInfo, ArcGIS, and related software. FGDC: acronym for the The United States Federal Geographic Data Committee, composed of representatives of several federal agencies and GIS vendors, which has the lead role in defining spatial metadata standards. georeference: To establish the relationship between page coordinates on a planar map or image and known real-world coordinates. GIS: acronym for geographic(al) information system. An organized collection of computer hardware, software, geographic data, and personnel designed to efficiently capture, store, update, manipulate, analyze, and display all forms of geographically referenced information. GPS: acronym. global positioning system. A system of satellites and receiving devices, originally developed for the military, and used to precisely compute positions on the Earth. GPS is used in navigation, and its precision (often within centimeters using high-end equipment) supports cadastral surveying. jpeg: acronym for joint photographic expert group. Image compression format for single digital images. map scale: the relationship between distance on a map (or image) and the corresponding distance on the earth's surface. Map scale is often recorded as a representative fraction such as 1:1,000,000 (1 unit on the map represents a million units on the earth's surface) or 1:24,000 (1 unit on the map represents 24,000 units on the earth s surface). The terms large and small refer to the relative magnitude of the representative fraction. Since 1/1,000,000 is a smaller fraction than 1/24,000, the former is said to be a smaller scale. Large-scale maps are used for detailed maps of small areas. micron: the unit of length defined to be meter. monoscopic photograph: a single photograph of a given area, or subject obtained with a camera having one lens system and shutter, as opposed to a stereo pair. 94
103 NAD 27: North American Datum of A datum based on the Clarke ellipsoid of 1866, with a base station at Meades Ranch in Kansas. NAD27 used the latitude and longitude for Meades Ranch and the Clarke 1866 values to determine the latitude and longitude of surveying monuments throughout the contiguous United States and Alaska. These monuments served as starting points for more local surveying and mapping efforts. Use of this datum is gradually being replaced by the North American Datum of NAD 83: North American Datum of An earth-centered datum based on the Geodetic Reference System of In developing NAD83, the National Geodetic Service used data from NAD27. As a result, the latitude and longitude assigned to all NAD27 monuments has changed by as much as 350 feet. NURBS: acronym for Non-Uniform Rational B-Splines, used for more curved, realistic 3D modeling. orthophoto: a photograph, usually aerial, that has been orthorectified using photogrammetric techniques. orthorectification - Use of photogrammetric techniques such as stereo pair mass point generation and DEMs to adjust and correct distortions in images. pixel: picture element. One element in an array holding image information, which contains brightness and color information. The size of the pixel limits how much an image can be enlarged, and how high the image resolution will be. precision: the level of measurement and exactness of description in a GIS database. Precise data--no matter how carefully measured--may be inaccurate. Therefore, a distinction is made between precision and accuracy. raster: A cellular data structure composed of rows and columns for storing images. Groups of cells with the same value represent features. RDBMS: acronym for relational database management system. A database management system with the ability to access data organized in tabular files that can be related to each other by a common field (item). An RDBMS has the capability to recombine the data items from different files, providing powerful tools for data usage. RMS error: Root mean square error. A measure calculated when registering/orienting a map or photograph, indicating the discrepancy between known point locations and their digitized locations. The lower the RMS error, the more accurate the digitizing or transformation. rubber-sheeting: A procedure to adjust coverage features in a non-uniform manner. Links representing from- and to-locations are used to define the adjustment. stereo(scopic) photographs: Two photographs obtained of a given area or subject from different angles, and overlapping at least 60 percent. The images, when viewed as a stereopair, give the mental impression of a three-dimensional model 95
104 tiff: acronym for tagged image (or interchange) file format. An industry-standard raster data format that supports black-and-white, gray-scale, pseudocolor, and true-color images, all of which can be stored in a compressed or uncompressed format. UTM: Universal Transverse Mercator, a series of 120 coordinate systems based on the Transverse Mercator projection originally developed by the U.S. Army for a world-wide mapping project. All zones have their origin at the equator, use the meter as the system unit, and have a false easting of 500,000 m and a false northing of zero. vector: A coordinate-based data structure commonly used to represent geographic features as points, lines, or polygons. Each linear feature is represented as an ordered list of vertices. VRML: acronym for virtual reality markup language. 96
105 APPENDIX A EXPERT RESPONSES
106 List of Experts Contacted Name Organization Response Interview Questionnaire Peter Borges Documenta Architectural Photogrammetry, WA Sonny Cudabec National Forest Service Michael Doneus U. of Vienna, Austria No response Christopher Dore Archaeological Mapping Specialists, CA Jane Drummond U. of Glasgow, UK No response John Ebert Ebert and Associates, NM No response Mark Flood USDA Forest Service No response Geometrics Clive Fraser U. of Melbourne, Australia Dave Knopp StellaCore Corp., CO Jim Harris L3D, Corp, TX Jon Mills U. Newcastle upon Tyne, UK Cliff Ogleby U. of Melbourne, Australia No response Frank Scarpace U of Wisconsin/Image Processing Software, Inc Mladen Stojec ERDAS Atlanta, photogrammetry Tony O Dempsey ESRI South Asia Frank von den Huevel Technical U. Delft, Netherlands Rachel Wilson Immersion Corp, CA Andy Zusmanis ERDAS Atlanta, photogrammetry Stephen Rawlinson University of New Brunswick, Canada A-2
107 List of questions 1. Do you currently conduct close-range softcopy photogrammetry? 2. Do you use close-range softcopy photogrammetry for cultural/natural resources recordation and analysis? 3. Do you do 2d or 3d photogrammetry, or both? 4. Do you do stereo or convergent photogrammetry, or both? 5. What processing software do you use? (e.g. SocetSet, ERDAS, Leica, Z/I, etc) 6. What camera types do you use? (e.g. metric, off-the-shelf, digital, film, video, etc) 7. Do you use automated hybrid scanning systems? (e.g. LightScribe or Pixi) 8. Do you think that lasergrammetry is useful in photogrammetric cultural/natural resources recordation and analysis? How? (lasergrammetry= Cyrax 2500 or various other big scanners, which gather a huge amount of 3D point data) 9. What accuracy do you currently see in your close-range work? How do you assess your accuracy? 10. Would you recommend rated accuracy (levels, like the ASPRS large scale mapping standards) or a simple threshold of acceptibility? A-3
108 Prof. Clive Fraser Department of Geomatics, University of Melbourne 1. Yes, primarily industrial & engineering measurement, but also archaeological & architectural recording. 2. Yes. 3. Primarily 3D with some minor 2D work. 4. Both, but overwhelmingly convergent. For the recording of complex sites (e.g. buildings) we establish a framework with convergent and then use stereo for localized orthorectification and texture mapping. 5. For convergent we use the Australis package for off-line digital photgrammetric networks (unlimited number of images & object points, with self-calibration & numerous other interactive features) and for stereo we use Z/I, Socet Set & ERDAS. We also use Photomodeler for some simple jobs. 6. Off-the-shelf digital, ranging from $1000 to $10000 in cost. These are all metrically calibrated. 7. No 8. Yes. For complex small object (artifacts) and also for complex interiors (churches, tombs, etc) 9. Definitely! Our work ranges from accuracies of 1:5000 of the size of the object to 1:100,000 (0.1mm over 10m). Generally, for architectural/arch. work we are operating in the 1:3000 (eg stereo) to 1:20,000 (multi-station convergent) range. 10. I believe it would be quite problematic to generate generic accuracy ratings given all the variables involved. I would support, however, much more emphasis on accuracy & precision. This is something that is best left to the customer: He/she specifies what accuracy is required & the photogrammetrist responds to that specification, either by measuring to the required tolerance or informing the customer of what is achievable given the conditions of the work, the method & equipment to be employed and the budget! A-4
109 Dr. Jon Mills Department of Geomatics, University of Newcastle upon Tyne 1. Yes 2. Yes 3. Both 4. Both 5. LH Systems SOCET Set, VirtuoZo, Photomodeler 6. Wild P32 metric, Rolleimetric 6006, Kodak DCS200, Kodak DCS No 8. Yes 9. See: MILLS, J. P., PEIRSON, G. C., NEWTON, I., and BRYAN, P. G, Photogrammetric investigation into the suitability of desktop image measurement software for architectural recording. International Archives of Photogrammetry and Remote Sensing, 33(B5): MILLS, J. P., NEWTON, I and PEIRSON, G. C., Pavement deformation monitoring in a rolling load facility. Photogrammetric Record, 17(97): MILLS, J., and PEIRSON, G., The fair-weather surveyor's dream: using your camera to survey structures. Civil Engineering Surveyor, April 2001: The former [rated accuracy levels like the ASPRS large scale mapping standards]. A-5
110 Tony O Dempsey ESRI South Asia 1. I do so occasionally as the need arises (it is not what I do full time)- I try not to make a habit out of it :-) 2. Mainly natural resources - e.g biological studies, however also Military applications from UAV (which would be considered Mid Range Photogrammetry., however the problems of solution are very similar to close range). I tried to do some with underwater oil well surveys however I had trouble getting good enough imagery. 2. 3d for close range, however I have also done 2D from UAV 3. I like to make the photography convergent however it depends on circumstances of the object and limitations in placement of sensors. No matter how I configure the cameras, my objective is to obtain good intersection geometry so as to achieve the desired (design) accuracy. If Additional Parameters are to be used, then there are very specific configurations required for convergent imagery due to mathematical correlation between additional parameters. An example of this is the first term of radial lens distortion and focal length which are highly correlated in that they both have a direct scaling effect 4. I prefer to use Erdas Imagine Orthobase because of the ease of use and it offers good control over the triangulation, I have also used Socetset for 2D however not extensively. 6. Sony Video Cam (off the shelf) for close range movement studies (flying snakes) Underwater Video (underwater oil rig surveys for weld inspections) Military (forget the manufacturer) Video Cam for UAV applications Hasselblad non-metric cams (off the shelf) Hand Held Digital Cams (Any brand) 7. No - I have always had somebody who is good at extracting frames from Video, or I get the digital data directly from the digital still cam, or I scan the non-metric prints directly with desktop scanner (one by one... aaarrrrggghh) 8. As far as I know, these systems are currently very expensive and are therefore applicable for larger projects (like as-built surveys for oil refinery), however there are smaller jobs that do not justify the expense - this is where close range photogrammetry is applicable. 9. This is a how long is a piece of string type of question, the type of accuracy depends on the project. I assess accuracy by post triangulation analysis of the residuals and standard deviations of computed values (exterior, interior and object). I also use check points to verify this. Once I have verified my accuracy with check points, I often reprocess and include the check points as controls. 10. In my opinion, Accuracy standards for mapping,i.e. FGDC are not applicable to close range work. Because when you do close range, it is generally for a very specific and specialized purpose. In addition to this there is more opportunity to have convergent photography than for standard aerial Photography. The way I approach the question of accuracy is: a. Determine required accuracy for the project. Think about what the measurements are to be used for. Come up with an accuracy specification. Distinguish between Relative and Absolute accuracy. A-6
111 Tony O Dempsey ESRI South Asia b. With experience you get to know the capabilities of the various sensors. If you don't have experience with a particular sensor, you will need to experiment to see what accuracy can be achieved. The accuracy achievable is best worked out in terms of image coordinate system. Say I have 5 micron pixels, however through experimentation I find I can achieve 30 micron accuracy without calibration. This estimate can then be extrapolated empirically or by variance =cvariance analysis to any configuration of cameras and object space. c. I design my cam configuration and control configuration with this knowledge - if I have a choice of cam locations I can design a good orthogonal ray intersection - this maximizes my accuracy through good geometry. Conversely if I am restricted in my cam locations for various reasons (for example I might want to do stereo viewing in which case my base-object ratio and convergence are limited by human needs), then I will not have optimal intersections at certain ranges. When this happens I need to precalc estimates of accuracy variation throughout the range of observations and decide if they are acceptable for the purpose of the survey... if not I either have to change the geometry or add sensor (which of course also changes the geometry). There have been many studies into close range non-metric photogrammetry and many of these are documented in Photogrammetric Record as well as PE & RS Journals: here is a list of some that I keep on hand: - Photogrammetric Record 17(91) 1998 The development of camera Calibration Methods & Models - Photogrammetruc Record 11(62) 1983 Accuracy of a system for Analytical Close Range Photogrammetry - Photogrammetric Record 14(80) 1992 Calibration of a 35mm non-metric camera and the investigation of its potential use in photogrammetry - Photogrammetric Record 14(8) 1992 Experiences in Calibrating Small Format Cameras- Photogrammetric Record 15(87) 1996 The Metric impact of reduction optics in Digital Cameras - PE & RS, March 1999 Testing Camera Calibration with Constraints So to answer the question, I would recommend standardizing the means of assessing the accuracy achievable. The geometry of the project (object location, sensor location) can be modeled mathematically and by plugging in a-priori estimates of image measurement accuracy and control point accuracy, variance-covariance propagation methods can predict accurate of object points in terms of error ellipses. The trick here is to get good a-priori estimates for the image measurements. Indications can be got from the literature, however you really need to experiment with a particular sensor to verify it. I once started to write such a program however I ran out of steam due to work & personal commitments. Others have written such programs and I recall that there is a paper in one of the journals on this. Most of these programs were written by people in academic institutions and no commercial output was ever generated as far as I know. Sometimes accuracy is not an issue - with the underwater stuff, we just wanted to convert a stream of video into a single image so that weld quality of sputs could be indicated by annotations - for an engineering report. This was a case where the result of the mosaic was not really mean for measurement, rather for aesthetic presentation. A-7
112 Andy Zusmanis ERDAS Atlanta 1. ERDAS does not do any production work in-house. Its focus is producing, selling, and supporting software. However, the ERDAS photogrammetric suite is capable of performing various softcopy photogrammetry tasks. Various ERDAS user have successfully used the ERDAS photogrammetry software for close range and terrestrial applications. 2. ERDAS users have used ERDAS photogrammetric software in close range applications. For instance, the ERDAS German distributor, GeoSystems, used ERDAS software for analysis of an ancient Roman wall. 3. ERDAS photogrammetry software supports both 2D and 3D applications. 4. ERDAS photogrammetry software can handle both stereo and convergent images. 5. The processing software includes ERDAS IMAGINE OrthoBASE, OrthoBASE Pro, Stereo Analyst, and ERDAS IMAGINE Virtual GIS. 6. The ERDAS photogrammetric software was designed with flexibility of image sources being a major consideration. As a result, the software can work with almost any single perspective image source, as long as there is some rudimentary information available about the camera. 7. No. ERDAS software does not use this type of device for primary data collection. However, the ERDAS software (i.e. Virtual GIS) can use the finished output from such devices (i.e. VRML and DXF files) for 3D visualization and analysis. 8. Yes, given that the price/benefit ratio is in line. I would see the primary benefit being the ability to create 3D surfaces that would aid in the ortho photo and mosaicking process. This, in turn, would aid the 3D visualization environment. Automatic image correlation techniques, that create 3D models from overlapping photography, can work very well on many types of aerial images, but often have problems in the context of close range work due to convergence angles, large amounts of object displacement, occlusion, and uniformity of surfaces. Therefore lasergrammetry may offer a better solution in this context. I do have two words of caution. (1) Price. Based what I have heard from the geographic processing world, while lasergrammetry can produce very good results, it is about a magnitude more expensive to produce an elevation model, when compared to optical correlation techniques. However, as noted in the previous paragraph, optical correlation techniques have some problems when applied to close range applications. The fall-back in the optical world is manual collection from stereo pairs; a labor intensive process. (2) Post processing of the results. Once again, based on what I have heard from the geographic processing world, a raw mass-point file of thousands or millions of points is not what the application user desires. First, is the problem of automatically detecting erroneous points and correcting them. Some progress has been made in this area by various lasergrammetry vendors that work at the geographic scale. However, these techniques may or may not work when applied to close range applications. The other issue is that of an appropriate 3D or surface model. Most application software cannot effectively work with the huge data volume produced by lasergrammetry software. Therefore some type of intelligent data generalization techniques must A-8
113 Andy Zusmanis ERDAS Atlanta be employed, as well as reformatting the data into a format that works best with the user's application. In my opinion, at least in the geographic context, lasergrammetry is a solution provider for accurate and useable terrain surface models. In this context, the post processing issues mentioned in this paragraph should be the responsibility of the data vendor, not the end user. 9. To the best of my knowledge, ERDAS has not done any detailed error analysis on close range applications and/or non-metric cameras. Usually, absolute accuracy assessment is done using a specially configured "control field" were the input measurements are very accurate, and the points are very well dispersed and easy to identify. 10. I would recommend a rather comprehensive system of comparing accuracies in close range work. This is because there are more variables in close range (i.e. large convergence angles, depth of field, camera calibration) when compared to geographic photogrammetry. Without accounting for the variables, a potential user can be easily mislead, believing that a simple set of metrics account for measurement accuracy across a broad range of projects. A-9
114 Christopher Dore Archaeological Mapping Specialists 1. Yes. 2. Yes. 3. Both. 4. Both 5. TNTmips & PhotoModeler 6. Digital, film, video, & metric 7. No. 8. Yes, microtopography, excavation and complex feature documentation, caves & mineshaft mapping, architectural recording. Don't forget Lidar. 9. About 1 part per 2,000 max. Accuracy is done by comparing distances between known points once models are completed. 10. Judging an acceptable accuracy level is dependent upon the research problem at hand. It is the research that determines the acceptable level of accuracy, not the technology. Regardless of the accuracy needs, documenting the accuracy level obtained is critical. The standard should be that all researchers document the accuracy and precision levels of any measuring tool they use. What is acceptable for one application may not be acceptable for another. And it is only when the measurement accuracy is known that you can discriminate patterns in data to measurement error or the aspect of interest. A-10
115 David Knopp StellaCore Corporation 1. Limited now. Plans in motion to utilize often over next years starting in 4-6 months. 2. No. 3. 3D. In cases where 2d may be needed (e.g. plan/elevation drawings) do 3D then 'reduce to 2d' ala CAD. Have done occasional 2D for special projects such as when only one station is available (such as forensic video analysis) 4. Both. Although stereo is almost all aerial. Our terrestrial/closesrange is almost always convergent. 5. Our own in-house. 6. Mostly consumer digital - some film - some video. 7. For some film cases, either sub out the scanning - or sometimes photocd and/or desktop scanner (e.g. of prints). 8. I'm not a cultural guy:-)... but for technology opinion, laser scanning seems to be a pretty slick solution if object is composed primarily of simple and/or smooth surfaces (e.g. situations without numerous holes, occlusions, or other complex topologies). 9. Varies but typical for our applications is 'mid-range' (e.g. 1:10,000 to 1:25,000). 10. Personally, form of answer above notwithstanding, I d say No and that scale is a paper thing. It s a digital world, just use units. E.G. to say that a historic campsite was reconstructed within a 3D tolerance of 3/16" is unambiguous. IMHO, this is by far the most useful in practice for actual projects. Having said that, there may be some applications (rare and few I d imagine) where a relative answer makes sense. However, I'd expect this limited to applications that tend to be size invarient (e.g. 1:xx,000 for aircraft wing measurement systems that work with wings in size from piper cubs to 777s). Outside of specific applications, relative metrics can be very useful when assessing and characterizing performance of particular systems. For example to say that XYZ system produces 1:50,000 relative accuracy when applied to projects with characteristic dimension in the range of 1m-100m is a useful characterization of overall system capability. A-11
116 Prof. Frank von den Huevel TU Delft 1. yes 2. yes, but only in research projects 3. 3d 4. both 5. SoftPlotter (designed for aerial photogrammetry!), PhotoModeler, Bingo (bundle adjustment), photogrammetric toolbox developed in-house 6. mainly digital still camera s (off-the-shelf) 7. no 8. yes, depending on the information required 9. Depending on requirements: 1e-3 to 1e-5 relative precision. Assessed through bundle adjustment. 10. Rated can be practical. I prefer thresholds (used in statistical testing). If you are looking for standards, this publication could be of interest: Luhmann, T., Wendt, K. (2000): Recommendations for an Acceptance and Verification Test of Optical 3-D Measurement Systems. International Archives for Photogrammetry and Remote Sensing, Vol. 33/5, p , Amsterdam. A-12
117 Peter Borges Documenta Architectural Photogrammetry 1. Yes 2. Yes 3. Both 4. Both (digital stereo and convergent) 5. RolleiMetric, Leica, ISM - Diap/PW soft-stereo. 6. Analogue and digital, both metric. 7. No (?) 8. Yes 9. Usually, we (can) provide higher-accuracy (for architectural resources) than what is necessary or acceptable for architectural documentation/restoration (industry standards), for example. We achieve higher accuracies in order to maintain reliability and uniformity within a threshold of acceptability A threshold, as higher accuracy affects (as detrimental) costs only. A-13
118 APPENDIX B NSSDA ACCURACY STATISTIC WORKSHEETS
119 B-2
120 B-3
121 APPENDIX C SAMPLE TRIANGULATION REPORT, ORTHOBASE
122 The Triangulation Report With OrthoBASE The output image x, y units: pixels The output angle unit: degrees The output ground X, Y, Z units: meters The Input Image Coordinates image ID = 1 Point ID x y Affine coefficients from file (pixels) to film (millimeters) A0 A1 A2 B0 B1 B image ID = 2 Point ID x y Affine coefficients from file (pixels) to film (millimeters) A0 A1 A2 B0 B1 B C-2
123 image ID = 3 Point ID x y Affine coefficients from file (pixels) to film (millimeters) A0 A1 A2 B0 B1 B image ID = 4 Point ID x y Affine coefficients from file (pixels) to film (millimeters) A0 A1 A2 B0 B1 B image ID = 5 Point ID x y Affine coefficients from file (pixels) to film (millimeters) A0 A1 A2 B0 B1 B C-3
124 image ID = 6 Point ID x y Affine coefficients from file (pixels) to film (millimeters) A0 A1 A2 B0 B1 B image ID = 7 Point ID x y Affine coefficients from file (pixels) to film (millimeters) A0 A1 A2 B0 B1 B C-4
125 image ID = 8 Point ID x y Affine coefficients from file (pixels) to film (millimeters) A0 A1 A2 B0 B1 B THE OUTPUT OF SELF-CALIBRATING BUNDLE BLOCK ADJUSTMENT the no. of iteration =1 the standard error = the maximal correction of the object points = the no. of iteration =2 the standard error = the maximal correction of the object points = the no. of iteration =3 the standard error = the maximal correction of the object points = the no. of iteration =4 the standard error = the maximal correction of the object points = the no. of iteration =5 the standard error = the maximal correction of the object points = The exterior orientation parameters image ID Xs Ys Zs OMEGA PHI KAPPA C-5
126 The interior orientation parameters of photos image ID f(mm) xo(mm) yo(mm) The values and accuracy of the additional parameters No. Ai mai MaxX MaxY E E E E E E E E E E E E Total Mx My The residuals of the control points Point ID rx ry rz C-6
127 ax ay az mx my mz The coordinates of object points Point ID X Y Z Overlap The total object points = 25 C-7
128 The residuals of image points Point Image Vx Vy Point Image Vx Vy Point Image Vx Vy Point Image Vx Vy Point Image Vx Vy Point Image Vx Vy Point Image Vx Vy Point Image Vx Vy Point Image Vx Vy C-8
129 Point Image Vx Vy Point Image Vx Vy Point Image Vx Vy Point Image Vx Vy Point Image Vx Vy Point Image Vx Vy Point Image Vx Vy C-9
130 Point Image Vx Vy Point Image Vx Vy Point Image Vx Vy Point Image Vx Vy Point Image Vx Vy Point Image Vx Vy Point Image Vx Vy Point Image Vx Vy Point Image Vx Vy C-10
131 The image residuals of the control points The image ID = 1 Point ID Vx Vy RMSE of 12 points: mx=6.265, my= The image ID = 5 Point ID Vx Vy RMSE of 11 points: mx=2.832, my=8.334 The image ID = 2 Point ID Vx Vy RMSE of 13 points: mx=6.592, my= C-11
132 The image ID = 6 Point ID Vx Vy RMSE of 12 points: mx=5.421, my= The image ID = 3 Point ID Vx Vy RMSE of 9 points: mx=4.870, my= The image ID = 7 Point ID Vx Vy RMSE of 10 points: mx=6.625, my= C-12
133 The image ID = 4 Point ID Vx Vy RMSE of 5 points: mx=1.380, my=8.073 The image ID = 8 Point ID Vx Vy RMSE of 6 C-13
134 APPENDIX D RESOLUTION NO. 2 CONCERNING PHOTOGRAMMETRIC ARCHIVES
135 Resolution No. 2 Concerning Photogrammetric Archives adopted by the General Assembly on 15 October 1987 CIPA/2328 Considering the menaces to which monuments and sites are continuously subjected, particularly those of time and natural forces, taking into account the possibilities of scientific documentation and recording offered by the constitution of photogrammetric archives of cultural properties, the General Assembly, recommends to all countries members of ICOMOS a) to constitute photogrammetric archives of their monuments and sites included in the World Heritage List, b) to extend, as far as possible, those archives to buildings and sites listed in their national inventories, c) to give, in that activity, priority to monuments and sites situated in regions subjected to natural disaster risks, particularly in earthquake zones, d) to seek, if necessary, international cooperation for establishing those photogrammetric archives. D-2
136 APPENDIX E OPTIMAL PRACTICE IN ARCHAEOLOGICAL PHOTOGRAMMETRY SURVEYS
137 CIPA wishes it to be recalled that, technically, an architectural protogrammetry survey is a means specifically suited to the provision of knowledge of the effective form of a building at a given moment and measurement of that form. CIPA wishes to draw attention to the following points: i. If there is to be optimum use of the means available to the persons in charge of the study and conservation of the building heritage, photogrammetric surveys except in the case of special operations for purposes of research should be designed to suit the actual requirements to be met, as exactly defined by the user requesting the survey; the latter should cooperate with the person who is to execute it so as to take full advantage of the real potentialities of the technique. ii. Over and above the satisfaction of mere immediate needs, it is frequently fairly easy, and requires little extra work, to extend the field of application of a photogrammetric survey by including a minimum amount of extra data either when photographing or when plotting so as to increase its general value as a documentary record and make it distinctly more economically worthwhile and more effective in use. CIPA recommends that when photogrammetric survey programs are drawn up special importance be assigned to the creation of photogrammetric archives of buildings. CIPA recommends that makers and users of photogrammetric surveys be fully informed of the accepted notions regarding their accuracy, whether absolute or relative, and provide objective information in the matter. CIPA also holds it to be advisable for the plotting technicians to have a proper understanding of the survey they work on and thus be able to notice any accidental errors in their drawings, check by making digital measurements with their plotter any lines which appear doubtful and consult large-scale steroscopic records of the parts of the building which are awkward to survey 1 so as to dispel any remaining doubts. In conclusion, CIPA, considering that the planning of the photographic operations for photogrammetric surveys is inevitably dependent on the peculiarities of the building surveyed and the nature of its surroundings, the purpose in view, the degree of accuracy required, the equipment available, and the desire to achieve useful results while keeping the cost as low as possible,! wishes it to be recalled that such planning must be done in the full knowledge of what is involved, including the foregoing technical principles, particularly those relating to the scale of the photographs, the base/distance ratio, camera axis tilt, and control measurements.! advises makers of surveys to make regular use, to this end, of tables or graphs showing the mean degree of error occurring in the surveys corresponding to each of the possible photographing parameters. CIPA strongly advocates adoption of the practice of examining steropairs as an aid to the architectural analysis of the building to be surveyed. 1 This reference material may be produced very simply with ordinary cameras. E-2
138 CIPA:! recommends that users and makers of photogrammetric surveys of architecture pay all due attention to reference planes as fundamental guides to the significance, understanding, and use of such surveys! proposes that information on the reference planes chosen when photographing be considered as part of the data to be included in photogrammetric archives;! strongly advises that the directions of the reference planes be clearly shown on surveys and drawn in on a cross section;! suggests that in cases where for purposes of study or conservation it is necessary to break complex forms up into units of surface which are plane or may be treated as plane, use be made of every potentiality of the various photogrammetric techniques, and particularly of digitally controlled orthophotography, in order to improve the quality of the survey. CIPA advises against the laying down of general rules as to whether or not surveys should show jointing and hold that each case should be treated separately, according to the use for which the survey is intended. Care should be taken, however, to plan the photographing in a manner which ensures the jointing is satisfactorily recorded so that it may subsequently be plotted should the need arise. Photographic surveys should be the general rule for surveys of paintings, and digitally controlled orthophotography should be used where they lie on curved surfaces. Where the sculptural decoration forms an integral part of the building and must not be separated from its architectural setting it must be surveyed in its entirety (and on a scale suited to the purpose of the survey of the building). Where it does not, a decision as to what to survey should be made in each individual case in the light of the actual requirements, the practical utility of the operation and its cost; the desired scale and degree of accuracy which will determine the conditions under which the photographing is to be done, should be decided on at the same time. CIPA recommends! that the operators who make the surveys be provided with a thorough training, both in photogrammetry technique and in the understanding of the architecture;! that there be close and frequent contact between these operators and those who order the surveys and use them. CIPA expresses the hope that the potential applications of orthophotography and digital photogrammetry in connection with the study and measurement of buildings can be more thoroughly investigated by architects, historians, and photogrammetrists working in conjunction with each other. E-3
139 CIPA strongly advises:! that care be taken to ensure the purity of the photogrammetric record obtained by the plotting of a continuous line drawing, as the most objective expression possible of the true form of the building.! that this uninterpreted record be preserved, and that the alterations made by the user to suit his own needs be made only on copies of the original survey. Having thus examined the various forms of output which may be adopted in graphical plotting, CIPA considers it should recall all the possibilities afforded by photogrammetry, namely: i. plottings of facades in elevation and planimetric plottings of ceilings, vaults, and insides of domes, for which as a technique it is peculiarly and ideally suited. ii. vertical and horizontal sections, which stereo-plotting can produce rapidly in whatever quantities are required. iii. representations of non-plane surfaces by means of contour lines, or by a three-dimensional digital survey which can serve to reveal the condition of the work and permit analysis and calculations. iv. completion of graphical surveys by noting the position of individual points, especially to indicate object depth, and by digital precision measurements of selected features. It also considers it should advise that these different possibilities be judiciously exploited according to the requirements to be met. CIPA recommends that photogrammetric survey drawings show all the data essential for accurate knowledge of: the scale (especially the linear scale, as a precaution against any distortion; a measuring grid will be still better); the horizontality, verticality, and height; the reference planes; the position of the vertical and horizontal sections; the interval between the contour lines, where these are used; the unit adopted for the measurements shown on the drawing; the significance of any lines drawn thicker, hatched, dotted, etc.; the dates of execution, including data of photographing (most important of all), but also date of plotting and date of any further work on site; the various institutions which did the surveying, commissioned it, stored the original copy, have preserved the data in their archives, etc. E-4
140 APPENDIX F FGDC METADATA LAYOUT AND EXAMPLE

141 USDA Standard for Geospatial Data Set Metadata F-2
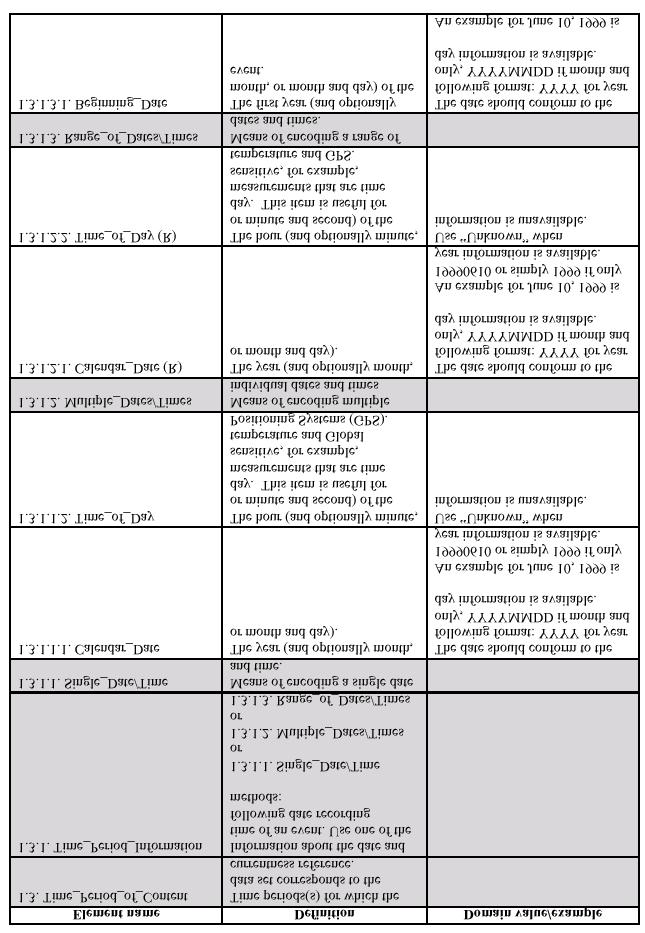
142 F-3
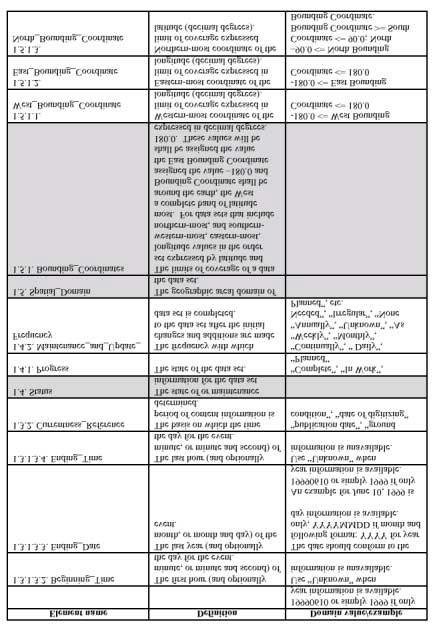
143 F-4
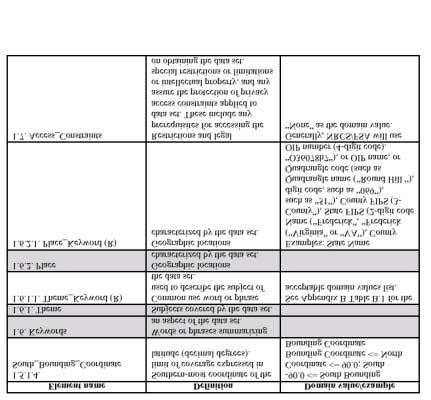
144 F-5
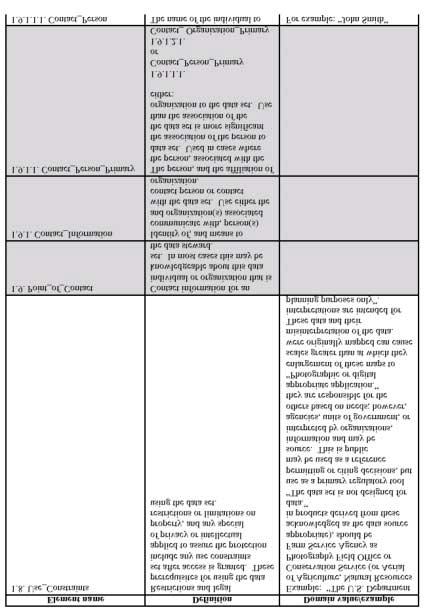
145 F-6
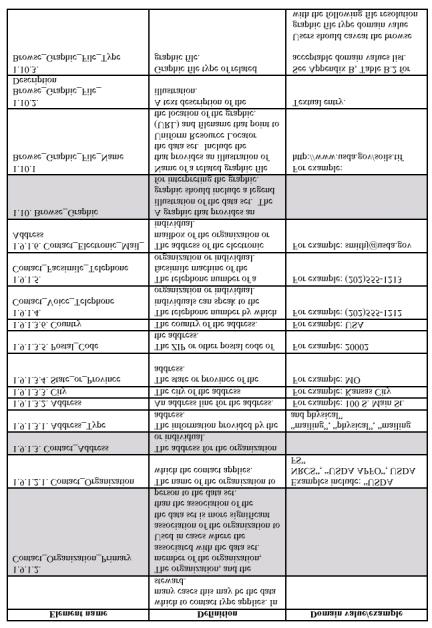
146 F-7
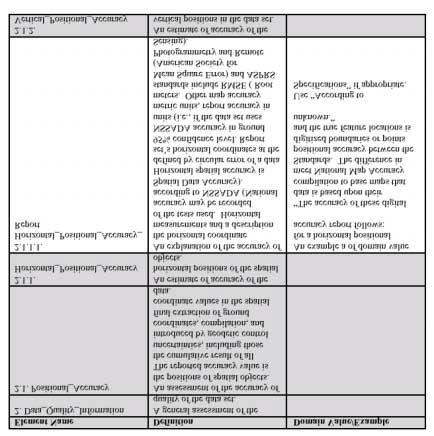
147 F-8
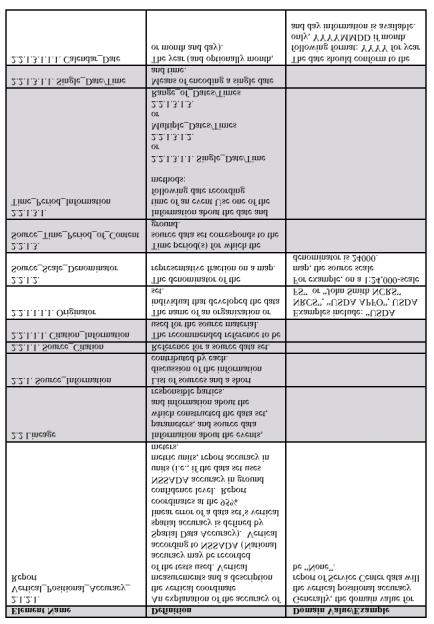
148 F-9
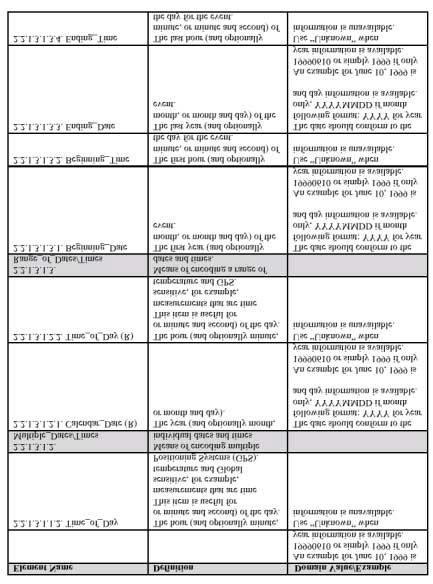
149 F-10
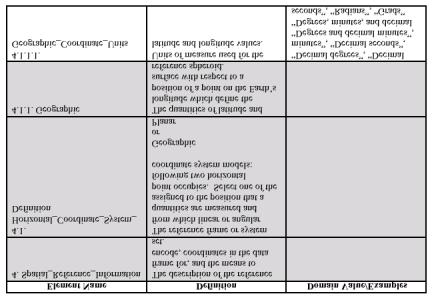
150 F-11
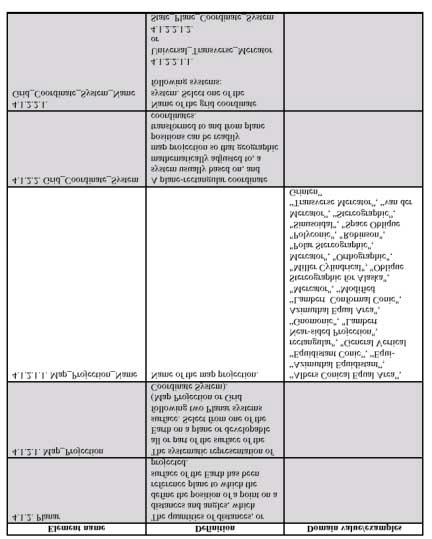
151 F-12
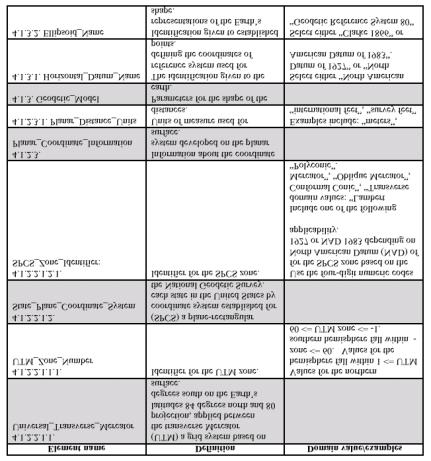
152 F-13
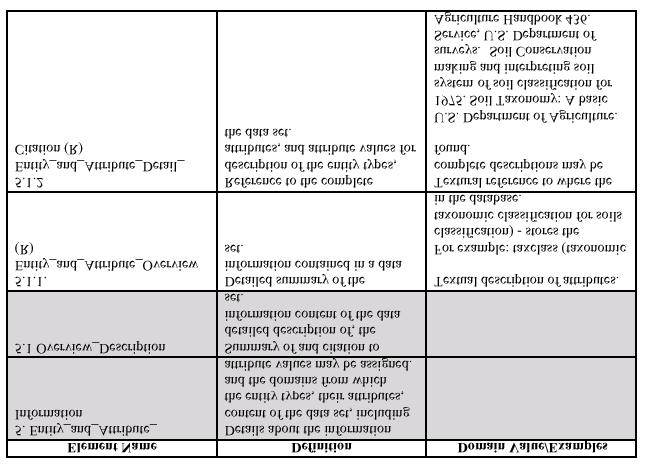
153 F-14
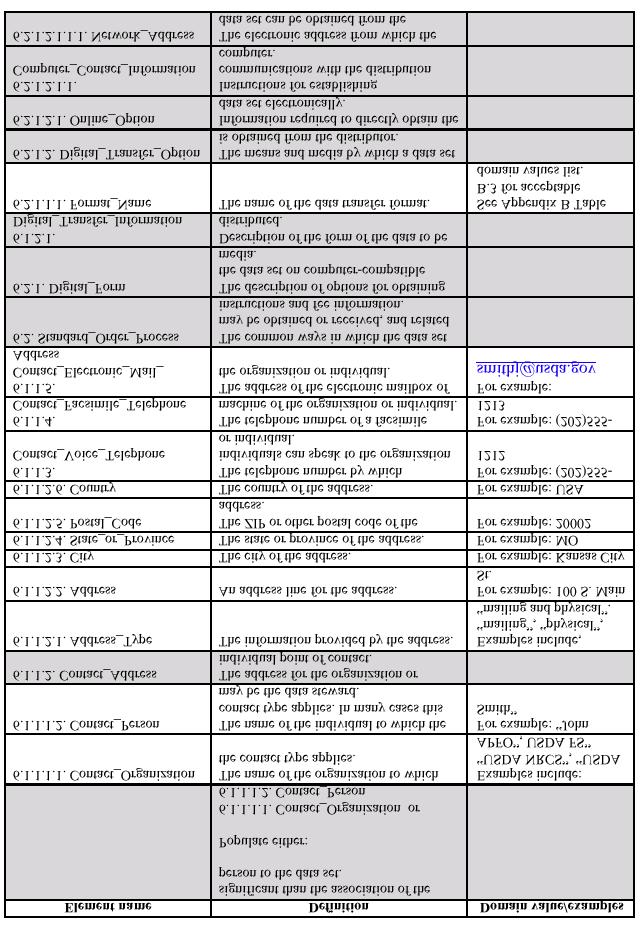
154 F-15
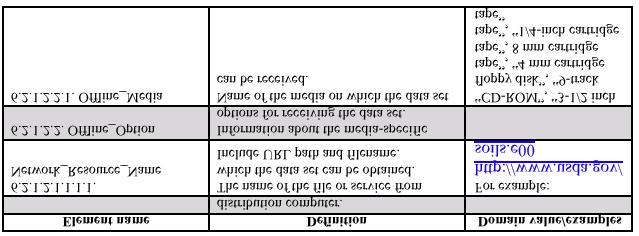
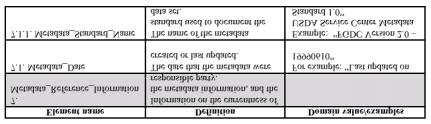
155 F-16
Sample Copy. Not For Distribution.
 Photogrammetry, GIS & Remote Sensing Quick Reference Book i EDUCREATION PUBLISHING Shubham Vihar, Mangla, Bilaspur, Chhattisgarh - 495001 Website: www.educreation.in Copyright, 2017, S.S. Manugula, V.
Aerial photography: Principles. Frame capture sensors: Analog film and digital cameras
 Aerial photography: Principles Frame capture sensors: Analog film and digital cameras Overview Introduction Frame vs scanning sensors Cameras (film and digital) Photogrammetry Orthophotos Air photos are
PHOTOGRAMMETRY STEREOSCOPY FLIGHT PLANNING PHOTOGRAMMETRIC DEFINITIONS GROUND CONTROL INTRODUCTION
 PHOTOGRAMMETRY STEREOSCOPY FLIGHT PLANNING PHOTOGRAMMETRIC DEFINITIONS GROUND CONTROL INTRODUCTION Before aerial photography and photogrammetry became a reliable mapping tool, planimetric and topographic
Project Planning and Cost Estimating
 CHAPTER 17 Project Planning and Cost Estimating 17.1 INTRODUCTION Previous chapters have outlined and detailed technical aspects of photogrammetry. The basic tasks and equipment required to create various
Lesson 4: Photogrammetry
 This work by the National Information Security and Geospatial Technologies Consortium (NISGTC), and except where otherwise Development was funded by the Department of Labor (DOL) Trade Adjustment Assistance
2019 NYSAPLS Conf> Fundamentals of Photogrammetry for Land Surveyors
 2019 NYSAPLS Conf> Fundamentals of Photogrammetry for Land Surveyors George Southard GSKS Associates LLC Introduction George Southard: Master s Degree in Photogrammetry and Cartography 40 years working
Technical Evaluation of Khartoum State Mapping Project
 Technical Evaluation of Khartoum State Mapping Project Nagi Zomrawi 1 and Mohammed Fator 2 1 School of Surveying Engineering, Collage of Engineering, Sudan University of Science and Technology, Khartoum,
Basics of Photogrammetry Note#6
 Basics of Photogrammetry Note#6 Photogrammetry Art and science of making accurate measurements by means of aerial photography Analog: visual and manual analysis of aerial photographs in hard-copy format
Unmanned Aerial Vehicle Data Acquisition for Damage Assessment in. Hurricane Events
 Unmanned Aerial Vehicle Data Acquisition for Damage Assessment in Hurricane Events Stuart M. Adams a Carol J. Friedland b and Marc L. Levitan c ABSTRACT This paper examines techniques for data collection
MONITORING RUBBLE-MOUND COASTAL STRUCTURES WITH PHOTOGRAMMETRY
 ,. CETN-III-21 2/84 MONITORING RUBBLE-MOUND COASTAL STRUCTURES WITH PHOTOGRAMMETRY INTRODUCTION: Monitoring coastal projects usually involves repeated surveys of coastal structures and/or beach profiles.
CSI: Rombalds Moor Photogrammetry Photography
 Photogrammetry Photography Photogrammetry Training 26 th March 10:00 Welcome Presentation image capture Practice 12:30 13:15 Lunch More practice 16:00 (ish) Finish or earlier What is photogrammetry 'photo'
Volume 1 - Module 6 Geometry of Aerial Photography. I. Classification of Photographs. Vertical
 RSCC Volume 1 Introduction to Photo Interpretation and Photogrammetry Table of Contents Module 1 Module 2 Module 3.1 Module 3.2 Module 4 Module 5 Module 6 Module 7 Module 8 Labs Volume 1 - Module 6 Geometry
MSB Imagery Program FAQ v1
 MSB Imagery Program FAQ v1 (F)requently (A)sked (Q)uestions 9/22/2016 This document is intended to answer commonly asked questions related to the MSB Recurring Aerial Imagery Program. Table of Contents
KEY WORDS: Animation, Architecture, Image Rectification, Multi-Media, Texture Mapping, Visualization
 AUTOMATED PROCESSING OF DIGITAL IMAGE DATA IN ARCHITECTURAL SURVEYING Günter Pomaska Prof. Dr.-Ing., Faculty of Architecture and Civil Engineering FH Bielefeld, University of Applied Sciences Artilleriestr.
DEVELOPMENT OF IMAGE-BASED INFORMATION SYSTEM FOR RESTORATION OF CULTURAL HERITAGE
 Hongo, Kenji DEVELOPMENT OF IMAGE-BASED INFORMATION SYSTEM FOR RESTORATION OF CULTURAL HERITAGE Kenji Hongo*, Ryuji Matsuoka*, Seiju Fujiwara*, Katsuhiko Masuda** and Shigeo Aoki** * Kokusai Kogyo Co.,
SCIENCE & TECHNOLOGY
 Pertanika J. Sci. & Technol. 21 (2): 387-396 (2013) SCIENCE & TECHNOLOGY Journal homepage: http://www.pertanika.upm.edu.my/ Production of Orthophoto and Volume Determination Using Low-Cost Digital Cameras
Lab #10 Digital Orthophoto Creation (Using Leica Photogrammetry Suite)
") Lab #10 Digital Orthophoto Creation (Using Leica Photogrammetry Suite) References: Leica Photogrammetry Suite Project Manager: Users Guide, Leica Geosystems LLC. Leica Photogrammetry Suite 9.2 Introduction:
Lab #10 Digital Orthophoto Creation (Using Leica Photogrammetry Suite) References: Leica Photogrammetry Suite Project Manager: Users Guide, Leica Geosystems LLC. Leica Photogrammetry Suite 9.2 Introduction:
Digital Photogrammetry. Presented by: Dr. Hamid Ebadi
 Digital Photogrammetry Presented by: Dr. Hamid Ebadi Background First Generation Analog Photogrammetry Analytical Photogrammetry Digital Photogrammetry Photogrammetric Generations 2000 digital photogrammetry
AUTOMATED PROCESSING OF DIGITAL IMAGE DATA IN ARCHITECTURAL SURVEYING
 International Archives of Photogrammetry and Remote Sensing. Vol. XXXII, Part 5. Hakodate 1998 AUTOMATED PROCESSING OF DIGITAL IMAGE DATA IN ARCHITECTURAL SURVEYING Gunter Pomaska Prof. Dr.-lng., Faculty
ENVI Tutorial: Orthorectifying Aerial Photographs
 ENVI Tutorial: Orthorectifying Aerial Photographs Table of Contents OVERVIEW OF THIS TUTORIAL...2 ORTHORECTIFYING AERIAL PHOTOGRAPHS IN ENVI...2 Building the interior orientation...3 Building the exterior
not to be republished NCERT Introduction To Aerial Photographs Chapter 6
 Chapter 6 Introduction To Aerial Photographs Figure 6.1 Terrestrial photograph of Mussorrie town of similar features, then we have to place ourselves somewhere in the air. When we do so and look down,
Principles of Photogrammetry
 Winter 2014 1 Instructor: Contact Information. Office: Room # ENE 229C. Tel: (403) 220-7105. E-mail: ahabib@ucalgary.ca Lectures (SB 148): Monday, Wednesday& Friday (10:00 a.m. 10:50 a.m.). Office Hours:
Maloney, Cath. LAARC Version 05 Date 08/05/2013
 Author Maloney, Cath. LAARC Version 05 Date 08/05/2013 Status Publication Change History 4.5: 2.2.1 introduction of the Primary Photographic Record 4.4: 2.2.1.2 Fieldwork, digital images 4.3: 2.2.1.2 Studios
UAV PHOTOGRAMMETRY COMPARED TO TRADITIONAL RTK GPS SURVEYING
 UAV PHOTOGRAMMETRY COMPARED TO TRADITIONAL RTK GPS SURVEYING Brad C. Mathison and Amber Warlick March 20, 2016 Fearless Eye Inc. Kansas City, Missouri www.fearlesseye.com KEY WORDS: UAV, UAS, Accuracy
1. Redistributions of documents, or parts of documents, must retain the SWGIT cover page containing the disclaimer.
 Disclaimer: As a condition to the use of this document and the information contained herein, the SWGIT requests notification by e-mail before or contemporaneously to the introduction of this document,
Photo Scale The photo scale and representative fraction may be calculated as follows: PS = f / H Variables: PS - Photo Scale, f - camera focal
 Scale Scale is the ratio of a distance on an aerial photograph to that same distance on the ground in the real world. It can be expressed in unit equivalents like 1 inch = 1,000 feet (or 12,000 inches)
AIRPORT MAPPING JUNE 2016 EXPLORING UAS EFFECTIVENESS GEOSPATIAL SLAM TECHNOLOGY FEMA S ROMANCE WITH LIDAR VOLUME 6 ISSUE 4
 VOLUME 6 ISSUE 4 JUNE 2016 AIRPORT MAPPING 18 EXPLORING UAS EFFECTIVENESS 29 GEOSPATIAL SLAM TECHNOLOGY 36 FEMA S ROMANCE WITH LIDAR Nearly 2,000 U.S. landfill facilities stand to gain from cost-effective
Automated Machine Guidance An Emerging Technology Whose Time has Come?
 Lou Barrett Page 1 Automated Machine Guidance An Emerging Technology Whose Time has Come? Author: Lou Barrett Chairwoman AASHTO TIG AMG Minnesota Department of Transportation MS 688 395 John Ireland Blvd.
Desktop - Photogrammetry and its Link to Web Publishing
 Desktop - Photogrammetry and its Link to Web Publishing Günter Pomaska FH Bielefeld, University of Applied Sciences Bielefeld, Germany, email gp@imagefact.de Key words: Photogrammetry, image refinement,
MINIMISING SYSTEMATIC ERRORS IN DEMS CAUSED BY AN INACCURATE LENS MODEL
 MINIMISING SYSTEMATIC ERRORS IN DEMS CAUSED BY AN INACCURATE LENS MODEL R. Wackrow a, J.H. Chandler a and T. Gardner b a Dept. Civil and Building Engineering, Loughborough University, LE11 3TU, UK (r.wackrow,
CALIBRATING THE NEW ULTRACAM OSPREY OBLIQUE AERIAL SENSOR Michael Gruber, Wolfgang Walcher
 CALIBRATING THE NEW ULTRACAM OSPREY OBLIQUE AERIAL SENSOR Michael Gruber, Wolfgang Walcher Microsoft UltraCam Business Unit Anzengrubergasse 8/4, 8010 Graz / Austria {michgrub, wwalcher}@microsoft.com
[GEOMETRIC CORRECTION, ORTHORECTIFICATION AND MOSAICKING]
![[GEOMETRIC CORRECTION, ORTHORECTIFICATION AND MOSAICKING]](/thumbs/78/78211997.jpg "[GEOMETRIC CORRECTION, ORTHORECTIFICATION AND MOSAICKING]") 2013 Ogis-geoInfo Inc. IBEABUCHI NKEMAKOLAM.J [GEOMETRIC CORRECTION, ORTHORECTIFICATION AND MOSAICKING] [Type the abstract of the document here. The abstract is typically a short summary of the contents
2013 Ogis-geoInfo Inc. IBEABUCHI NKEMAKOLAM.J [GEOMETRIC CORRECTION, ORTHORECTIFICATION AND MOSAICKING] [Type the abstract of the document here. The abstract is typically a short summary of the contents
Geometry of Aerial Photographs
 Geometry of Aerial Photographs Aerial Cameras Aerial cameras must be (details in lectures): Geometrically stable Have fast and efficient shutters Have high geometric and optical quality lenses They can
Baldwin and Mobile Counties, AL Orthoimagery Project Report. Submitted: March 23, 2016
 2015 Orthoimagery Project Report Submitted: Prepared by: Quantum Spatial, Inc 523 Wellington Way, Suite 375 Lexington, KY 40503 859-277-8700 Page i of iii Contents Project Report 1. Summary / Scope...
accuracy. You even hear the terms subcentimeter or even millimeter absolute accuracy during some of these
 Question: I would like to get your expert opinion on a dataset I just received. It is UAS-based imagery collected to produce a 50cm Digital Elevation Models (DEM) and 5cm resolution true color orthos.
Fiscal 2007 Environmental Technology Verification Pilot Program Implementation Guidelines
 Fifth Edition Fiscal 2007 Environmental Technology Verification Pilot Program Implementation Guidelines April 2007 Ministry of the Environment, Japan First Edition: June 2003 Second Edition: May 2004 Third
The Airphoto Ortho Suite is an add-on to Geomatica. It requires Geomatica Core or Geomatica Prime as a pre-requisite.
 Airphoto Ortho Suite The Airphoto Ortho Suite includes rigorous models used to correct the geometry of analogue and digital/video cameras and to produce orthorectified air photos. These models compensate
REQUEST FOR PROPOSAL For Color Orthogonal & Color Oblique Imagery
 REQUEST FOR PROPOSAL For Color Orthogonal & Color Oblique Imagery OVERVIEW Austin County Appraisal District is seeking services from a qualified and experienced vendor for the delivery of color Orthogonal
HIGH RESOLUTION COLOR IMAGERY FOR ORTHOMAPS AND REMOTE SENSING. Author: Peter Fricker Director Product Management Image Sensors
 HIGH RESOLUTION COLOR IMAGERY FOR ORTHOMAPS AND REMOTE SENSING Author: Peter Fricker Director Product Management Image Sensors Co-Author: Tauno Saks Product Manager Airborne Data Acquisition Leica Geosystems
Using Low Cost DeskTop Publishing (DTP) Scanners for Aerial Photogrammetry
 Scanners for Aerial Photogrammetry") Journal of Geosciences and Geomatics, 21, Vol. 2, No., 17- Available online at http://pubs.sciepub.com/jgg/2//5 Science and Education Publishing DOI:1.12691/jgg-2--5 Using Low Cost DeskTop Publishing (DTP)
Journal of Geosciences and Geomatics, 21, Vol. 2, No., 17- Available online at http://pubs.sciepub.com/jgg/2//5 Science and Education Publishing DOI:1.12691/jgg-2--5 Using Low Cost DeskTop Publishing (DTP)
Structure from Motion (SfM) Photogrammetry Field Methods Manual for Students
 Photogrammetry Field Methods Manual for Students") Structure from Motion (SfM) Photogrammetry Field Methods Manual for Students Written by Katherine Shervais (UNAVCO) Introduction to SfM for Field Education The purpose of the Analyzing High Resolution
Structure from Motion (SfM) Photogrammetry Field Methods Manual for Students Written by Katherine Shervais (UNAVCO) Introduction to SfM for Field Education The purpose of the Analyzing High Resolution
MURAL PAINTING DIGITAL SURVEYS. Elena Murariu, private practice restorer, Bucharest, Romania Florian Petrescu, GEOSYSTEMS Romania, Bucharest, Romania
 MURAL PAINTING DIGITAL SURVEYS Elena Murariu, private practice restorer, Bucharest, Romania Florian Petrescu, GEOSYSTEMS Romania, Bucharest, Romania str. Roma 8, sector 1, 71219 Bucharest, Romania, e-mail:
II. Curation Guidelines
 II. Curation Guidelines 67 67 Curation Guidelines: Artifacts, Samples, Materials, and Project and Site Documentation Introduction...68 Federal Guidelines......69 State Guidelines......70 Removal of Artifacts
NON-METRIC BIRD S EYE VIEW
 NON-METRIC BIRD S EYE VIEW Prof. A. Georgopoulos, M. Modatsos Lab. of Photogrammetry, Dept. of Rural & Surv. Engineering, National Technical University of Athens, 9, Iroon Polytechniou, GR-15780 Greece
Science Impact Enhancing the Use of USGS Science
 United States Geological Survey. 2002. "Science Impact Enhancing the Use of USGS Science." Unpublished paper, 4 April. Posted to the Science, Environment, and Development Group web site, 19 March 2004
XM: The AOI camera technology of the future
 No. 29 05/2013 Viscom Extremely fast and with the highest inspection depth XM: The AOI camera technology of the future The demands on systems for the automatic optical inspection (AOI) of soldered electronic
GeoBase Raw Imagery Data Product Specifications. Edition
 GeoBase Raw Imagery 2005-2010 Data Product Specifications Edition 1.0 2009-10-01 Government of Canada Natural Resources Canada Centre for Topographic Information 2144 King Street West, suite 010 Sherbrooke,
Services Overview. Northeast Blueprint
 Services Overview 2D CAD Conversions Paper to CAD 2D CAD Conversions Construction Engineering / CAD Services Construction Markups Consultant Drawings Coordinated Drawings As -Builts Steel Structural Detailing
11/25/2009 CHAPTER THREE INTRODUCTION INTRODUCTION (CONT D) THE AERIAL CAMERA: LENS PHOTOGRAPHIC SENSORS
 THE AERIAL CAMERA: LENS PHOTOGRAPHIC SENSORS") INTRODUCTION CHAPTER THREE IC SENSORS Photography means to write with light Today s meaning is often expanded to include radiation just outside the visible spectrum, i. e. ultraviolet and near infrared
INTRODUCTION CHAPTER THREE IC SENSORS Photography means to write with light Today s meaning is often expanded to include radiation just outside the visible spectrum, i. e. ultraviolet and near infrared
Following are the geometrical elements of the aerial photographs:
 Geometrical elements/characteristics of aerial photograph: An aerial photograph is a central or perspective projection, where the bundles of perspective rays meet at a point of origin called perspective
Photogrammetry. Lecture 4 September 7, 2005
 Photogrammetry Lecture 4 September 7, 2005 What is Photogrammetry Photogrammetry is the art and science of making accurate measurements by means of aerial photography: Analog photogrammetry (using films:
Selecting, Developing and Designing the Visual Content for the Polymer Series
 Selecting, Developing and Designing the Visual Content for the Polymer Series A Review of the Process October 2014 This document provides a summary of the activities undertaken by the Bank of Canada to
D. Hunter, J. Smart Kern & Co.., Ltd 5000 Aarau switzerland Commission II, ISPRS Kyoto, July 1988
 IMAGE ORIENTATION ON THE KERN DSR D. Hunter, J. Smart Kern & Co.., Ltd 5000 Aarau switzerland Commission II, ISPRS Kyoto, July 1988 Abstract A description of the possible image orientation capabilities
APPLICATIONS AND LESSONS LEARNED WITH AIRBORNE MULTISPECTRAL IMAGING
 APPLICATIONS AND LESSONS LEARNED WITH AIRBORNE MULTISPECTRAL IMAGING James M. Ellis and Hugh S. Dodd The MapFactory and HJW Walnut Creek and Oakland, California, U.S.A. ABSTRACT Airborne digital frame
CanImage. (Landsat 7 Orthoimages at the 1: Scale) Standards and Specifications Edition 1.0
 Standards and Specifications Edition 1.0") CanImage (Landsat 7 Orthoimages at the 1:50 000 Scale) Standards and Specifications Edition 1.0 Centre for Topographic Information Customer Support Group 2144 King Street West, Suite 010 Sherbrooke, QC
CanImage (Landsat 7 Orthoimages at the 1:50 000 Scale) Standards and Specifications Edition 1.0 Centre for Topographic Information Customer Support Group 2144 King Street West, Suite 010 Sherbrooke, QC
Technology Accreditation Canada (TAC) SURVEY/GEOMATICS TECHNOLOGY TECHNOLOGIST Canadian Technology Accreditation Criteria (CTAC)
 SURVEY/GEOMATICS TECHNOLOGY TECHNOLOGIST Canadian Technology Accreditation Criteria (CTAC)") Technology Accreditation Canada (TAC) SURVEY/GEOMATICS TECHNOLOGY TECHNOLOGIST Canadian Technology Accreditation Criteria (CTAC) Preamble These CTAC are applicable to programs having titles involving Survey/Geomatics
Technology Accreditation Canada (TAC) SURVEY/GEOMATICS TECHNOLOGY TECHNOLOGIST Canadian Technology Accreditation Criteria (CTAC) Preamble These CTAC are applicable to programs having titles involving Survey/Geomatics
CLOSE RANGE ORTHOIMAGE USING A LOW COST DIGITAL CAMCORDER
 CLOSE RANGE ORTHOIMAGE USING A LOW COST DIGITAL CAMCORDER E. Tsiligiris a, M. Papakosta a, C. Ioannidis b, A. Georgopoulos c a Surveying Engineer, Post-graduate Student, National Technical University of
DIFFERENTIAL APPROACH FOR MAP REVISION FROM NEW MULTI-RESOLUTION SATELLITE IMAGERY AND EXISTING TOPOGRAPHIC DATA
 DIFFERENTIAL APPROACH FOR MAP REVISION FROM NEW MULTI-RESOLUTION SATELLITE IMAGERY AND EXISTING TOPOGRAPHIC DATA Costas ARMENAKIS Centre for Topographic Information - Geomatics Canada 615 Booth Str., Ottawa,
Phase One ixu-rs1000 Accuracy Assessment Report Yu. Raizman, PhaseOne.Industrial, Israel
 17 th International Scientific and Technical Conference FROM IMAGERY TO DIGITAL REALITY: ERS & Photogrammetry Phase One ixu-rs1000 Accuracy Assessment Report Yu. Raizman, PhaseOne.Industrial, Israel 1.
An Introduction to Geomatics. Prepared by: Dr. Maher A. El-Hallaq خاص بطلبة مساق مقدمة في علم. Associate Professor of Surveying IUG
 An Introduction to Geomatics خاص بطلبة مساق مقدمة في علم الجيوماتكس Prepared by: Dr. Maher A. El-Hallaq Associate Professor of Surveying IUG 1 Airborne Imagery Dr. Maher A. El-Hallaq Associate Professor
High Resolution Sensor Test Comparison with SPOT, KFA1000, KVR1000, IRS-1C and DPA in Lower Saxony
 High Resolution Sensor Test Comparison with SPOT, KFA1000, KVR1000, IRS-1C and DPA in Lower Saxony K. Jacobsen, G. Konecny, H. Wegmann Abstract The Institute for Photogrammetry and Engineering Surveys
GEOMETRIC RECTIFICATION OF EUROPEAN HISTORICAL ARCHIVES OF LANDSAT 1-3 MSS IMAGERY
 GEOMETRIC RECTIFICATION OF EUROPEAN HISTORICAL ARCHIVES OF LANDSAT -3 MSS IMAGERY Torbjörn Westin Satellus AB P.O.Box 427, SE-74 Solna, Sweden tw@ssc.se KEYWORDS: Landsat, MSS, rectification, orbital model
Definitions proposals for draft Framework for state aid for research and development and innovation Document Original text Proposal Notes
 Definitions proposals for draft Framework for state aid for research and development and innovation Document Original text Proposal Notes (e) 'applied research' means Applied research is experimental or
Govt. Engineering College Jhalawar Model Question Paper Subject- Remote Sensing & GIS
 Govt. Engineering College Jhalawar Model Question Paper Subject- Remote Sensing & GIS Time: Max. Marks: Q1. What is remote Sensing? Explain the basic components of a Remote Sensing system. Q2. What is
Technical information about PhoToPlan
 Technical information about PhoToPlan The following pages shall give you a detailed overview of the possibilities using PhoToPlan. kubit GmbH Fiedlerstr. 36, 01307 Dresden, Germany Fon: +49 3 51/41 767
Chapter 1 Overview of imaging GIS
 Chapter 1 Overview of imaging GIS Imaging GIS, a term used in the medical imaging community (Wang 2012), is adopted here to describe a geographic information system (GIS) that displays, enhances, and facilitates
RADAR ANALYST WORKSTATION MODERN, USER-FRIENDLY RADAR TECHNOLOGY IN ERDAS IMAGINE
 RADAR ANALYST WORKSTATION MODERN, USER-FRIENDLY RADAR TECHNOLOGY IN ERDAS IMAGINE White Paper December 17, 2014 Contents Introduction... 3 IMAGINE Radar Mapping Suite... 3 The Radar Analyst Workstation...
Close-Range Photogrammetry for Accident Reconstruction Measurements
 Close-Range Photogrammetry for Accident Reconstruction Measurements iwitness TM Close-Range Photogrammetry Software www.iwitnessphoto.com Lee DeChant Principal DeChant Consulting Services DCS Inc Bellevue,
CONSIDERATIONS REGARDING THE TENURE AND PROMOTION OF CLASSICAL ARCHAEOLOGISTS EMPLOYED IN COLLEGES AND UNIVERSITIES
 CONSIDERATIONS REGARDING THE TENURE AND PROMOTION OF CLASSICAL ARCHAEOLOGISTS EMPLOYED IN COLLEGES AND UNIVERSITIES The Archaeological Institute of America (AIA) is an international organization of archaeologists
ENVI Orthorectification Module
 Visual Information Solutions ENVI Orthorectification Module Orthorectify Your Imagery Quickly and Easily. Rigorous Orthorectification. Simple Workflow. Trusted Method. The Need for Orthorectification Satellite
ENVI Orthorectification Module
 ENVI Orthorectification Module Orthorectify your imagery quickly and easily. CREASO - your partner for visual information solutions Rigorous Orthorectification. Simple Workflow. Trusted Method. The Need
Digital database creation of historical Remote Sensing Satellite data from Film Archives A case study
 Digital database creation of historical Remote Sensing Satellite data from Film Archives A case study N.Ganesh Kumar +, E.Venkateswarlu # Product Quality Control, Data Processing Area, NRSA, Hyderabad.
United Nations Statistics Division Programme in Support of the 2020 Round of Population and Housing Censuses
 United Nations Statistics Division Programme in Support of the 2020 Round of Population and Housing Censuses Srdjan Mrkić United Nations Statistics Division Definitions A population census is the total
THE NATIONAL AERIAL PHOTOGRAPHY PROGRAM: AN AERIAL SYSTEM IN SUPPORT OF THE UNITED STATES SPATIAL DATA INFRASTRUCTURE
 THE NATIONAL AERIAL PHOTOGRAPHY PROGRAM: AN AERIAL SYSTEM IN SUPPORT OF THE UNITED STATES SPATIAL DATA INFRASTRUCTURE Donald L. Light U.S. Geological Survey MS 511 National Center Reston, Virginia 22092
Figure 1: architectural features of the Castle of Arenberg
 Three-dimensional representation of the different phases of construction and actual state of conservation of the Castle of Arenberg using CAAD and Virtual reality applications towards its adequate conservation
CLIENT GUIDE TO MEASURED BUILDING SURVEYS
 CLIENT GUIDE TO MEASURED BUILDING SURVEYS ISSUE 4 FEBRUARY 2016 TSA The Survey Association s Client Guides are primarily aimed at other professionals such as engineers, architects, planners and clients
FROM THE FIELD SHEET TO THE COMPLETE DIGITAL WORKFLOW
 FROM THE FIELD SHEET TO THE COMPLETE DIGITAL WORKFLOW Martin Gurtner Swisstopo, Federal Office of Topography, CH-3084 Wabern, Switzerland, martin.gurtner@swisstopo.ch Abstract The Swiss Federal Office
Orthoimagery Standards. Chatham County, Georgia. Jason Lee and Noel Perkins
 1 Orthoimagery Standards Chatham County, Georgia Jason Lee and Noel Perkins 2 Table of Contents Introduction... 1 Objective... 1.1 Data Description... 2 Spatial and Temporal Environments... 3 Spatial Extent
CHAPTER 144. Interpretation of Shoreline Position from Aerial Photographs John S. Fisher 1 Margery F. Overton 2
 CHAPTER 144 Interpretation of Shoreline Position from Aerial Photographs John S. Fisher 1 Margery F. Overton 2 Abstract A review of some of the potential sources of error associated with the use of aerial
The coordinate system and vertical datum shall be noted in the drawing in the metadata.
 Purpose This document is provided for informational purposes and to assure data compatibility and compliance for as-built drawings or vector data formats specifically for the 354th Civil Engineer Squadron
University of Massachusetts Amherst Libraries. Digital Preservation Policy, Version 1.3
 University of Massachusetts Amherst Libraries Digital Preservation Policy, Version 1.3 Purpose: The University of Massachusetts Amherst Libraries Digital Preservation Policy establishes a framework to
Leica ADS80 - Digital Airborne Imaging Solution NAIP, Salt Lake City 4 December 2008
 Luzern, Switzerland, acquired at 5 cm GSD, 2008. Leica ADS80 - Digital Airborne Imaging Solution NAIP, Salt Lake City 4 December 2008 Shawn Slade, Doug Flint and Ruedi Wagner Leica Geosystems AG, Airborne
I-I. S/Scientific Report No. I. Duane C. Brown. C-!3 P.O0. Box 1226 Melbourne, Florida
 S AFCRL.-63-481 LOCATION AND DETERMINATION OF THE LOCATION OF THE ENTRANCE PUPIL -0 (CENTER OF PROJECTION) I- ~OF PC-1000 CAMERA IN OBJECT SPACE S Ronald G. Davis Duane C. Brown - L INSTRUMENT CORPORATION
HD aerial video for coastal zone ecological mapping
 HD aerial video for coastal zone ecological mapping Albert K. Chong University of Otago, Dunedin, New Zealand Phone: +64 3 479-7587 Fax: +64 3 479-7586 Email: albert.chong@surveying.otago.ac.nz Presented
Processing of stereo scanner: from stereo plotter to pixel factory
 Photogrammetric Week '03 Dieter Fritsch (Ed.) Wichmann Verlag, Heidelberg, 2003 Bignone 141 Processing of stereo scanner: from stereo plotter to pixel factory FRANK BIGNONE, ISTAR, France ABSTRACT With
Suveying Lectures for CE 498
 Suveying Lectures for CE 498 SURVEYING CLASSIFICATIONS Surveying work can be classified as follows: 1- Preliminary Surveying In this surveying the detailed data are collected by determining its locations
EXAMPLES OF TOPOGRAPHIC MAPS PRODUCED FROM SPACE AND ACHIEVED ACCURACY CARAVAN Workshop on Mapping from Space, Phnom Penh, June 2000
 EXAMPLES OF TOPOGRAPHIC MAPS PRODUCED FROM SPACE AND ACHIEVED ACCURACY CARAVAN Workshop on Mapping from Space, Phnom Penh, June 2000 Jacobsen, Karsten University of Hannover Email: karsten@ipi.uni-hannover.de
Sikorsky S-70i BLACK HAWK Training
 Sikorsky S-70i BLACK HAWK Training Serving Government and Military Crewmembers Worldwide U.S. #15-S-0564 Updated 11/17 FlightSafety offers pilot and maintenance technician training for the complete line
PHOTOGRAMMETRIC RESECTION DIFFERENCES BASED ON LABORATORY vs. OPERATIONAL CALIBRATIONS
 PHOTOGRAMMETRIC RESECTION DIFFERENCES BASED ON LABORATORY vs. OPERATIONAL CALIBRATIONS Dean C. MERCHANT Topo Photo Inc. Columbus, Ohio USA merchant.2@osu.edu KEY WORDS: Photogrammetry, Calibration, GPS,
ISO 3664 INTERNATIONAL STANDARD. Graphic technology and photography Viewing conditions
 INTERNATIONAL STANDARD ISO 3664 Third edition 2009-04-15 Graphic technology and photography Viewing conditions Technologie graphique et photographie Conditions d'examen visuel Reference number ISO 3664:2009(E)
PROPERTY OF THE LARGE FORMAT DIGITAL AERIAL CAMERA DMC II
 PROPERTY OF THE LARGE FORMAT DIGITAL AERIAL CAMERA II K. Jacobsen a, K. Neumann b a Institute of Photogrammetry and GeoInformation, Leibniz University Hannover, Germany jacobsen@ipi.uni-hannover.de b Z/I
Final Report of the Subcommittee on the Identification of Modeling and Simulation Capabilities by Acquisition Life Cycle Phase (IMSCALCP)
") Final Report of the Subcommittee on the Identification of Modeling and Simulation Capabilities by Acquisition Life Cycle Phase (IMSCALCP) NDIA Systems Engineering Division M&S Committee 22 May 2014 Table
Final Report of the Subcommittee on the Identification of Modeling and Simulation Capabilities by Acquisition Life Cycle Phase (IMSCALCP) NDIA Systems Engineering Division M&S Committee 22 May 2014 Table
Design Science Research Methods. Prof. Dr. Roel Wieringa University of Twente, The Netherlands
 Design Science Research Methods Prof. Dr. Roel Wieringa University of Twente, The Netherlands www.cs.utwente.nl/~roelw UFPE 26 sept 2016 R.J. Wieringa 1 Research methodology accross the disciplines Do
switzerland Commission II, ISPRS Kyoto, July 1988
 TOWARDS THE DIGITAL FUTURE stefan Lutz Kern & CO.., Ltd 5000 Aarau switzerland Commission II, ISPRS Kyoto, July 1988 ABSTRACT The equipping of the Kern Digital stereo Restitution Instrument (DSR) with
Carnton Mansion E.A. Johnson Center for Historic Preservation, Middle Tennessee State University, Murfreesboro, Tennessee, USA
 Carnton Mansion E.A. Johnson Center for Historic Preservation, Middle Tennessee State University, Murfreesboro, Tennessee, USA INTRODUCTION Efforts to describe and conserve historic buildings often require
SKA Five-Year Plan Discussion Summary
 SKA Five-Year Plan Discussion Summary Peter J Hall, 31 August 2000 Background There were several themes to emerge from the discussions; most of these flow from the need to define a realistic scope and
Economic and Social Council
 United Nations Economic and Social Council Distr.: General 21 May 2012 Original: English E/CONF.101/57 Tenth United Nations Conference on the Standardization of Geographical Names New York, 31 July 9 August
Determining Crash Data Using Camera Matching Photogrammetric Technique
 SAE TECHNICAL PAPER SERIES 2001-01-3313 Determining Crash Data Using Camera Matching Photogrammetric Technique Stephen Fenton, William Neale, Nathan Rose and Christopher Hughes Knott Laboratory, Inc. Reprinted
GE 113 REMOTE SENSING
 GE 113 REMOTE SENSING Topic 5. Introduction to Digital Image Interpretation and Analysis Lecturer: Engr. Jojene R. Santillan jrsantillan@carsu.edu.ph Division of Geodetic Engineering College of Engineering
DRAPP Product QAQC Participating Partner Process Guidelines Steve Ashbee ASPRS Certified Photogrammetrist PMI Project Management Professional Sanborn
 DRAPP Product QAQC Participating Partner Process Guidelines Steve Ashbee ASPRS Certified Photogrammetrist PMI Project Management Professional Sanborn Program Manager Area naming and other general feedback