DS-0321 FFT Analysis Software
|
|
|
- Christopher Holmes
- 5 years ago
- Views:
Transcription
1 DS-0321 FFT Analysis Software Operation manual Damping factor measurement using Hilbert transform ONO SOKKI CO., LTD.
2 The DS-0321 FFT Analysis software has the Hilbert operation function. A time envelope of a time-domain waveform can be displayed by means of Hilbert transform. This manual describes measurement procedure of damping ratio from vibration damping waveform by means of Hilbert transform function in the DS-0321 FFT Analysis software. As in the system configuration in the figure below, with the accelerometer connected to Ch2 of DS-3000 (with Ch1 unused), FFT Analysis is executed using DS-0321 FFT Analysis software. This manual describes functions with the focus on what behavior will result from a single operation, and you are recommended to try various actions on the instrument. Basic operations of the DS-3000 software are mostly executed in the Configuration window. As the operations in the Configuration window are correspondent with those of the Main menu, the Main menu operations are not included in this manual. For details on the Configuration window operations, refer to the respective procedure manuals ( Basic operation procedure for Configuration Setting and Basic operation for display of Configuration Window ). In this instruction manual, a series of clicking operations is described, for example, as follows; "Click "File" > "Project File"> "New Project" > " ". System Configuration Connect the NP-3000 series accelerometer directly to the CH1 terminal by using an NP-0021 conversion connector. NP-0021 Conversion connector NP-3000 Series accelerometer -1-
3 Operation Flow -1 Startup -2 Opening a New Project -3 Changing the Number of Screen Partitions -4 Setting the Input Source -5 Setting CCLD -6 Calibrating the Measurement Unit -7 Setting the Window Function -8 Checking the Waveform -9 Setting the Trigger -10 Starting Measurement -11 Setting the Hilbert Transform -12 Hilbert Transform from the Stored Data -2-

4 Operation Procedures -1 Startup Connect each device as described in the System Configuration, turn the power on, and start the DS-0321 FFT Analysis software. -2 Opening a New Project 1 From the main menu, click "View" > "Configuration" to open the "Configuration" window. 2 In the "Configuration" window, click "File" > "Project File" > "New Project" > " ". This operation erases the current settings and opens a new project with initial settings. -3 Changing the Number of Screen Partitions 1 Click the Selecting partition numbers tool at the upper part of the graph window and, here, set the triple-partition display mode as shown below. -3-
5 -4 Setting the Input Source Set the graph in the upper screen partition to the "CH1 Time view. Set that in the middle screen partition to the CH1 Power Spectrum view, and set that in the lower partition to the "CH1 Hilbert Transform" view. 1 Click in the upper graph to activate it. The graph is enclosed with orange box lines. 2 Select CH1 using the tool for selecting an input source above the graph window. From the pull-down menu on the right to it, select Time. 3 In a similar manner, click in the middle graph, select CH1 for input source, and select Power Spectrum for the display waveform. 4 In a similar manner, click in the lower graph, select CH1 for input source, and select Hilbert Transform for the display waveform. -4-

6 When you click in the graph, it is enclosed with orange box lines to show that it is active. The settings in the "Configuration" window are reflected in the active screen partition, except for the measurement items related to all the channels, including the frequency and voltage ranges. -5 Setting CCLD 1 In the "Configuration" window, click "Input/Output Setting" > "Input Setting" > Condition Setting" dialog box opens.. The "Input 2 In the Input Condition Setting dialog box, put a check mark in the "CCLD" box of "CH1". This allows power of "+24V/4mA" to be supplied from CH1 to the accelerometer. The signal will be input properly. -5-
 2 For example, read Voltage Sensitivity: 1.")
7 -6 Calibrating the Measurement Unit 1 Calibrate the measurement unit so that the reading along the Y axis can be directly read in the vibration unit (m/s 2 ). (When the measurement for the purpose of damping ratio, unit calibration is not required.) 2 For example, read Voltage Sensitivity: 1.03 mv/ms -2 from the Calibration Chart attached to the accelerometer you use. 3 In the "Configuration" window, click ""Input/Output Setting" > "Unit/Cal Setting" > " Setting" dialog box opens. ". The "Cal 4 Put a check mark in the "EU" box of "CH1" in the "Cal Setting" dialog box. Then, set the Unit Name: m/s, EU value: and EU Type: V/EU. -7 Setting the Window Function Set the window function Rectangular to obtain the damping ratio from vibration damping waveform using Hilbert Transform function. 1 In the "Configuration" window, click "Input/Output Setting" > "Window Function Setting" > " ". The "Window Function Setting" dialog box opens. 2 Select CH1: Rectangular from the pull-down menu on the Window Function Setting dialog box -6-


8 -8 Checking the Waveform Push Start button and apply impact as a trial to check the acceleration time axis waveform and its power spectrum are displayed properly. Also adjust the frequency range and voltage range properly. In this example, the frequency range is set to 4 kh, voltage range is set to 1 Vrms according to the 1-order of basic frequency. -7-
9 -9 Setting the Trigger Trigger function is a function which starts waveform sampling based on a certain trigger level of a signal. This function makes it possible to display whole of free vibration damping waveform on a screen after hitting a desired waveform portion. Under [START] status, take trial excitation repeatedly switching [TRIG] button ON/OFF. While seeing the waveform amplitude, set the trigger level. 1 In the Configuration window, click Input/Output Setting > Trigger Condition Setting and set Trigger Condition Setting: Repeat, Trigger Source: Internal. By this setting, the waveform is sampled every time the trigger is applied. 2 Trigger Condition Setting > Internal Trigger > box. to open Internal Trig Setting dialog 3 Red cross line will appear when you click within the waveform graph in Internal Trig Setting dialog box. The intersection point is a position of the trigger point. With taking trial excitations, set the trigger point temporarily so that the damping waveform is within the graph as follows. -8-

10 4 After the setting completes, press OK button to close Internal Trig Setting dialog box. When the damping time is long and the waveform is not completed within the graph, change the number of samplings. In the Configuration window, click Input/Output Setting > Sampling Condition Setting > Sampling Point Count and change to the larger value such as
![-10 Starting Measurement 1 With [START] button ON, turn the [TRIG] button ON to start measurement.](/docs-images/87/95440090/images/11-0.jpg "2 Hit the measurement object several times and turn the [STOP] button ON when the desired waveform is obtained.")
11 -10 Starting Measurement 1 With [START] button ON, turn the [TRIG] button ON to start measurement. 2 Hit the measurement object several times and turn the [STOP] button ON when the desired waveform is obtained. However, it may not operate correctly, set again the trigger referring the section 9 [Setting thetrigger]. Be careful not to hit too strongly so that the signal does not go over the voltage range, the waveform does not get distorted. -11 Setting Hilbert Transform Specify the band to interpose the basic frequency and perform Hilbert transform to obtain the damping ratio. 1 Click the Hilbert transform data graph to activate. 2 In the Configuration window, click Analysis Setting > Hilbert Operation, and click the right button of Band Limitation to set it ON. The Hilbert transform data may become nearly straight line because the [Band Limitation] or [Taper] is set. 3 Hilbert Operation > Waveform Disp Setting > Spectrum Monitoring dialog box. to open the Hilbert Conv Data Power 4 In Hilbert Conv Data Power Spectrum Monitoring dialog box, click Lower button and set the red line cursor to the lower limit of the basic frequency (natural frequency). 5 In the same manner, click Upper button and set the red line cursor to the upper limit of the basic frequency (natural frequency). Finally the frequency band interposed between upper and lower limit frequencies is limited, Hilbert transform is performed. 6 After setting is complete, click OK button to close Hilbert Conv Data Power Spectrum Monitoring dialog box. -10-
12 7 Set the cursor setup tool in the lower graph window Delta, click the lower position that you want to perform damping ratio transform, and click [ ] button. The line color changed from red to pink. Next, click the upper limit position to display red line. The damping ratio is obtained from the upper and lower limit positions, and [Log.d], [Damp], and [Freq] are displayed. If the Hilbert conversion data is not linear, try to change the band frequency following the above procedure 3 to 5. The measurement will be difficult when Hilbert conversion data does not become straight line for several reasons; there is no peak (not apparent natural frequency) in the power spectrum or there are several peaks in the power spectrum because the shape of the measurement object is complicated. -11-
13 < Remarks > The way to calculate the damping ratio from Hilbert conversion data Logarithmic decrement Damping ratio :Resonance frequency ΔX and ΔY : X and Y axes values of two points specified by delta cursor Hilbert transform from the stored data The damping time-axis waveform stored in DAT format can be used for Hilbert transform. Store the time-axis waveform data of section-11 in DAT format, and reproduce the DAT file (hirbert_001.dat) on the upper, middle, and lower screen. The following screen shows the time-axis waveform, power spectrum and Hilbert transform data. -12-
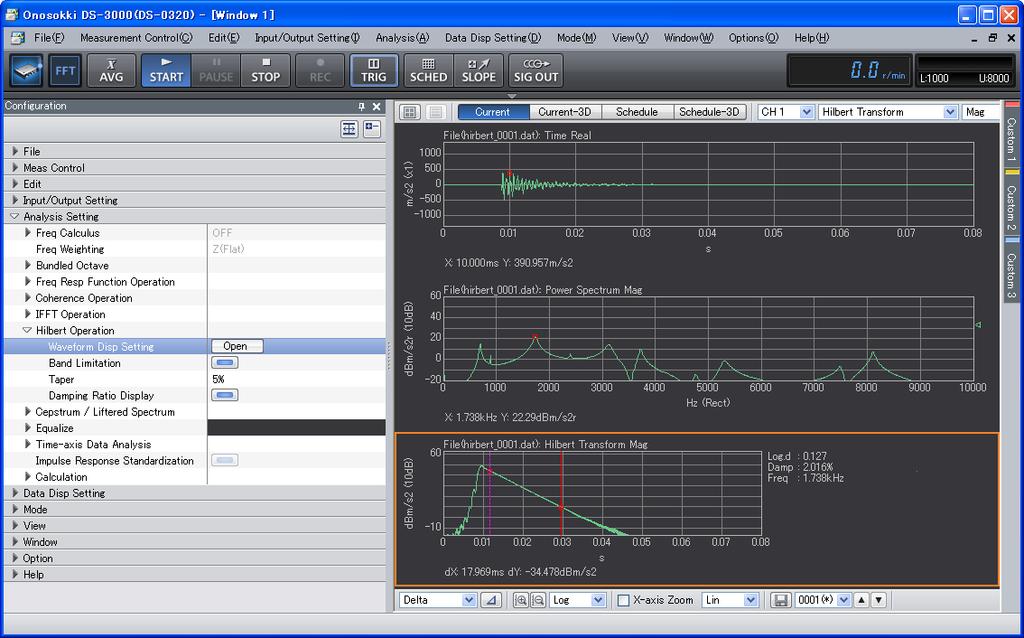
14 -13- End
DS-0322 Tracking Analysis Software Operation manual Basic Operation procedure for Constant-width Tracking Analysis
 DS-0322 Tracking Analysis Software Operation manual Basic Operation procedure for Constant-width Tracking Analysis ONO SOKKI CO., LTD. There are two types of tracking analysis, i.e., one is "constant ratio
DS-2000 Series Measurement of Frequency Response Function
 DS-2000 Series Measurement of Frequency Response Function ONO SOKKI CO., LTD. Contents 1. Flow Chart to Measurement 2. Device Connections 3. DS-2000 Setup 4. Measurement 1. Flow Chart to Measurement The
Portable FFT Analyzer CF-9200/9400
 Portable FFT Analyzer CF-9200/9400 Frequency response measurement by impact excitation by using Impulse hammer November2015 Contents 1 Introduction 2 Preparing equipment 3 Before measurement 3-1. Connection
ME scope Application Note 02 Waveform Integration & Differentiation
 ME scope Application Note 02 Waveform Integration & Differentiation The steps in this Application Note can be duplicated using any ME scope Package that includes the VES-3600 Advanced Signal Processing
Simplified Operation of CF-4500 FFT Comparator
 Simplified Operation of CF-4500 FFT Comparator Initial Window The FFT comparator CF-4500 has two control key groups: bottom soft keys for setup and right panel keys for execution. Shows the input signal
UCE-DSO210 DIGITAL OSCILLOSCOPE USER MANUAL. FATIH GENÇ UCORE ELECTRONICS REV1
 UCE-DSO210 DIGITAL OSCILLOSCOPE USER MANUAL FATIH GENÇ UCORE ELECTRONICS www.ucore-electronics.com 2017 - REV1 Contents 1. Introduction... 2 2. Turn on or turn off... 3 3. Oscilloscope Mode... 3 3.1. Display
EENG-201 Experiment # 4: Function Generator, Oscilloscope
 EENG-201 Experiment # 4: Function Generator, Oscilloscope I. Objectives Upon completion of this experiment, the student should be able to 1. To become familiar with the use of a function generator. 2.
UCE-DSO212 DIGITAL OSCILLOSCOPE USER MANUAL. UCORE ELECTRONICS
 UCE-DSO212 DIGITAL OSCILLOSCOPE USER MANUAL UCORE ELECTRONICS www.ucore-electronics.com 2017 Contents 1. Introduction... 2 2. Turn on or turn off... 3 3. Oscilloscope Mode... 4 3.1. Display Description...
Faculty of Engineering, Thammasat University
 Faculty of Engineering, Thammasat University Experiment 6: Oscilloscope (For room 506) Objectives: 1. To familiarize you with the Oscilloscope and Function Generator User Manual: Oscilloscope 1 5 9 4 7
SignalCalc Drop Test Demo Guide
 SignalCalc Drop Test Demo Guide Introduction Most protective packaging for electronic and other fragile products use cushion materials in the packaging that are designed to deform in response to forces
Lab Reference Manual. ECEN 326 Electronic Circuits. Texas A&M University Department of Electrical and Computer Engineering
 Lab Reference Manual ECEN 326 Electronic Circuits Texas A&M University Department of Electrical and Computer Engineering Contents 1. Circuit Analysis in PSpice 3 1.1 Transient and DC Analysis 3 1.2 Measuring
FT-2500 Advanced Tachometer Operation manual
 FT-2500 Advanced Tachometer Operation manual ONO SOKKI CO., LTD. Simplified Operation Manual for FT-2500 Advanced Tachometer FT-2500 Advanced Tachometer is a new rotational speed indicator that analyses
Laboratory Experiment #1 Introduction to Spectral Analysis
 J.B.Francis College of Engineering Mechanical Engineering Department 22-403 Laboratory Experiment #1 Introduction to Spectral Analysis Introduction The quantification of electrical energy can be accomplished
EE 3302 LAB 1 EQIUPMENT ORIENTATION
 EE 3302 LAB 1 EQIUPMENT ORIENTATION Pre Lab: Calculate the theoretical gain of the 4 th order Butterworth filter (using the formula provided. Record your answers in Table 1 before you come to class. Introduction:
Software. DS-3000 Series. Sound and Vibration Real-time Analysis System. Supports. Hardware. Multi-Channel Data Station. DS Series
 DS-3000 Series Sound and Vibration Real-time Analysis System Supports USB 3.0 Hardware Multi-Channel Data Station DS Series Multi-Channel Data Station DS Series The DS-3000 Series can perform real-time
ECE65 Introduction to the Function Generator and the Oscilloscope Created by: Eldridge Alcantara (Spring 2007)
") ECE65 Introduction to the Function Generator and the Oscilloscope Created by: Eldridge Alcantara (Spring 2007) I. Getting Started with the Function Generator OUTPUT Red Clip Small Black Clip 1) Turn on
ECE65 Introduction to the Function Generator and the Oscilloscope Created by: Eldridge Alcantara (Spring 2007) I. Getting Started with the Function Generator OUTPUT Red Clip Small Black Clip 1) Turn on
Getting Started. MSO/DPO Series Oscilloscopes. Basic Concepts
 Getting Started MSO/DPO Series Oscilloscopes Basic Concepts 001-1523-00 Getting Started 1.1 Getting Started What is an oscilloscope? An oscilloscope is a device that draws a graph of an electrical signal.
LAB #3: Virtual Instruments; Behavior of Second-Order Systems
 LAB #3: Virtual Instruments; Behavior of Second-Order Systems Equipment: Dell Optiplex Gs+ Pentium computer National Instruments BNC-2140 signal connector box, PCI-4451 dynamic signal acquisition board,
Advanced Lab LAB 6: Signal Acquisition & Spectrum Analysis Using VirtualBench DSA Equipment: Objectives:
 Advanced Lab LAB 6: Signal Acquisition & Spectrum Analysis Using VirtualBench DSA Equipment: Pentium PC with National Instruments PCI-MIO-16E-4 data-acquisition board (12-bit resolution; software-controlled
The University of Jordan Mechatronics Engineering Department Electronics Lab.( ) Experiment 1: Lab Equipment Familiarization
 Experiment 1: Lab Equipment Familiarization") The University of Jordan Mechatronics Engineering Department Electronics Lab.(0908322) Experiment 1: Lab Equipment Familiarization Objectives To be familiar with the main blocks of the oscilloscope and
The University of Jordan Mechatronics Engineering Department Electronics Lab.(0908322) Experiment 1: Lab Equipment Familiarization Objectives To be familiar with the main blocks of the oscilloscope and
P a g e 1 ST985. TDR Cable Analyzer Instruction Manual. Analog Arts Inc.
 P a g e 1 ST985 TDR Cable Analyzer Instruction Manual Analog Arts Inc. www.analogarts.com P a g e 2 Contents Software Installation... 4 Specifications... 4 Handling Precautions... 4 Operation Instruction...
LAB 8: Activity P52: LRC Circuit
 LAB 8: Activity P52: LRC Circuit Equipment: Voltage Sensor 1 Multimeter 1 Patch Cords 2 AC/DC Electronics Lab (100 μf capacitor; 10 Ω resistor; Inductor Coil; Iron core; 5 inch wire lead) The purpose of
PHY 1405 Conceptual Physics I Making a Spring Scale. Leader: Recorder: Skeptic: Encourager:
 PHY 1405 Conceptual Physics I Making a Spring Scale Leader: Recorder: Skeptic: Encourager: Materials Helical Spring Newton mass set Slotted gram mass set Mass hanger Laptop Balloon Ring stand with meter
Oscilloscope and Function Generators
 MEHRAN UNIVERSITY OF ENGINEERING AND TECHNOLOGY, JAMSHORO DEPARTMENT OF ELECTRONIC ENGINEERING ELECTRONIC WORKSHOP # 02 Oscilloscope and Function Generators Roll. No: Checked by: Date: Grade: Object: To
SigCal32 User s Guide Version 3.0
 SigCal User s Guide . . SigCal32 User s Guide Version 3.0 Copyright 1999 TDT. All rights reserved. No part of this manual may be reproduced or transmitted in any form or by any means, electronic or mechanical,
SETUP I: CORD. Continuous Systems
 Lab #8 Continuous Systems Name: Date: Section / Group: SETUP I: CORD This part of the laboratory is mainly exploratory in nature. By using your hand to force the cord close to one of its ends, you should
Physics 3 Lab 5 Normal Modes and Resonance
 Physics 3 Lab 5 Normal Modes and Resonance 1 Physics 3 Lab 5 Normal Modes and Resonance INTRODUCTION Earlier in the semester you did an experiment with the simplest possible vibrating object, the simple
1. Hand Calculations (in a manner suitable for submission) For the circuit in Fig. 1 with f = 7.2 khz and a source vin () t 1.
 For the circuit in Fig. 1 with f = 7.2 khz and a source vin () t 1.") Objectives The purpose of this laboratory project is to introduce to equipment, measurement techniques, and simulations commonly used in AC circuit analysis. In this laboratory session, each student will:
Objectives The purpose of this laboratory project is to introduce to equipment, measurement techniques, and simulations commonly used in AC circuit analysis. In this laboratory session, each student will:
Frequency and Time Domain Representation of Sinusoidal Signals
 Frequency and Time Domain Representation of Sinusoidal Signals By: Larry Dunleavy Wireless and Microwave Instruments University of South Florida Objectives 1. To review representations of sinusoidal signals
PHYSICS LAB. Sound. Date: GRADE: PHYSICS DEPARTMENT JAMES MADISON UNIVERSITY
 PHYSICS LAB Sound Printed Names: Signatures: Date: Lab Section: Instructor: GRADE: PHYSICS DEPARTMENT JAMES MADISON UNIVERSITY Revision August 2003 Sound Investigations Sound Investigations 78 Part I -
LABORATORY 4. Palomar College ENGR210 Spring 2017 ASSIGNED: 3/21/17
 LABORATORY 4 ASSIGNED: 3/21/17 OBJECTIVE: The purpose of this lab is to evaluate the transient and steady-state circuit response of first order and second order circuits. MINIMUM EQUIPMENT LIST: You will
Rigol DSA1000 Application Note
 Rigol DSA1000 Application Note Application Notes Comparison Guides FAQs s Programming Manuals Quick Start Guides Support Information User s Guides DSA1000 Tutorial Intro DSA1000 is Rigol s line of spectrum
Lab 1B LabVIEW Filter Signal
 Lab 1B LabVIEW Filter Signal Due Thursday, September 12, 2013 Submit Responses to Questions (Hardcopy) Equipment: LabVIEW Setup: Open LabVIEW Skills learned: Create a low- pass filter using LabVIEW and
Free vibration of cantilever beam FREE VIBRATION OF CANTILEVER BEAM PROCEDURE
 FREE VIBRATION OF CANTILEVER BEAM PROCEDURE AIM Determine the damped natural frequency, logarithmic decrement and damping ratio of a given system from the free vibration response Calculate the mass of
Procedures Guide. Tektronix. HDMI Sink Instruments Differential Impedance Measurement
 Procedures Guide Tektronix HDMI Sink Instruments Differential Impedance Measurement Equipment Required Table 1: Equipment required Table 1 lists the equipment required to perform the differential impedance
ME scope Application Note 01 The FFT, Leakage, and Windowing
 INTRODUCTION ME scope Application Note 01 The FFT, Leakage, and Windowing NOTE: The steps in this Application Note can be duplicated using any Package that includes the VES-3600 Advanced Signal Processing
EE 210 Lab Exercise #3 Introduction to PSPICE
 EE 210 Lab Exercise #3 Introduction to PSPICE Appending 4 in your Textbook contains a short tutorial on PSPICE. Additional information, tutorials and a demo version of PSPICE can be found at the manufacturer
Lab 3: RC Circuits. Construct circuit 2 in EveryCircuit. Set values for the capacitor and resistor to match those in figure 2 and set the frequency to
 Lab 3: RC Circuits Prelab Deriving equations for the output voltage of the voltage dividers you constructed in lab 2 was fairly simple. Now we want to derive an equation for the output voltage of a circuit
Vibration Analyzer VA-12. Vibration Analyzer VA-12
 Vibration Analyzer VA- VIBRATION Vibration Analyzer VA- A N A L Y Z E R Portable vibration analyzer for Equipment Diagnosis and On-site Measurements Vibration Meter VA- With FFT analysis function Piezoelectric
ECE4902 Lab 5 Simulation. Simulation. Export data for use in other software tools (e.g. MATLAB or excel) to compare measured data with simulation
 to compare measured data with simulation") ECE4902 Lab 5 Simulation Simulation Export data for use in other software tools (e.g. MATLAB or excel) to compare measured data with simulation Be sure to have your lab data available from Lab 5, Common
ECE4902 Lab 5 Simulation Simulation Export data for use in other software tools (e.g. MATLAB or excel) to compare measured data with simulation Be sure to have your lab data available from Lab 5, Common
Take Control. Introduction. Control Principles
 Introduction The XR3000 Configurable Logic Controller (XR3000 Agent) exemplifies a new, more accessible form of automation controller. Its enabling technology allows users to implement and manage their
Studuino Icon Programming Environment Guide
 Studuino Icon Programming Environment Guide Ver 0.9.6 4/17/2014 This manual introduces the Studuino Software environment. As the Studuino programming environment develops, these instructions may be edited
LAB #7: Digital Signal Processing
 LAB #7: Digital Signal Processing Equipment: Pentium PC with NI PCI-MIO-16E-4 data-acquisition board NI BNC 2120 Accessory Box VirtualBench Instrument Library version 2.6 Function Generator (Tektronix
Good Modal Practices
 Good Modal Practices 92-315 Introduction Transducer Considerations Proper Excitation Ensuring Data Gathered is Good Post Processing Tips and Tricks Wrap Up Dr. C. Novak University of Windsor Good Modal
Fourier Theory & Practice, Part II: Practice Operating the Agilent Series Scope with Measurement/Storage Module
 Fourier Theory & Practice, Part II: Practice Operating the Agilent 54600 Series Scope with Measurement/Storage Module By: Robert Witte Agilent Technologies Introduction: This product note provides a brief
Software. DS-3000 Series. Sound and Vibration Real-time Analysis System. Supports. Hardware. Multi-Channel Data Station. DS Series
 DS-3000 Series Sound and Vibration Real-time Analysis System Supports USB 3.0 Hardware Multi-Channel Data Station DS Series Multi-Channel Data Station DS Series The DS-3000 Series can perform real-time
External Source Control
 External Source Control X-Series Signal Analyzers Option ESC DEMO GUIDE Introduction External source control for X-Series signal analyzers (Option ESC) allows the Keysight PXA, MXA, EXA, and CXA to control
Linear Motor Test Sequence
 Linear Motor Test Sequence Introduction Linear motors (also known as linear vibrators or linear resonant actuators) have become increasingly popular in handheld devices such as phones and tablets for providing
Experiment #2: Introduction to Lab Equipment: Function Generator, Oscilloscope, and Multisim
 SCHOOL OF ENGINEERING AND APPLIED SCIENCE DEPARTMENT OF ELECTRICAL AND COMPUTER ENGINEERING ECE 2110: CIRCUIT THEORY LABORATORY Experiment #2: Introduction to Lab Equipment: Function Generator, Oscilloscope,
Objectives. Abstract. This PRO Lesson will examine the Fast Fourier Transformation (FFT) as follows:
 as follows:") : FFT Fast Fourier Transform This PRO Lesson details hardware and software setup of the BSL PRO software to examine the Fast Fourier Transform. All data collection and analysis is done via the BIOPAC MP35
: FFT Fast Fourier Transform This PRO Lesson details hardware and software setup of the BSL PRO software to examine the Fast Fourier Transform. All data collection and analysis is done via the BIOPAC MP35
Measurement of Amplitude Modulation AN 6
 Measurement of Application Note to the KLIPPEL R&D System (Document Revision 1.1) DESCRIPTION In a loudspeaker transducer, the difference between the amplitude response of the fundamental high frequency
Experiment 1 Introduction to Simulink
 1 Experiment 1 Introduction to Simulink 1.1 Objective The objective of Experiment #1 is to familiarize the students with simulation of power electronic circuits in Matlab/Simulink environment. Please follow
How to source exponential waveform
 How to source exponential waveform This material shows how to source exponential waveform using an example to source it to 1 kohm resistor. Figure 1 illustrates the connection and condition supposed in
IX Feb Operation Guide. Sequence Creation and Control Software SD011-PCR-LE. Wavy for PCR-LE. Ver. 5.5x
 IX000693 Feb. 015 Operation Guide Sequence Creation and Control Software SD011-PCR-LE Wavy for PCR-LE Ver. 5.5x About This Guide This PDF version of the operation guide is provided so that you can print
DT 9818 Waveform-Generator. Hardware Trigger Version. Operating Manual. Version 2.0. May Page 1 of 21
 DT 9818 Waveform-Generator Hardware Trigger Version Operating Manual Version 2.0 May 2011 Page 1 of 21 Table of Contents 1 Components... 3 1.1 USB DAQ module DT 9818-16SE-BNC... 3 1.2 DT 9818 Waveform-Generator-CD...
1.5k. (a) Resistive Circuit (b) Capacitive Circuit
 Resistive Circuit (b) Capacitive Circuit") Objective Information The purposes of this laboratory project are to become further acquainted with the use of an oscilloscope, and to observe the behavior of resistor and resistor capacitor circuits.
Objective Information The purposes of this laboratory project are to become further acquainted with the use of an oscilloscope, and to observe the behavior of resistor and resistor capacitor circuits.
Software. DS-3000 Series. Sound and Vibration Real-time Analysis System. Supports. Hardware. Multi-Channel Data Station. DS Series
 DS-3000 Series Sound and Vibration Real-time Analysis System Supports USB 3.0 Hardware Multi-Channel Data Station DS Series Multi-Channel Data Station DS Series The DS-3000 Series can perform real-time
Experiment: P34 Resonance Modes 1 Resonance Modes of a Stretched String (Power Amplifier, Voltage Sensor)
") PASCO scientific Vol. 2 Physics Lab Manual: P34-1 Experiment: P34 Resonance Modes 1 Resonance Modes of a Stretched String (Power Amplifier, Voltage Sensor) Concept Time SW Interface Macintosh file Windows
PASCO scientific Vol. 2 Physics Lab Manual: P34-1 Experiment: P34 Resonance Modes 1 Resonance Modes of a Stretched String (Power Amplifier, Voltage Sensor) Concept Time SW Interface Macintosh file Windows
Tektronix digital oscilloscope, BK Precision Function Generator, coaxial cables, breadboard, the crystal earpiece from your AM radio kit.
 Experiment 0: Review I. References The 174 and 275 Lab Manuals Any standard text on error analysis (for example, Introduction to Error Analysis, J. Taylor, University Science Books, 1997) The manual for
Time-Varying Signals
 Time-Varying Signals Objective This lab gives a practical introduction to signals that varies with time using the components such as: 1. Arbitrary Function Generator 2. Oscilloscopes The grounding issues
Laboratory Experiment #2 Frequency Response Measurements
 J.B.Francis College of Engineering Mechanical Engineering Department 22-403 Laboratory Experiment #2 Frequency Response Measurements Introduction It is known from dynamic systems that a structure temporarily
Page 21 GRAPHING OBJECTIVES:
 Page 21 GRAPHING OBJECTIVES: 1. To learn how to present data in graphical form manually (paper-and-pencil) and using computer software. 2. To learn how to interpret graphical data by, a. determining the
Lab 4 Projectile Motion
 b Lab 4 Projectile Motion Physics 211 Lab What You Need To Know: 1 x = x o + voxt + at o ox 2 at v = vox + at at 2 2 v 2 = vox 2 + 2aΔx ox FIGURE 1 Linear FIGURE Motion Linear Equations Motion Equations
Lab 4 Ohm s Law and Resistors
 ` Lab 4 Ohm s Law and Resistors What You Need To Know: The Physics One of the things that students have a difficult time with when they first learn about circuits is the electronics lingo. The lingo and
Design and Simulation of RF CMOS Oscillators in Advanced Design System (ADS)
") Design and Simulation of RF CMOS Oscillators in Advanced Design System (ADS) By Amir Ebrahimi School of Electrical and Electronic Engineering The University of Adelaide June 2014 1 Contents 1- Introduction...
Design and Simulation of RF CMOS Oscillators in Advanced Design System (ADS) By Amir Ebrahimi School of Electrical and Electronic Engineering The University of Adelaide June 2014 1 Contents 1- Introduction...
16 Histograms. Using Histograms to Reveal Distribution
 16 Histograms Using Histograms to Reveal Distribution The Histogram math function enhances understanding of the distribution of measured parameters (see the Disk Drive Analyzer Reference Manual for more
SDC. AutoCAD LT 2007 Tutorial. Randy H. Shih. Schroff Development Corporation Oregon Institute of Technology
 AutoCAD LT 2007 Tutorial Randy H. Shih Oregon Institute of Technology SDC PUBLICATIONS Schroff Development Corporation www.schroff.com www.schroff-europe.com AutoCAD LT 2007 Tutorial 1-1 Lesson 1 Geometric
Experiment 2: Electronic Enhancement of S/N and Boxcar Filtering
 Experiment 2: Electronic Enhancement of S/N and Boxcar Filtering Synopsis: A simple waveform generator will apply a triangular voltage ramp through an R/C circuit. A storage digital oscilloscope, or an
DSO5000P Series Digital Storage Oscilloscope User Manual. (Version 1.1)
") DSO5000P Series Digital Storage Oscilloscope User Manual (Version 1.1) Contents Contents Contents... i Chapter 1 Safety Tips... 1 1.1 General Safety Summary... 1 1.2 Safety Terms and Symbols... 2 1.3 Terms
DSO5000P Series Digital Storage Oscilloscope User Manual (Version 1.1) Contents Contents Contents... i Chapter 1 Safety Tips... 1 1.1 General Safety Summary... 1 1.2 Safety Terms and Symbols... 2 1.3 Terms
Fluke 125. Getting Started. Industrial ScopeMeter
 Fluke 125 Industrial ScopeMeter Getting Started GB Dec 2006, Rev. 1, 09/2009 2006, 2009 Fluke Corporation, All rights reserved. Printed in The Netherlands All product names are trademarks of their respective
EE 201 Function / Arbitrary Waveform Generator and Oscilloscope Tutorial
 EE 201 Function / Arbitrary Waveform Generator and Oscilloscope Tutorial 1 This is a programmed learning instruction manual. It is written for the Agilent DSO3202A Digital Storage Oscilloscope. The prerequisite
Step 1: Set up the variables AB Design. Use the top cells to label the variables that will be displayed on the X and Y axes of the graph
 Step 1: Set up the variables AB Design Use the top cells to label the variables that will be displayed on the X and Y axes of the graph Step 1: Set up the variables X axis for AB Design Enter X axis label
Activity P52: LRC Circuit (Voltage Sensor)
") Activity P52: LRC Circuit (Voltage Sensor) Concept DataStudio ScienceWorkshop (Mac) ScienceWorkshop (Win) AC circuits P52 LRC Circuit.DS (See end of activity) (See end of activity) Equipment Needed Qty
Activity P52: LRC Circuit (Voltage Sensor) Concept DataStudio ScienceWorkshop (Mac) ScienceWorkshop (Win) AC circuits P52 LRC Circuit.DS (See end of activity) (See end of activity) Equipment Needed Qty
System Inputs, Physical Modeling, and Time & Frequency Domains
 System Inputs, Physical Modeling, and Time & Frequency Domains There are three topics that require more discussion at this point of our study. They are: Classification of System Inputs, Physical Modeling,
2 Oscilloscope Familiarization
 Lab 2 Oscilloscope Familiarization What You Need To Know: Voltages and currents in an electronic circuit as in a CD player, mobile phone or TV set vary in time. Throughout the course you will investigate
PN9000 PULSED CARRIER MEASUREMENTS
 The specialist of Phase noise Measurements PN9000 PULSED CARRIER MEASUREMENTS Carrier frequency: 2.7 GHz - PRF: 5 khz Duty cycle: 1% Page 1 / 12 Introduction When measuring a pulse modulated signal the
Spectrum Analyzer TEN MINUTE TUTORIAL
 Spectrum Analyzer TEN MINUTE TUTORIAL November 4, 2011 Summary The Spectrum Analyzer option allows users who are familiar with RF spectrum analyzers to start using the FFT with little or no concern about
Velleman Arbitrary Function Generator: Windows 7 by Mr. David Fritz
 Velleman Arbitrary Function Generator: Windows 7 by Mr. David Fritz You should already have the drivers installed Launch the scope control software. Start > Programs > Velleman > PcLab2000LT What if the
Lab 11. Vibrating Strings
 Lab 11. Vibrating Strings Goals To experimentally determine relationships between fundamental resonant of a vibrating string and its length, its mass per unit length, and tension in string. To introduce
J. La Favre Fusion 360 Lesson 5 April 24, 2017
 In this lesson, you will create a funnel like the one in the illustration to the left. The main purpose of this lesson is to introduce you to the use of the Revolve tool. The Revolve tool is similar to
The Discussion of this exercise covers the following points: Filtering Aperture distortion
 Exercise 3-1 PAM Signals Demodulation EXERCISE OBJECTIVE When you have completed this exercise you will be able to demonstrate the recovery of the original message signal from a PAM signal using the PAM
ECG Analysis using the Offline Averaging Mode
 BIOPAC Systems, Inc. 42 Aero Camino Goleta, Ca 93117 Ph (805)685-0066 Fax (805)685-0067 www.biopac.com info@biopac.com ECG Analysis using the Offline Averaging Mode For years, cardiologists examined paper
Cornerstone Electronics Technology and Robotics Week 21 Electricity & Electronics Section 10.5, Oscilloscope
 Cornerstone Electronics Technology and Robotics Week 21 Electricity & Electronics Section 10.5, Oscilloscope Field trip to Deerhaven Generation Plant: Administration: o Prayer o Turn in quiz Electricity
DL9040/DL9140/DL9240 Series
 DL9040/DL9140/DL9240 Series Digital Oscilloscope 3rd Edition Thank you for purchasing the DL9000 (DL9040/DL9040L/DL9140/DL9140L/DL9240/DL9240L) Digital Oscilloscope. This operation guide is designed to
Lab 2b: Dynamic Response of a Rotor with Shaft Imbalance
 Lab 2b: Dynamic Response of a Rotor with Shaft Imbalance OBJECTIVE: To calibrate an induction position/displacement sensor using a micrometer To calculate and measure the natural frequency of a simply-supported
with MultiMedia CD Randy H. Shih Jack Zecher SDC PUBLICATIONS Schroff Development Corporation
 with MultiMedia CD Randy H. Shih Jack Zecher SDC PUBLICATIONS Schroff Development Corporation WWW.SCHROFF.COM Lesson 1 Geometric Construction Basics AutoCAD LT 2002 Tutorial 1-1 1-2 AutoCAD LT 2002 Tutorial
Ph 3455 The Franck-Hertz Experiment
 Ph 3455 The Franck-Hertz Experiment Required background reading Tipler, Llewellyn, section 4-5 Prelab Questions 1. In this experiment, we will be using neon rather than mercury as described in the textbook.
Data Sheet. Digital Storage Oscilloscope. Features & Benefits. Applications. Ease-of-Use Feature DSO5202BMT DSO5102BMT DSO5062BMT
 Data Sheet Digital Storage Oscilloscope DSO5202BMT DSO5102BMT DSO5062BMT Features & Benefits 200/100/60MHz Bandwidths 1GSa/s Real Time Sample Rate 2M Memory Depth Trigger mode: Edge, Pulse Width, Video,
m+p Analyzer Revision 5.2
 Update Note www.mpihome.com m+p Analyzer Revision 5.2 Enhanced Project Browser New Acquisition Configuration Windows Improved 2D Chart Reference Traces in 2D Single- and Multi-Chart Template Projects Trigger
Precalculations Individual Portion Introductory Lab: Basic Operation of Common Laboratory Instruments
 Name: Date of lab: Section number: M E 345. Lab 1 Precalculations Individual Portion Introductory Lab: Basic Operation of Common Laboratory Instruments Precalculations Score (for instructor or TA use only):
The behavior of the FastADC in time domain
 August 29, 2000 The behavior of the FastADC in time domain F. Tonisch 1. General remarks The 8-channel FastADC was developed for use with the readout electronic of the Waveguide Beam Position Monitors
ME 365 EXPERIMENT 1 FAMILIARIZATION WITH COMMONLY USED INSTRUMENTATION
 Objectives: ME 365 EXPERIMENT 1 FAMILIARIZATION WITH COMMONLY USED INSTRUMENTATION The primary goal of this laboratory is to study the operation and limitations of several commonly used pieces of instrumentation:
DL9500/DL9700 Series. Digital Oscilloscope. IM E 3rd Edition
 DL9500/DL9700 Series Digital Oscilloscope 3rd Edition Thank you for purchasing the DL9500/DL9700 Series Digital Oscilloscope (DL9505L/DL950L/DL9705L/DL970L, hereafter referred to as the DL9500/DL9700).
SVAN A DESCRIPTION OF GROUND VIBRATION FUNCTION. SVANTEK Sp. z o.o. WARSAW, July 2014 SVANTEK
 SVAN A DESCRIPTION OF GROUND VIBRATION FUNCTION SVANTEK Sp. z o.o. WARSAW, July 2014 SVANTEK SVAN 958A DESCRIPTION OF GROUND VIBRATION FUNCTION 2 Note: The ground vibration mode may require FFT analysis
SDI. Table of Contents
 NMSC-2 User Manual 2 Table of Contents Introduction........ 4 Hardware Installation.... 5 NMSC Power On.. 8 Overview... 9 FFT Measurement Screen.. 10 FFT Setup..... 11 FFT Detector..... 14 FFT Calibration.....
DiGi++ Noise Meter. Main functions
 Main functions DiGi++ Noise Meter This application brings the functionalities of a Sound Level Meter (SLM) and of a Spectrum Analizer (RTA) to your phone: mobile hardware introduce some limitations (lower
ET 304A Laboratory Tutorial-Circuitmaker For Transient and Frequency Analysis
 ET 304A Laboratory Tutorial-Circuitmaker For Transient and Frequency Analysis All circuit simulation packages that use the Pspice engine allow users to do complex analysis that were once impossible to
Vt^ro^es^piimunf Runfflng^Z0om Function For Audio And Noise Spectrum Analysis
 4DVANTEST. ADVANTEST CORPORATION^ R9211A Digital Spectrum Analyzer Vt^ro^es^piimunf Runfflng^Z0om Function For Audio And Noise Spectrum Analysis 1 Built-in Running Zoom Function at Minimum Span The R9211A
Drawing Bode Plots (The Last Bode Plot You Will Ever Make) Charles Nippert
 Charles Nippert") Drawing Bode Plots (The Last Bode Plot You Will Ever Make) Charles Nippert This set of notes describes how to prepare a Bode plot using Mathcad. Follow these instructions to draw Bode plot for any transfer
Drawing Bode Plots (The Last Bode Plot You Will Ever Make) Charles Nippert This set of notes describes how to prepare a Bode plot using Mathcad. Follow these instructions to draw Bode plot for any transfer
Pioneering Partnership Performance
 Pioneering Partnership Performance Born for In-Field Testing Impaq Elite is a portable 4 channel real-time analyzer that is built for advanced noise and vibration test in the field. Unique features like