Free vibration of cantilever beam FREE VIBRATION OF CANTILEVER BEAM PROCEDURE
|
|
|
- Elisabeth Mosley
- 6 years ago
- Views:
Transcription

 Schematic of the experimental setup; (b) Equivalent engineering model; (c) Lumped parameter system 1.")
1 FREE VIBRATION OF CANTILEVER BEAM PROCEDURE AIM Determine the damped natural frequency, logarithmic decrement and damping ratio of a given system from the free vibration response Calculate the mass of the system actively participating in dynamics Determine the equivalent viscous damping present in the system Calculate critical damping of the system and undamped natural frequency of the system NOTE: TO CARRY ON THE EXPERIMENT, LabVIEW RUNTIME ENGINE IS REQUIRED. DOWNLOAD IT FROM HERE and install. PROCEDURE: Fig 1: (a) Schematic of the experimental setup; (b) Equivalent engineering model; (c) Lumped parameter system 1. Click on the NEXT button

. 3. See to it that the option is toggled to ONLINE mode to conduct the experiment.")
2 2. A new tab is opened, which gives the user the option of switching on between the ONLINE mode and the OFFLINE mode. ONLINE mode gives users the option to conduct the experiment. The OFFLINE experiment, however, allows the user to work with the saved set of data (Saving of the data and the results is explained further). 3. See to it that the option is toggled to ONLINE mode to conduct the experiment. Once the ONLINE mode is switched on, press the START (#3a) button and proceed further by clicking on the NEXT (#3b) button.

3 ONLINE and OFFLINE Modes: For the USER to conduct an experiment, he/she must be connected to the SOLVE lab servers at NITK Surathkal. For this, the USER must be in the ONLINE mode. The user will be allowed to save the results of the online experiments and use the same for further analysis in OFFLINE mode. If the OFFLINE mode is switched ON, then the user will NOT be connected to the servers. However he/she can relook at the results in the form of graphs and other calculated values. For this to happen, the user MUST have a Saved Data of the same experiment. More details of saving the data is provided in the subsequent stages (#8) 4. Ensure that the CONTROL mode is highlighted. A detailed description of the CONTROL and the VIEW mode is as given below 5. See to it that the CONNECTED indicator is highlighted. This gives the confirmation that the user is now connected to the server and can perform the experiment by clicking the NEXT (#5a) button. CONTROL MODE: This mode allows the USER to perform the experiment. Users in this mode can actually perform the experiment for a specified time as indicated. It has to be noted that ONLY ONE user is allowed to be in the CONTROL mode at any instant. VIEW MODE: Users in this mode can view the experiment which is being conducted by the CONTROL MODE user who is having the privilege to perform the experiment. The VIEW mode users, can still capture the graph and data which is obtained by the CONTROL MODE user.


4 6. Now, the user is required to switch ON the electromagnet to induce an initial displacement. 7. Once the user clicks the switch on button, a pop up opens which indicates the user to wait until the data is acquired

5 8. Once the data is acquired, the screen looks like the image shown below. Trigger the electromagnet and wait for the graph to be plotted. If the user is satisfied with the quality of the data acquired, he/she can stop acquiring the data by clicking on the STOP acquisition button. Else if the graph is not as per the requirement, the user can retrigger the electromagnet. This can be done for three times in succession for a fixed duration of 120 seconds. Trigger the electromagnet BEFORE pressing the Stop Acquisition button. Else re-triggering cannot be done. NOTE: The time available for each of the users for a particular experiment is given in the slot Time left for Data Acquisition. o The maximum number of trials available for each user is three o Each user will be logged out in either of the following two cases: If the number of trials exceeds three If the Time Left counts down to zero SAVE DATA (#8a): This option allows the user to SAVE the acquired data for further analysis. Users can relook into the graphs as well as the numerical values obtained by conducting the experiment. To use the data, the user needs to exit the file and choose the OFFLINE mode. When prompted for the saved file, the same can be uploaded. 9. Proceed to the next step by clicking on the NEXT button.
 slot provided o Now move the vertical and the horizontal axis to the peak value of the first curve as shown")
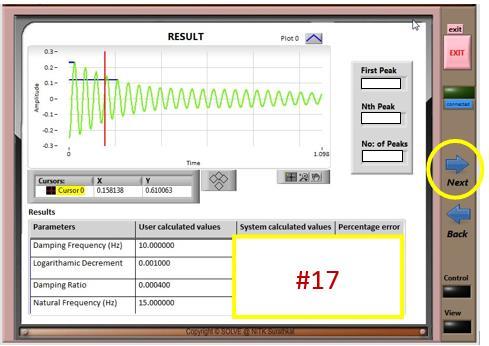
6 10. By using the graph, the required parameters can be found. o First bring the cursors to the ORIGIN by typing the X and Y values as 0,0 in the (#10 a) slot provided o Now move the vertical and the horizontal axis to the peak value of the first curve as shown in (#10 b) (This is y 0. Note this value) o o o o Next the axes are now moved on to another peak amplitude (Say third peak) as shown in (#10 c) (This is y n. Note this value) and the values of X and Y are noted down as shown in (#10d), Amplitude values are in Y axis and Time on X. Now from the value of the logarithmic decrement, the value of Damping Ratio is found by using the formula provided in the table. From the graph, find the time period with the help of axis (Difference of time in consecutive x-axis) and then calculate the frequency. This frequency is the Damped natural frequency. Once the damped natural frequency is calculated, calculate the natural frequency from the formula table given below.
 Natural frequency Stiffness (Mass m is the")
7 PARAMETERS TO BE CALCULATED FORMULA TO BE USED UNITS Logarithmic decrement Damping factor δ = 1 n ln (y 0 y n ) wherein y0 and yn are the amplitudes 1 ζ = 1 + ( 2π δ )2 Damped vibration time period τ d = t 1 t 0 Seconds Damped natural frequency f d = 1 τ d Hz Damped natural frequency ω d = 2πf d Rad/Sec Natural frequency of the system ω n = (1 ζ 2 ) Natural frequency Stiffness (Mass m is the total mass involving in the dynamics. It has to be calculated by summing the mass of beam as well as the sensor ) Critical damping f n = 2π ω n ω d k = ω n 2. m c c = 2 mk Rad/Sec Hz N/m Ns m Equivalent viscous Damping coefficient of the system c = ζc c Ns m

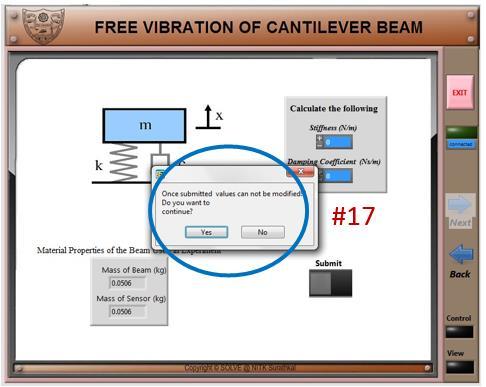
8 To obtain the results, various tools are available in the form of graph legends (Pan, Zoom, etc). The values are now to be entered in the CALCULATE section as shown in (#10e). Once this is done, click on the SUBMIT button. Note that the submit button is to be pressed ONLY when the user is sure of the answer. Once submitted the answers cannot be reverted. 11. The response message is seen once the data is SUBMITTED. Click YES to continue. 12. Upon successful submission of the answers, click NEXT button to proceed further.


9 13. The user is now able to compare the calculated values with the actual values as shown. 14. Click on the NEXT button to proceed further. Next the user has to calculate the values of the stiffness and the damping coefficient with the available values of the mass. The formula list is available in the table.
. Click SUBMIT (#15b) button to submit the answers for evaluation. 16.")

10 15. Once the values are calculated, the values are needed to be entered in the slots provided (#15a). Click SUBMIT (#15b) button to submit the answers for evaluation. 16. Once the answers are submitted, a pop-up window asks for the confirmation. Proceed further by clicking YES and to the next step by clicking on the NEXT button. This step marks the end of experiments on beam1.


11 17. The next set of experiments is done on the beam 2 with a damping tape. The same procedure is adopted for the damped set of conditions. A series of images of the same are as shown below:
12

13 18. The final results can be viewed from the tabular column as shown above. The data can be saved using the SAVE RESULT option. 19. Press EXIT button to exit from the experiment.
Rectilinear System. Introduction. Hardware
 Rectilinear System Introduction This lab studies the dynamic behavior of a system of translational mass, spring and damper components. The system properties will be determined first making use of basic
Dynamic Vibration Absorber
 Part 1B Experimental Engineering Integrated Coursework Location: DPO Experiment A1 (Short) Dynamic Vibration Absorber Please bring your mechanics data book and your results from first year experiment 7
CHAPTER 6 INTRODUCTION TO SYSTEM IDENTIFICATION
 CHAPTER 6 INTRODUCTION TO SYSTEM IDENTIFICATION Broadly speaking, system identification is the art and science of using measurements obtained from a system to characterize the system. The characterization
Experiment 8: An AC Circuit
 Experiment 8: An AC Circuit PART ONE: AC Voltages. Set up this circuit. Use R = 500 Ω, L = 5.0 mh and C =.01 μf. A signal generator built into the interface provides the emf to run the circuit from Output
LRC Circuit PHYS 296 Your name Lab section
 LRC Circuit PHYS 296 Your name Lab section PRE-LAB QUIZZES 1. What will we investigate in this lab? 2. Figure 1 on the following page shows an LRC circuit with the resistor of 1 Ω, the capacitor of 33
Part 2: Second order systems: cantilever response
 - cantilever response slide 1 Part 2: Second order systems: cantilever response Goals: Understand the behavior and how to characterize second order measurement systems Learn how to operate: function generator,
DC and AC Circuits. Objective. Theory. 1. Direct Current (DC) R-C Circuit
 R-C Circuit") [International Campus Lab] Objective Determine the behavior of resistors, capacitors, and inductors in DC and AC circuits. Theory ----------------------------- Reference -------------------------- Young
[International Campus Lab] Objective Determine the behavior of resistors, capacitors, and inductors in DC and AC circuits. Theory ----------------------------- Reference -------------------------- Young
Introduction to NetLab ECT practical # 1
 Introduction to NetLab ECT practical # 1 NetLab is the UniSA remote laboratory which you can access at URL: http://netlab.unisa.edu.au/. Its main page is shown in Figure 1. Click on the "Click Here to
SignalCalc Drop Test Demo Guide
 SignalCalc Drop Test Demo Guide Introduction Most protective packaging for electronic and other fragile products use cushion materials in the packaging that are designed to deform in response to forces
Experiment 2: Transients and Oscillations in RLC Circuits
 Experiment 2: Transients and Oscillations in RLC Circuits Will Chemelewski Partner: Brian Enders TA: Nielsen See laboratory book #1 pages 5-7, data taken September 1, 2009 September 7, 2009 Abstract Transient
Voltage Current and Resistance II
 Voltage Current and Resistance II Equipment: Capstone with 850 interface, analog DC voltmeter, analog DC ammeter, voltage sensor, RLC circuit board, 8 male to male banana leads 1 Purpose This is a continuation
MASSACHUSETTS INSTITUTE OF TECHNOLOGY Department of Physics 8.02 Spring 2005 Experiment 10: LR and Undriven LRC Circuits
 MASSACHUSETTS INSTITUTE OF TECHNOLOGY Department of Physics 8.0 Spring 005 Experiment 10: LR and Undriven LRC Circuits OBJECTIVES 1. To determine the inductance L and internal resistance R L of a coil,
Experiment 13: LR Circuit
 012-05892A AC/DC Electronics Laboratory Experiment 13: LR Circuit Purpose Theory EQUIPMENT NEEDED: Computer and Science Workshop Interface Power Amplifier (CI-6552A) (2) Voltage Sensor (CI-6503) AC/DC
NOVA technical note #8 1. Case study: how to use cutoff conditions in a FRA frequency scan?
 NOVA technical note #8 1 Cutoffs in FRA 1 Case study: how to use cutoff conditions in a FRA frequency scan? One of the FAQ from NOVA users is: Can I use cutoffs during a FRA frequency scan? Using cutoffs
Experiment P41: Induction Magnet through a Coil (Photogate, Voltage Sensor)
") PASCO scientific Vol. 2 Physics Lab Manual: P41-1 Experiment P41: Induction Magnet through a Coil (Photogate, Voltage Sensor) Concept Time SW Interface Macintosh file Windows file circuits 30 m 500/700
PASCO scientific Vol. 2 Physics Lab Manual: P41-1 Experiment P41: Induction Magnet through a Coil (Photogate, Voltage Sensor) Concept Time SW Interface Macintosh file Windows file circuits 30 m 500/700
Experiment 1.A. Working with Lab Equipment. ECEN 2270 Electronics Design Laboratory 1
 .A Working with Lab Equipment Electronics Design Laboratory 1 1.A.0 1.A.1 3 1.A.4 Procedures Turn in your Pre Lab before doing anything else Setup the lab waveform generator to output desired test waveforms,
3.003 Lab 3 Part A. Measurement of Speed of Light
 3.003 Lab 3 Part A. Measurement of Speed of Light Objective: To measure the speed of light in free space Experimental Apparatus: Feb. 18, 2010 Due Mar. 2, 2010 Components: 1 Laser, 4 mirrors, 1 beam splitter
EXPERIMENT 7 The Amplifier
 Objectives EXPERIMENT 7 The Amplifier 1) Understand the operation of the differential amplifier. 2) Determine the gain of each side of the differential amplifier. 3) Determine the gain of the differential
Step 1: Set up the variables AB Design. Use the top cells to label the variables that will be displayed on the X and Y axes of the graph
 Step 1: Set up the variables AB Design Use the top cells to label the variables that will be displayed on the X and Y axes of the graph Step 1: Set up the variables X axis for AB Design Enter X axis label
EE 210: CIRCUITS AND DEVICES
 EE 210: CIRCUITS AND DEVICES LAB #3: VOLTAGE AND CURRENT MEASUREMENTS This lab features a tutorial on the instrumentation that you will be using throughout the semester. More specifically, you will see
11Beamage-3. CMOS Beam Profiling Cameras
 11Beamage-3 CMOS Beam Profiling Cameras Key Features USB 3.0 FOR THE FASTEST TRANSFER RATES Up to 10X faster than regular USB 2.0 connections (also USB 2.0 compatible) HIGH RESOLUTION 2.2 MPixels resolution
Lab Report 4: Root Locus and Proportional Controller
 Lab Report 4: Root Locus and Proportional Controller University of Tennessee at Chattanooga Engineering 32 Blue Team Kevin Schrumpf Justin Anchanattu Justin Rehagen April 1, 212 Introduction The first
A study of Vibration Analysis for Gearbox Casing Using Finite Element Analysis
 A study of Vibration Analysis for Gearbox Casing Using Finite Element Analysis M. Sofian D. Hazry K. Saifullah M. Tasyrif K.Salleh I.Ishak Autonomous System and Machine Vision Laboratory, School of Mechatronic,
RLC-circuits with Cobra4 Xpert-Link
 Student's Sheet RLC-circuits with Cobra4 Xpert-Link (Item No.: P2440664) Curricular Relevance Area of Expertise: Physics Subtopic: Inductance, Electromagnetic Oscillations, AC Circuits Topic: Electricity
3.2 Measuring Frequency Response Of Low-Pass Filter :
 2.5 Filter Band-Width : In ideal Band-Pass Filters, the band-width is the frequency range in Hz where the magnitude response is at is maximum (or the attenuation is at its minimum) and constant and equal
PHYSICS LAB. Sound. Date: GRADE: PHYSICS DEPARTMENT JAMES MADISON UNIVERSITY
 PHYSICS LAB Sound Printed Names: Signatures: Date: Lab Section: Instructor: GRADE: PHYSICS DEPARTMENT JAMES MADISON UNIVERSITY Revision August 2003 Sound Investigations Sound Investigations 78 Part I -
PHY 1405 Conceptual Physics I Making a Spring Scale. Leader: Recorder: Skeptic: Encourager:
 PHY 1405 Conceptual Physics I Making a Spring Scale Leader: Recorder: Skeptic: Encourager: Materials Helical Spring Newton mass set Slotted gram mass set Mass hanger Laptop Balloon Ring stand with meter
PANalytical X pert Pro Gazing Incidence X-ray Reflectivity User Manual (Version: )
") University of Minnesota College of Science and Engineering Characterization Facility PANalytical X pert Pro Gazing Incidence X-ray Reflectivity User Manual (Version: 2012.10.17) The following instructions
University of Minnesota College of Science and Engineering Characterization Facility PANalytical X pert Pro Gazing Incidence X-ray Reflectivity User Manual (Version: 2012.10.17) The following instructions
INCLINED PLANE RIG LABORATORY USER GUIDE VERSION 1.3
 INCLINED PLANE RIG LABORATORY USER GUIDE VERSION 1.3 Labshare 2011 Table of Contents 1 Introduction... 3 1.1 Remote Laboratories... 3 1.2 Inclined Plane - The Rig Apparatus... 3 1.2.1 Block Masses & Inclining
ME 365 FINAL EXAM. Monday, April 29, :30 pm-5:30 pm LILY Problem Score
 Name: SOLUTION Section: 8:30_Chang 11:30_Meckl ME 365 FINAL EXAM Monday, April 29, 2013 3:30 pm-5:30 pm LILY 1105 Problem Score Problem Score Problem Score Problem Score Problem Score 1 5 9 13 17 2 6 10
3B SCIENTIFIC PHYSICS
 B SCIENTIFIC PHYSICS Cavendish Torsion Balance 007 Operating instructions 06/8 ALF. Description The Cavendish torsion balance is for demonstrating the gravitational attraction between two masses and determining
Integrators, differentiators, and simple filters
 BEE 233 Laboratory-4 Integrators, differentiators, and simple filters 1. Objectives Analyze and measure characteristics of circuits built with opamps. Design and test circuits with opamps. Plot gain vs.
Lab 3 Swinging pendulum experiment
 Lab 3 Swinging pendulum experiment Agenda Time 10 min Item Review agenda Introduce the swinging pendulum experiment and apparatus 95 min Lab activity I ll try to give you a 5- minute warning before the
University of Tennessee at. Chattanooga
 University of Tennessee at Chattanooga Step Response Engineering 329 By Gold Team: Jason Price Jered Swartz Simon Ionashku 2-3- 2 INTRODUCTION: The purpose of the experiments was to investigate and understand
Information & Instructions
 KEY FEATURES 1. USB 3.0 For the Fastest Transfer Rates Up to 10X faster than regular USB 2.0 connections (also USB 2.0 compatible) 2. High Resolution 4.2 MegaPixels resolution gives accurate profile measurements
RLC-circuits with Cobra4 Xpert-Link TEP. 1 2 π L C. f res=
 Related topics Damped and forced oscillations, Kirchhoff s laws, series and parallel tuned circuit, resistance, capacitance, inductance, reactance, impedance, phase displacement, Q-factor, band-width Principle
LAB 7: THE OSCILLOSCOPE
 LAB 7: THE OSCILLOSCOPE Equipment List: Dual Trace Oscilloscope HP function generator HP-DMM 2 BNC-to-BNC 1 cables (one long, one short) 1 BNC-to-banana 1 BNC-probe Hand-held DMM (freq mode) Purpose: To
Preliminary study of the vibration displacement measurement by using strain gauge
 Songklanakarin J. Sci. Technol. 32 (5), 453-459, Sep. - Oct. 2010 Original Article Preliminary study of the vibration displacement measurement by using strain gauge Siripong Eamchaimongkol* Department
CHAPTER 4 IMPLEMENTATION OF ADALINE IN MATLAB
 52 CHAPTER 4 IMPLEMENTATION OF ADALINE IN MATLAB 4.1 INTRODUCTION The ADALINE is implemented in MATLAB environment running on a PC. One hundred data samples are acquired from a single cycle of load current
Drawing Bode Plots (The Last Bode Plot You Will Ever Make) Charles Nippert
 Charles Nippert") Drawing Bode Plots (The Last Bode Plot You Will Ever Make) Charles Nippert This set of notes describes how to prepare a Bode plot using Mathcad. Follow these instructions to draw Bode plot for any transfer
Drawing Bode Plots (The Last Bode Plot You Will Ever Make) Charles Nippert This set of notes describes how to prepare a Bode plot using Mathcad. Follow these instructions to draw Bode plot for any transfer
Available online at ScienceDirect. Procedia Technology 14 (2014 )
") Available online at www.sciencedirect.com ScienceDirect Procedia Technology 14 (2014 ) 108 115 2nd International Conference on Innovations in Automation and Mechatronics Engineering, ICIAME 2014 Design
Available online at www.sciencedirect.com ScienceDirect Procedia Technology 14 (2014 ) 108 115 2nd International Conference on Innovations in Automation and Mechatronics Engineering, ICIAME 2014 Design
Experiment P55: Light Intensity vs. Position (Light Sensor, Motion Sensor)
") PASCO scientific Vol. 2 Physics Lab Manual: P55-1 Experiment P55: (Light Sensor, Motion Sensor) Concept Time SW Interface Macintosh file Windows file illuminance 30 m 500/700 P55 Light vs. Position P55_LTVM.SWS
PASCO scientific Vol. 2 Physics Lab Manual: P55-1 Experiment P55: (Light Sensor, Motion Sensor) Concept Time SW Interface Macintosh file Windows file illuminance 30 m 500/700 P55 Light vs. Position P55_LTVM.SWS
8A. ANALYSIS OF COMPLEX SOUNDS. Amplitude, loudness, and decibels
 8A. ANALYSIS OF COMPLEX SOUNDS Amplitude, loudness, and decibels Last week we found that we could synthesize complex sounds with a particular frequency, f, by adding together sine waves from the harmonic
Momentum and Impulse. Objective. Theory. Investigate the relationship between impulse and momentum.
 [For International Campus Lab ONLY] Objective Investigate the relationship between impulse and momentum. Theory ----------------------------- Reference -------------------------- Young & Freedman, University
Pressure Response of a Pneumatic System
 Pressure Response of a Pneumatic System by Richard A., PhD rick.beier@okstate.edu Mechanical Engineering Technology Department Oklahoma State University, Stillwater Abstract This paper describes an instructive
ECE4902 Lab 5 Simulation. Simulation. Export data for use in other software tools (e.g. MATLAB or excel) to compare measured data with simulation
 to compare measured data with simulation") ECE4902 Lab 5 Simulation Simulation Export data for use in other software tools (e.g. MATLAB or excel) to compare measured data with simulation Be sure to have your lab data available from Lab 5, Common
ECE4902 Lab 5 Simulation Simulation Export data for use in other software tools (e.g. MATLAB or excel) to compare measured data with simulation Be sure to have your lab data available from Lab 5, Common
MTE 360 Automatic Control Systems University of Waterloo, Department of Mechanical & Mechatronics Engineering
 MTE 36 Automatic Control Systems University of Waterloo, Department of Mechanical & Mechatronics Engineering Laboratory #1: Introduction to Control Engineering In this laboratory, you will become familiar
Development of a Package for a Triaxial High-G Accelerometer Optimized for High Signal Fidelity
 Development of a Package for a Triaxial High-G Accelerometer Optimized for High Signal Fidelity R. Langkemper* 1, R. Külls 1, J. Wilde 2, S. Schopferer 1 and S. Nau 1 1 Fraunhofer Institute for High-Speed
FACULTY OF ENGINEERING LAB SHEET ENT 3036 SEMICONDUCTOR DEVICES TRIMESTER
 FACULTY OF ENGINEERING LAB SHEET ENT 3036 SEMICONDUCTOR DEVICES TRIMESTER 3 2017-2018 SD1 I-V MEASUREMENT OF MOS CAPACITOR *Note: On-the-spot evaluation may be carried out during or at the end of the experiment.
Correction for Synchronization Errors in Dynamic Measurements
 Correction for Synchronization Errors in Dynamic Measurements Vasishta Ganguly and Tony L. Schmitz Department of Mechanical Engineering and Engineering Science University of North Carolina at Charlotte
 RC_Circuits RC Circuits Lab Q1 Open the Logger Pro program RC_RL_Circuits via the Logger Launcher icon on your desktop. RC Circuits Lab Part1 Part 1: Measuring Voltage and Current in an RC Circuit 1. 2.
RC and RL Circuits Prelab
 RC and RL Circuits Prelab by Dr. Christine P. Cheney, Department of Physics and Astronomy, 401 Nielsen Physics Building, The University of Tennessee, Knoxville, Tennessee 37996-1200 2018 by Christine P.
SOLVING VIBRATIONAL RESONANCE ON A LARGE SLENDER BOAT USING A TUNED MASS DAMPER. A.W. Vredeveldt, TNO, The Netherlands
 SOLVING VIBRATIONAL RESONANCE ON A LARGE SLENDER BOAT USING A TUNED MASS DAMPER. A.W. Vredeveldt, TNO, The Netherlands SUMMARY In luxury yacht building, there is a tendency towards larger sizes, sometime
Gentec-EO USA. T-RAD-USB Users Manual. T-Rad-USB Operating Instructions /15/2010 Page 1 of 24
 Gentec-EO USA T-RAD-USB Users Manual Gentec-EO USA 5825 Jean Road Center Lake Oswego, Oregon, 97035 503-697-1870 voice 503-697-0633 fax 121-201795 11/15/2010 Page 1 of 24 System Overview Welcome to the
MicroLab 500-series Getting Started
 MicroLab 500-series Getting Started 2 Contents CHAPTER 1: Getting Started Connecting the Hardware....6 Installing the USB driver......6 Installing the Software.....8 Starting a new Experiment...8 CHAPTER
5.1 Graphing Sine and Cosine Functions.notebook. Chapter 5: Trigonometric Functions and Graphs
 Chapter 5: Trigonometric Functions and Graphs 1 Chapter 5 5.1 Graphing Sine and Cosine Functions Pages 222 237 Complete the following table using your calculator. Round answers to the nearest tenth. 2
Development of a Low Cost 3x3 Coupler. Mach-Zehnder Interferometric Optical Fibre Vibration. Sensor
 Development of a Low Cost 3x3 Coupler Mach-Zehnder Interferometric Optical Fibre Vibration Sensor Kai Tai Wan Department of Mechanical, Aerospace and Civil Engineering, Brunel University London, UB8 3PH,
ENGR 210 Lab 12: Sampling and Aliasing
 ENGR 21 Lab 12: Sampling and Aliasing In the previous lab you examined how A/D converters actually work. In this lab we will consider some of the consequences of how fast you sample and of the signal processing
Lab 3: RC Circuits. Construct circuit 2 in EveryCircuit. Set values for the capacitor and resistor to match those in figure 2 and set the frequency to
 Lab 3: RC Circuits Prelab Deriving equations for the output voltage of the voltage dividers you constructed in lab 2 was fairly simple. Now we want to derive an equation for the output voltage of a circuit
ANSYS v14.5. Manager Installation Guide CAE Associates
 ANSYS v14.5 Remote Solve Manager Installation Guide 2013 CAE Associates What is the Remote Solve Manager? The Remote Solve Manager (RSM) is a job queuing system designed specifically for use with the ANSYS
Graphing with Excel. Data Table
 Graphing with Excel Copyright L. S. Quimby There are many spreadsheet programs and graphing programs that you can use to produce very nice graphs for your laboratory reports and homework papers, but Excel
Relationship to theory: This activity involves the motion of bodies under constant velocity.
 UNIFORM MOTION Lab format: this lab is a remote lab activity Relationship to theory: This activity involves the motion of bodies under constant velocity. LEARNING OBJECTIVES Read and understand these instructions
Momentum and Impulse
 General Physics Lab Department of PHYSICS YONSEI University Lab Manual (Lite) Momentum and Impulse Ver.20180328 NOTICE This LITE version of manual includes only experimental procedures for easier reading
Physics 253 Fundamental Physics Mechanic, September 9, Lab #2 Plotting with Excel: The Air Slide
 1 NORTHERN ILLINOIS UNIVERSITY PHYSICS DEPARTMENT Physics 253 Fundamental Physics Mechanic, September 9, 2010 Lab #2 Plotting with Excel: The Air Slide Lab Write-up Due: Thurs., September 16, 2010 Place
Experiment P01: Understanding Motion I Distance and Time (Motion Sensor)
") PASCO scientific Physics Lab Manual: P01-1 Experiment P01: Understanding Motion I Distance and Time (Motion Sensor) Concept Time SW Interface Macintosh file Windows file linear motion 30 m 500 or 700 P01
PASCO scientific Physics Lab Manual: P01-1 Experiment P01: Understanding Motion I Distance and Time (Motion Sensor) Concept Time SW Interface Macintosh file Windows file linear motion 30 m 500 or 700 P01
MASSACHUSETTS INSTITUTE OF TECHNOLOGY /6.071 Introduction to Electronics, Signals and Measurement Spring 2006
 MASSACHUSETTS INSTITUTE OF TECHNOLOGY.071/6.071 Introduction to Electronics, Signals and Measurement Spring 006 Lab. Introduction to signals. Goals for this Lab: Further explore the lab hardware. The oscilloscope
Auntie Spark s Guide to creating a Data Collection VI
 Auntie Spark s Guide to creating a Data Collection VI Suppose you wanted to gather data from an experiment. How would you create a VI to do so? For sophisticated data collection and experimental control,
Advanced Lab LAB 6: Signal Acquisition & Spectrum Analysis Using VirtualBench DSA Equipment: Objectives:
 Advanced Lab LAB 6: Signal Acquisition & Spectrum Analysis Using VirtualBench DSA Equipment: Pentium PC with National Instruments PCI-MIO-16E-4 data-acquisition board (12-bit resolution; software-controlled
Proportional-Integral Controller Performance
 Proportional-Integral Controller Performance Silver Team Jonathan Briere ENGR 329 Dr. Henry 4/1/21 Silver Team Members: Jordan Buecker Jonathan Briere John Colvin 1. Introduction Modeling for the response
sin(wt) y(t) Exciter Vibrating armature ENME599 1
 y(t) Exciter Vibrating armature ENME599 1") ENME599 1 LAB #3: Kinematic Excitation (Forced Vibration) of a SDOF system Students must read the laboratory instruction manual prior to the lab session. The lab report must be submitted in the beginning
ENME599 1 LAB #3: Kinematic Excitation (Forced Vibration) of a SDOF system Students must read the laboratory instruction manual prior to the lab session. The lab report must be submitted in the beginning
Inductance of solenoids with Cobra3
 Inductance of solenoids with Cobra3 TEP Related topics Law of inductance, Lenz s law, self-inductance, solenoids, transformer, oscillatory circuit, resonance, damped oscillation, logarithmic decrement,
BME 3512 Bioelectronics Laboratory Two - Passive Filters
 BME 35 Bioelectronics Laboratory Two - Passive Filters Learning Objectives: Understand the basic principles of passive filters. Laboratory Equipment: Agilent Oscilloscope Model 546A Agilent Function Generator
RC Circuit Activity. Retrieve a power cord and a voltage sensor from the wire rack hanging on the wall in the lab room.
 Purpose RC Circuit Activity Using an RC circuit, students will determine time constants by varying the resistance of the circuit and analyzing the exponential decay. After determining several time constants,
AC Circuits INTRODUCTION DISCUSSION OF PRINCIPLES. Resistance in an AC Circuit
 AC Circuits INTRODUCTION The study of alternating current 1 (AC) in physics is very important as it has practical applications in our daily lives. As the name implies, the current and voltage change directions
Experiment 3 Topic: Dynamic System Response Week A Procedure
 Experiment 3 Topic: Dynamic System Response Week A Procedure Laboratory Assistant: Email: Office Hours: LEX-3 Website: Brock Hedlund bhedlund@nd.edu 11/05 11/08 5 pm to 6 pm in B14 http://www.nd.edu/~jott/measurements/measurements_lab/e3
EXPERIMENT NUMBER 10 TRANSIENT ANALYSIS USING PSPICE
 EXPERIMENT NUMBER 10 TRANSIENT ANALYSIS USING PSPICE Objective: To learn to use a circuit simulator package for plotting the response of a circuit in the time domain. Preliminary: Revise laboratory 8 to
Lab E2: B-field of a Solenoid. In the case that the B-field is uniform and perpendicular to the area, (1) reduces to
 reduces to") E2.1 Lab E2: B-field of a Solenoid In this lab, we will explore the magnetic field created by a solenoid. First, we must review some basic electromagnetic theory. The magnetic flux over some area A is
E2.1 Lab E2: B-field of a Solenoid In this lab, we will explore the magnetic field created by a solenoid. First, we must review some basic electromagnetic theory. The magnetic flux over some area A is
Oscilloscope Operation. Visualizing Signals and Making Measurements
 Oscilloscope Operation Visualizing Signals and Making Measurements Set Up Oscilloscope Start with the oscilloscope off, with the input plugged into channel one. Press the power button to turn the scope
1. Hand Calculations (in a manner suitable for submission) For the circuit in Fig. 1 with f = 7.2 khz and a source vin () t 1.
 For the circuit in Fig. 1 with f = 7.2 khz and a source vin () t 1.") Objectives The purpose of this laboratory project is to introduce to equipment, measurement techniques, and simulations commonly used in AC circuit analysis. In this laboratory session, each student will:
Objectives The purpose of this laboratory project is to introduce to equipment, measurement techniques, and simulations commonly used in AC circuit analysis. In this laboratory session, each student will:
CONTENTS. Cambridge University Press Vibration of Mechanical Systems Alok Sinha Table of Contents More information
 CONTENTS Preface page xiii 1 Equivalent Single-Degree-of-Freedom System and Free Vibration... 1 1.1 Degrees of Freedom 3 1.2 Elements of a Vibratory System 5 1.2.1 Mass and/or Mass-Moment of Inertia 5
Figure E2-1 The complete circuit showing the oscilloscope and Bode plotter.
 Example 2 An RC network using the oscilloscope and Bode plotter In this example we use the oscilloscope and the Bode plotter in an RC circuit that has an AC source. The circuit which we will construct
Teacher s Guide - Activity P51: LR Circuit (Power Output, Voltage Sensor)
") Teacher s Guide - Activity P51: LR Circuit (Power Output, Voltage Sensor) Concept DataStudio ScienceWorkshop (Mac) ScienceWorkshop (Win) Circuits P51 LR Circuit.DS (See end of activity) (See end of activity)
Teacher s Guide - Activity P51: LR Circuit (Power Output, Voltage Sensor) Concept DataStudio ScienceWorkshop (Mac) ScienceWorkshop (Win) Circuits P51 LR Circuit.DS (See end of activity) (See end of activity)
Exercise 8. The Four-Quadrant Chopper EXERCISE OBJECTIVE DISCUSSION OUTLINE DISCUSSION. The Four-Quadrant Chopper
 Exercise 8 The Four-Quadrant Chopper EXERCISE OBJECTIVE When you have completed this exercise, you will be familiar with the operation of the four-quadrant chopper. DISCUSSION OUTLINE The Discussion of
Response spectrum Time history Power Spectral Density, PSD
 A description is given of one way to implement an earthquake test where the test severities are specified by time histories. The test is done by using a biaxial computer aided servohydraulic test rig.
SpinCore RadioProcessor LabVIEW Extensions
 NMR Interface User's Manual SpinCore Technologies, Inc. http:// Congratulations and thank you for choosing a design from SpinCore Technologies, Inc. We appreciate your business! At SpinCore we try to fully
OHM S LAW. Ohm s Law The relationship between potential difference (V) across a resistor of resistance (R) and the current (I) passing through it is
 across a resistor of resistance (R) and the current (I) passing through it is") OHM S LAW Objectives: a. To find the unknown resistance of an ohmic resistor b. To investigate the series and parallel combination of resistors c. To investigate the non-ohmic resistors Apparatus Required:
OHM S LAW Objectives: a. To find the unknown resistance of an ohmic resistor b. To investigate the series and parallel combination of resistors c. To investigate the non-ohmic resistors Apparatus Required:
Time-Varying Signals
 Time-Varying Signals Objective This lab gives a practical introduction to signals that varies with time using the components such as: 1. Arbitrary Function Generator 2. Oscilloscopes The grounding issues
UV-Vis-NIR Spectrophotometer Quick Start Guide
 UV-Vis-NIR Spectrophotometer Quick Start Guide The following instructions are provided as a Quick Start Guide for powering up, running measurements, and shutting down the Lambda 950 UV-Vis Spectrophotometer.
Module 7 : Design of Machine Foundations. Lecture 31 : Basics of soil dynamics [ Section 31.1: Introduction ]
![Module 7 : Design of Machine Foundations. Lecture 31 : Basics of soil dynamics [ Section 31.1: Introduction ]](/thumbs/75/72740950.jpg "Module 7 : Design of Machine Foundations. Lecture 31 : Basics of soil dynamics [ Section 31.1: Introduction ]") Lecture 31 : Basics of soil dynamics [ Section 31.1: Introduction ] Objectives In this section you will learn the following Dynamic loads Degrees of freedom Lecture 31 : Basics of soil dynamics [ Section
Lecture 31 : Basics of soil dynamics [ Section 31.1: Introduction ] Objectives In this section you will learn the following Dynamic loads Degrees of freedom Lecture 31 : Basics of soil dynamics [ Section
Electronics and Instrumentation Name ENGR-4220 Fall 1999 Section Modeling the Cantilever Beam Supplemental Info for Project 1.
 Name ENGR-40 Fall 1999 Section Modeling the Cantilever Beam Supplemental Info for Project 1 The cantilever beam has a simple equation of motion. If we assume that the mass is located at the end of the
PANalytical X pert Pro High Resolution Specular and Rocking Curve Scans User Manual (Version: )
") University of Minnesota College of Science and Engineering Characterization Facility PANalytical X pert Pro High Resolution Specular and Rocking Curve Scans User Manual (Version: 2012.10.17) The following
University of Minnesota College of Science and Engineering Characterization Facility PANalytical X pert Pro High Resolution Specular and Rocking Curve Scans User Manual (Version: 2012.10.17) The following
Faraday s Law PHYS 296 Your name Lab section
 Faraday s Law PHYS 296 Your name Lab section PRE-LAB QUIZZES 1. What will we investigate in this lab? 2. State and briefly explain Faraday s Law. 3. For the setup in Figure 1, when you move the bar magnet
2 Oscilloscope Familiarization
 Lab 2 Oscilloscope Familiarization What You Need To Know: Voltages and currents in an electronic circuit as in a CD player, mobile phone or TV set vary in time. Throughout the course you will investigate
Alibre Design Tutorial: Loft, Extrude, & Revolve Cut Loft-Tube-1
 Alibre Design Tutorial: Loft, Extrude, & Revolve Cut Loft-Tube-1 Part Tutorial Exercise 5: Loft-Tube-1 [Complete] In this Exercise, We will set System Parameters first, then part options. Then, in sketch
ME scope Application Note 02 Waveform Integration & Differentiation
 ME scope Application Note 02 Waveform Integration & Differentiation The steps in this Application Note can be duplicated using any ME scope Package that includes the VES-3600 Advanced Signal Processing
Beam Dynamics + Laser Micro Vibrometry 1
 ENMF 529 INTRODUCTION TO MICROELECTROMECHANICAL SYSTEMS p. 1 DATE:... Note: Print this document at Scale (Page Setup) = 75% LAB #4 ( VIL #7 ) Beam Dynamics + Laser Micro Vibrometry 1 SAFETY and instrument
Physics 3 Lab 5 Normal Modes and Resonance
 Physics 3 Lab 5 Normal Modes and Resonance 1 Physics 3 Lab 5 Normal Modes and Resonance INTRODUCTION Earlier in the semester you did an experiment with the simplest possible vibrating object, the simple
Ph 3455 The Photoelectric Effect
 Ph 3455 The Photoelectric Effect Required background reading Tipler, Llewellyn, section 3-3 Prelab Questions 1. In this experiment you will be using a mercury lamp as the source of photons. At the yellow
How to Pair AbiBird Sensor with App and Account
 How to Pair AbiBird Sensor with App and Account By pairing your AbiBird sensor with your AbiBird app and account, you make it posible for signals to pass from the sensor, via the Cloud, to the AbiBird
Sound. Use a Microphone to analyze the frequency components of a tuning fork. Record overtones produced with a tuning fork.
 Sound PART ONE - TONES In this experiment, you will analyze various common sounds. You will use a Microphone connected to a computer. Logger Pro will display the waveform of each sound, and will perform