NATIONAL RADIO ASTRONOMY OBSERVATORY Green Bank, West Virginia Electronics Division Internal Report No. 136
|
|
|
- Julia Rose
- 5 years ago
- Views:
Transcription
1 NATIONAL RADIO ASTRONOMY OBSERVATORY Green Bank, West Virginia Electronics Division Internal Report No. 136 AN ANTENNA MEASURING INSTRUMENT AND ITS USE ON THE 140-FOOT TELESCOPE J. 'W. Findlay and John M. Payne JANUARY 1974 NUMBER OF COPIES: 150
2 AN ANTENNA MEASURING INSTRUMENT AND ITS USE ON THE 140-FOOT TELESCOPE TABLE OF CONTENTS 1. 0 Introduction Principle of Operation General Description Theory of the System Analysis of the System Signal Strength Analysis The Phase Shifts and Signal Balance Stability Analysis General Description and Operating Procedures Ground Tests of the System Accuracy and Linearity Atmospheric Effects Tests on the 140-Foot Telescope Comparison with Computed Deflections and Conclusions References 10 Page LIST OF FIGURES 1. Block Diagram of Antenna Measuring Instrument Feed Horn Transponder The Control and Display Unit Layout on the Ground of Measuring Instrument and Transponders Instrument Reading plotted against Carriage Position Distance Changes to Transponders as Zenith Angle changes at H. A. ---= Distance Changes to Transponders as Hour Angle changes at a Fixed Declination of '... 18
3 AN ANTENNA MEASURING INSTRUMENT AND ITS USE ON THE 140-FOOT TELESCOPE J -. W. Findlay and John M. Payne 1.0 Introduction This paper is an up-to-date version of the original report on the instrument written by J. Payne (1). The description of much of the circuitry of the instrument is not repeated here. A more extensive set of ground tests has been made and a new set of measurements on the 140-foot telescope is described. A C.W. radar technique is used to measure distances from near the focal point of the reflector to various points on the reflector surface. The system described is able to measure changes in distance from the focal point to 21 points on the surface simultaneously with a short-term accuracy of 0.002" (0.05 mm). The long-term stability of the instrument is affected by changes in the atmospheric refractive index. Compensation for these changes is possible and is routine on distance measuring equipment using a modulated light beam. No attempts at compensation have been made in the present equipment. By using frequency switching techniques it would be possible to modify the instrument to measure absolute distance rather than changes in distance. The principle of this type of measurement has been known for some time (2). Swarup and Yang (3) used it for the phase adjustment of large arrays; their paper gives other references. The instrument has been installed on the 140-foot telescope and measurements made from near the focal point to four points on the surface. 2.0 Principle of Operation 2.1 General Description Figure 1 shows the components of the measuring system. A stable oscillator at X-band (11.8 GHz) transmits a signal via a circulator and a broad beam horn antenna. A transponder is situated at the other end of the path over which the distance has to be measured. This transponder receives the carrier frequency, amplitude modulates it at a frequency of 455 khz and retransmits it. The
4 2 receiver is sensitive only to the transponded signal and rejects signals at the carrier frequency. The output of the receiver is a signal at 455 khz. The phase of this signal, referred to the modulating signal provided to the transponder, is a measure of the phase difference between transmitted and received signals at the carrier frequency. The wavelength of the carrier frequency is 1 inch, so a phase change of 1 corresponds to a change in the path length of bout O. 0027" (O. 07 mm). 2.2 Theory of the E ystem To avoid the introduction of many constants the magnitude of the various signals will be ignored and phase relationships only will be considered. The output from the transmitter is given by cos co o t where co is carrier frequency (in radians/sec). o The signal received at the transponder is cos (co t + (p ), where (i) is the phase o i shift at the carrier frequency and is given by where d is the distance from the transmitter and frequency. o is the wavelength of the carrier The transponder retransmits this signal as cos co t cos (co o t + (P i ), where CO is the modulating frequency. This may be rewritten as cos [co L + (/) + cos p t + u where = co + w (the upper sideband) u o wl CO (the lower sideband)
5 3 The retransmitted signal will be phase shifted again on its return to the receiver. The signal received will be cos [co t rd c I + cos [ o t rd A. 0 where A = wavelength of upper sideband u wavelength of lower sideband. The inputs to the two mixers (assuming equal path lengths in the receiver) will be given by 27rd cos [ co L t cos co t rd X u L i 2 A, u where 0 is the additional path length added in the microwave circuit of the receiver. 2 This may be rewritten as cos [co t + + cos [o t + its L u 21 (1) where and = + 2 5l 2 27rd L 27rd The output from mixer A will be the input multiplied by cos co o t. This output signal enters the IF amplifier following the mixer. Since this amplifier only passes frequencies near co m, its output can be shown (after some algebra) to be: cos co [ t i + cos co t+ 'Ts m (2)
6 4 The output from mixer B will be the input (equation 1) multiplied by it 2 i ' this gives, after the signal has traversed the IF amplifier: cos co t - 'T cos c.o t + it s + 7r ni [ This signal from mixer B is phase shifted - Lr 2 at the modulating frequency giving at the point of addition; cos [co t [ + cos co t + 1) 21 m (3) The outputs of the two IF amplifiers are made equal and then added. When equation (2) and equation (3) are added, the first two terms cancel and a term remains that is pro- [ portional to cos w t + (1' 2. m This signal, after passing through a limiting amplifier, is phase detected using co m as a reference. This phase detector is linear and has a range of 360. The output will be proportional to. 1) 2 which is equal to 27rd + P2 + 27rd but 95 1 = x, 02 is a constant, and, X +. The output of the phase de- A. 0 X u o m tector is then 47rd 27rd X o X m X» X so the output is proportional to o' X the path in terms of the RF wavelength in air. o and thus is a measure of the length of 3. 0 Analysis of the System 3.1 Signal Strength Analysis The oscillator used was a Gunn diode with a power output of 100 mw at GHz (X 0 = 1.000").
7 5 The design of the transmitter/receiver horn antenna was quite difficult. The angle subtended by the 140-foot reflector at the focal point is 121 and, unlike the normal feed horn, we would like high illumination at the edges. Open-ended waveguide at this frequency gives a half-power beamwidth of about 70 0 in the H-plane and in the E-plane. The horn as finally designed is shown in Figure 2. By sliding the plate behind the horn, we were able to obtain a half power beamwidth of 110 in the H-plane and in the E-plane. A suitable horn for the transponder is a 23 db horn with dimensions as shown in Figure 3. This horn has a beamwidth of 18, so that alignment of the transponders on the telescope would not be difficult. The receiver noise figure was 15 db and the bandwidth after the phase detector was 100 Hz. After making allowances for various losses, the calculated signal-tonoise power at the phase detector was 46 db, when the measurement distance was 70 feet (21.4 m) with the components already described. This noise shows at the output of the limiting amplifier as phase jitter. The rms value of this may be calculated by considering the noise voltage to be added vectorially to the signal voltage. In this case the 1 noise voltage is 200 of the signal voltage, so the rms value of the phase jitter will be radians or This suggests that the jitter in the measured path length due to receiver noise would be about 4 x l0 (0.01 mm), an entirely acceptable value. 3.2 The Phase Shifts and Signal Balance The two phase shifts of 90 and the final equilization of the signals from mixer channels A and B before addition are critical to the performance of the system. Adjustment of the 90 phase shift at the IF was straightforward. The 90 phase difference between the LO signals applied to mixers A and B was realized by the adjustment of line stretchers in the LO lines. This adjustment was made most easily when the instrument was under test on the ground range (see paragraph 5). When this phase shift is correct the ranges at which minimum signals at the outputs of mixers A and B occur will differ X by exactly With the instrument mounted on its precision slide carriage, this fact was used to adjust the LO phase difference. The amplitude balance adjustment was straightforward.
8 6 The final test that these phase and amplitude adjustments were correct was twofold. As the range (in the ground tests) was changed over, the summed signal amplitude at the phase detector input should not change. Also, over a similar range change, the plot of recorded range versus actual range should be linear. Wrong adjustments result in changes in the signal amplitude and range non-linearity. As Figure 6 shows, the instrument was correctly adjusted in the ground tests. 3.3 Stai rsis determined by The stability of the instrument over the duration of an experiment is mainly (1) The stability of the Gunn diode oscillator; (2) Phase changes in the coaxial cable sending the modulating signal to the transponders; (3) Changes in atmospheric refractive index. The main effect on oscillator stability is that of changes in diode temperature. (The diode frequency also depends on the voltage supplied, but this ca.n be well-stabilized.) The frequency stability required to hold variations of a measured distance of 20 meters (66 feet) to mm (0.001 inch) is 1.3 in This stability can be achieved with a well-designed Gunn diode, although some diodes were found to drift in frequency by considerably greater amounts as their temperature changed. The cables to the transponders were about 100 meters of RG 58-U. It can easily be shown that temperature changes of 20 C are needed if phase changes in these cables are to give distance errors of mm (0.001 inch). Since distances are measured in terms of the radio frequency wavelength in air, the refractive index of air affects the measurements. For radio wavelengths, the variations in water vapor content are most important, as the following example shows. Over a measured distance of 20 meters (66 feet) in a normal atmosphere: A 1 C increase in air temperature decreases the measured range by O. 02 mm (0.008 inches). A 10 millibar increase in atmospheric pressure increases the range by O. 05 mm (0.002 inches). A 1 millibar increase in water vapor pressure increases the range by O. 08 mm (0.003 inches).
9 7 ground tests. In paragraph 5 we give examples of the distance changes observed during the 4. 0 General Descri tion and 0 eratin_ Procedures The block diagram of the system is shown in Figure 1. The transmitter/receiver was built in a temperature-controlled box. About 100 meters of RG 58-U cable connected each transponder to the control and display unit. For the ground tests the transmitter/receiver box was mounted on a precise optical bench so that its movements could be measured. For the telescope tests it was rigidly mounted near but not at the focal point of the telescope. The control and display unit was near the TiR box in the ground tests and in the control room for the telescope tests. A photograph of the control and display unit is shown in Figure 4. Each transponder is identified by an indicator lamp which has associated with it a thumbwheel switch (giving 45 phase steps) and a ten-turn potentiometer (for fine phase control). A digital display reads displacements in increments of O. 001". The control unit can handle up to 21 transponders; only four were used in the present tests. Two operating modes are possible. In the manual mode any one transponder may be selected and distance changes monitored on the digital meter. Normally, this mode is used for initial set up of each transponder output at the start of a measuring period. The automatic mode involves switching a transponder on for a period of 18 ms, measuring the distance and storing the result in a sample-hold circuit. The next transponder is then switched on and the procedure repeated. This scanning technique gives 21 voltage outputs that represent the 21 distance changes. These voltages are available continuously and are updated every O. 44 sec. A typical set up procedure involves setting the output from each channel to be near zero with the telescope set at zenith. This is done by using the manual mode and setting the distance output close to zero for each transponder by using the fine and 45 phase controls. The 45 phase control is a thumlowheel switch giving precise 45 steps in phase to the modulating signal provided to the transponder. This corresponds to a distance change of " (1.59 mm). The final meter setting is done with the fine phase control potentiometer. The instrument may then be switched to the automatic
10 mode and up to 21 outputs continuously recorded as the telescope is moved. In observing on the 140-foot telescope some of the distance changes were as large as 9 mm (0.36 inches). It w s found to be e.,sier to avoid the "phase-jump" parts of the phase detector output (which occur every 0.5 inch of range) by switching in or out the 45 phase steps and then adjusting the fin., data for these steps. 5.0 Ground Tests 9ftheayst_t_ni The instrument and four transponders were set up on a stable ground-range as shown in Figure 5. The height of the instruments was about 1.5 m (5 feet) above grasscovered ground. The instrument could be moved over a few inches on a sliding carriage along the line towards transponder number 2, and its position could be recorded to -3 ± 0.03 mm (^AO inch). 5.1 Accuracy nd Linearity We took care to,.1cljust the instrument, particularly in setting the two 90 0 phase shifts required for its correct operation, and made a number of calibrations by moving the T/R box in steps of 0.05 inches (1.27 mm) and recording the readings. A typical result on a day where atmospheric affects were small is shown in Figure 6. The rms departure of a single point from the line is mm (0.003 inch). The slope of the line is close to unity; we did not attempt to set this slope value exactly, since in use the instrument is calibrated by using the accurately known 45 phase shifts. The break in the line occurs at the phase change-over (where the total path length change goes through one RF wavelength nominally 2.54 cm). Observations close to this region are unreliable, and it was such observations which invalidate some parts of the 1970 measurements on the 140-foot telescope. 5.2 Atmospheric :Effects The ray paths used in these tests were parallel to the ground and thus the small changes in refractive index of the air near the ground showed well in the observations. On occasion, the fluctuations over 20 m distance were as large as 1 mm (0.04 inch). The record for a f :41 irly good dyw s an:.iszed over 40 minutes and showed an rms (1 a) flcutu.ition of 0.1 mm (0.004 inch). Some night-time results showed lower fluctuations.
11 9 The telescope observations, taken between 1000 and 1400 hours EDT on September 11, showed no detectable atmospheric effects down to the ± 0.1 mxn (0.004 inch) level. The fluctuations observed during the ground observations seem to be reasonably consistent with those stated in paragraph 3.3, but no actual measurements of the atmosphere were made during the ground tests. 6.0 Tests on the 140-Foot Telescope Four transponders were mounted on the surface of the 140-foot telescope, each at a radial distance of 15.9 meters (52 feet) from the reflector center. When the telescope was pointed to the zenith the transponders were N, S, E and W, respectively, and they are identified in this way in what follows. The T/13, box was bolted to the west side of the "donut" and the feed was about 40 inches (1.0 m) to the west of the focal point of the telescope. Measurements were made between 1000 and 1400 hours EDT on September 11, 1973; typical results for movements in declination (at a fixed hour angle of zero) are shown in Figure 7. Figure 8 shows results of moving the telescope over +6 hours to - 6 hours at a declination of '. Some results were repeated, and a roll from -5 hours to +5 hours at 6 = 0 was also made. The general reproducibility of results was good. The north and south transponders giving the results in Figure 8 show deflections which repeat to a (1a) error of O. 145 mm (0.006 inch). However, the east and west transponders show a possible hysteresis effect; the corresponding (1 a) error for them is 0.30 mm (0.012 inch). Whether this effect is due to the structure or to the surface panels cannot yet be decided. 7.0 Comparison with Computed Deflections and Conclusions Woon-Yin Wong has made an extensive set of computations of the deflections of those parts of the 140-foot telescope above the declination axis. He will describe these in a separate report, but he has derived from his results the expected changes in the lengths which we have measured. We are grateful for his permission to show these results as the dotted curves on Figures 7 and 8. The computations include the effects of the bending of the main reflector support structure, of the feed legs and of the resulting displacements due to our mounting
12 of the T/R, box at a point away from the axis of symmetry. Our transponders were mounted on the surface panels fairly near the points on the reflector support structure that W-Y Wong computed, but some effects of the deflections of the panel sub-structure are not allowed for in the computations. We summarize the results of the comparison as follows: ( 1 ) The agreement in shape of the measured and computed curves is excellent. (ii) (iii) (iv) The telescope behaves as a symmetric structure with respect to east and west movements in hour angle. The observed asymmetry is due to our offset mounting of the Tilt box and shows, both in measurement and computation, surprisingly large effects. We have found no major jumps or hysteresis effects in the behavior of the telescope over the hour-angle and declination ranges we have used. We believe the numerical agreement between computation and measurement is also good. It is possible (but we cannot confirm this easily) that the differences are due to the differences between our actual mounting points for the transponders and the structural points computed by W-Y Wong. 8.0 References (1) "Antenna Measuring Instrument, " John M. Payne, Electronics Division Internal Report No. 98 (1970). (2) "A Microwave Method for Checking Precision Antennas, " M. I. T. Memorandum 46L0023 (1962). (3) "The Phase Adjustment of Large Antennas, G. Swarup and K. S. Yang, IRE Transactions on Antennas and Propagation, AP-9, (1961).
13 TRANSPONDERS MOUNTED ON SURFACE OF PARABALOID <-1 MODULATING INPUT DISTANCE TO BE MEASURED -#2 II <--COS (ea e + 4) i ) AMPLIFIER C 0 S( W 0 t ) wn, AMPLIFIER C 0 S ( Win - cp i -Tr) + cos ( wrn + CD 2 ) --] PHASE 2 SHIFT 0 ( >I LIMITER < #. 3 > COS ( C U L e S b i ) + COS ( e cki < RG 58 CABLE TO TRANSPONDERS 455 KHz SWI TC HES COS arce i- Clio = 11.8 GHz 100 m W GUN EFFECT OSCILLATOR COS Gu- c, t COS r 4- rt-, 1 4- COS( Wm do ) = 2 - c s( w in t +4)2) CARRIER WAVELENGTH L SB WAVELENGTH USB WAVELENGTH SELEC T ITRANSPONDERb 455 KHz DIGI TAL PHASE SHIFTER PHASE SHIFT CONTROLS (A), LINEAR PHASE DETECTOR A ICLOCK V a C I D 2 a KHz X0 GEN. A SELECT PHASE SHIFT TCLOCK SELECT SAMPLE/HOLD v L.R FILTER DIGITAL DISPLAY CONSTANT + 27 I XL SEQUENCER S/H S/H CID 2 - CONSTANT + 27rd -I- do Xu. ICLOCK AUTO/ MAN CHART RECORDER BLOCK DIAGRAM OF ANTENNA MEASURING INSTRUMENT FIG. 1 Figure 1 Block Diagram of Antenna Measuring Instrument

14 Figure 2 Feed Hurn
15 15" Ir4rAr MMATOR -Jr mrair AA END 0.F. HORN 7 X- BAND WAVEGUIDE Figure 3 Transponder TUNING KNOB AV,1
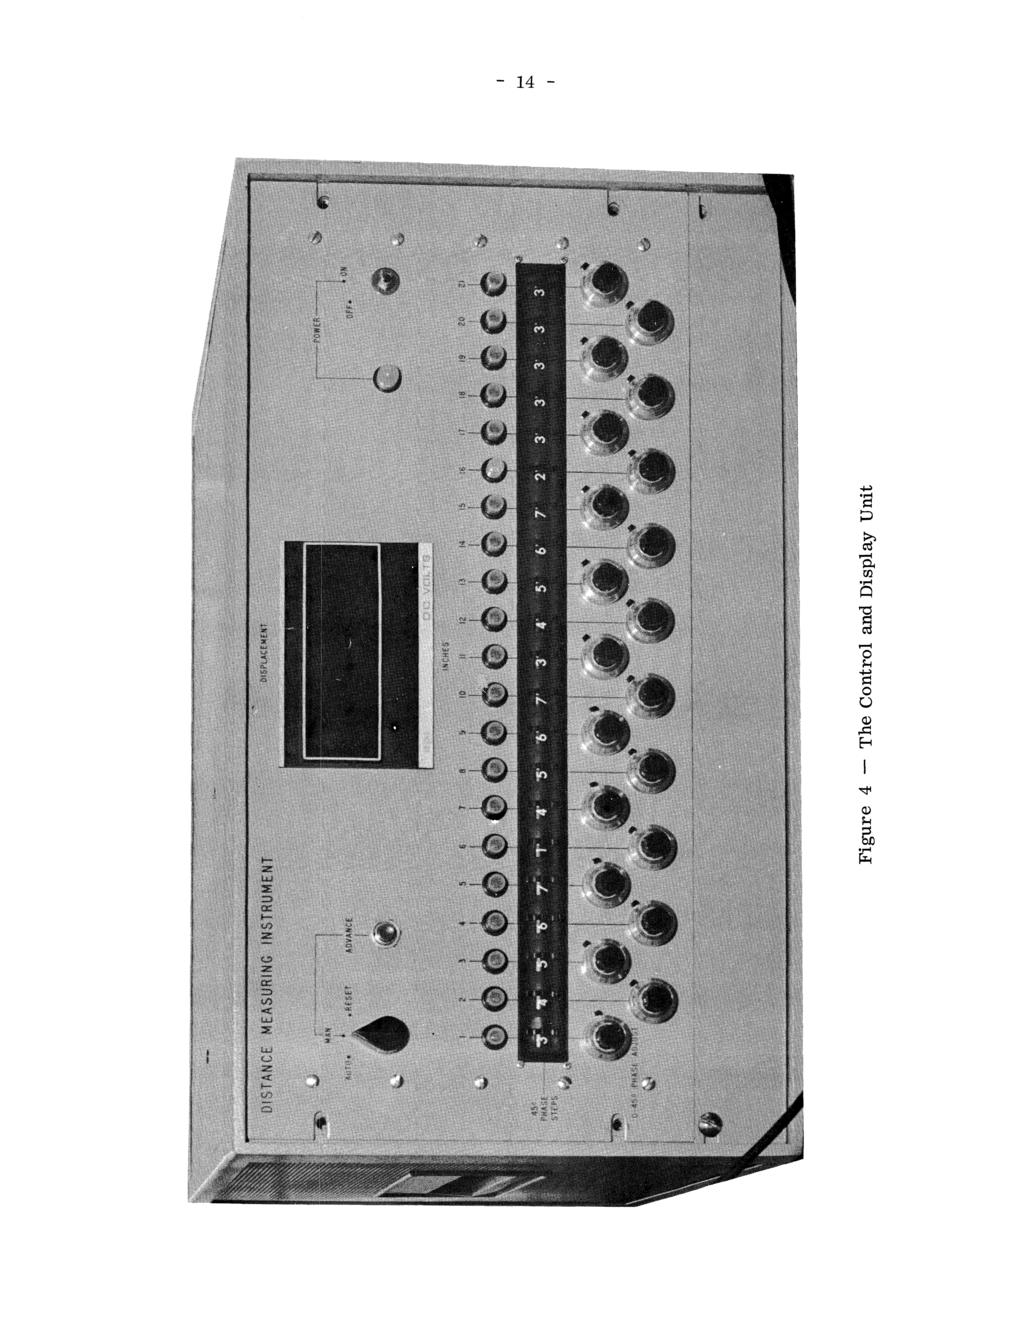
16 Figure 4 The Control and Display Unit vggfakliatnasdlgrnoaaeagteeggggmggmrrgpyjpgogiagitgknnasmisumbmnttglgellptgfllnlpmglpieiiiiiimibpbin,_,
17 3 Ng, meters 10 Figure 5 Layout on the Ground of Measuring Instrument (M) and Transponders (T)
18 =11M a) -c =NI T CARRIAGE POSITION (inches) Figure 6 -- Instrument Reading Plotted Against Carriage Position
19 MM 1-40 N NORTH TRANSPONDER ZENITH ANGLE 80 S mm 3 2 EAST TRANSPONDER 1-0 mm 3 40 N I- ZENITH ANGLE S 2 WEST TRANSPONDER 1 40 N ZENITH ANGLE 80 S 0 ZENITH ANGLE N S _... 8 SOUTH TRANSPONDER Solid line measurements. Dotted line computed values. Figure 7 Distance Changes to Transponders as Zenith Angle Changes at H. A. = 0
20 hrs HOUR ANGLE EAST TRANSPONDER 3 4 NORTH TRANSPONDER hrs HOUR ANGLE hrs HOUR ANGLE WEST TRANSPONDER 4 =MM.. 5 SOUTH TRANSPONDER hrs HOUR ANGLE Figure 8 Distance Changes to Transponders as Hour Angle Changes at a Solid line measurements. Fixed Declination of ' Dotted line computed values.
Microwave Optics. Department of Physics & Astronomy Texas Christian University, Fort Worth, TX. January 16, 2014
 Microwave Optics Department of Physics & Astronomy Texas Christian University, Fort Worth, TX January 16, 2014 1 Introduction Optical phenomena may be studied at microwave frequencies. Visible light has
Experiment 19. Microwave Optics 1
 Experiment 19 Microwave Optics 1 1. Introduction Optical phenomena may be studied at microwave frequencies. Using a three centimeter microwave wavelength transforms the scale of the experiment. Microns
MICROWAVE MICROWAVE TRAINING BENCH COMPONENT SPECIFICATIONS:
 Microwave section consists of Basic Microwave Training Bench, Advance Microwave Training Bench and Microwave Communication Training System. Microwave Training System is used to study all the concepts of
NATIONAL RADIO ASTRONOMY OBSERVATORY Green Bank, West Virginia. Electronics Division Internal Report No 98 ANTENNA MEASURING INSTRUMENT. John M.
 NATIONAL RADIO ASTRONOMY OBSERVATORY Green Bank, West Virginia Electronics Division Internal Report No 98 ANTENNA MEASURING INSTRUMENT John M. Payne NOVEMBER 1970 NUMBER OF COPIES: 150 ANTENNA MEASURING
Holography Transmitter Design Bill Shillue 2000-Oct-03
 Holography Transmitter Design Bill Shillue 2000-Oct-03 Planned Photonic Reference Distribution for Test Interferometer The transmitter for the holography receiver is made up mostly of parts that are already
Exercise 1-3. Radar Antennas EXERCISE OBJECTIVE DISCUSSION OUTLINE DISCUSSION OF FUNDAMENTALS. Antenna types
 Exercise 1-3 Radar Antennas EXERCISE OBJECTIVE When you have completed this exercise, you will be familiar with the role of the antenna in a radar system. You will also be familiar with the intrinsic characteristics
EVLA Memo 105. Phase coherence of the EVLA radio telescope
 EVLA Memo 105 Phase coherence of the EVLA radio telescope Steven Durand, James Jackson, and Keith Morris National Radio Astronomy Observatory, 1003 Lopezville Road, Socorro, NM, USA 87801 ABSTRACT The
KULLIYYAH OF ENGINEERING
 KULLIYYAH OF ENGINEERING DEPARTMENT OF ELECTRICAL & COMPUTER ENGINEERING ANTENNA AND WAVE PROPAGATION LABORATORY (ECE 4103) EXPERIMENT NO 3 RADIATION PATTERN AND GAIN CHARACTERISTICS OF THE DISH (PARABOLIC)
UNIT-3. Electronic Measurements & Instrumentation
 UNIT-3 1. Draw the Block Schematic of AF Wave analyzer and explain its principle and Working? ANS: The wave analyzer consists of a very narrow pass-band filter section which can Be tuned to a particular
PRIME FOCUS FEEDS FOR THE COMPACT RANGE
 PRIME FOCUS FEEDS FOR THE COMPACT RANGE John R. Jones Prime focus fed paraboloidal reflector compact ranges are used to provide plane wave illumination indoors at small range lengths for antenna and radar
Fundamentals Of Commercial Doppler Systems
 Fundamentals Of Commercial Doppler Systems Speed, Motion and Distance Measurements I. Introduction MDT manufactures a large variety of microwave oscillators, transceivers, and other components for the
Exercise 1-4. The Radar Equation EXERCISE OBJECTIVE DISCUSSION OUTLINE DISCUSSION OF FUNDAMENTALS
 Exercise 1-4 The Radar Equation EXERCISE OBJECTIVE When you have completed this exercise, you will be familiar with the different parameters in the radar equation, and with the interaction between these
Lab 12 Microwave Optics.
 b Lab 12 Microwave Optics. CAUTION: The output power of the microwave transmitter is well below standard safety levels. Nevertheless, do not look directly into the microwave horn at close range when the
Signal Flow & Radiometer Equation. Aletha de Witt AVN-Newton Fund/DARA 2018 Observational & Technical Training HartRAO
 Signal Flow & Radiometer Equation Aletha de Witt AVN-Newton Fund/DARA 2018 Observational & Technical Training HartRAO Understanding Radio Waves The meaning of radio waves How radio waves are created -
CHAPTER 5 FINE-TUNING OF AN ECDL WITH AN INTRACAVITY LIQUID CRYSTAL ELEMENT
 CHAPTER 5 FINE-TUNING OF AN ECDL WITH AN INTRACAVITY LIQUID CRYSTAL ELEMENT In this chapter, the experimental results for fine-tuning of the laser wavelength with an intracavity liquid crystal element
The Discussion of this exercise covers the following points:
 Exercise 3-2 Frequency-Modulated CW Radar EXERCISE OBJECTIVE When you have completed this exercise, you will be familiar with FM ranging using frequency-modulated continuous-wave (FM-CW) radar. DISCUSSION
A Method for Gain over Temperature Measurements Using Two Hot Noise Sources
 A Method for Gain over Temperature Measurements Using Two Hot Noise Sources Vince Rodriguez and Charles Osborne MI Technologies: Suwanee, 30024 GA, USA vrodriguez@mitechnologies.com Abstract P Gain over
Amateur Microwave Communications. Ray Perrin VE3FN, VY0AAA April 2010
 Amateur Microwave Communications Ray Perrin VE3FN, VY0AAA April 2010 Introduction Microwaves are the frequencies above 1000 MHz More than 99% of the radio amateur frequency allocation is in the microwave
Antennas and Propagation
 Antennas and Propagation Chapter 5 Introduction An antenna is an electrical conductor or system of conductors Transmission - radiates electromagnetic energy into space Reception - collects electromagnetic
ATCA Antenna Beam Patterns and Aperture Illumination
 1 AT 39.3/116 ATCA Antenna Beam Patterns and Aperture Illumination Jared Cole and Ravi Subrahmanyan July 2002 Detailed here is a method and results from measurements of the beam characteristics of the
10 GHz Microwave Link
 10 GHz Microwave Link Project Project Objectives System System Functionality Testing Testing Procedures Cautions and Warnings Problems Encountered Recommendations Conclusion PROJECT OBJECTIVES Implement
USER OPERATION AND MAINTENANCE MANUAL
 46 Robezu str. LV-1004 Riga Latvia Phone: +371-7-065-100, Fax: +371-7-065-102 Mm-wave Division in St. Petersburg, Russia Phone: +7-812-326-5924, Fax: +7-812-326-1060 USER OPERATION AND MAINTENANCE MANUAL
A LARGE COMBINATION HORIZONTAL AND VERTICAL NEAR FIELD MEASUREMENT FACILITY FOR SATELLITE ANTENNA CHARACTERIZATION
 A LARGE COMBINATION HORIZONTAL AND VERTICAL NEAR FIELD MEASUREMENT FACILITY FOR SATELLITE ANTENNA CHARACTERIZATION John Demas Nearfield Systems Inc. 1330 E. 223rd Street Bldg. 524 Carson, CA 90745 USA
A NEW GENERATION PROGRAMMABLE PHASE/AMPLITUDE MEASUREMENT RECEIVER
 GENERAL A NEW GENERATION PROGRAMMABLE PHASE/AMPLITUDE MEASUREMENT RECEIVER by Charles H. Currie Scientific-Atlanta, Inc. 3845 Pleasantdale Road Atlanta, Georgia 30340 A new generation programmable, phase-amplitude
NATIONAL RADIO ASTRONOMY OBSERVATORY SOCORRO, NEW MEXICO VERY LARGE ARRAY PROJECT VLA ELECTRONICS MEMORANDUM NO. 162
 NATIONAL RADIO ASTRONOMY OBSERVATORY SOCORRO, NEW MEXICO VERY LARGE ARRAY PROJECT VLA ELECTRONICS MEMORANDUM NO. 162 ESTIMATION OF THE ACCURACY OF THE PULSE REFLECTION TEST SET FOR HELIX WAVEGUIDE ATTENUATION
Sub-Millimeter RF Receiver. Sub-Millimeter 19Receiver. balanced using Polarization Vectors. Intrel Service Company
 Sub-Millimeter RF Receiver balanced using Polarization Vectors Intrel Service Company iscmail@intrel.com Sub-Millimeter Week of RF 19Receiver August 2012 Copyright Intrel Service Company 2012 Some Rights
1. Explain how Doppler direction is identified with FMCW radar. Fig Block diagram of FM-CW radar. f b (up) = f r - f d. f b (down) = f r + f d
 = f r - f d. f b (down) = f r + f d") 1. Explain how Doppler direction is identified with FMCW radar. A block diagram illustrating the principle of the FM-CW radar is shown in Fig. 4.1.1 A portion of the transmitter signal acts as the reference
1. Explain how Doppler direction is identified with FMCW radar. A block diagram illustrating the principle of the FM-CW radar is shown in Fig. 4.1.1 A portion of the transmitter signal acts as the reference
Part 1: Standing Waves - Measuring Wavelengths
 Experiment 7 The Microwave experiment Aim: This experiment uses microwaves in order to demonstrate the formation of standing waves, verifying the wavelength λ of the microwaves as well as diffraction from
Noise generators. Spatial Combining of Multiple Microwave Noise Radiators NOISE ARRAY. This article reports on. experiments to increase the
 From April 2008 High Frequency Electronics Copyright 2008 Summit Technical Media LLC Spatial Combining of Multiple Microwave Noise Radiators By Jiri Polivka Spacek Labs Inc. Noise generators This article
Chapter-15. Communication systems -1 mark Questions
 Chapter-15 Communication systems -1 mark Questions 1) What are the three main units of a Communication System? 2) What is meant by Bandwidth of transmission? 3) What is a transducer? Give an example. 4)
List of Figures. Sr. no.
 List of Figures Sr. no. Topic No. Topic 1 1.3.1 Angle Modulation Graphs 11 2 2.1 Resistor 13 3 3.1 Block Diagram of The FM Transmitter 15 4 4.2 Basic Diagram of FM Transmitter 17 5 4.3 Circuit Diagram
Lab Exercise PN: Phase Noise Measurement - 1 -
 Lab Exercise PN: Phase Noise Measurements Phase noise is a critical specification for oscillators used in applications such as Doppler radar and synchronous communications systems. It is tricky to measure
essential requirements is to achieve very high cross-polarization discrimination over a
 INTRODUCTION CHAPTER-1 1.1 BACKGROUND The antennas used for specific applications in satellite communications, remote sensing, radar and radio astronomy have several special requirements. One of the essential
EE 3324 Electromagnetics Laboratory
 EE 3324 Electromagnetics Laboratory Experiment #11 Microwave Systems 1. Objective The objective of Experiment #11 is to investigate microwave systems and associated measurement techniques. A precision
1.6 Beam Wander vs. Image Jitter
 8 Chapter 1 1.6 Beam Wander vs. Image Jitter It is common at this point to look at beam wander and image jitter and ask what differentiates them. Consider a cooperative optical communication system that
Using Frequency Diversity to Improve Measurement Speed Roger Dygert MI Technologies, 1125 Satellite Blvd., Suite 100 Suwanee, GA 30024
 Using Frequency Diversity to Improve Measurement Speed Roger Dygert MI Technologies, 1125 Satellite Blvd., Suite 1 Suwanee, GA 324 ABSTRACT Conventional antenna measurement systems use a multiplexer or
DESCRIPTION OF THE OPERATION AND CALIBRATION OF THE MILLIMETER I/Q PHASE BRIDGE-INTERFEROMETER
 DESCRIPTION OF THE OPERATION AND CALIBRATION OF THE MILLIMETER I/Q PHASE BRIDGE-INTERFEROMETER Overview of Interferometer Operation The block diagram of the I/Q Phase Bridge-Interferometer is shown below
Exercise 4. Angle Tracking Techniques EXERCISE OBJECTIVE
 Exercise 4 Angle Tracking Techniques EXERCISE OBJECTIVE When you have completed this exercise, you will be familiar with the principles of the following angle tracking techniques: lobe switching, conical
JEM/SMILES AOPT EM, Part 2 Bandpass Characteristic and Beam Pattern after Thermal Cycling
 JEM/SMILES AOPT EM, Part 2 Bandpass Characteristic and Beam Pattern after Thermal Cycling Axel Murk Research Report No. 02-4 March 2001 Institute of Applied Physics Dept. of Microwave Physics Sidlerstr.
LRL Model 550B-SS Microwave Training Kit
 MICROWAVES FOR EVERYONE LRL Model 550B-SS Microwave Training Kit Microwave Training Kit 5 Experiments I-95 Industrial Park 651 Winks Lane Bensalem, PA 1900 800.53.399 15.638.1100 3rd edition INITIAL SET-UP
IST IP NOBEL "Next generation Optical network for Broadband European Leadership"
 DBR Tunable Lasers A variation of the DFB laser is the distributed Bragg reflector (DBR) laser. It operates in a similar manner except that the grating, instead of being etched into the gain medium, is
NATIONAL RADIO ASTRONOMY OBSERVATORY Green Bank, West Virginia Electronics Division Internal Report No 76
 NATIONAL RADIO ASTRONOMY OBSERVATORY Green Bank, West Virginia Electronics Division Internal Report No 76 A NOVEL WAY OF BEAM-SWITCHING, PARTICULARLY SUITABLE AT MM WAVELENGTHS N. Albaugh and K. H. Wesseling
7. Experiment K: Wave Propagation
 7. Experiment K: Wave Propagation This laboratory will be based upon observing standing waves in three different ways, through coaxial cables, in free space and in a waveguide. You will also observe some
IF/LO Systems for Single Dish Radio Astronomy Centimeter Wave Receivers
 IF/LO Systems for Single Dish Radio Astronomy Centimeter Wave Receivers Lisa Wray NAIC, Arecibo Observatory Abstract. Radio astronomy receivers designed to detect electromagnetic waves from faint celestial
Copyright 1999 IEEE. Reprinted from IEEE MTT-S International Microwave Symposium 1999
 Copyright 1999 IEEE Reprinted from IEEE MTT-S International Microwave Symposium 1999 This material is posted here with permission of the IEEE. Such permission of the IEEE does not in any way imply IEEE
INDOOR AUTOMATIC F-16 FIRE CONTROL ANTENNA AND RADOME TEST FACILITIES
 INDOOR AUTOMATIC F-16 FIRE CONTROL ANTENNA AND RADOME TEST FACILITIES ABSTRACT by Joseph J. Anderson MI Technologies was selected by the United States Air Force to design and install a complete turn-key
Table of Contents. About SAGE Millimeter, Inc...1 Radar basics and related SAGE Millimeter microwave sensor technologies... 2
 A. INTRODUCTION About SAGE Millimeter, Inc.....1 Radar basics and related SAGE Millimeter microwave sensor technologies... 2 B. OSOCILLATORS (SOL Series) K band mechanically tuned Gunn oscillators......5
Technical Note
 3D RECOflO C Technical Note 1967-47 A. Sotiropoulos X-Band Cylindrical Lens Antenna 26 October 1967 Lincoln Laboratory MAS TTS INSTITUTE OF TECHNOLOGY m Lexington, Massachusetts The work reported in.this
MICROWAVE AND RADAR LAB (EE-322-F) LAB MANUAL VI SEMESTER
 LAB MANUAL VI SEMESTER") 1 MICROWAVE AND RADAR LAB (EE-322-F) MICROWAVE AND RADAR LAB (EE-322-F) LAB MANUAL VI SEMESTER RAO PAHALD SINGH GROUP OF INSTITUTIONS BALANA(MOHINDERGARH)123029 Department Of Electronics and Communication
1 MICROWAVE AND RADAR LAB (EE-322-F) MICROWAVE AND RADAR LAB (EE-322-F) LAB MANUAL VI SEMESTER RAO PAHALD SINGH GROUP OF INSTITUTIONS BALANA(MOHINDERGARH)123029 Department Of Electronics and Communication
Physics 4C Chabot College Scott Hildreth
 Physics 4C Chabot College Scott Hildreth The Inverse Square Law for Light Intensity vs. Distance Using Microwaves Experiment Goals: Experimentally test the inverse square law for light using Microwaves.
GAIN COMPARISON MEASUREMENTS IN SPHERICAL NEAR-FIELD SCANNING
 GAIN COMPARISON MEASUREMENTS IN SPHERICAL NEAR-FIELD SCANNING ABSTRACT by Doren W. Hess and John R. Jones Scientific-Atlanta, Inc. A set of near-field measurements has been performed by combining the methods
Exercise 1: RF Stage, Mixer, and IF Filter
 SSB Reception Analog Communications Exercise 1: RF Stage, Mixer, and IF Filter EXERCISE OBJECTIVE DISCUSSION On the circuit board, you will set up the SSB transmitter to transmit a 1000 khz SSB signal
Millimeter Wave Product Catalogue VivaTech Consulting S.A.R.L.
 VivaTech Consulting S.A.R.L. sales@vivatech.biz Telephone: +33 04 89 01 14 61 Fax: +33 04 93 87 08 66 Table of Contents Millimeter Wave Low Noise Amplifiers VTLNA Series...3 Millimeter Wave Power Amplifiers
MIL-STD-202G METHOD 308 CURRENT-NOISE TEST FOR FIXED RESISTORS
 CURRENT-NOISE TEST FOR FIXED RESISTORS 1. PURPOSE. This resistor noise test method is performed for the purpose of establishing the "noisiness" or "noise quality" of a resistor in order to determine its
Receiver Design for Passive Millimeter Wave (PMMW) Imaging
 Imaging") Introduction Receiver Design for Passive Millimeter Wave (PMMW) Imaging Millimeter Wave Systems, LLC Passive Millimeter Wave (PMMW) sensors are used for remote sensing and security applications. They rely
Introduction Receiver Design for Passive Millimeter Wave (PMMW) Imaging Millimeter Wave Systems, LLC Passive Millimeter Wave (PMMW) sensors are used for remote sensing and security applications. They rely
Optical generation of frequency stable mm-wave radiation using diode laser pumped Nd:YAG lasers
 Optical generation of frequency stable mm-wave radiation using diode laser pumped Nd:YAG lasers T. Day and R. A. Marsland New Focus Inc. 340 Pioneer Way Mountain View CA 94041 (415) 961-2108 R. L. Byer
and GHz. ECE Radiometer. Technical Description and User Manual
 E-mail: sales@elva-1.com http://www.elva-1.com 26.5-40 and 76.5-90 GHz ECE Radiometer Technical Description and User Manual November 2008 Contents 1. Introduction... 3 2. Parameters and specifications...
Levitated Dipole Experiment
 Microwave Interferometer Density Diagnostic for the Levitated Dipole Experiment Columbia University A. Boxer, J. Kesner MIT PSFC M.E. Mauel, D.T. Garnier, A.K. Hansen, Columbia University Presented at
PHASE NOISE MEASUREMENT SYSTEMS
 PHASE NOISE MEASUREMENT SYSTEMS Item Type text; Proceedings Authors Lance, A. L.; Seal, W. D.; Labaar, F. Publisher International Foundation for Telemetering Journal International Telemetering Conference
A NEW WIDEBAND DUAL LINEAR FEED FOR PRIME FOCUS COMPACT RANGES
 A NEW WIDEBAND DUAL LINEAR FEED FOR PRIME FOCUS COMPACT RANGES by Ray Lewis and James H. Cook, Jr. ABSTRACT Performance trade-offs are Investigated between the use of clustered waveguide bandwidth feeds
A TECHNIQUE TO EVALUATE THE IMPACT OF FLEX CABLE PHASE INSTABILITY ON mm-wave PLANAR NEAR-FIELD MEASUREMENT ACCURACIES
 A TECHNIQUE TO EVALUATE THE IMPACT OF FLEX CABLE PHASE INSTABILITY ON mm-wave PLANAR NEAR-FIELD MEASUREMENT ACCURACIES Daniël Janse van Rensburg Nearfield Systems Inc., 133 E, 223rd Street, Bldg. 524,
Technician Licensing Class. Lesson 4. presented by the Arlington Radio Public Service Club Arlington County, Virginia
 Technician Licensing Class Lesson 4 presented by the Arlington Radio Public Service Club Arlington County, Virginia 1 Quiz Sub elements T6 & T7 2 Good Engineering Practice Sub element T8 3 A Basic Station
L- and S-Band Antenna Calibration Using Cass. A or Cyg. A
 L- and S-Band Antenna Calibration Using Cass. A or Cyg. A Item Type text; Proceedings Authors Taylor, Ralph E. Publisher International Foundation for Telemetering Journal International Telemetering Conference
Design considerations for the RF phase reference distribution system for X-ray FEL and TESLA
 Design considerations for the RF phase reference distribution system for X-ray FEL and TESLA Krzysztof Czuba *a, Henning C. Weddig #b a Institute of Electronic Systems, Warsaw University of Technology,
CHAPTER -15. Communication Systems
 CHAPTER -15 Communication Systems COMMUNICATION Communication is the act of transmission and reception of information. COMMUNICATION SYSTEM: A system comprises of transmitter, communication channel and
ANTENNA INTRODUCTION / BASICS
 ANTENNA INTRODUCTION / BASICS RULES OF THUMB: 1. The Gain of an antenna with losses is given by: 2. Gain of rectangular X-Band Aperture G = 1.4 LW L = length of aperture in cm Where: W = width of aperture
Setup of the four-wavelength Doppler lidar system with feedback controlled pulse shaping
 Setup of the four-wavelength Doppler lidar system with feedback controlled pulse shaping Albert Töws and Alfred Kurtz Cologne University of Applied Sciences Steinmüllerallee 1, 51643 Gummersbach, Germany
Lecture Topics. Doppler CW Radar System, FM-CW Radar System, Moving Target Indication Radar System, and Pulsed Doppler Radar System
 Lecture Topics Doppler CW Radar System, FM-CW Radar System, Moving Target Indication Radar System, and Pulsed Doppler Radar System 1 Remember that: An EM wave is a function of both space and time e.g.
Ham Radio Training. Level 1 Technician Level. Presented by Richard Bosch KJ4WBB
 Ham Radio Training Level 1 Technician Level Presented by Richard Bosch KJ4WBB In this chapter, you ll learn about: What is a radio signal The characteristics of radio signals How modulation adds information
Polarization Experiments Using Jones Calculus
 Polarization Experiments Using Jones Calculus Reference http://chaos.swarthmore.edu/courses/physics50_2008/p50_optics/04_polariz_matrices.pdf Theory In Jones calculus, the polarization state of light is
G. Serra.
 G. Serra gserra@oa-cagliari.inaf.it on behalf of Metrology team* *T. Pisanu, S. Poppi, F.Buffa, P. Marongiu, R. Concu, G. Vargiu, P. Bolli, A. Saba, M.Pili, E.Urru Astronomical Observatory of Cagliari
Chapter 3. Instrumentation. 3.1 Telescope Site Layout. 3.2 Telescope Optics
 Chapter 3 Instrumentation 3.1 Telescope Site Layout The 12m is located on the southwest ridge of Kitt Peak, about two miles below the top of the mountain. Other telescopes on the southwest ridge are the
4GHz / 6GHz Radiation Measurement System
 4GHz / 6GHz Radiation Measurement System The MegiQ Radiation Measurement System (RMS) is a compact test system that performs 3-axis radiation pattern measurement in non-anechoic spaces. With a frequency
Installation and Characterization of the Advanced LIGO 200 Watt PSL
 Installation and Characterization of the Advanced LIGO 200 Watt PSL Nicholas Langellier Mentor: Benno Willke Background and Motivation Albert Einstein's published his General Theory of Relativity in 1916,
(Refer Slide Time: 2:45)
") Millimeter Wave Technology. Professor Minal Kanti Mandal. Department of Electronics and Electrical Communication Engineering. Indian Institute of Technology, Kharagpur. Lecture-01. Introduction to Millimeter-Wave
Millimeter Wave Technology. Professor Minal Kanti Mandal. Department of Electronics and Electrical Communication Engineering. Indian Institute of Technology, Kharagpur. Lecture-01. Introduction to Millimeter-Wave
Tilted Beam Measurement of VLBI Receiver for the South Pole Telescope
 Tilted Beam Measurement of VLBI Receiver for the South Pole Telescope Junhan Kim * and Daniel P. Marrone Department of Astronomy and Steward Observatory University of Arizona Tucson AZ 8572 USA *Contact:
Aberrations of a lens
 Aberrations of a lens 1. What are aberrations? A lens made of a uniform glass with spherical surfaces cannot form perfect images. Spherical aberration is a prominent image defect for a point source on
Antennas and Propagation
 Mobile Networks Module D-1 Antennas and Propagation 1. Introduction 2. Propagation modes 3. Line-of-sight transmission 4. Fading Slides adapted from Stallings, Wireless Communications & Networks, Second
Dinesh Micro Waves & Electronics
 MICROWAVE TRAINING KITS Dinesh Microwaves and Electronics manufacturers of three centimeter waveguidetraining system to provide users an in depth training on microwave waveguide device. The training kit
ELEC4604. RF Electronics. Experiment 2
 ELEC4604 RF Electronics Experiment MICROWAVE MEASUREMENT TECHNIQUES 1. Introduction and Objectives In designing the RF front end of a microwave communication system it is important to appreciate that the
To print higher-resolution math symbols, click the Hi-Res Fonts for Printing button on the jsmath control panel.
 To print higher-resolution math symbols, click the Hi-Res Fonts for Printing button on the jsmath control panel. Radiometers Natural radio emission from the cosmic microwave background, discrete astronomical
DIGITAL BEAM-FORMING ANTENNA OPTIMIZATION FOR REFLECTOR BASED SPACE DEBRIS RADAR SYSTEM
 DIGITAL BEAM-FORMING ANTENNA OPTIMIZATION FOR REFLECTOR BASED SPACE DEBRIS RADAR SYSTEM A. Patyuchenko, M. Younis, G. Krieger German Aerospace Center (DLR), Microwaves and Radar Institute, Muenchner Strasse
Aperture Efficiency of Integrated-Circuit Horn Antennas
 First International Symposium on Space Terahertz Technology Page 169 Aperture Efficiency of Integrated-Circuit Horn Antennas Yong Guo, Karen Lee, Philip Stimson Kent Potter, David Rutledge Division of
J/K). Nikolova
. Nikolova") Lecture 7: ntenna Noise Temperature and System Signal-to-Noise Ratio (Noise temperature. ntenna noise temperature. System noise temperature. Minimum detectable temperature. System signal-to-noise ratio.)
Lecture 7: ntenna Noise Temperature and System Signal-to-Noise Ratio (Noise temperature. ntenna noise temperature. System noise temperature. Minimum detectable temperature. System signal-to-noise ratio.)
CHAPTER 5 PRINTED FLARED DIPOLE ANTENNA
 CHAPTER 5 PRINTED FLARED DIPOLE ANTENNA 5.1 INTRODUCTION This chapter deals with the design of L-band printed dipole antenna (operating frequency of 1060 MHz). A study is carried out to obtain 40 % impedance
Frequency-Modulated Continuous-Wave Radar (FM-CW Radar)
") Frequency-Modulated Continuous-Wave Radar (FM-CW Radar) FM-CW radar (Frequency-Modulated Continuous Wave radar = FMCW radar) is a special type of radar sensor which radiates continuous transmission power
Frequency-Modulated Continuous-Wave Radar (FM-CW Radar) FM-CW radar (Frequency-Modulated Continuous Wave radar = FMCW radar) is a special type of radar sensor which radiates continuous transmission power
Symmetry in the Ka-band Correlation Receiver s Input Circuit and Spectral Baseline Structure NRAO GBT Memo 248 June 7, 2007
 Symmetry in the Ka-band Correlation Receiver s Input Circuit and Spectral Baseline Structure NRAO GBT Memo 248 June 7, 2007 A. Harris a,b, S. Zonak a, G. Watts c a University of Maryland; b Visiting Scientist,
Exercise 6. Range and Angle Tracking Performance (Radar-Dependent Errors) EXERCISE OBJECTIVE
 EXERCISE OBJECTIVE") Exercise 6 Range and Angle Tracking Performance EXERCISE OBJECTIVE When you have completed this exercise, you will be familiar with the radardependent sources of error which limit range and angle tracking
Exercise 6 Range and Angle Tracking Performance EXERCISE OBJECTIVE When you have completed this exercise, you will be familiar with the radardependent sources of error which limit range and angle tracking
 1. COMMUNICATION 10. COMMUNICATION SYSTEMS GIST The sending and receiving of message from one place to another is called communication. Two important forms of communication systems are (i) Analog and (ii)
CHAPTER 2 MICROSTRIP REFLECTARRAY ANTENNA AND PERFORMANCE EVALUATION
 43 CHAPTER 2 MICROSTRIP REFLECTARRAY ANTENNA AND PERFORMANCE EVALUATION 2.1 INTRODUCTION This work begins with design of reflectarrays with conventional patches as unit cells for operation at Ku Band in
Microwave Circuit Design and Measurements Lab. INTRODUCTION TO MICROWAVE MEASUREMENTS: DETECTION OF RF POWER AND STANDING WAVES Lab #2
 EE 458/558 Microwave Circuit Design and Measurements Lab INTRODUCTION TO MICROWAVE MEASUREMENTS: DETECTION OF RF POWER AND STANDING WAVES Lab #2 The purpose of this lab is to gain a basic understanding
 free Online GATE coaching www.egate.ws Online IES coaching for free I.E.S-(Conv.)-2000 ELECTRONICS AND TELECOMMUNICATION ENGINEERING PAPER - II Candidates should attempt question no. 1 which is compulsory
Session2 Antennas and Propagation
 Wireless Communication Presented by Dr. Mahmoud Daneshvar Session2 Antennas and Propagation 1. Introduction Types of Anttenas Free space Propagation 2. Propagation modes 3. Transmission Problems 4. Fading
PRODUCT CATALOG MICROWAVE & MILLIMETER WAVE COMPONENTS & SUB-ASSEMBLIES 5 TO 325 GHZ
 PRODUCT CATALOG MICROWAVE & MILLIMETER WAVE COMPONENTS & SUB-ASSEMBLIES AMPLIFIERS ANTENNAS CONTROL COMPONENTS UP/DOWN CONVERTERS FERRITE COMPONENTS WAVEGUIDE COMPONENTS SUB-ASSEMBLIES GUNN OSCILLATORS
NTT DOCOMO Technical Journal. Method for Measuring Base Station Antenna Radiation Characteristics in Anechoic Chamber. 1.
 Base Station Antenna Directivity Gain Method for Measuring Base Station Antenna Radiation Characteristics in Anechoic Chamber Base station antennas tend to be long compared to the wavelengths at which
Experiment-4 Study of the characteristics of the Klystron tube
 Experiment-4 Study of the characteristics of the Klystron tube OBJECTIVE To study the characteristics of the reflex Klystron tube and to determine the its electronic tuning range EQUIPMENTS Klystron power
PHYS2090 OPTICAL PHYSICS Laboratory Microwaves
 PHYS2090 OPTICAL PHYSICS Laboratory Microwaves Reference Hecht, Optics, (Addison-Wesley) 1. Introduction Interference and diffraction are commonly observed in the optical regime. As wave-particle duality
Experiment 12: Microwaves
 MASSACHUSETTS INSTITUTE OF TECHNOLOGY Department of Physics 8.02 Spring 2005 OBJECTIVES Experiment 12: Microwaves To observe the polarization and angular dependence of radiation from a microwave generator
MAHAVEER INSTITUTE OF SCIENCE & TECHNOLOGY. Microwave and Digital Communications Lab. Department Of Electronics and Communication Engineering
 MAHAVEER INSTITUTE OF SCIENCE & TECHNOLOGY Microwave and Digital Communications Lab Department Of Electronics and Communication Engineering MICROWAVE ENGINEERING LAB List of Experiments: 1.Reflex Klystron
MULTI-CHANNEL CARS BAND DISTRIBUTION USING STANDARD FM MICROWAVE EQUIPMENT. Presented By
 608 MULTI-CHANNEL CARS BAND DISTRIBUTION USING STANDARD FM MICROWAVE EQUIPMENT Presented By Terry R. Spearen, Manager of Systems Engineering Communication Equipment Division MICROWAVE ASSOCIATES, INC.