Ultra Wideband Synthetic Aperture Radar Imaging Data Acquisition & Antenna Analysis
|
|
|
- Jayson Wilson
- 5 years ago
- Views:
Transcription


1 Ultra Wideband Synthetic Aperture Radar Imaging Data Acquisition & Antenna Analysis R. Arriëns T.T. Wieffering Technische Universiteit Delft
2 Ultra Wideband Synthetic Aperture Radar Imaging Data Acquisition & Antenna Analysis by R. Arriëns T.T. Wieffering in partial fulfillment of the requirements for the degree of Bachelor of Science in Electrical Engineering at the Delft University of Technology, to be defended on Wednesday July 5, Supervisor: Ir. P. Aubry Thesis committee: Dr. ir. B. Kooij, TU Delft Ir. P. Aubry, TU Delft Dr. D. Cavallo, TU Delft
3 Abstract A system has been developed that utilises the techniques of Ultra Wideband and Synthetic Aperture Radar to produce top view images of a scene using measurements from the side. The system consists of the PulsON P410 radar module, a set of antennas, a moving platform and an imaging algorithm. This thesis will cover all the aspects of the data acquisition part of the system with additionally an analysis on antennas. The other two subsystems concern the moving platform and imaging algorithm and may be found in respectively [1] and [2]. R. Arriëns T.T. Wieffering Delft, June 2017 i
4 Contents List of Abbreviations 1 Introduction Fundamental Principles Problem Definition Structure of this Thesis Programme of Requirements Global System Requirements Sub-system Requirements Design Process Data Acquisition Configuration The Trade-Off Delay Range Resolution and Spatial Sampling Determining the Position Antenna Analysis Antennas used in Practise Available Antennas SAR and Antenna Beamwidth Antenna Parameters Conclusion Prototype Implementation and Results Validation Prototype Implementation Results Validation Data Acquisition Antenna Choice Discussion 21 6 Conclusion 22 A Appendix 23 A.1 Radiation Patterns A.2 Frequency Dependent Radiation Patterns A.3 Requirements Checklist Bibliography 26 iii ii
5 List of Abbreviations API EM FF PC PII PRF PulsOn P410 SAR SNR TEM UWB Application Programming Interface Electromagnetic Fidelity factor Personal Computer Pulse Integration Index Pulse Repetition Frequency A radar module created by Time Domain Synthetic Aperture Radar Signal-to-Noise Ratio Transverse Electromagnetic Ultra Wideband iii
6 1 Introduction In general there s a wide range of techniques available to generate images using (non-)electromagnetic radiation other than the visible spectrum. One such a technique employs millimetre-wave imaging using an array of antennas [3]. At close range the developed system easily penetrates clothing resulting in high resolution (in the order of a few millimetres) images of the human body. Even higher resolution (< 1 mm) may be obtained with smaller wavelengths in the Terahertz-ranges [4], at the cost of penetration depth [5]. Alternatively they may be employed on larger ranges (> 5 m), as in [6, 7] in so called stand-off imaging. This thesis, however, concerns itself with lower frequencies, and it resolves around the endeavour of creating images using an Ultra Wideband (UWB) radar module in combination with Synthetic Aperture Radar (SAR). Similar techniques have been applied in [8] to detect concealed weapons; the obtained resolution is worse as with Terahertz and millimetre imaging, but sufficient. Also, at comparable bandwidth and centre frequencies, Oloumi et al. [9] describe it use for the detection of oil wells. Other applications involve through wall imaging, as in [10]. Traditionally SAR is also used in large scale applications, for example on satellites [11 13] (and even space shuttles [14]). These satellites use SAR to monitor the earth s surface, environment and the surface of other planets or moons. The advantage of the UWB SAR technique that is described here is, as pointed out in [8], the limited costs in comparison with millimetre and Terahertz imaging. This would potentially allow applying the imaging technique in more everyday products. Where the main focus of this thesis is on the imaging itself, the idea of applying this in the real world will be present in the background. In this introduction, first the fundamental principles are laid out. In the next section the exact problem will be defined. Finally a description of the structure of the thesis will be given Fundamental Principles The fundamental principles and technology which the project resolves around are explained here. Radar At its core it is all an application of radar; thus meaning it will involve the transmission and reception of electromagnetic signals, as depicted in fig The distance to objects in the scene of interest may be found by looking at the time it takes before the reflections of a transmitted pulse return to the receiver. This principle allows rudimentary mapping of the environment, making it suitable for the imaging application that is sought for. Tx Rx Figure 1.1: A schematic overview of the radar principle. Tx meaning transmitter and Rx meaning receiver. 1
7 1.1. Fundamental Principles 2 Ultra Wideband (UWB) The pulses that are transmitted may be very short and thus Ultra Wideband in the frequency domain, that is. The advantage being that shorter pulses allow higher resolution, because objects may be closer together before the reflecting pulses are overlapping, which would make the objects indistinguishable. Synthetic Aperture Radar (SAR) One radar measurement only allows calculating the distance to an object, not necessarily its exact location. Instead, in SAR multiple measurements are performed on different locations. Essentially creating a larger synthetic aperture which allows more accurate localisation, or equivalently: imaging with higher resolution. The image is created using a SAR algorithm, which in its simplest form may work as depicted in fig In general there are two ways the synthetic aperture may be created: using an array of antennas or using a moving platform. (a) (b) Figure 1.2: Reflections are measured at a certain range, depicted by the coloured band (a). Using multiple measurements an image may be formed of the measured object (b). The PulsON P410 The supplied hardware is the Time Domain PulsON P410, a coherent, Ultra Wideband, radar module [15]. Instead of one pulse per scan it transmits a burst of pulses, which are then coherently integrated (the phase information is preserved) to obtain the data of one scan. It should be noted that even though it s an coherent radar module, just the amplitude of the signal not its phase is available. The Setup Throughout this thesis it is assumed a platform exists which allows moving the radar. Such a setup is depicted in fig Measurements are performed along the rail; the imaged plane is parallel to the floor. Tx Rx Radar Module Rail Moving Platform Figure 1.3: A schematic overview of the setup: a moving platform and radar module with antenna s.
8 1.2. Problem Definition Problem Definition As stated, the main goal is to develop a system which is able to create an image using the principles of UWB SAR. In the background its practical application is thought of as improving the localisation and navigation of cars, specified in more detail in chapter 2. In order to achieve this the system must be capable of carrying out several tasks: 1. The system has to be able to move and keep track of at which position each measurement is taken. 2. The system must be capable of sending electromagnetic signals and receive their reflections. 3. The signals that are received have to be processed into an image. These tasks have been divided, respectively, over the groups as specified in fig This thesis concerns the Data Acquisition and as such will focus on sending out and receiving the electromagnetic signals. The goal is to use the implementation of the Hardware group [1], to move the platform and make the measured data available to the Imaging group [2] for further processing. Hardware Group Data Acquisition Group Imaging Group Figure 1.4: System break-down Structure of this Thesis The thesis is divided into several chapters. Evidently, the first is this introduction. The second chapter will discuss the global requirements for the whole system and the requirements on the Data Acquisition sub-system. The third chapter will dive into the design process and the design choices that were made over the course of the project. The fourth chapter will briefly discuss how the implementation of the design works and then the results of the implementation will be reviewed and validated. The last two chapters are dedicated for discussing the results of the project and some recommendations for the future.
9 2 Programme of Requirements This chapter will discuss the different technical requirements for the whole system and for the Data Acquisition subsystem. The goal of this project is to use SAR-techniques to improve the localisation and navigation of cars. The idea behind this is that antennas mounted on the cars can be used to do multiple subsequent measurements. The data of these measurements can then be used to generate an image that represents the environment. This image can then be compared with a database of known images to determine up to higher resolution where a car is. The newly scanned images can also be used to update the database and thus obtain semi real-time information about the road system. These last two points fall outside the scope of this project. The focus of this project is the generation of the SAR-images Global System Requirements The requirements for the entire system can be divided in several parts. The functional requirements are the requirements that describe what the system must do and what is fundamentally important when doing this. These are as follows: [1.1] The system should be able to do multiple subsequent measurements. [1.2] The data of these measurements should be converted into an image that represents the scanned environment. [1.3] The system should be able to detect reflections within distances that are common in road environments. This means that the transmitted power and the measurement repetition frequency should be adequate. [1.4] The system should be scalable to larger datasets. [1.5] The resolution of the system should be high enough to be able to distinguish objects in a normal road environment. These objects could be buildings, fences, lamp posts or landmarks. The implementation requirements are requirements that make the system easier to use in real applications. They are as follows: [2.1] The needed hardware should be easy to implement in an actual vehicle. [2.2] The image formation should be done semi real-time. This means that the time required to make the image should be smaller or in the same order as the time it takes to do the measurements. The representation requirements are boundary conditions that are important to facilitate functional use of the system. They are as follows: [3.1] The produced image should be easily understandable by humans and should be usable for comparison with a larger dataset. The safety requirements indicate how safe the system should be. They are as follows: [4.1] The radiated power should be of such a level that there are no health dangers for people in the proximity of the antennas. 4
10 2.2. Sub-system Requirements Sub-system Requirements The subsystem discussed in this thesis has the task of sending out the electromagnetic waves, by means of a radar module an a set of antennas, and receive the reflections of the send out EM waves. The different requirements are defined into three different types: functional requirements, development requirements and system requirements. The functional requirements describes the characteristics of the sub-system and how it will operate. The following requirements have been formulated: [5.1] The application should indicate its status and general progress during operation. [5.2] The application should allow manual configuration of the measurement; at least adjustable should be: the scan ranges and the spatial sampling 1. The development requirements specify which tools, device and supporting equipment are required to develop the sub-system: [6.1] The application should be developed in full in Matlab. [6.2] The used radar module should be a Time Domain PulsON P410. The system requirements indicates the sub-system s functions and performance. [7.1] The application should be able to configure the radar module. [7.2] The application should be able to retrieve the scan data from the radar module. [7.3] The application should be able to interface with a moving platform. [7.4] The application should be able to perform requirements [7.2] and [7.3] in semi-parallel. [7.5] The scan data should be readily available with its corresponding ranges for further processing. [7.6] The antennas should be adequate for use with the radar module, meaning it should at the very least be able to operate between 3.1 and 5.3 GHz [15]. 1 An adjustable spatial sampling meaning here that the distance between two subsequent scans should be variable.
11 3 Design Process This chapter will discuss the main design choices that were made for the Data Acquisition sub-system. The chapter is divided into two parts: one part on the data acquisition process, where the focuses is on the radar module, and an analysis on two types of antennas Data Acquisition This section discusses the steps necessary to acquire scan data using the radar module. One part of the end product should be able to communicate with the device, such that the configuration may be changed and the scan data read. The Application Programming Interface (API), as specified in [16], allows this by sending messages to the device, either over serial or USB. The latter will be used for convenience. Its implementation will be discussed in more detail in section 4.1. This section explores the configuration and specifications of the radar module, such that the requirements in chapter 2 may be met Configuration The PulsON allows different configurations. The settings of interest are discussed here. A few of them are schematically explained in fig PII pulses PRF -1 Scan Interval Figure 3.1: A schematic explanation of the Pulse Integration Index (PII), the scan interval and the Pulse Repetition Frequency (PRF). Pulse Integration Index (PII) To make one scan the radar module sends out multiple short pulses. The amount of pulses transmitted per scan is determined by the PII, as shown in fig Increasing the PII will increase the SNR, as the device is coherent, i.e. the phase information is preserved [15]. Using the following relation [17], SNR N = N SNR I = 2 PII SNR I (3.1) where SNR N is the SNR of a signal consisting of N integrated samples which have an individual SNR of SNR I, it may be concluded that by increasing the PII by one, the overall SNR is increased by about 3 db. In practice this will look like as given in fig From minimum PII to maximum PII, the amplitude of the actual signal is increased much more than the noise level. This may be clearly observed in the first 10 ns. It is 6
12 3.1. Data Acquisition 7 Amplitude 10 4 Data captured with PII = Overlay (Normalized) PII = 6 PII = 15 Amplitude t [ns] Data captured with PII = t [ns] (a) Amplitude t [ns] (b) Figure 3.2: The data captured with the Pulse Integration Index (PII) at its minimum (a, top) and at its maximum (a, bottom). Furthermore: a normalized overlay of two (b). The setup includes a reflecting metal plate (visible at t 35 ns) and TEMhorns as antennas Scan Interval [ms] Pulse Integration Index Figure 3.3: The influence of the Pulse Integration Index (PII) on the minimum scan interval. At the minimum scan interval given it was possible to uninterruptedly perform 50 scans. N.B. the result as shown here may be somewhat setup dependent. interesting to note that the signal after these first nanoseconds does not change significantly. Clearly, at short ranges (a few meters) the received signal is sufficiently strong and such a high SNR is not necessary. The relation between range and SNR will be discussed in more detail in section Scan Interval The distance between two scans along the track is determined by the velocity of the radar module and the scan interval. In general there may be constraints on this spacing. As such the interesting question is how low the scan interval may be, but also what a reasonable value is. The boundaries are determined by the system as a whole: the radar module, the PC and the link between the two. It is not deemed useful to find out what the bottleneck is, instead the minimum values are experimentally determined. The results are shown in fig. 3.3, from which it may be concluded that the current setup allows about 10 to 50 scans per second. The minimum scan interval increases as the PII goes up, which is expected because more pulses are send out. However, the growth is not exactly 2 PII. Per scan there s an offset in the order of 10 ms and about 3 µs of processing time per pulse. The latter is actually quite a lot, as one pulse period (PRF 1, see fig. 3.1) of the radar module is only about 100 ns [15]. Below PII = 10, the effect is negligible as this totals up to less than a millisecond. This no longer holds for larger PII, meaning that it might be interesting to lower the PII, in favour of a lower scan interval.
13 3.1. Data Acquisition 8 Table 3.1: Measured delays and calculated minimum range with different setups. Antenna Delay R min Omnidirectional 10 ns 1.4 m Vivaldi 10 ns 1.1 m TEM horn 15 ns 1.9 m Gain-setting The power transmitted may be changed by changing the gain-setting of the radar module. As the SNR increases with higher transmitted power the gain-setting will be set to the maximal value. One point of attention here is clipping. When rather reflective objects, close to the antenna, are imaged the returned signal may be too large. When this is the case, less power could be transmitted. Other settings may be changed, but those are not particularly interesting. One being the channel at which the PulsON broadcasts. This may relate to the Pulse Repetition Frequency (see fig. 3.1), but brief measurements showed no correlation between different channels and the minimum scan interval. As such it will not be investigated any further The Trade-Off As described above, increasing the PII may increase the SNR at the cost of less scans per second. It seems however that the end product, the final images, may benefit more from a more densely spaced synthetic aperture, than they would from the increased SNR, as the waveforms itself are hardly changed. It would only matter for the first 10 ns, but those may be removed without any consequences as will become clear in section However, lowering the scan interval to the lowest possible according to the measurement in figure fig. 3.3 is not necessarily a good idea. A lower scan interval will increase the risk of hiccups at the side of the PC. It is deemed unwanted to miss a scan, even though the problem solves itself in a way, because at smaller scan intervals missing a scan is not as destructive. In practice the risk is rather limited. One should think in the orders of 1/1000 at PII = 11 and scan interval set to 25 ms. The boundaries may be pushed depending on its necessity for the application, but safe and reasonable levels are ms with the PII around 11. It will be verified in section whether this level is sufficient to satisfy the requirements Delay When the data is captured using the PulsON a delay is present. This may be observed in fig It takes about 10 ns longer than would be expected in case it is assumed that the first data sample corresponds with the pulse being transmitted. This delay may be easily compensated for, but is an important step, because the signal processing part may depend upon it. Typically the delay would be dependent on the setup. In part it would be due to the radar module, as it may take some time before the data is actually processed, but it may also vary between antennas (and how they are connected). As such the delay has been measured with a a few setups with different antennas that may be used, see table Range As may also be observed in fig. 3.4 the first nanoseconds of the measurement, up to a certain t min, a large disturbance, caused by the switching from transmit to receive antenna [18], prevents any meaningful measurements. Thus introducing a minimum scan range. Thanks to the delay, this is somewhat limited. For the omnidirectional antenna holds: R min = t min c m (3.2) Where t min = t min t delay (used are t min 19 ns and t delay 10 ns) and c the propagation velocity of light. The other setups result in similar values, as given in table 3.1. The maximal range may be limited by the chosen scan interval, as all reflections should be back before the next scan is performed. But even a few ms allows looking further than is applicable. The main limitation of
14 3.1. Data Acquisition Data (316 cm) Expected position Actual position Amplitude Delay: 9.9 ns t [ns] Figure 3.4: Data captured with a metal plate at a distance of 316 cm. The lines illustrate where the (beginning of the) pulse was expected to be and where it was actually found. Between these positions is a delay of about 10 ns. Omnidirectional antennas were used. the system will be that the SNR drops below usable. This depends on the used antennas and will be studied in section Resolution and Spatial Sampling When two pulses overlap they may no longer be identified as separate pulses. From this the down-range (i.e. perpendicular to the track) resolution may be approximated [8]: δ r = c 6.8 cm (3.3) 2B As the bandwidth, B, cannot be changed, the down-range resolution should be interpreted as a given value. Looking at requirement [1.5], it may be concluded that this value should suffice, as typical objects in a road environment would be larger. The cross-range (along the track) resolution is more involved and depends on how well the measured data is translated into an image. Additionally, as stated before, no phase information is available. As such the obtained cross-range resolution might be different from the traditional obtained one, which is half of the actual antenna length [19]. Instead a more intuitive way of looking at the cross-range resolution is given. As is shown in section 3.1.5(a) the area where a certain object may be is decreased, i.e. the striped area would decrease, when the spatial sampling along the aperture is increased. From this it may be expected that the crossrange resolution is at least in some way dependent on the spatial sampling. This spacing on the aperture should satisfy certain constraints to avoid that certain parts are not visible, as depicted in section 3.1.5(b). However, this is a rather relaxed constrained. Taking the beamwidth 60 (as approximately for a TEM-horn, discussed in section 3.2.4) allows x = R. In section it s explained that in the current setup R min > 1 m demanding only: x < 1 m. With the assumption that most target objects have widths and depths of the same order, it may be regarded as sufficient to make the cross-range resolution equal, or smaller than the down-range resolution. Then it may be expected that it will be hard to achieve centimetre resolution with spatial sampling of a meter. To avoid failing any yet unknown conditions, the following guideline is formulated with respect to the spatial sampling: The spatial sampling will be set to as little as reasonably possible and in the order of a few centimetres Determining the Position The signal processing part depends on the locations where the scans were performed. Depending on whether the scan is performed in a discrete or continuous way this is respectively, rather straightforward or somewhat more challenging. Discrete meaning that the following process is iterated: make a scan, move radar module, make a scan, move radar module, etc. In this case the radar module has stopped when it makes a scan, where in the continuous way
15 3.1. Data Acquisition 10 R min Δx (a) Δx (b) Figure 3.5: The area where the object may be located (striped) decreases as the spatial sampling is increased (i.e. x is made smaller) (a), and a small antenna beamwidth may introduce non-visible parts (striped) below R min (b). x is the distance between two subsequent scans. it is moving. In the first case the position of the radar module is exactly known, because the scan is performed only after the platform that moves it has stopped. The advantage of measuring continuously is that it is faster and more practical. Additionally it is less stressful for the hardware that is moving the radar module. The position may be calculated, but only accurately if the moving platform is moving with an accurately known and constant speed. For the prototype it will assumed that this is the case.

![Antennas used in Practise A variety of antennas is used within SAR imaging. In [9] an application is done using TEM (Transverse Electromagnetic) horn antennas, to monitor oil wells.](/docs-images/96/128699043/images/16-1.jpg "It is also possible to design an antenna, which is optimised for its application, like is done in [20")
16 3.2. Antenna Analysis Antenna Analysis This section will dive into the process of choosing an antenna for the UWB SAR imaging application. Since designing an antenna is outside the scope of the project, available antennas will be analysed based on their specification and performance Antennas used in Practise A variety of antennas is used within SAR imaging. In [9] an application is done using TEM (Transverse Electromagnetic) horn antennas, to monitor oil wells. It is also possible to design an antenna, which is optimised for its application, like is done in [20]. A common used structure of antennas are arrays 1, e.g. [8, 21] Available Antennas The PulsON P410 radar module was supplied with a set of omnidirectional antennas [22]. As discussed earlier, omnidirectional antennas are not desired, since omnidirectional antennas radiate power in all directions. Fortunately the Microwave Sensing research group of the TU Delft could supply two other types of antennas. The first type of antenna is a Vivaldi antenna, which is shown in fig. 3.6, by the design of [23]. The other antenna is a TEM horn antenna [24, 25], shown in fig These two antennas have to be compared and evaluated in order to determine which one is most suited for the application discussed here. Figure 3.6: The Vivaldi antennas Figure 3.7: The TEM horn antenna SAR and Antenna Beamwidth As described in [26, chap. 12] the results obtained by the use of SAR can be enhanced by using the fact that the radar module is moving. The resulting Doppler shift allows to differentiate between smaller bins in the beam of the antenna. In contrary to real aperture imaging a larger beamwidth (i.e. the width of the main lobe of the antenna) makes the resolution better instead of worse, because the larger beamwidth allows a longer observation time of the Doppler shift, or equivalently: a larger synthetic aperture. As the transmitted power is distributed over a larger area the SNR will decrease. At this point it would be possible to optimise between beamwidth and SNR. However, there may be two issues with employing the Doppler shift in the application discussed here. First, the radar module only supplies the amplitude of the received signal, not its phase. It may be (more) difficult to utilise the Doppler shift without phase information. Furthermore, the velocity of the platform may not be sufficient to create a usable Doppler shift. As it is not the scope of this thesis to study the validity of these statements, it will be assumed that the Doppler shift is not applicable and will not be used. This allows, instead of looking for an optimal beamwidth, to formulate the following hypothesis: A more directive antenna is more suitable for imaging in accordance with the requirements in chapter 2. This thought would be supported by the fact of it resulting in a higher SNR (discussed in more detail in section 3.2.5). Additionally it should result in less sensitivity to multipath reflections, because objects are in the beam of the antenna for a shorter time. This may be illustrated by the thought of an antenna mounted above a floor, which should image a certain object in front of it. If it doesn t see the floor, reflections bouncing from the object via the floor won t disturb the created image. A point of attention here is that at small beamwidths there may be additional constraints on the spacing along the synthetic aperture. However, as was discussed in section 3.1.5, this is a rather relaxed constraint. 1 Arrays are multiple smaller antennas, placed into a certain pattern, which if placed right, increases the directivity and overall gain.
17 3.2. Antenna Analysis 12 Based on this hypothesis the antennas will be compared. The omnidirectional antennas supplied with the PulsON P410 radar module will not be studied in detail, as they won t be sufficient for the imaging application if the assumptions made here are valid. Power will be radiated in all directions, also those that are not of interest: behind the antenna. Instead, the omnidirectional antennas will be used to verify the hypothesis stated here, in chapter 4. Other parameters will be studied to find out whether they may be of importance for the finally obtained image Antenna Parameters Bandwidth The bandwidth of the signal and therefore the bandwidth of the antennas influences the range resolution, see eq. (3.3). This shows that the higher the bandwidth of the signal the better (smaller) the range resolution will be. Here an infinite bandwidth (in the time domain, a delta-pulse signal) is ideal. However the PulsON P410 radar module operates between 3.1 and 5.3 GHz [15], thus it has a limited bandwidth of 2.2 GHz. One requirement for the antennas is then: they should operate between GHz. Both antenna are suited for UWB applications as specified by the manufacturers. The Vivaldi antenna operates in the frequency band 2.7 to 35 GHz ([23]). The TEM horn operates at the frequency band 2 to 26 GHz ([24]). At first sight, the operational bandwidth would be fitting with the radar module. However, in both cases they are on the lower end of their spectrum. To find out what the performance of these antennas is within the used frequency band other parameters will be studied. Reflection Coefficient One of these other parameters is the reflection coefficient. It shows how much of the power that is supplied to the system (the antenna) reflects back due to impedance mismatches between the system and the energy source (the radar module). The fraction of power that gets reflected back is given in eq. (3.4). Here P r is the power that is reflected back, P i is the incident power, Γ is the reflection coefficient and ϝ is the ratio between the reflected power and the incident power. ( ) Pr ϝ[db] = 10 log 10 = 20 log P 10 (Γ) (3.4) i If more power is radiated into free space, the SNR will increase. The target will thus be better visible in the final SAR images. As such it is preferred to have minimal power losses, which means the reflection coefficient should be as low as possible. In fig. 3.8a the fraction of reflected power (eq. (3.4)) when using the Vivaldi antenna is shown between 2.0 and 10.0 GHz. It can be seen that in the operation bandwidth ( GHz), it varies between 13 db and 22 db. The average of the reflection of power over the operation bandwidth is 17 db, which means 98 percent of the power that is supplied will get delivered to the antenna, which is within reasonable numbers. Figure 3.8b shows the same as fig. 3.8a but then for the TEM horn. The fraction of reflected power varies in the operation bandwidth between 5.5 db and 10 db, with an average of 8 db. At 8 db, 84 percent of the power gets delivered to the antenna, showing that the TEM horn s reflection coefficient is worse (higher) than that of the Vivaldi antenna. Nonetheless, these numbers may be interpreted as sufficient for operating in the specified frequency band. Amplitude [db] Frequency [GHz] (a) Vivaldi Amplitude [db] Frequency [GHz] (b) TEM horn Figure 3.8: The fraction of reflected power
18 3.2. Antenna Analysis 13 Radiation Pattern, Polarisation & Directivity The radiation pattern of the antenna is an important parameter for the application. The radiation pattern shows how much power gets send out in a certain direction. As previously discussed the directivity will be studied with the assumption that the higher the directivity the better, to be verified in chapter 4. A more directive antenna could also be useful for different implementations of SAR that are considered, for example with spotlight SAR, where constantly aiming at a target is required. The normalised radiation patterns of both the Vivaldi and TEM horn antenna at 4.3 GHz are shown in fig These radiation patterns are measured for the E-plane and H-plane. It can be seen that the Vivaldi antenna radiates more uniformly in different directions than the TEM horn. Furthermore the TEM horn has a main lobe between -30 and 30 which is about 5 db higher in amplitude than the side lobes. In figs. A.1 and A.2 the radiation patterns are shown of both antenna s at 3.1 GHz and 5.3 GHz. The radiation patterns at these frequencies are similar as the patterns in fig. 3.9, but they still vary at some angles. This indicates that the radiation patterns of both antennas are frequency dependent. The frequency dependency of the radiation patterns is shown in figs. A.3 and A.4. This dependency will be further discussed when the fidelity factor will be studied db -5 db -10 db -15 db 60 Vivaldi TEM horn db -5 db -10 db -15 db 60 Vivaldi TEM horn db -20 db db -30 db db -30 db (a) E-plane (b) H-plane Figure 3.9: The normalized (w.r.t the TEM horn) radiation patterns at 4.3 GHz. In order to see if the TEM horn has indeed a larger directivity than the Vivaldi, the directivity for each antenna is calculated at different frequencies. To calculate the directivity the relationship in eq. (3.5) is used. Here U(θ) is the antenna pattern, U avg (θ) is the average over the radiation pattern and D is the directivity. ( ) U(θ) D = max (3.5) U avg (θ) Figures 3.10a and 3.10b shows the directivity versus frequency for the Vivaldi and the TEM horn. The directivity of the TEM horn increases at higher frequencies and shows an almost linear relationship, while the Vivaldi shows a much more non-linear fast changing curve. It s also important to note the amount of directivity in the operation bandwidth is much higher with the TEM horn than with the Vivaldi. This verifies that the TEM horn is more directive than the Vivaldi. The antennas may be mounted with respect to the the moving platform in a way such that the E-plane is vertical, horizontal, or anything in between. As the choice is somewhat arbitrary concerning their shape, another criterion may be considered. Objects, typically present in the scene of interest, the road, are generally somewhat long (e.g. street lights). As such it may be beneficial to mount both the antennas in a way such that the E-plane is oriented vertically. This is schematically explained in fig The thought behind this is that the reflection from a lengthy vertical object will be (more or less) vertically polarised.
19 3.2. Antenna Analysis 14 Directivity [db] Frequency [GHz] (a) Vivaldi Directivity [db] Frequency [GHz] (b) TEM horn Figure 3.10: The directivity vs frequency H-plane E-plane H-plane E-plane Tx Rx Tx Rx Rx Tx Rx Tx Top view Side view Top view Side view (a) TEM Horn (b) Vivaldi Figure 3.11: Schematic overview of how the antennas have been mounted and to what planes the measurements correspond. Fidelity Factor In general it is possible that a received pulse has a different shape than the transmitted pulse, due to distortions that occur in the medium, transmission lines and antennas that sit between the transmission and reception. The fidelity factor quantifies this by looking at to what extend received pulses correspond to input pulses of the system as whole [27]. Both the Vivaldi and the TEM horn have, as mentioned earlier, a frequency dependency in their radiation patterns (see figs. A.3 and A.4). This frequency dependency changes the shape of the pulse that is transmitted (and received) at various angles around the antenna. Therefore, instead of looking at the fidelity of the input pulse, which is normally done, like in [27], in this thesis the fidelity with respect to a reference pulse 2 will studied. This is done, because only the distortions caused by the antennas themselves are of interest instead of the totality of distortions present in the system. The fidelity factor is relevant here, because the signal processing on the captured data will use the crosscorrelation between the received signal and the reference signal in order to produce the final SAR image [2]. When a pulse, reflected from an object, has a poor correlation with the reference pulse, it will result in the object being less visible in the SAR image. Therefore it is important that between the angles that cover the main lobe (the beamwidth), the received pulses correspond well to the reference pulse, meaning that between those angles a high fidelity factor is preferred. If the fidelity factor were to drop sooner than the width of the main lobe of the antenna, then effectively its beamwidth would be smaller. This is an undesired situation, because that would mean a pulse could be received at a given range R which would not be recognised. This part of the beamwidth makes the detection of pulses in the effective beamwidth at this same range R harder, essentially adding noise to the image. 2 This reference pulse is chosen as the pulse which is received when the transmitting and receiving antenna are direct in front of each other.
20 3.2. Antenna Analysis 15 In order to calculate the fidelity factor it s necessary to determine the cross-correlation between the reference pulse and the received pulse. Equation (3.6) shows the fidelity factor as defined in [27], which is the crosscorrelation between a normalised reference signal ˆX(t) and a normalised received signal ˆF (t). Here the signals are normalised, since only the shape of the pulses have to be compared and not their magnitudes. FF = max ˆX(t) ˆF (t + τ) dt (3.6) Using eq. (3.6) on the pulses received by the Vivaldi and calculating this for each angle with respect to the transmitting antenna, will result in the plot found in fig. 3.12a. Here the fidelity is studied in the H-plane (oriented horizontally with respect to the scene, see fig. 3.11), because this is also the plane in which the the image is created, and as such is most interesting. This figure shows that at 0 the pulse corresponds well to the reference signal, which is expected since that point was used as reference signal. Furthermore the fidelity factor follows, in a way, the antenna pattern given in fig What may strike as surprising are two large dips at around -90 and 90. At these points the pulses only corresponds for approximately 12.5% to the reference pulse. The idea was that this was caused by the received pulse slowly being phase shifted with respect to the reference pulse as the angle increases. To verify this, the same plot was created by shifting the reference signal with 180, given in fig. 3.12b. Where the fidelity was previously at a minimum it is now almost at a maximum. The cause of this may be found in the measurement itself. The receiving antenna was rotated with respect to the transmitting antenna. Apparently the phase centres of the antennas, both the TEM horn and the Vivaldi, were not fully aligned with the rotational axis. This causes the distance between the transmitting and receiving antennas to change, thereby causing a phase shift as the receiving antenna is rotated (a) The reference signal with no shift (b) The reference signal is shifted with 180. Figure 3.12: The fidelity factor of the Vivaldi at each angle with respect to the reference signal 2. To approximate the actual fidelity factor, without ambiguities caused by the non-alignment, the maximum fidelity with respect to phase shifted versions of the reference pulse was calculated. The results are given in fig. 3.13a, where it can be seen that the dips at -90 and 90 are compensated for. It shows that the fidelity factor of the Vivaldi is quite uniform, which is not totally surprising since the Vivaldi also radiate more uniformly. If the received signal power were to drop at certain angles, the smaller pulse may be more sensitive to small distortions. For the TEM horn the same process can be repeated, which results in fig. 3.13b. Looking again at the beam pattern of the antenna (fig. 3.9), it may be said that the TEM horn is a less sensitive to signals from the side, than from the front, which can also be seen in the fidelity factor of the TEM horn, with a smaller than one fidelity outside its beamwidth. Across the area of interest, the beamwidth of the TEM horn, the fidelity factor seems rather good.
21 3.2. Antenna Analysis (a) Vivaldi (b) TEM horn Figure 3.13: The fidelity factor with compensation for phase shifts Conclusion In the applicable operation band the Vivaldi antennas were rather non-directive, showing no clear main-lobe. This in great contrast to the TEM horns, which showed much less sensitivity to signals from the side and the back of the antennas. As would be expected the fidelity with respect to the used reference pulse dropped at those angles where the TEM horns lost their sensitivity. Even though the Vivaldi antennas were outperforming the TEM horns in this respect they both performed sufficiently in their area of interest with a fidelity close to one. Making both antennas equivalent in this respect. Looking at the reflection coefficient of the two antennas, it appeared that the Vivaldis were performing better than the TEM horns. To find out whether the latter makes any difference in the to be obtained result and to find out whether the ranges of the final system are sufficient to satisfy the requirements in chapter 2 an analysis is made on the range of the antennas, based on the previous parameters. Range and SNR The relation between range and SNR may be investigated by calculating the thermal noise power and the received signal power. The thermal noise power is given by [17]: P n = kt o F B 75 dbm (3.7) With k the Boltzmann constant, T 0 the standard temperature of 290 K, F the noise figure of the radar module (4.8 db) and B its bandwidth (2.2 GHz). The received signal power is given by [17]: With: P r = P tg t G r λ 2 σ (4π) 3 R 4 (3.8) P t, the transmitted power. The radar module can transmit up to dbm. Depending on the reflection coefficient this value is slightly lower. As calculated in section P t is approximately 98% (Vivaldi) or 85% (TEM horns) of dbm. G t, the gain of the transmitting antenna. For the Vivaldis approximately 2 db in the used frequency band [23], and for the TEM horns around 13 db [25]. G r, the gain of the receiving antenna. For simplicity it is assumed that the antennas will be used in pairs, such that G t = G r. λ, the wavelength of the used signal. It is approximated by using the wavelength at the centre frequency. σ, the radar cross section (RCS) of a typical object. It is a value that shows how much power is reflected. If typical objects are considered which might be found on a street, a value of 1 m 2 is deemed reasonable.
22 3.2. Antenna Analysis Vivaldi (PII = 11) TEM (PII = 11) SNR [db] Range [m] Figure 3.14: The approximated SNR at different ranges from the antennas (Vivaldi and TEM horns). The dotted lines show the minimum and maximal values if the PII where to be set to their respective minimum and maximum value. In [28] a small metal cylinder (about 30 cm long with a diameter of about 10 cm) is measured which has a RCS of about 0.5 m 2. Objects such as trash cans are already much larger, let alone the poles of street and traffic lights. A human being was also measured, its RCS being about 1 m 2. An RCS of 1 m 2 is a rough estimation, but it does supply a reasonable lower boundary. R, the range from the antennas. The SNR may then be calculated using its definition and substitution in eq. (3.1): SNR = P r P n 2 PII (3.9) The resulting figure may be found in fig The higher gain of the TEM horns make that the obtained SNR is much higher, coming with a much smaller beamwidth. It may now be concluded that the TEM horns are outperforming the Vivaldis if the hypothesis, laid out in section 3.2.3, is followed: the horns allow a higher SNR, have a smaller beamwidth and have sufficient fidelity across it. For further interpretation of the figure the important question is what minimum value for the SNR is required to obtain sufficient detail in the final images. An SNR of 20 db, for example, already limits the amplitude of the thermal noise to one-tenth of the signal amplitude. Accepting this value as a threshold, it may be concluded that even with minimal PII the SNR is sufficient on short ranges, as was also noted in section It is at these ranges that the Vivaldi antennas are likely still useful, as their minimum range is smaller (section 3.1.4). At larger ranges, and with use of the TEM horns, the PII will have to be increased. At PII = 11 the images should be able to be reasonably clean up to 20 m, which should be sufficient to satisfy requirement [1.3]. It should be noted that in practice at those ranges other things may influence the results as well. For example the fact that the reflections from larger ranges are relatively small with respect those from close by, rendering them less visible in the final images. On the other hand, maybe because in a typical environment the objects close by are small and the ones further away larger (think buildings) this effect may be reduced. Larger range tests, not part of this thesis, should show whether this is, or is not, the case.
23 4 Prototype Implementation and Results Validation This chapter describes how the design choices as described in chapter 3 have been implemented and validated Prototype Implementation The software part of the design has been implemented using Matlab. The code provided by Time Domain [29] has been used as a starting point. This code already allows changing the configuration. It also allows reading data from the PulsON, but it has been decided to change the implementation somewhat, to allow multiple scans with only one scan request. The implementation of Time Domain does not sufficiently support this. Doing it this way should be more accurate, as the radar module itself is now determining the scan interval. Otherwise Matlab would be doing this by continuously requesting one scan at a time, introducing additional, somewhat random, delays. First the configuration of the radar module is changed. The settings are set to those as determined in section 3.1. The start and stop times of the scan are approximated by inputting a certain range (as in distance). Because the PulsON does only allow certain values, the actual values are read back out after setting the configuration. They are then changed locally to compensate for the delay. After this the platform on the rail is set in motion and scans are made. Depending on the version the implementation is slightly different: Discrete: Continuous: 1. Configure PulsON. 1. Configure PulsON. 2. Move platform dx cm. 2. Start moving platform x + y cm. 3. Request scan, wait for data 3. Request N scans. 4. Iterate 2. and 3. until a distance of x has been covered. Where dx is the space between two scans and x the total distance along which N measurements are performed. The parameter y is some additional distance at the start to allow the platform to get started and some at the end to avoid scanning while the platform has stopped moving. To comply with requirement [5.1] the application will communicate with the user when a scan has been received. Furthermore, both versions satisfy requirement [7.4], which says the platform should be able to be moved in semi-parallel with the scanning, because scans can be received while the platform is moving. Finally, the hardware part of the prototype, mainly designed by the hardware group and described in [1], is what allows step 2. Adding the radar module to it results in a setup a previously given in fig. 1.3, with the ability to mount different types of antennas Results Validation Data Acquisition The data acquisition part may be verified by looking at the obtained data. An image created using the envelope of this data, obtained using a scan performed with spatial sampling of 1 cm and a synthetic aperture of 4 m, is 18
 = (x x 0 ) 2 + y0 2 (4.")
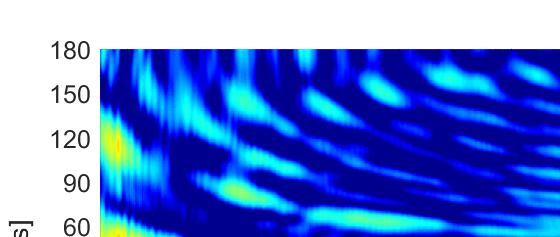
24 4.2. Results Validation 19 given in fig. 4.1a. The measurement setup is depicted fig. 4.1b. The two stacks of scans are clearly observable as two curves. This result is expected because the distance to the object may be written as: R(x) = (x x 0 ) 2 + y0 2 (4.1) Where R(x, y) is the distance to the object located at (x 0, y 0 ), and x is the position of the radar module. The lower can was located at about 270 cm from the radar module, which is almost as obtained in the image. A small bit of the right wall is also visible in the image as a diagonal line, starting at the point (4,3). Furthermore, clearly visible is a horizontal stroke along the image, which corresponds to the metal casings of lighting mounted on the ceiling Stacks of cans 4 y [m] ~270 cm ~320 cm x [m] (a) ~170 cm Radar Radar Wall (b) Radar Figure 4.1: An image formed using the envelope of the data captured using > 400 scans at equally spaced positions along the x-axis (cross-range). Two stacks of cans were images using TEM-horns (a). The measurement setup is depicted in (b) Antenna Choice The easiest way to validate the choices that were made at the end of section 3.2 is to produce SAR images with the different antennas. In fig. 4.2 the SAR images can be seen using the omnidirectional, Vivaldi and TEM horn antennas. Each of these SAR images are the product of the same imaging algorithm which was made by the Imaging subgroup. The setup that was used to acquire these images is given in fig. 4.1b. Figure 4.2a shows the SAR image of the setup using the omnidirectional antennas. From this image it can be seen that the omnidirectional ones, as expected, capture a lot of multi-path reflections. Around y = 4 m a lot of reflections can be seen over the whole x-axis. These reflection are likely due to the metal casings of the lighting in the ceiling, also visible in the raw data, as described in section At around 2 m there are again a lot of reflections, this is most likely due to the lighting in the ceiling that were behind the antennas. The image acquired using the Vivaldi antennas is shown in fig. 4.2b. In this image less multi-path reflections can be seen with respect to fig. 4.2a. This is somewhat unexpected, since figs. 3.9, A.1 and A.2 show that the Vivaldi has an almost omnidirectional pattern in the operation bandwidth. Since the Vivaldi s fidelity factor at some angles (primarily at the back of the antenna) is less than one (see fig. 3.13a), it s possible that those pulses reflected back from the lighting behind the antennas correspond less to the reference pulse making those the multi-path reflections less visible. However it s not possible to fully conclude what causes the improvement on the image when using a Vivaldi with respect omnidirectional. However the reflections at 4 m and 2 m are still seen, but in comparison with the omnidirectional it s a vast improvement. Something that is quite surprising is the fact that one of the stack of cans (at y 3.5 m) is less visible than with the omnidirectional antennas. At this point it s not clear what causes this decrease in visibility, so making any concluding remarks about it won t be appropriate. The final image is an image created with the TEM horns (fig. 4.2c). This image is by far the best image of the three that were produced. The TEM horns receives less multi-path reflections, with respect to the omnidirectional and Vivaldi antenna. The TEM horn also has a higher gain than the omnidirectional and Vivaldi, resulting in a


25 4.2. Results Validation 20 higher SNR which renders noise to be less visible. The lighting in the ceiling behind the antenna isn t visible anymore in the image, this is due to the directivity of the TEM horn. But this directivity makes the lights in the ceiling more visible on the image of the TEM horn with respect to the image of the Vivaldi. From these SAR images it can be concluded that the TEM horn improves the quality of the image the most. The Vivaldi already improves on the omnidirectional antenna, but the TEM horn with its higher gain and directivity receives less noise and multi-path reflections, therefore outperforming the Vivaldi antenna. This validates the hypotheses, that was made at the beginning of this theses. It is possible that there are other parameters which could improve the quality of the SAR image, however it has become clear that directivity and gain give quite some improvement on the quality of the SAR image y [m] 3.5 y [m] x [m] x [m] (a) Onmidirectional (b) Vivaldi y [m] x [m] (c) TEM-horns Figure 4.2: The obtained images with the different antennas with a simple algorithm of the Imaging group. The imaged objects are two stacks of cans (encircled in the image) with a height of 46 cm, centred to the height of the antennas.
26 5 Discussion This chapter discusses the obtained results in a general sense. Looking at the prototype delivered by the three subgroups as a whole it may be concluded that an image can successfully be formed of a scanned environment. The designed and implemented Data Acquisition subsystem contributes to this by being capable of acquiring measurement data using the PulsON radar module, configured to the applicable settings, and by making the data readily available for further processing. Furthermore a set of antennas was chosen which should improve the quality of the finally obtained SAR image. Measurements show that, at least for ranges up to a few meters, the results are sufficient to recognise shapes in a controlled scene. These results may be applicable to road conditions, substantiated by the fact that the obtained SNR should be sufficient at larger ranges. Additionally the objects that may be typically found in road environments may be better visible than the two stacks of cans that were already imaged with encouraging results. Trash cans are for example often from metal and much larger, lamp posts much longer and buildings in general have a much larger reflective surface. This would allow the future use of the developed technology for mapping of an (outside) environment, thereby possibly allowing the improvement of localisation and navigation of cars. 21
27 6 Conclusion This chapter discusses what kind of further development and research is still possible, apart from the requirements that have been met already (see for a summary appendix A.3). At this point the data acquisition and image formation work in a sequential relation. However for an easier accessible system it is desired for both sub-systems to work in (semi-)parallel with each other. This parallel implementation can be performed in the future to improve the system. Due to the nature of this project, primarily the time duration, some of the hardware was supplied without any design steps of the project members. This caused some limitations based on the hardware provided. One example is the PulsON radar module which has certain bandwidth. It could be interesting to see if there are other radar modules available with higher bandwidths, which could then in turn improve the resolution of the SAR images. Another option could be to design a radar module, but this could take too much time to be effective. As was mentioned at the beginning of the thesis the main goal of this project is to produce SAR images, keeping in mind a real world application: to improve the localisation and navigation of cars. In this thesis the theoretical fundamentals for this application have been established, however the next step is to scale towards the end goal. This process requires further research and testing of certain aspects of the system. A good example is the amount of range the system can scan. Longer ranges are theoretical possible, but tests need to be performed in order to verify if these longer ranges are achievable. One must also be aware that a car travels faster than the moving platform that was used for this project. At these higher velocities the same spacing constraints apply as in the case of low velocities. The data acquisition must then be fast enough in order to keep up with speed of the car, it s still questionable if the current system is able to do so. This requires more testing and research. The SAR images that have been produced until now, have been done in one type of environment. So in order to to see how the system performs in a real world environment, more tests need to be performed in a typical traffic situation. As was mentioned in section 3.2.3, the Doppler shift is normally used in SAR. The application that is discussed in this thesis, did in fact assume that the Doppler shift was not sufficient enough to use. However at higher velocities, for example when used on a vehicle, the Doppler shift starts to become more relevant. Which opens the question of the optimal beamwidth and the trade-off between SNR and beamwidth. It s very well possible that the hypothesis which was stated in section no longer holds, which requires a search of the most optimal beamwidth for the real world application. This can possible require a fully new antenna design, which is designed specifically for the application. 22
28 A Appendix A.1. Radiation Patterns db -5 db -10 db -15 db 60 Vivaldi TEM horn db -5 db -10 db -15 db 60 Vivaldi TEM horn db -20 db db -30 db db -30 db (a) E-plane (b) H-plane Figure A.1: The normalized (w.r.t the TEM horn) radiation patterns at 3.1 GHz db -5 db -10 db -15 db 60 Vivaldi TEM horn db -5 db -10 db -15 db 60 Vivaldi TEM horn db -20 db db -30 db db -30 db (a) E-plane (b) H-plane Figure A.2: The normalized (w.r.t the TEM horn) radiation patterns at 5.3 GHz. 23


")


29 A.2. Frequency Dependent Radiation Patterns 24 A.2. Frequency Dependent Radiation Patterns (a) E-plane (b) H-plane Figure A.3: The normalized radiation patterns of the Vivaldi between 2 GHz and 10 GHz. (a) E-plane (b) H-plane Figure A.4: The normalized radiation patterns of the TEM horn between 2 GHz and 10 GHz.
Exercise 1-4. The Radar Equation EXERCISE OBJECTIVE DISCUSSION OUTLINE DISCUSSION OF FUNDAMENTALS
 Exercise 1-4 The Radar Equation EXERCISE OBJECTIVE When you have completed this exercise, you will be familiar with the different parameters in the radar equation, and with the interaction between these
DIGITAL BEAM-FORMING ANTENNA OPTIMIZATION FOR REFLECTOR BASED SPACE DEBRIS RADAR SYSTEM
 DIGITAL BEAM-FORMING ANTENNA OPTIMIZATION FOR REFLECTOR BASED SPACE DEBRIS RADAR SYSTEM A. Patyuchenko, M. Younis, G. Krieger German Aerospace Center (DLR), Microwaves and Radar Institute, Muenchner Strasse
Exercise 1-3. Radar Antennas EXERCISE OBJECTIVE DISCUSSION OUTLINE DISCUSSION OF FUNDAMENTALS. Antenna types
 Exercise 1-3 Radar Antennas EXERCISE OBJECTIVE When you have completed this exercise, you will be familiar with the role of the antenna in a radar system. You will also be familiar with the intrinsic characteristics
The Discussion of this exercise covers the following points:
 Exercise 3-2 Frequency-Modulated CW Radar EXERCISE OBJECTIVE When you have completed this exercise, you will be familiar with FM ranging using frequency-modulated continuous-wave (FM-CW) radar. DISCUSSION
Potential interference from spaceborne active sensors into radionavigation-satellite service receivers in the MHz band
 Rec. ITU-R RS.1347 1 RECOMMENDATION ITU-R RS.1347* Rec. ITU-R RS.1347 FEASIBILITY OF SHARING BETWEEN RADIONAVIGATION-SATELLITE SERVICE RECEIVERS AND THE EARTH EXPLORATION-SATELLITE (ACTIVE) AND SPACE RESEARCH
GAIN COMPARISON MEASUREMENTS IN SPHERICAL NEAR-FIELD SCANNING
 GAIN COMPARISON MEASUREMENTS IN SPHERICAL NEAR-FIELD SCANNING ABSTRACT by Doren W. Hess and John R. Jones Scientific-Atlanta, Inc. A set of near-field measurements has been performed by combining the methods
Radar Signatures and Relations to Radar Cross Section. Mr P E R Galloway. Roke Manor Research Ltd, Romsey, Hampshire, United Kingdom
 Radar Signatures and Relations to Radar Cross Section Mr P E R Galloway Roke Manor Research Ltd, Romsey, Hampshire, United Kingdom Philip.Galloway@roke.co.uk Abstract This paper addresses a number of effects
MAKING TRANSIENT ANTENNA MEASUREMENTS
 MAKING TRANSIENT ANTENNA MEASUREMENTS Roger Dygert, Steven R. Nichols MI Technologies, 1125 Satellite Boulevard, Suite 100 Suwanee, GA 30024-4629 ABSTRACT In addition to steady state performance, antennas
CHAPTER 2 WIRELESS CHANNEL
 CHAPTER 2 WIRELESS CHANNEL 2.1 INTRODUCTION In mobile radio channel there is certain fundamental limitation on the performance of wireless communication system. There are many obstructions between transmitter
ECC Recommendation (16)04
04") ECC Recommendation (16)04 Determination of the radiated power from FM sound broadcasting stations through field strength measurements in the frequency band 87.5 to 108 MHz Approved 17 October 2016 Edition
ECC Recommendation (16)04 Determination of the radiated power from FM sound broadcasting stations through field strength measurements in the frequency band 87.5 to 108 MHz Approved 17 October 2016 Edition
EMG4066:Antennas and Propagation Exp 1:ANTENNAS MMU:FOE. To study the radiation pattern characteristics of various types of antennas.
 OBJECTIVES To study the radiation pattern characteristics of various types of antennas. APPARATUS Microwave Source Rotating Antenna Platform Measurement Interface Transmitting Horn Antenna Dipole and Yagi
Narrow- and wideband channels
 RADIO SYSTEMS ETIN15 Lecture no: 3 Narrow- and wideband channels Ove Edfors, Department of Electrical and Information technology Ove.Edfors@eit.lth.se 2012-03-19 Ove Edfors - ETIN15 1 Contents Short review
UWB SHORT RANGE IMAGING
 ICONIC 2007 St. Louis, MO, USA June 27-29, 2007 UWB SHORT RANGE IMAGING A. Papió, J.M. Jornet, P. Ceballos, J. Romeu, S. Blanch, A. Cardama, L. Jofre Department of Signal Theory and Communications (TSC)
Thu Truong, Michael Jones, George Bekken EE494: Senior Design Projects Dr. Corsetti. SAR Senior Project 1
 Thu Truong, Michael Jones, George Bekken EE494: Senior Design Projects Dr. Corsetti SAR Senior Project 1 Outline Team Senior Design Goal UWB and SAR Design Specifications Design Constraints Technical Approach
Rec. ITU-R F RECOMMENDATION ITU-R F *
 Rec. ITU-R F.162-3 1 RECOMMENDATION ITU-R F.162-3 * Rec. ITU-R F.162-3 USE OF DIRECTIONAL TRANSMITTING ANTENNAS IN THE FIXED SERVICE OPERATING IN BANDS BELOW ABOUT 30 MHz (Question 150/9) (1953-1956-1966-1970-1992)
ESA Radar Remote Sensing Course ESA Radar Remote Sensing Course Radar, SAR, InSAR; a first introduction
 Radar, SAR, InSAR; a first introduction Ramon Hanssen Delft University of Technology The Netherlands r.f.hanssen@tudelft.nl Charles University in Prague Contents Radar background and fundamentals Imaging
Multi-Path Fading Channel
 Instructor: Prof. Dr. Noor M. Khan Department of Electronic Engineering, Muhammad Ali Jinnah University, Islamabad Campus, Islamabad, PAKISTAN Ph: +9 (51) 111-878787, Ext. 19 (Office), 186 (Lab) Fax: +9
Dr. John S. Seybold. November 9, IEEE Melbourne COM/SP AP/MTT Chapters
 Antennas Dr. John S. Seybold November 9, 004 IEEE Melbourne COM/SP AP/MTT Chapters Introduction The antenna is the air interface of a communication system An antenna is an electrical conductor or system
Overview. Measurement of Ultra-Wideband Wireless Channels
 Measurement of Ultra-Wideband Wireless Channels Wasim Malik, Ben Allen, David Edwards, UK Introduction History of UWB Modern UWB Antenna Measurements Candidate UWB elements Radiation patterns Propagation
INTRODUCTION TO RADAR SIGNAL PROCESSING
 INTRODUCTION TO RADAR SIGNAL PROCESSING Christos Ilioudis University of Strathclyde c.ilioudis@strath.ac.uk Overview History of Radar Basic Principles Principles of Measurements Coherent and Doppler Processing
ECE 476/ECE 501C/CS Wireless Communication Systems Winter Lecture 6: Fading
 ECE 476/ECE 501C/CS 513 - Wireless Communication Systems Winter 2005 Lecture 6: Fading Last lecture: Large scale propagation properties of wireless systems - slowly varying properties that depend primarily
Channel. Muhammad Ali Jinnah University, Islamabad Campus, Pakistan. Multi-Path Fading. Dr. Noor M Khan EE, MAJU
 Instructor: Prof. Dr. Noor M. Khan Department of Electronic Engineering, Muhammad Ali Jinnah University, Islamabad Campus, Islamabad, PAKISTAN Ph: +9 (51) 111-878787, Ext. 19 (Office), 186 (Lab) Fax: +9
Space-Time Adaptive Processing Using Sparse Arrays
 Space-Time Adaptive Processing Using Sparse Arrays Michael Zatman 11 th Annual ASAP Workshop March 11 th -14 th 2003 This work was sponsored by the DARPA under Air Force Contract F19628-00-C-0002. Opinions,
New Features of IEEE Std Digitizing Waveform Recorders
 New Features of IEEE Std 1057-2007 Digitizing Waveform Recorders William B. Boyer 1, Thomas E. Linnenbrink 2, Jerome Blair 3, 1 Chair, Subcommittee on Digital Waveform Recorders Sandia National Laboratories
ECE 476/ECE 501C/CS Wireless Communication Systems Winter Lecture 6: Fading
 ECE 476/ECE 501C/CS 513 - Wireless Communication Systems Winter 2004 Lecture 6: Fading Last lecture: Large scale propagation properties of wireless systems - slowly varying properties that depend primarily
EE 529 Remote Sensing Techniques. Radar
 EE 59 Remote Sensing Techniques Radar Outline Radar Resolution Radar Range Equation Signal-to-Noise Ratio Doppler Frequency Basic function of an active radar Radar RADAR: Radio Detection and Ranging Detection
Narrow- and wideband channels
 RADIO SYSTEMS ETIN15 Lecture no: 3 Narrow- and wideband channels Ove Edfors, Department of Electrical and Information technology Ove.Edfors@eit.lth.se 27 March 2017 1 Contents Short review NARROW-BAND
Dr. Ali Muqaibel. Associate Professor. Electrical Engineering Department King Fahd University of Petroleum & Minerals Dhahran, Saudi Arabia
 By Associate Professor Electrical Engineering Department King Fahd University of Petroleum & Minerals Dhahran, Saudi Arabia Wednesday, December 1, 14 1 st Saudi Symposium for RADAR Technology 9 1 December
CIRCULAR DUAL-POLARISED WIDEBAND ARRAYS FOR DIRECTION FINDING
 CIRCULAR DUAL-POLARISED WIDEBAND ARRAYS FOR DIRECTION FINDING M.S. Jessup Roke Manor Research Limited, UK. Email: michael.jessup@roke.co.uk. Fax: +44 (0)1794 833433 Keywords: DF, Vivaldi, Beamforming,
Detection of Multipath Propagation Effects in SAR-Tomography with MIMO Modes
 Detection of Multipath Propagation Effects in SAR-Tomography with MIMO Modes Tobias Rommel, German Aerospace Centre (DLR), tobias.rommel@dlr.de, Germany Gerhard Krieger, German Aerospace Centre (DLR),
Mobile Radio Propagation: Small-Scale Fading and Multi-path
 Mobile Radio Propagation: Small-Scale Fading and Multi-path 1 EE/TE 4365, UT Dallas 2 Small-scale Fading Small-scale fading, or simply fading describes the rapid fluctuation of the amplitude of a radio
An Introduction to Antennas
 May 11, 010 An Introduction to Antennas 1 Outline Antenna definition Main parameters of an antenna Types of antennas Antenna radiation (oynting vector) Radiation pattern Far-field distance, directivity,
Lecture Fundamentals of Data and signals
 IT-5301-3 Data Communications and Computer Networks Lecture 05-07 Fundamentals of Data and signals Lecture 05 - Roadmap Analog and Digital Data Analog Signals, Digital Signals Periodic and Aperiodic Signals
CHAPTER 2 MICROSTRIP REFLECTARRAY ANTENNA AND PERFORMANCE EVALUATION
 43 CHAPTER 2 MICROSTRIP REFLECTARRAY ANTENNA AND PERFORMANCE EVALUATION 2.1 INTRODUCTION This work begins with design of reflectarrays with conventional patches as unit cells for operation at Ku Band in
Groundwave Propagation, Part One
 Groundwave Propagation, Part One 1 Planar Earth groundwave 2 Planar Earth groundwave example 3 Planar Earth elevated antenna effects Levis, Johnson, Teixeira (ESL/OSU) Radiowave Propagation August 17,
Antennas and Propagation. Chapter 5
 Antennas and Propagation Chapter 5 Introduction An antenna is an electrical conductor or system of conductors Transmission - radiates electromagnetic energy into space Reception - collects electromagnetic
Lecture 9. Radar Equation. Dr. Aamer Iqbal. Radar Signal Processing Dr. Aamer Iqbal Bhatti
 Lecture 9 Radar Equation Dr. Aamer Iqbal 1 ystem Losses: Losses within the radar system itself are from many sources. everal are described below. L PL =the plumbing loss. L PO =the polarization loss. L
Antennas & Propagation. CSG 250 Fall 2007 Rajmohan Rajaraman
 Antennas & Propagation CSG 250 Fall 2007 Rajmohan Rajaraman Introduction An antenna is an electrical conductor or system of conductors o Transmission - radiates electromagnetic energy into space o Reception
ECE 476/ECE 501C/CS Wireless Communication Systems Winter Lecture 6: Fading
 ECE 476/ECE 501C/CS 513 - Wireless Communication Systems Winter 2003 Lecture 6: Fading Last lecture: Large scale propagation properties of wireless systems - slowly varying properties that depend primarily
RECOMMENDATION ITU-R S *
 Rec. ITU-R S.1339-1 1 RECOMMENDATION ITU-R S.1339-1* Rec. ITU-R S.1339-1 SHARING BETWEEN SPACEBORNE PASSIVE SENSORS OF THE EARTH EXPLORATION-SATELLITE SERVICE AND INTER-SATELLITE LINKS OF GEOSTATIONARY-SATELLITE
(Refer Slide Time: 00:01:31 min)
") Wireless Communications Dr. Ranjan Bose Department of Electrical Engineering Indian Institute of Technology, Delhi Lecture No. # 32 Equalization and Diversity Techniques for Wireless Communications (Continued)
Wireless Communications Dr. Ranjan Bose Department of Electrical Engineering Indian Institute of Technology, Delhi Lecture No. # 32 Equalization and Diversity Techniques for Wireless Communications (Continued)
Statistical Pulse Measurements using USB Power Sensors
 Statistical Pulse Measurements using USB Power Sensors Today s modern USB Power Sensors are capable of many advanced power measurements. These Power Sensors are capable of demodulating the signal and processing
A New TEM Horn Antenna Designing Based on Plexiglass Antenna Cap
 Journal of Applied Science and Engineering, Vol. 21, No. 3, pp. 413 418 (2018) DOI: 10.6180/jase.201809_21(3).0012 A New TEM Horn Antenna Designing Based on Plexiglass Antenna Cap Lin Teng and Jie Liu*
Design and analysis of new GPR antenna concepts R.V. de Jongh (1), A.G. Yarovoy (1), L. P. Ligthart (1), I.V. Kaploun (2), A.D.
, A.G. Yarovoy (1), L. P. Ligthart (1), I.V. Kaploun (2), A.D.") Design and analysis of new GPR antenna concepts R.V. de Jongh (1), A.G. Yarovoy (1), L. P. Ligthart (1), I.V. Kaploun (2), A.D. Schukin (2) (1) Delft University of Technology, Faculty of Information Technology
Design and analysis of new GPR antenna concepts R.V. de Jongh (1), A.G. Yarovoy (1), L. P. Ligthart (1), I.V. Kaploun (2), A.D. Schukin (2) (1) Delft University of Technology, Faculty of Information Technology
DOPPLER RADAR. Doppler Velocities - The Doppler shift. if φ 0 = 0, then φ = 4π. where
 Q: How does the radar get velocity information on the particles? DOPPLER RADAR Doppler Velocities - The Doppler shift Simple Example: Measures a Doppler shift - change in frequency of radiation due to
Microwave Remote Sensing (1)
") Microwave Remote Sensing (1) Microwave sensing encompasses both active and passive forms of remote sensing. The microwave portion of the spectrum covers the range from approximately 1cm to 1m in wavelength.
Microwave Remote Sensing (1) Microwave sensing encompasses both active and passive forms of remote sensing. The microwave portion of the spectrum covers the range from approximately 1cm to 1m in wavelength.
The Measurement and Characterisation of Ultra Wide-Band (UWB) Intentionally Radiated Signals
 Intentionally Radiated Signals") The Measurement and Characterisation of Ultra Wide-Band (UWB) Intentionally Radiated Signals Rafael Cepeda Toshiba Research Europe Ltd University of Bristol November 2007 Rafael.cepeda@toshiba-trel.com
The Measurement and Characterisation of Ultra Wide-Band (UWB) Intentionally Radiated Signals Rafael Cepeda Toshiba Research Europe Ltd University of Bristol November 2007 Rafael.cepeda@toshiba-trel.com
Exercise 3-3. Multiple-Source Jamming Techniques EXERCISE OBJECTIVE
 Exercise 3-3 Multiple-Source Jamming Techniques EXERCISE OBJECTIVE To introduce multiple-source jamming techniques. To differentiate between incoherent multiple-source jamming (cooperative jamming), and
EENG473 Mobile Communications Module 3 : Week # (12) Mobile Radio Propagation: Small-Scale Path Loss
 Mobile Radio Propagation: Small-Scale Path Loss") EENG473 Mobile Communications Module 3 : Week # (12) Mobile Radio Propagation: Small-Scale Path Loss Introduction Small-scale fading is used to describe the rapid fluctuation of the amplitude of a radio
EENG473 Mobile Communications Module 3 : Week # (12) Mobile Radio Propagation: Small-Scale Path Loss Introduction Small-scale fading is used to describe the rapid fluctuation of the amplitude of a radio
Antennas and Propagation. Chapter 5
 Antennas and Propagation Chapter 5 Introduction An antenna is an electrical conductor or system of conductors Transmission - radiates electromagnetic energy into space Reception - collects electromagnetic
RECOMMENDATION ITU-R SA.1628
 Rec. ITU-R SA.628 RECOMMENDATION ITU-R SA.628 Feasibility of sharing in the band 35.5-36 GHZ between the Earth exploration-satellite service (active) and space research service (active), and other services
Miniaturized GPS Antenna Array Technology and Predicted Anti-Jam Performance
 Miniaturized GPS Antenna Array Technology and Predicted Anti-Jam Performance Dale Reynolds; Alison Brown NAVSYS Corporation. Al Reynolds, Boeing Military Aircraft And Missile Systems Group ABSTRACT NAVSYS
Antennas and Propagation. Chapter 4: Antenna Types
 Antennas and Propagation : Antenna Types 4.4 Aperture Antennas High microwave frequencies Thin wires and dielectrics cause loss Coaxial lines: may have 10dB per meter Waveguides often used instead Aperture
RECOMMENDATION ITU-R F *
 Rec. ITU-R F.699-6 1 RECOMMENATION ITU-R F.699-6 * Reference radiation patterns for fixed wireless system antennas for use in coordination studies and interference assessment in the frequency range from
Indoor Positioning with UWB Beamforming
 Indoor Positioning with UWB Beamforming Christiane Senger a, Thomas Kaiser b a University Duisburg-Essen, Germany, e-mail: c.senger@uni-duisburg.de b University Duisburg-Essen, Germany, e-mail: thomas.kaiser@uni-duisburg.de
NTT DOCOMO Technical Journal. Method for Measuring Base Station Antenna Radiation Characteristics in Anechoic Chamber. 1.
 Base Station Antenna Directivity Gain Method for Measuring Base Station Antenna Radiation Characteristics in Anechoic Chamber Base station antennas tend to be long compared to the wavelengths at which
Exam 3 is two weeks from today. Today s is the final lecture that will be included on the exam.
 ECE 5325/6325: Wireless Communication Systems Lecture Notes, Spring 2010 Lecture 19 Today: (1) Diversity Exam 3 is two weeks from today. Today s is the final lecture that will be included on the exam.
Antennas and Propagation
 Mobile Networks Module D-1 Antennas and Propagation 1. Introduction 2. Propagation modes 3. Line-of-sight transmission 4. Fading Slides adapted from Stallings, Wireless Communications & Networks, Second
Electronically Steerable planer Phased Array Antenna
 Electronically Steerable planer Phased Array Antenna Amandeep Kaur Department of Electronics and Communication Technology, Guru Nanak Dev University, Amritsar, India Abstract- A planar phased-array antenna
Effects on phased arrays radiation pattern due to phase error distribution in the phase shifter operation
 Effects on phased arrays radiation pattern due to phase error distribution in the phase shifter operation Giuseppe Coviello 1,a, Gianfranco Avitabile 1,Giovanni Piccinni 1, Giulio D Amato 1, Claudio Talarico
Tracking of Moving Targets with MIMO Radar
 Tracking of Moving Targets with MIMO Radar Peter W. Moo, Zhen Ding Radar Sensing & Exploitation Section DRDC Ottawa Research Centre Presentation to 2017 NATO Military Sensing Symposium 31 May 2017 waveform
Exercise 6. Range and Angle Tracking Performance (Radar-Dependent Errors) EXERCISE OBJECTIVE
 EXERCISE OBJECTIVE") Exercise 6 Range and Angle Tracking Performance EXERCISE OBJECTIVE When you have completed this exercise, you will be familiar with the radardependent sources of error which limit range and angle tracking
Exercise 6 Range and Angle Tracking Performance EXERCISE OBJECTIVE When you have completed this exercise, you will be familiar with the radardependent sources of error which limit range and angle tracking
Newsletter 4.4. Antenna Magus version 4.4 released! Array synthesis reflective ground plane addition. July 2013
 Newsletter 4.4 July 2013 Antenna Magus version 4.4 released! We are pleased to announce the new release of Antenna Magus Version 4.4. This release sees the addition of 5 new antennas: Horn-fed truncated
UWB Double-Directional Channel Sounding
 2004/01/30 Oulu, Finland UWB Double-Directional Channel Sounding - Why and how? - Jun-ichi Takada Tokyo Institute of Technology, Japan takada@ide.titech.ac.jp Table of Contents Background Antennas and
9. Microwaves. 9.1 Introduction. Safety consideration
 MW 9. Microwaves 9.1 Introduction Electromagnetic waves with wavelengths of the order of 1 mm to 1 m, or equivalently, with frequencies from 0.3 GHz to 0.3 THz, are commonly known as microwaves, sometimes
PERFORMANCE CONSIDERATIONS FOR PULSED ANTENNA MEASUREMENTS
 PERFORMANCE CONSIDERATIONS FOR PULSED ANTENNA MEASUREMENTS David S. Fooshe Nearfield Systems Inc., 19730 Magellan Drive Torrance, CA 90502 USA ABSTRACT Previous AMTA papers have discussed pulsed antenna
Study of the Effect of RCS on Radar Detection
 Study of the Effect of RCS on Radar Detection Dr. Haitham Kareem Ali (Assistant Professor) Technical College of Engineering, Sulaimani Polytechnic University, Kurdistan Region, Iraq doi: 10.19044/esj.2017.v13n15p148
Frequency Agility and Barrage Noise Jamming
 Exercise 1-3 Frequency Agility and Barrage Noise Jamming EXERCISE OBJECTIVE To demonstrate frequency agility, a radar electronic protection is used against spot noise jamming. To justify the use of barrage
KULLIYYAH OF ENGINEERING
 KULLIYYAH OF ENGINEERING DEPARTMENT OF ELECTRICAL & COMPUTER ENGINEERING ANTENNA AND WAVE PROPAGATION LABORATORY (ECE 4103) EXPERIMENT NO 3 RADIATION PATTERN AND GAIN CHARACTERISTICS OF THE DISH (PARABOLIC)
Nadir Margins in TerraSAR-X Timing Commanding
 CEOS SAR Calibration and Validation Workshop 2008 1 Nadir Margins in TerraSAR-X Timing Commanding S. Wollstadt and J. Mittermayer, Member, IEEE Abstract This paper presents an analysis and discussion of
A Stepped Frequency CW SAR for Lightweight UAV Operation
 UNCLASSIFIED/UNLIMITED A Stepped Frequency CW SAR for Lightweight UAV Operation ABSTRACT Dr Keith Morrison Department of Aerospace, Power and Sensors University of Cranfield, Shrivenham Swindon, SN6 8LA
Antenna Design and Site Planning Considerations for MIMO
 Antenna Design and Site Planning Considerations for MIMO Steve Ellingson Mobile & Portable Radio Research Group (MPRG) Dept. of Electrical & Computer Engineering Virginia Polytechnic Institute & State
UWB Antennas & Measurements. Gabriela Quintero MICS UWB Network Meeting 11/12/2007
 UWB Antennas & Measurements Gabriela Quintero MICS UWB Network Meeting 11/12/27 Outline UWB Antenna Analysis Frequency Domain Time Domain Measurement Techniques Peak and Average Power Measurements Spectrum
FREQUENCY RESPONSE AND LATENCY OF MEMS MICROPHONES: THEORY AND PRACTICE
 APPLICATION NOTE AN22 FREQUENCY RESPONSE AND LATENCY OF MEMS MICROPHONES: THEORY AND PRACTICE This application note covers engineering details behind the latency of MEMS microphones. Major components of
Chapter 4 Results. 4.1 Pattern recognition algorithm performance
 94 Chapter 4 Results 4.1 Pattern recognition algorithm performance The results of analyzing PERES data using the pattern recognition algorithm described in Chapter 3 are presented here in Chapter 4 to
Sensor and Simulation Notes Note 548 October 2009
 Sensor and Simulation Notes Note 548 October 009 Design of a rectangular waveguide narrow-wall longitudinal-aperture array using microwave network analysis Naga R. Devarapalli, Carl E. Baum, Christos G.
Ranging detection algorithm for indoor UWB channels and research activities relating to a UWB-RFID localization system
 Ranging detection algorithm for indoor UWB channels and research activities relating to a UWB-RFID localization system Dr Choi Look LAW Founding Director Positioning and Wireless Technology Centre School
Antennas and Propagation
 CMPE 477 Wireless and Mobile Networks Lecture 3: Antennas and Propagation Antennas Propagation Modes Line of Sight Transmission Fading in the Mobile Environment Introduction An antenna is an electrical
Lecture - 06 Large Scale Propagation Models Path Loss
 Fundamentals of MIMO Wireless Communication Prof. Suvra Sekhar Das Department of Electronics and Communication Engineering Indian Institute of Technology, Kharagpur Lecture - 06 Large Scale Propagation
Simulating and Testing of Signal Processing Methods for Frequency Stepped Chirp Radar
 Test & Measurement Simulating and Testing of Signal Processing Methods for Frequency Stepped Chirp Radar Modern radar systems serve a broad range of commercial, civil, scientific and military applications.
Physics 476LW. Advanced Physics Laboratory - Microwave Optics
 Physics 476LW Advanced Physics Laboratory Microwave Radiation Introduction Setup The purpose of this lab is to better understand the various ways that interference of EM radiation manifests itself. However,
APPENDIX B. 4. DEFINITIONS, SYMBOLS AND ABBREVIATIONS For the purposes of the present document, the following terms and definitions apply.
 APPENDIX B COMPLIANCE MEASUREMENT PROCEDURES FOR UNLICENSED-NATIONAL INFORMATION INFRASTRUCTURE DEVICES OPERATING IN THE 5.25-5.35 GHz AND 5.47-5.725 GHz BANDS INCORPORATING DYNAMIC FREQUENCY SELECTION
Simulation of a Slope Stability Radar for Opencast Mining
 Simulation of a Slope Stability Radar for Opencast Mining Daniel John Tanser A dissertation submitted to the Department of Electrical Engineering, University of Cape Town, in fulfillment of the requirements
LE/ESSE Payload Design
 LE/ESSE4360 - Payload Design 4.3 Communications Satellite Payload - Hardware Elements Earth, Moon, Mars, and Beyond Dr. Jinjun Shan, Professor of Space Engineering Department of Earth and Space Science
Broadband Temporal Coherence Results From the June 2003 Panama City Coherence Experiments
 Broadband Temporal Coherence Results From the June 2003 Panama City Coherence Experiments H. Chandler*, E. Kennedy*, R. Meredith*, R. Goodman**, S. Stanic* *Code 7184, Naval Research Laboratory Stennis
Subsystems of Radar and Signal Processing and ST Radar
 Advance in Electronic and Electric Engineering. ISSN 2231-1297, Volume 3, Number 5 (2013), pp. 531-538 Research India Publications http://www.ripublication.com/aeee.htm Subsystems of Radar and Signal Processing
Antennas and Propagation. Chapter 6a: Propagation Definitions, Path-based Modeling
 Antennas and Propagation a: Propagation Definitions, Path-based Modeling Introduction Propagation How signals from antennas interact with environment Goal: model channel connecting TX and RX Antennas and
Lecture 6 SIGNAL PROCESSING. Radar Signal Processing Dr. Aamer Iqbal Bhatti. Dr. Aamer Iqbal Bhatti
 Lecture 6 SIGNAL PROCESSING Signal Reception Receiver Bandwidth Pulse Shape Power Relation Beam Width Pulse Repetition Frequency Antenna Gain Radar Cross Section of Target. Signal-to-noise ratio Receiver
Instruction manual for T3DS software. Tool for THz Time-Domain Spectroscopy. Release 4.0
 Instruction manual for T3DS software Release 4.0 Table of contents 0. Setup... 3 1. Start-up... 5 2. Input parameters and delay line control... 6 3. Slow scan measurement... 8 4. Fast scan measurement...
7. Experiment K: Wave Propagation
 7. Experiment K: Wave Propagation This laboratory will be based upon observing standing waves in three different ways, through coaxial cables, in free space and in a waveguide. You will also observe some
CLAUDIO TALARICO Department of Electrical and Computer Engineering Gonzaga University Spokane, WA ITALY
 Comprehensive study on the role of the phase distribution on the performances of the phased arrays systems based on a behavior mathematical model GIUSEPPE COVIELLO, GIANFRANCO AVITABILE, GIOVANNI PICCINNI,
Imaging System for Non-Destructive Testing of Glass Fibre Reinforced Plastics Martin NEZADAL 1,2, Jan SCHÜR 1, Lorenz-Peter SCHMIDT 1
 5th International Symposium on NDT in Aerospace, 13-15th November 2013, Singapore Imaging System for Non-Destructive Testing of Glass Fibre Reinforced Plastics Martin NEZADAL 1,2, Jan SCHÜR 1, Lorenz-Peter
Application of pulse compression technique to generate IEEE a-compliant UWB IR pulse with increased energy per bit
 Application of pulse compression technique to generate IEEE 82.15.4a-compliant UWB IR pulse with increased energy per bit Tamás István Krébesz Dept. of Measurement and Inf. Systems Budapest Univ. of Tech.
CHAPTER 8 ANTENNAS 1
 CHAPTER 8 ANTENNAS 1 2 Antennas A good antenna works A bad antenna is a waste of time & money Antenna systems can be very inexpensive and simple They can also be very expensive 3 Antenna Considerations
DESIGN OF GLOBAL SAW RFID TAG DEVICES C. S. Hartmann, P. Brown, and J. Bellamy RF SAW, Inc., 900 Alpha Drive Ste 400, Richardson, TX, U.S.A.
 DESIGN OF GLOBAL SAW RFID TAG DEVICES C. S. Hartmann, P. Brown, and J. Bellamy RF SAW, Inc., 900 Alpha Drive Ste 400, Richardson, TX, U.S.A., 75081 Abstract - The Global SAW Tag [1] is projected to be
GRENOUILLE.
 GRENOUILLE Measuring ultrashort laser pulses the shortest events ever created has always been a challenge. For many years, it was possible to create ultrashort pulses, but not to measure them. Techniques
Wave Sensing Radar and Wave Reconstruction
 Applied Physical Sciences Corp. 475 Bridge Street, Suite 100, Groton, CT 06340 (860) 448-3253 www.aphysci.com Wave Sensing Radar and Wave Reconstruction Gordon Farquharson, John Mower, and Bill Plant (APL-UW)
PRIME FOCUS FEEDS FOR THE COMPACT RANGE
 PRIME FOCUS FEEDS FOR THE COMPACT RANGE John R. Jones Prime focus fed paraboloidal reflector compact ranges are used to provide plane wave illumination indoors at small range lengths for antenna and radar
Chapter 5. Array of Star Spirals
 Chapter 5. Array of Star Spirals The star spiral was introduced in the previous chapter and it compared well with the circular Archimedean spiral. This chapter will examine the star spiral in an array
EXPERIMENTAL RESULTS FOR PCM/FM, TIER 1 SOQPSK, AND TIER II MULTI-H CPM WITH CMA EQUALIZATION
 EXPERIMENTAL RESULTS FOR PCM/FM, TIER 1 SOQPSK, AND TIER II MULTI-H CPM WITH CMA EQUALIZATION Item Type text; Proceedings Authors Geoghegan, Mark Publisher International Foundation for Telemetering Journal