We present an update of the local magnitude scale previously calibrated for Northwestern Turkey
|
|
|
- Nathan Wilcox
- 5 years ago
- Views:
Transcription
1 M L scale in Northwestern Turkey from 1999 Izmit aftershocks: updates D. Bindi 2, S. Parolai 1, E. Görgün 1, H. Grosser 1, C. Milkereit 1, M. Bohnhoff 1, E. Durukal 3 1 GeoForschungsZentrum Potsdam, Telegrafenberg, Potsdam, Germany. 2 Istituto Nazionale di Geofisica e Vulcanologia, via Bassini 15, Milano, Italy. 3 Bogazici University, Department of Earthquake Engineering, Istanbul, Turkey Abstract. We present an update of the local magnitude scale previously calibrated for Northwestern Turkey by Baumbach et al. (2003). The path coverage in the westernmost part of the analysed area has been increased, as well as the number of amplitudes for distance greater than 110 km. Furthermore, a set of recordings from accelerometric stations operated by the Kandilli Observatory and Earthquake Research Institute (KOERI) has been merged with the recordings by the Sapanca-Bolu and GermanTaskForce seismological networks. In all, 4047 recordings from 528 earthquakes recorded by 31 seismometers and 23 accelerometers are considered to calibrate the local magnitude scale over a hypocentral distance range from 10 to 190 km. By analyzing the unit covariance matrix and the resolution matrix, we show how the source-to-station geometries of the seismic and strong motion networks affect the uncertainties of the computed station corrections, attenuation coefficients, and magnitudes. The assumptions made concerning the reference station correction, and the change in the amplification for the Wood-Anderson torsion seismograph from 2800 to 2080 (Uhrhammer and Collins, 1990) introduced an offset of about 0.34 in the magnitudes with respect to Baumbach et al. (2003), with the updated local magnitude scale ranges from 0.50 to The distribution of the residuals with distance confirms that the extension of both the magnitude and distance ranges and the improved path coverage have preserved the high quality that characterized the data set analyzed by Baumbach et al. (2003).
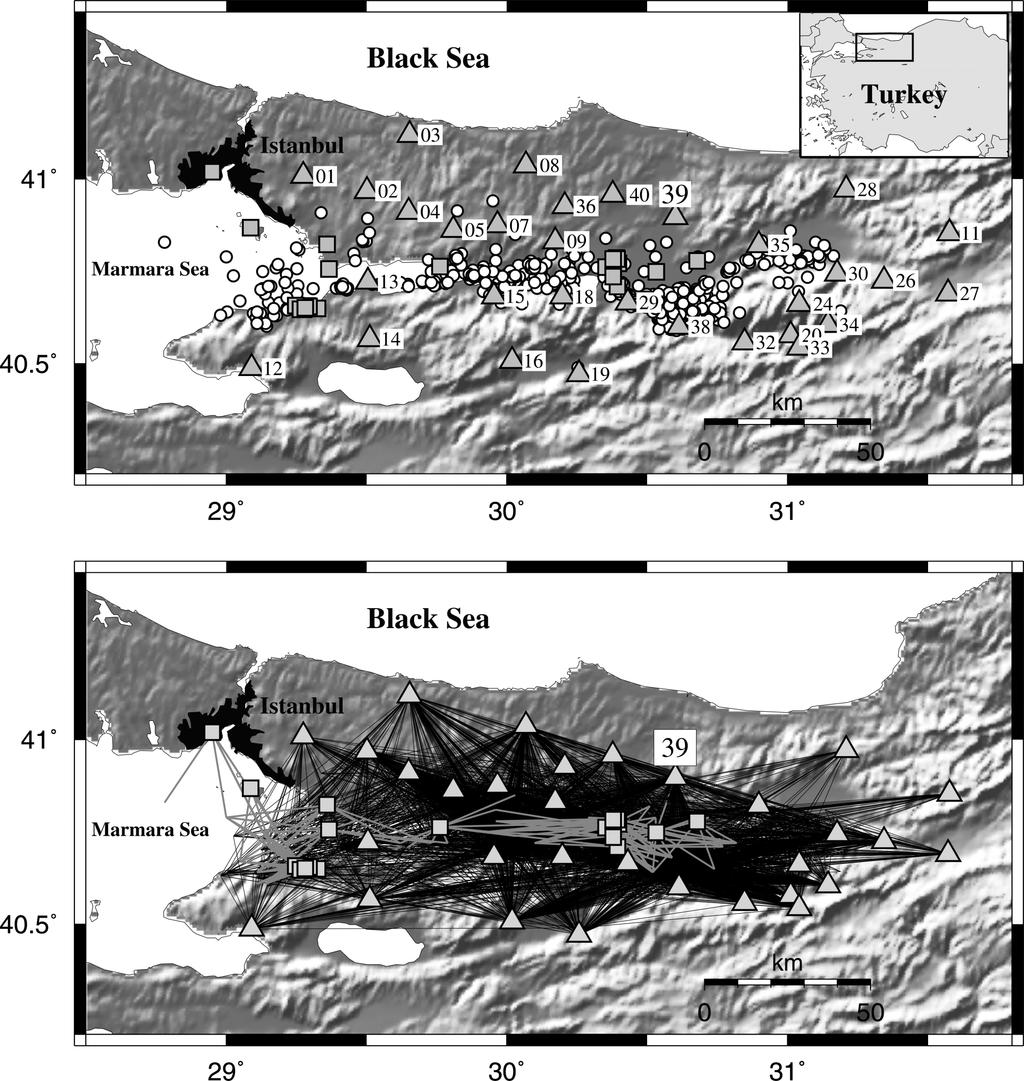
2 Introduction Within the framework of the Megacity project Istanbul ( working program link), new attenuation relationships for northwestern Turkey have to be derived. This requires a well-constrained magnitude scale that can be applied to a data set including not only the earthquakes recorded by the seismic networks deployed in Northwestern Turkey but also strong motion data. With this aim, in this work we update the local magnitude scale previously calibrated for Northwestern Turkey by Baumbach et al. (2003), hereinafter referred to as B03. The main improvements to results from B03 are an enlarged data base (in term of areal coverage and magnitude range) and improvements with regards to the inversion procedure. Furthermore, even if not considered in the location procedure, recordings form 23 accelerometers operated by the Kandilli Observatory and Earthquake Research Institute (KOERI) are also considered for calibrating the magnitude scale. The distribution of the earthquakes we selected allows the improvement of the path coverage in the westernmost part of the analysed area and to increase the sampling of the portion of the path greater than 110 km. We performed the inversion to calibrate the magnitude scale applying some constraints that are different from those applied by B03. Following an earlier study on site amplification effects (Parolai et al., 2004), we assume station 39 (Figure 1), which is installed on rock, as reference station for the Sapanca-Bolu (SABO) and German Task Force (GTF) seismic networks. Its magnitude station correction is set to zero, while in B03 the average station correction of the whole network was constrained to zero. This work is organized as follows: first, we describe the data set used to calibrate the magnitude scale and discuss the covariance and resolution matrices. Then, we calibrate the magnitude scale by computing the magnitude station corrections and the attenuation with distance coefficients. Finally, we compare our results with those from B03.
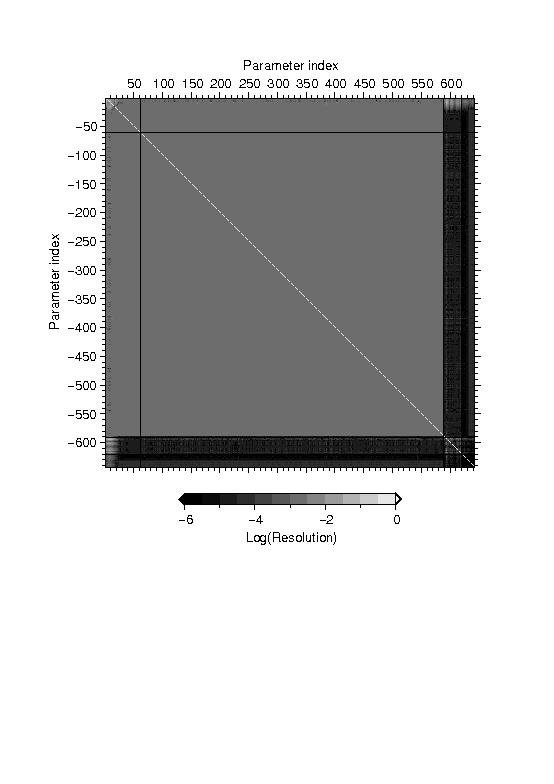
3 Data We calibrated a local magnitude scale using recordings of the 1999 Izmit aftershocks from both seismic (GTF and SABO) and strong motion (KOERI) networks. From the seismic stations belonging to the SABO network and to the temporary GTF network (B03), 3871 recordings of 490 earthquakes that occurred between August 22 and October 16, 1999 have been considered. The hypocentres have been computed using a standard location procedure (Klein, 2002) that considered the arrival times at stations of the GTF and SABO networks. We also considered 176 accelerograms from 48 earthquakes that occurred between August 21 and December 12, 1999 and recorded by the KOERI accelerometric network (( For these earthquakes, except for 10 that were also recorded by the SABO and GTF networks, we used the locations provided by the KOERI. In total, the magnitude scale has been calibrated by considering 4047 recordings relevant to 528 earthquakes and recorded by 31 seismometers and 23 accelerometers (Table 1). Figure 1 shows the source-to-station path coverage, over the distance range 10 to 190 km. With respect to the data set previously analysed by B03 (their Figure 1), the path coverage has been increased, especially in the westernmost part of the analyzed region, toward the Bay of Izmit. Moreover, the number of recordings having an hypocentral distance larger than 110 km has been increased from 105 to 178. Figures 2 and 3 show the resolution and the unit covariance matrices (Menke, 1984), computed for the design matrix relative to the standard non parametric functional for local magnitude calibration (e.g., Richter 1935; Savage and Anderson, 1995) ( R ) + S log A(R) = Ml + loga (1) o i where A is the measured maximum horizontal amplitude in millimetres read from the synthesized Wood-Anderson seismogram, R is the hypocentral distance, loga o is the distance-dependent attenuation curve and S is a station-dependent magnitude adjustment factor. The distance range from 10 to 190 km has been discretized into 60 segments of 3 km width. In equation (1), R i
4 represents the knots of the discretization and R i R<R i+1. We add several constraints to equation (1). The first, the loga o function is constrained to assume the value -2 at 17 km (Hutton and Boore, 1987) and to be a smooth function with distance, by constraining the second derivative to be small. To avoid the trade-off between station corrections and magnitudes, a constraint is also applied to S. In particular, we add two rows to the linear system derived from (1): in the first, we constrain S for station 39 (i.e., the reference station) to be zero while, in the second row, we require that the station corrections for the KOERI accelerometer network sum to zero, since a reference station is not available for the accelerometer network. The applied constraints to S mean that we assume a reference station for the SABO and GTF networks, as Parolai et al. (2004) did when determining the site amplification effects, whereas the reference for the KOERI network is the network average station correction. We considered station 39 as the reference because it is a permanent station installed on rock and it shows an almost flat site transfer function (Parolai et al., 2004). Moreover, it is the station having the second highest number of recordings in our data set (Table 1), and the back-azimuth of the earthquakes covers a wide range (about 180 o ). We performed a test by constraining to zero the average correction of stations 39 and 02. The latter is also a station installed on rock that recorded a large number of earthquakes and it is located far from station 39 (Figure 1). The calibrated magnitude scale (here not shown) was very similar to that obtained constraining to zero the correction of station 39 alone. Considering that, differently form station 02, station 39 is a permanent station that can be used as a reference also for future earthquake recordings in Northwestern Turkey, we will show and discuss only the scale calibrated using only station 39 as reference. The resolution and covariance matrices have been computed via a singular value decomposition of the design matrix (Press et al., 1992). The regularization needed to treat the ill-conditioned nature of the inverse problem has been performed cutting the singular values less than 0.01 times the maximum singular value. Figure 2 shows that the resolution matrix is almost diagonal, suggesting that the source-to-station geometry, the performed discretization and the applied constraints allow
5 us to resolve satisfactorily the unknowns. Only a weak trade-off exists between the station corrections and the attenuation with distance coefficients, especially for distances <40 km, that correspond to columns of the design matrix <11. Hereinafter we refer to each column of the design matrix as parameter index (PI). For these distances, a weak smearing between the coefficients of neighbour knots is also present. The unit covariance matrix shown in Figure 3 provides an image of the amplification of errors from the data to the solutions. The diagonal elements of the unit covariance matrix are also shown in Figure 4. For the attenuation coefficients (PI 61), the amplification factor for the variance (region (a) in Figure 4) are smaller than 0.2, and the increase with distance of the importance of the crosserrors propagating from adjacent intervals (off-diagonal elements) reflects the diminishment of the number of recordings with distance. The propagation of errors for the magnitude values can be split into two parts: for parameter index between 62 and 551, about 88% of the amplification factors for the variance are less than 0.5 (region (b) in Figure 4), and the cross-propagation of errors between different earthquakes is negligible. In contrast, for PI between 552 and 589 (region (c) in Figure 4) the cross-propagation of error is significant (about 50% larger than 0.5). The magnitudes in this parameter index range are relevant to earthquakes recorded by the KOERI network. Similar considerations can be drawn for the station corrections (PI > 589): while the propagation of error for the SABO and GTF station corrections ( 590 PI 620) is weak (region (d) in Figure 4), high propagation factors for the KOERI network are observed (region (e) in Figure 4). It is worth noting that the resolution and unit covariance matrices only depend upon the coefficient matrices of equation (1), that is the quality of the data does not affect these matrices. Therefore, starting from accelerometric and velocimetric data of comparable quality, we expect that the station corrections for the KOERI network and the magnitude of earthquakes only recorded by accelerometers will be affected by higher uncertainties than the results for GTF and SABO networks. This difference in the stability of the results is due to the different source-to-station geometry of the seismological and strong motion networks, and to the weak cross-information between them.
6 Local magnitude scale Figure 5 shows the results of the magnitude-scale calibration. The uncertainties for the distance coefficients, magnitudes and station corrections have been estimated by inverting 200 bootstrap replications of the data set (Efron, 1979; B03). The loga o attenuation function (Figure 5, top panel) is characterized by a decrease in the attenuation rate for path longer than 30 km, in fair agreement with B03, even if the updated loga o is about 0.1 units of magnitude smaller for distances in the range km. Furthermore, the computed attenuation function is affected by post-critical reflections from the crust-mantle boundary (Moho) for offsets of around 110 km, as described in B03. However, this feature is now better constrained by the improved sampling of distances >110 km. The standard deviation for loga o is less than 0.04 for distances up to 110 km, and less than 0.07 for longer paths. The obtained station corrections are shown in Figure 5 (middle panel) and in Table 1. As expected from the analysis of the unit covariance matrix, the standard deviation of the station corrections for the accelerometer network is higher than that for the seismometers, where the former varies from to 0.386, while the latter ranges between and The average station corrections of the GTF and SABO networks vary from to units of magnitude, confirming the importance of the role played by the local site effects (B03; Parolai et al., 2004). Table 1 also shows the station corrections found by B03. The average difference between theb03 and the station corrections of this study is 0.40±0.02. No particular behaviour for different group of stations (e.g. depending on the position) is observed, confirming that the choice of constraining only one rock station does not introduced any significant bias. This was confirmed also by tests performed considering more than one reference station. Finally, the average magnitudes within one standard deviation are show in Figure 5 (bottom panel). The mode and the median standard deviations are and 0.076, respectively. The earthquakes identified by values of the variable EventID greater than 490 are recorded only by accelerometers
7 and the standard deviation for these earthquakes is higher, in agreement with the properties of the unit covariance matrix previously shown. Conclusions An extended data-set containing records of the aftershocks of the 1999 Izmit earthquake have been used to update the local magnitude scale for north-western Turkey calibrated by B03. We consider not only the recordings from the SABO and GTF seismic network, but we also add recordings from the accelerometric network operated by KOERI. The results for the strong motion network are affected by higher uncertainties, determined both by the lower quality characteristics of the resolution and covariance matrices for KOERI recordings and by the higher uncertainties affecting the input data (e.g., locations). Despite the higher uncertainties, we retained the accelerometric recordings because the calibrated scale provides a link to the accelerometric database that can be exploited for future studies on attenuation relationships for strong ground motion parameters. The attenuation with distance curve loga 0 and the station corrections have been used to re-compute the magnitudes for the selected earthquakes, evaluated as the average of the station magnitudes. Figure 6 shows the magnitude versus distance distribution (top panel) as well as the distribution of the standard deviation of the average magnitude with the number of available recordings (middle panel). The magnitudes range from 0.50 to 5.91, and the standard deviation of most of the earthquakes having at least 9 recordings is less than 0.1. In Figure 6 (bottom panel) the comparison between the magnitudes computed using the results from B03 (Ml B03 ) and from this study (Ml this study) is shown. The best fitting line in the least squares sense is Ml B03 = (0.972 ± 0.004) Ml thistudy +(0.340 ±0.001). From equation (1), the offset of 0.34 can be ascribed to (1) the difference in the Wood Anderson magnification, since the change from 2800 to 2080 (Uhrhammer and Collins, 1990) led to an offset of 0.129, (2) the difference in the average station corrections for the SABO and GTF networks (that is, 0 in B03 and in this study) and (3) the difference of 0.1 magnitude unit between the attenuation functions.
8 Finally, Figure 7 shows the magnitude residuals computed for both the B03 magnitude scale (attenuation function and station corrections) and the scale updated in the present study. The distribution of the residuals with distance confirms that the extension of both the magnitude and distance ranges, and the improved path coverage have been obtained while still preserving the high quality that characterized the data set analyzed by B03. Furthermore, the updated magnitude scale better describes the attenuation properties in the analyzed area for distances larger than 110 km. Acknowledgements We thank M. Baumbach, S. Karakisa, E. Günther, and S. Zünbül for their contribution to the present study. The authors express their gratitude to the Hannover Rückversicherung AG for their significant financial support of the field mission. K. Fleming kindly improved our English. The figures were generated using the Wessel and Smith (1991) software. Part of this work was conducted during visits by one author (D. B.) to the GeoForschungsZentrum (GFZ) in Potsdam, that were partially funded by the GFZ. References Baumbach, M., D. Bindi, H. Grosser, C. Milkereit, S. Parolai, R.J. Wang, S. Karakisa, S. Zünbül, and J. Zschau (2003). Calibration of an M L scale in Northwestern Turkey from 1999 Izmit aftershocks, Bull. Seism. Soc. Am., 93, 5, Efron, B. (1979). Bootstrap methods, another look at the jackknife, Ann. Stat. 7, Hutton, L. K., and D. M. Boore (1987). The Ml scale in southern California, Bull. Seism. Soc. Am., 77, 6, Klein, F. W. (2002). User s Guide to HYPOINVERSE-2000, a Fortran Program to Solve for Earthquake Locations and Magnitudes, Open-File Report , U.S. Geological Survey, 123 pp.
9 Menke, W. (1984) Geophysical Data Analysis: Discrete Inverse Theory. Academic Press, New York. Parolai S., D. Bindi, M. Baumbach, H. Grosser, C. Milkereit, S. Karakisa, S. Zünbül (2004), Comparison of different site response estimation techniques using aftershocks of the 1999 Izmit earthquake, Bull. Seism. Soc. Am., 94, 3, Press, W.H., Teulkolsky, S.A., Vetterling, W.T. and Flannery, B.P. (1992) Numerical Recipes in C: The Art of Scientific Computing, University Press, Cambridge. Richter, C. F An instrumental earthquake magnitude scale. Bull. Seism. Soc. Am., 25, Savage, M. K., and J. G. Anderson (1995). A local magnitude scale for the Western Basin- Eastern Sierra Nevada from Synthetic Wood-Anderson seismograms. Bull. Seism. Soc. Am., 85, Uhrhammer, R. A., and E. R. Collins (1990). Synthesis of Wood-Anderson seismograms from broadband digital records, Bull. Seism. Soc. Am., 80, Wessel, P., and W.H.F. Smith (1991). Free software helps map and display data, Eos. Trans. AGU 72 (41), 441,
10 Table 1. ID latitude longitude S std Nr S B03 Network GTF GTF GTF GTF not used GTF GTF GTF GTF GTF GTF GTF GTF not used GTF GTF GTF GTF GTF not used GTF GTF GTF SABO SABO SABO SABO
11 Table 1 continue ID latitude longitude S std Nr S B03 Network SABO SABO SABO not used SABO SABO SABO SABO YPT not used KOERI 10_ not used KOERI 14_ not used KOERI 17_ not used KOERI 09_ not used KOERI 11_ not used KOERI 15_ not used KOERI 12_ not used KOERI GEN not used KOERI SEK not used KOERI ARC not used KOERI DAR not used KOERI HAS not used KOERI FAT not used KOERI Has not used KOERI Bag not used KOERI Kas not used KOERI RAD not used KOERI Ruz not used KOERI GIR not used KOERI Tar not used KOERI Hil not used KOERI Bah not used KOERI Stations used in this study. S and std are the average magnitude station correction and its standard deviation, respectively. Nr is the number of recordings used for the magnitude calibration. S B03 is the average magnitude correction found by Baumabach et al., 2003 (see their Table 2).
12 Figure captions Figure 1. Analyzed data set. Top: SABO-GTF seismic (triangles) and KOERI strong motion (squares) stations. The identification number (staton ID) for the seismic stations (Table 1) are also shown. Station 39 is the reference station for the magnitude scale. The circles represent the locations of the considered earthquakes. Bottom: the black and gray lines are the path coverage for the seismic and strong motion neworks, respectivelty. Figure 2. Resolution matrix: the logarithm of the values are shown. The parameter indexes within the ranges 1-61, , and represent the attenuation coefficients, the magnitude values and the station corrections, respectively. Figure 3. Unit covariance matrix: the logarithm of the values are shown. Figure 4. Diagonal elements of the unit covariance matrix. a): values for the attenuation coefficients; b): values for the magnitudes of the earthquakes recorded by the GTF and SABO networks; c): values for the magnitudes of the earthquakes recorded by the KOERI network; d): values for the station corrections of the GTF and SABO networks; e): values for the station corrections of the KOERI network. Figure 5. Results of the magnitude calibration. Top: comparison between the obtained LogAo function (vertical bars) and B03 (grey line). Middle: station correction ± one standard deviation. Bottom: magnitude values ± one standard deviation. Figure 6. Top: magnitude versus distance. Middle: magnitude standard deviations versus the number of used recordings for each earthquake. Bottom: comparison between the magnitudes computed using the equation of B03 and of this study. The best fit in a least squares sense is also shown. Figure 7. Magnitude residuals versus distance for the scale calibrated in this study (top) and by B03(bottom).
13 Figure 1
14 Figure 2
15 Figure 3
16 Figure 4
17 Figure 5
18 Figure 6
19 Figure 7
A COMPARISON OF SITE-AMPLIFICATION ESTIMATED FROM DIFFERENT METHODS USING A STRONG MOTION OBSERVATION ARRAY IN TANGSHAN, CHINA
 A COMPARISON OF SITE-AMPLIFICATION ESTIMATED FROM DIFFERENT METHODS USING A STRONG MOTION OBSERVATION ARRAY IN TANGSHAN, CHINA Wenbo ZHANG 1 And Koji MATSUNAMI 2 SUMMARY A seismic observation array for
Swiss instrumental local magnitudes
 Appendix H: Swiss instrumental local magnitudes Nicholas Deichmann, SED, 2009/12/17 Introduction In the following we document procedures followed at the SED for calculating local magnitudes from instrumental
Spatial coherency of earthquake-induced ground accelerations recorded by 100-Station of Istanbul Rapid Response Network
 Spatial coherency of -induced ground accelerations recorded by 100-Station of Istanbul Rapid Response Network Ebru Harmandar, Eser Cakti, Mustafa Erdik Kandilli Observatory and Earthquake Research Institute,
Simulated Strong Ground Motion in Southern China based on Regional Seismographic Data and Stochastic Finite-Fault Model
 Simulated Strong Ground Motion in Southern China based on Regional Seismographic Data and Stochastic Finite-Fault Model Yuk Lung WONG and Sihua ZHENG ABSTRACT The acceleration time histories of the horizontal
TOWARD A RAYLEIGH WAVE ATTENUATION MODEL FOR EURASIA AND CALIBRATING A NEW M S FORMULA
 TOWARD A RAYLEIGH WAVE ATTENUATION MODEL FOR EURASIA AND CALIBRATING A NEW M S FORMULA Xiaoning (David) Yang 1, Anthony R. Lowry 2, Anatoli L. Levshin 2 and Michael H. Ritzwoller 2 1 Los Alamos National
Estimating the epicenters of local and regional seismic sources, using the circle and chord method (Tutorial with exercise by hand and movies)
") Topic Estimating the epicenters of local and regional seismic sources, using the circle and chord method (Tutorial with exercise by hand and movies) Author Version Peter Bormann (formerly GFZ German Research
Topic Estimating the epicenters of local and regional seismic sources, using the circle and chord method (Tutorial with exercise by hand and movies) Author Version Peter Bormann (formerly GFZ German Research
Short Notes Characterization of a Continuous, Very Narrowband Seismic Signal near 2.08 Hz
 Bulletin of the Seismological Society of America, 91, 6, pp. 1910 1916, December 2001 Short Notes Characterization of a Continuous, Very Narrowband Seismic Signal near 2.08 Hz by Kelly H. Liu and Stephen
Site-specific seismic hazard analysis
 Site-specific seismic hazard analysis ABSTRACT : R.K. McGuire 1 and G.R. Toro 2 1 President, Risk Engineering, Inc, Boulder, Colorado, USA 2 Vice-President, Risk Engineering, Inc, Acton, Massachusetts,
Application of Multi-channel Wiener Filters to the Suppression of Ambient Seismic Noise in Passive Seismic Arrays
 Application of Multi-channel Wiener Filters to the Suppression of Ambient Seismic Noise in Passive Seismic Arrays J. Wang 1, F. Tilmann 1, R. S. White 1, H. Soosalu 1 and P. Bordoni 2 1. Bullard Laboratories,
27th Seismic Research Review: Ground-Based Nuclear Explosion Monitoring Technologies
 SOURCE AND PATH EFFECTS ON REGIONAL PHASES IN INDIA FROM AFTERSHOCKS OF THE JANUARY 26, 2001, BHUJ EARTHQUAKE Arthur Rodgers 1, Paul Bodin 2, Luca Malagnini 3, Kevin Mayeda 1, and Aybige Akinci 3 Lawrence
Site Response from Incident Pnl Waves
 Bulletin of the Seismological Society of America, Vol. 94, No. 1, pp. 357 362, February 2004 Site Response from Incident Pnl Waves by Brian Savage and Don V. Helmberger Abstract We developed a new method
Performance of the GSN station SSE-IC,
 Performance of the GSN station SSE-IC, 1996-2009 A report in a series documenting the status of the Global Seismographic Network WQC Report 2010:10 March 4, 2010 Göran Ekström and Meredith Nettles Waveform
EXPLOITING AMBIENT NOISE FOR SOURCE CHARACTERIZATION OF REGIONAL SEISMIC EVENTS
 EXPLOITING AMBIENT NOISE FOR SOURCE CHARACTERIZATION OF REGIONAL SEISMIC EVENTS ABSTRACT Michael H. Ritzwoller, Anatoli L. Levshin, and Mikhail P. Barmin University of Colorado at Boulder Sponsored by
Geophysical Journal International
 Geophysical Journal International Geophys. J. Int. (2014) 197, 458 463 Advance Access publication 2014 January 20 doi: 10.1093/gji/ggt516 An earthquake detection algorithm with pseudo-probabilities of
Seismic interference noise attenuation based on sparse inversion Zhigang Zhang* and Ping Wang (CGG)
") Seismic interference noise attenuation based on sparse inversion Zhigang Zhang* and Ping Wang (CGG) Summary In marine seismic acquisition, seismic interference (SI) remains a considerable problem when
Seismic interference noise attenuation based on sparse inversion Zhigang Zhang* and Ping Wang (CGG) Summary In marine seismic acquisition, seismic interference (SI) remains a considerable problem when
28th Seismic Research Review: Ground-Based Nuclear Explosion Monitoring Technologies
 8th Seismic Research Review: Ground-Based Nuclear Explosion Monitoring Technologies A LOWER BOUND ON THE STANDARD ERROR OF AN AMPLITUDE-BASED REGIONAL DISCRIMINANT D. N. Anderson 1, W. R. Walter, D. K.
Constructing response curves: Introduction to the BODE-diagram
 Topic Constructing response curves: Introduction to the BODE-diagram Author Jens Bribach, GFZ German Research Centre for Geosciences, Dept. 2: Physics of the Earth, Telegrafenberg, D-14473 Potsdam, Germany;
29th Monitoring Research Review: Ground-Based Nuclear Explosion Monitoring Technologies
 SEISMIC SOURCE LOCATIONS AND PARAMETERS FOR SPARSE NETWORKS BY MATCHING OBSERVED SEISMOGRAMS TO SEMI-EMPIRICAL SYNTHETIC SEISMOGRAMS: APPLICATIONS TO LOP NOR AND NORTH KOREA David Salzberg and Margaret
Retrieving Focal Mechanism of Earthquakes Using the CAP Method
 Retrieving Focal Mechanism of Earthquakes Using the CAP Method Hongfeng Yang April 11, 2013 1 Introduction Waveforms recorded at a seismic station, W (t), compose of three components: W (t) = S(t) G(t)
Magnitude & Intensity
 Magnitude & Intensity Lecture 7 Seismometer, Magnitude & Intensity Vibrations: Simple Harmonic Motion Simplest vibrating system: 2 u( x) 2 + ω u( x) = 0 2 t x Displacement u ω is the angular frequency,
29th Monitoring Research Review: Ground-Based Nuclear Explosion Monitoring Technologies REGIONAL EVENT IDENTIFICATION RESEARCH IN ASIA
 REGIONAL EVENT IDENTIFICATION RESEARCH IN ASIA Hans E. Hartse, George E. Randall, Xiaoning (David) Yang, and Charlotte A. Rowe Los Alamos National Laboratory Sponsored by National Nuclear Security Administration
Tomostatic Waveform Tomography on Near-surface Refraction Data
 Tomostatic Waveform Tomography on Near-surface Refraction Data Jianming Sheng, Alan Leeds, and Konstantin Osypov ChevronTexas WesternGeco February 18, 23 ABSTRACT The velocity variations and static shifts
This presentation was prepared as part of Sensor Geophysical Ltd. s 2010 Technology Forum presented at the Telus Convention Center on April 15, 2010.
 This presentation was prepared as part of Sensor Geophysical Ltd. s 2010 Technology Forum presented at the Telus Convention Center on April 15, 2010. The information herein remains the property of Mustagh
27th Seismic Research Review: Ground-Based Nuclear Explosion Monitoring Technologies
 IMPROVING M s ESTIMATES BY CALIBRATING VARIABLE PERIOD MAGNITUDE SCALES AT REGIONAL DISTANCES Heather Hooper 1, Ileana M. Tibuleac 1, Michael Pasyanos 2, and Jessie L. Bonner 1 Weston Geophysical Corporation
2008 Monitoring Research Review: Ground-Based Nuclear Explosion Monitoring Technologies
 ATTENUATION TOMOGRAPHY OF NORTHERN CALIFORNIA AND THE YELLOW SEA/KOREAN PENINSULA FROM CODA-SOURCE NORMALIZED AND DIRECT LG AMPLITUDES Sean R. Ford 1,3, Douglas S. Dreger 1, William S. Phillips 2, William
ON THE METROLOGICAL SUPPORT OF THE LONG-PERIOD SEISMOLOGY
 ON THE METROLOGICAL SUPPORT OF THE LONG-PERIOD SEISMOLOGY K.V. Kislov, V.V. Gravirov Institute of Earthquake Prediction Theory and Mathematical Geophysics, Russian Academy of Science (IEPT RAS), Profsoyuznaya
A hybrid method of simulating broadband ground motion: A case study of the 2006 Pingtung earthquake, Taiwan
 A hybrid method of simulating broadband ground motion: A case study of the 2006 Pingtung earthquake, Taiwan Y. T. Yen, C. T. Cheng, K. S. Shao & P. S. Lin Sinotech Engineering Consultants Inc., Taipei,
Surface wave analysis for P- and S-wave velocity models
 Distinguished Lectures in Earth Sciences, Napoli, 24 Maggio 2018 Surface wave analysis for P- and S-wave velocity models Laura Valentina Socco, Farbod Khosro Anjom, Cesare Comina, Daniela Teodor POLITECNICO
Complementary PPT tutorial to IS 8.7:
 Complementary PPT tutorial to IS 8.7: Assessment of theoretical approaches to seismic network optimization DOI: 10.2312/GFZ.NMSOP-2_IS_8.7 by Peter Bormann Formerly: Helmholtz Centre Potsdam, GFZ German
Characterizing average properties of Southern California ground motion envelopes
 Characterizing average properties of Southern California ground motion envelopes G. Cua and T. H. Heaton Abstract We examined ground motion envelopes of horizontal and vertical acceleration, velocity,
KEYWORDS Earthquakes; MEMS seismic stations; trigger data; warning time delays. Page 144
 Event Detection Time Delays from Community Earthquake Early Warning System Experimental Seismic Stations implemented in South Western Tanzania Between August 2012 and December 2013 Asinta Manyele 1, Alfred
28th Seismic Research Review: Ground-Based Nuclear Explosion Monitoring Technologies
 SEISMIC SOURCE LOCATIONS AND PARAMETERS FOR SPARSE NETWORKS BY MATCHING OBSERVED SEISMOGRAMS TO SEMI-EMPIRICAL SYNTHETIC SEISMOGRAMS: IMPROVEMENTS TO THE PHASE SPECTRUM PARAMETERIZATION David. Salzberg
Analysis of PS-to-PP amplitude ratios for seismic reflector characterisation: method and application
 Analysis of PS-to-PP amplitude ratios for seismic reflector characterisation: method and application N. Maercklin, A. Zollo RISSC, Italy Abstract: Elastic parameters derived from seismic reflection data
Anisotropic Frequency-Dependent Spreading of Seismic Waves from VSP Data Analysis
 Anisotropic Frequency-Dependent Spreading of Seismic Waves from VSP Data Analysis Amin Baharvand Ahmadi* and Igor Morozov, University of Saskatchewan, Saskatoon, Saskatchewan amin.baharvand@usask.ca Summary
29th Monitoring Research Review: Ground-Based Nuclear Explosion Monitoring Technologies
 REGIONAL ANALYSIS OF LG ATTENUATION: COMPARISON OF 1-D METHODS IN NORTHERN CALIFORNIA AND APPLICATION TO THE YELLOW SEA/KOREAN PENINSULA Sean R. Ford 1, Douglas S. Dreger 1, Kevin M. Mayeda 2, William
Some observations of data quality at global seismic stations
 Some observations of data quality at global seismic stations Meredith Nettles and Göran Ekström Global CMT Project Waveform Quality Center SITS, 2009/11/10 1. Data quality control using signals 1a. Sensor
A TECHNIQUE FOR AUTOMATIC DETECTION OF ONSET TIME OF P- AND S-PHASES IN STRONG MOTION RECORDS
 13 th World Conference on Earthquake Engineering Vancouver, B.C., Canada August 1-6, 2004 Paper No. 786 A TECHNIQUE FOR AUTOMATIC DETECTION OF ONSET TIME OF P- AND S-PHASES IN STRONG MOTION RECORDS Takashi
ON THE VALIDITY OF THE NOISE MODEL OF QUANTIZATION FOR THE FREQUENCY-DOMAIN AMPLITUDE ESTIMATION OF LOW-LEVEL SINE WAVES
 Metrol. Meas. Syst., Vol. XXII (215), No. 1, pp. 89 1. METROLOGY AND MEASUREMENT SYSTEMS Index 3393, ISSN 86-8229 www.metrology.pg.gda.pl ON THE VALIDITY OF THE NOISE MODEL OF QUANTIZATION FOR THE FREQUENCY-DOMAIN
The COMPLOC Earthquake Location Package
 The COMPLOC Earthquake Location Package Guoqing Lin and Peter Shearer Guoqing Lin and Peter Shearer Scripps Institution of Oceanography, University of California San Diego INTRODUCTION This article describes
Ground-Motion Scaling in the Apennines (Italy)
") Bulletin of the Seismological Society of America, 90, 4, pp. 1062 1081, August 2000 Ground-Motion Scaling in the Apennines (Italy) by Luca Malagnini, Robert B. Herrmann, and Massimo Di Bona Abstract Regressions
Bulletin of the Seismological Society of America, 90, 4, pp. 1062 1081, August 2000 Ground-Motion Scaling in the Apennines (Italy) by Luca Malagnini, Robert B. Herrmann, and Massimo Di Bona Abstract Regressions
REXELite, online record selection for the ITalian ACcelerometric Archive
 REXELite, online record selection for the ITalian ACcelerometric Archive I. Iervolino & C. Galasso Dipartimento di Ingegneria Strutturale, Università degli Studi di Napoli Federico II, Naples, Italy. R.
Contents of this file 1. Text S1 2. Figures S1 to S4. 1. Introduction
 Supporting Information for Imaging widespread seismicity at mid-lower crustal depths beneath Long Beach, CA, with a dense seismic array: Evidence for a depth-dependent earthquake size distribution A. Inbal,
GCM mapping Vildbjerg - HydroGeophysics Group - Aarhus University
 GCM mapping Vildbjerg - HydroGeophysics Group - Aarhus University GCM mapping Vildbjerg Report number 06-06-2017, June 2017 Indholdsfortegnelse 1. Project information... 2 2. DUALEM-421s... 3 2.1 Setup
3-D tomographic Q inversion for compensating frequency dependent attenuation and dispersion. Kefeng Xin* and Barry Hung, CGGVeritas
 P-75 Summary 3-D tomographic Q inversion for compensating frequency dependent attenuation and dispersion Kefeng Xin* and Barry Hung, CGGVeritas Following our previous work on Amplitude Tomography that
RAPID MAGITUDE DETERMINATION FOR TSUNAMI WARNING USING LOCAL DATA IN AND AROUND NICARAGUA
 RAPID MAGITUDE DETERMINATION FOR TSUNAMI WARNING USING LOCAL DATA IN AND AROUND NICARAGUA Domingo Jose NAMENDI MARTINEZ MEE16721 Supervisor: Akio KATSUMATA ABSTRACT The rapid magnitude determination of
Hector Mine, California, earthquake
 179 Chapter 5 16 October 1999 M=7.1 Hector Mine, California, earthquake The 1999 M w 7.1 Hector Mine earthquake sequence was the most recent of a series of moderate to large earthquakes on the Eastern
SPECTRAL ANALYSIS OF SOURCE PARAMETERS OF THE 1999 KOCAELI AND DÜZCE EARTHQUAKE AFTERSHOCK SEQUENCES
 13 th World Conference on Earthquake Engineering Vancouver, B.C., Canada August 1-6, 24 Paper No. 421 SPECTRAL ANALYSIS OF SOURCE PARAMETERS OF THE 1999 KOCAELI AND DÜZCE EARTHQUAKE AFTERSHOCK SEQUENCES
Polarization Filter by Eigenimages and Adaptive Subtraction to Attenuate Surface-Wave Noise
 Polarization Filter by Eigenimages and Adaptive Subtraction to Attenuate Surface-Wave Noise Stephen Chiu* ConocoPhillips, Houston, TX, United States stephen.k.chiu@conocophillips.com and Norman Whitmore
Strong Motion Data: Structures
 Strong Motion Data: Structures Adam Pascale Chief Technology Officer, Seismology Research Centre a division of ESS Earth Sciences Treasurer, Australian Earthquake Engineering Society Why monitor buildings?
Amplitude balancing for AVO analysis
 Stanford Exploration Project, Report 80, May 15, 2001, pages 1 356 Amplitude balancing for AVO analysis Arnaud Berlioux and David Lumley 1 ABSTRACT Source and receiver amplitude variations can distort
Chapter 8 3 September 2002 M = 4.75 Yorba Linda, California, earthquake
 272 Chapter 8 3 September 2002 M = 4.75 Yorba Linda, California, earthquake The M = 4.75 Yorba Linda, California earthquake occurred at 07 : 08 : 51.870 UT on 3 September 2002 in Orange County, in a densely
Dependence of GMRotI50 on Tmax4Penalty for the penalty function: Recommend use RotD50 rather than GMRotI50
 Dependence of GMRotI5 on Tmax4Penalty for the penalty function: Recommend use RotD5 rather than GMRotI5 David M. Boore 24 June 21 Last year Norm Abrahamson suggested a new measure of ground motion that
Estimation of the Earth s Impulse Response: Deconvolution and Beyond. Gary Pavlis Indiana University Rick Aster New Mexico Tech
 Estimation of the Earth s Impulse Response: Deconvolution and Beyond Gary Pavlis Indiana University Rick Aster New Mexico Tech Presentation for Imaging Science Workshop Washington University, November
Coda Waveform Correlations
 Chapter 5 Coda Waveform Correlations 5.1 Cross-Correlation of Seismic Coda 5.1.1 Introduction In the previous section, the generation of the surface wave component of the Green s function by the correlation
Short Note Orientation-Independent, Nongeometric-Mean Measures of Seismic Intensity from Two Horizontal Components of Motion
 Bulletin of the Seismological Society of America, Vol. 100, No. 4, pp. 1830 1835, August 2010, doi: 10.1785/0120090400 Short Note Orientation-Independent, Nongeometric-Mean Measures of Seismic Intensity
Supplementary Materials for
 advances.sciencemag.org/cgi/content/full/1/11/e1501057/dc1 Supplementary Materials for Earthquake detection through computationally efficient similarity search The PDF file includes: Clara E. Yoon, Ossian
TitleApplication of MEMS accelerometer t. AIZAWA, Takao; KIMURA, Toshinori; M Toshifumi; TAKEDA, Tetsuya; ASANO,
 TitleApplication of MEMS accelerometer t Author(s) AIZAWA, Takao; KIMURA, Toshinori; M Toshifumi; TAKEDA, Tetsuya; ASANO, Citation International Journal of the JCRM ( Issue Date 2008-12 URL http://hdl.handle.net/2433/85166
TOWARD A RAYLEIGH WAVE ATTENUATION MODEL FOR ASIA AND SURROUNDING REGIONS. Sponsored by National Nuclear Security Administration
 TOWARD A RAYLEIGH WAVE ATTENUATION MODEL FOR ASIA AND SURROUNDING REGIONS Anatoli L. Levshin 1, Mikhail P. Barmin 1, Xiaoning Yang 2, Michael H. Ritzwoller 1 University of Colorado at Boulder 1, Los Alamos
Determination of tsunami sources using deep ocean wave records
 Bull. Nov. Comp. Center, Math. Model. in Geoph., 11 (26), 53 63 c 26 NCC Publisher Determination of tsunami sources using deep ocean wave records A.Yu. Bezhaev, M.M. Lavrentiev (jr.), An.G. Marchuk, V.V.
SPECTRAL ANALYSIS OF RECENT ISTANBUL (TURKEY) TERRORIST ATTACK
 TERRORIST ATTACK") SPECTRAL ANALYSIS OF RECENT ISTANBUL (TURKEY) TERRORIST ATTACK ABSTRACT: H. Livaoğlu 1, E. Yavuz 1, F. Sertçelik 2, T. S. Irmak 2, İ. Sertçelik 2, C. Kurtuluş 3 1 Arş. Gör., Jeofizik Müh. Bölümü, Kocaeli
SPECTRAL ANALYSIS OF RECENT ISTANBUL (TURKEY) TERRORIST ATTACK ABSTRACT: H. Livaoğlu 1, E. Yavuz 1, F. Sertçelik 2, T. S. Irmak 2, İ. Sertçelik 2, C. Kurtuluş 3 1 Arş. Gör., Jeofizik Müh. Bölümü, Kocaeli
ON LOW-FREQUENCY ERRORS OF UNIFORMLY MODULATED FILTERED WHITE-NOISE MODELS FOR GROUND MOTIONS
 EARTHQUAKE ENGNEERNG AND STRUCTURAL DYNAMCS, VOL. 16, 381-388 (1988) ON LOW-FREQUENCY ERRORS OF UNFORMLY MODULATED FLTERED WHTE-NOSE MODELS FOR GROUND MOTONS ERDAL SAFAK* AND DAVD M. BOORE+ U.S. Geological
Effects of Surface Geology on Seismic Motion
 th IASPEI / IAEE International Symposium: Effects of Surface Geology on Seismic Motion August 6, University of California Santa Barbara COMPARISON BETWEEN V S AND SITE PERIOD AS SITE PARAMETERS IN GROUND-MOTION
Earthquake duration magnitudes in southeast Australia, accounting for site, seismograph and source
 AGSO Journal of Australian Geology & Geophysics, 15(4), 469-474 Commonwealth of Australia 1995 Earthquake duration magnitudes in southeast Australia, accounting for site, seismograph and source J. Wilkie,1
29th Monitoring Research Review: Ground-Based Nuclear Explosion Monitoring Technologies
 BASIC RESEARCH ON SEISMIC AND INFRASONIC MONITORING OF THE EUROPEAN ARCTIC ABSTRACT Frode Ringdal, Tormod Kværna, Svein Mykkeltveit, Steven J. Gibbons, and Johannes Schweitzer NORSAR Sponsored by Army
Here I briefly describe the daily seismicity analysis procedure: Table 1
 A: More on Daily Seismicity Analysis Here I briefly describe the daily seismicity analysis procedure: Table 1 The broadband continuous data set was acquired as hour-long files. For this purpose I wrote
Iterative least-square inversion for amplitude balancing a
 Iterative least-square inversion for amplitude balancing a a Published in SEP report, 89, 167-178 (1995) Arnaud Berlioux and William S. Harlan 1 ABSTRACT Variations in source strength and receiver amplitude
A robust x-t domain deghosting method for various source/receiver configurations Yilmaz, O., and Baysal, E., Paradigm Geophysical
 A robust x-t domain deghosting method for various source/receiver configurations Yilmaz, O., and Baysal, E., Paradigm Geophysical Summary Here we present a method of robust seismic data deghosting for
THE SPECTRAL METHOD FOR PRECISION ESTIMATE OF THE CIRCLE ACCELERATOR ALIGNMENT
 II/201 THE SPECTRAL METHOD FOR PRECISION ESTIMATE OF THE CIRCLE ACCELERATOR ALIGNMENT Jury Kirochkin Insitute for High Energy Physics, Protvino, Russia Inna Sedelnikova Moscow State Building University,
Microtremor Array Measurements and Three-component Microtremor Measurements in San Francisco Bay Area
 Microtremor Array Measurements and Three-component Microtremor Measurements in San Francisco Bay Area K. Hayashi & D. Underwood Geometrics, Inc., United States SUMMARY: Microtremor array measurements and
Investigating the low frequency content of seismic data with impedance Inversion
 Investigating the low frequency content of seismic data with impedance Inversion Heather J.E. Lloyd*, CREWES / University of Calgary, Calgary, Alberta hjelloyd@ucalgary.ca and Gary F. Margrave, CREWES
Optimal, real-time earthquake location for early warning
 Optimal, real-time earthquake location for early warning Claudio Satriano RISSC-Lab, Dipartimento di Scienze Fisiche, Università di Napoli Federico II Anthony Lomax Anthony Lomax Scientific Software, Mouans-Sartoux,
A multi-window algorithm for real-time automatic detection and picking of P-phases of microseismic events
 A multi-window algorithm for real-time automatic detection and picking of P-phases of microseismic events Zuolin Chen and Robert R. Stewart ABSTRACT There exist a variety of algorithms for the detection
FOURIER SPECTRA AND KAPPA 0 (Κ 0 ) ESTIMATES FOR ROCK STATIONS IN THE NGA-WEST2 PROJECT
 ESTIMATES FOR ROCK STATIONS IN THE NGA-WEST2 PROJECT") 10NCEE Tenth U.S. National Conference on Earthquake Engineering Frontiers of Earthquake Engineering July 21-25, 2014 Anchorage, Alaska FOURIER SPECTRA AND KAPPA 0 (Κ 0 ) ESTIMATES FOR ROCK STATIONS IN
10NCEE Tenth U.S. National Conference on Earthquake Engineering Frontiers of Earthquake Engineering July 21-25, 2014 Anchorage, Alaska FOURIER SPECTRA AND KAPPA 0 (Κ 0 ) ESTIMATES FOR ROCK STATIONS IN
Development of an improved flood frequency curve applying Bulletin 17B guidelines
 21st International Congress on Modelling and Simulation, Gold Coast, Australia, 29 Nov to 4 Dec 2015 www.mssanz.org.au/modsim2015 Development of an improved flood frequency curve applying Bulletin 17B
Real Time Deconvolution of In-Vivo Ultrasound Images
 Paper presented at the IEEE International Ultrasonics Symposium, Prague, Czech Republic, 3: Real Time Deconvolution of In-Vivo Ultrasound Images Jørgen Arendt Jensen Center for Fast Ultrasound Imaging,
Bicorrelation and random noise attenuation
 Bicorrelation and random noise attenuation Arnim B. Haase ABSTRACT Assuming that noise free auto-correlations or auto-bicorrelations are available to guide optimization, signal can be recovered from a
Satinder Chopra 1 and Kurt J. Marfurt 2. Search and Discovery Article #41489 (2014) Posted November 17, General Statement
 Posted November 17, General Statement") GC Autotracking Horizons in Seismic Records* Satinder Chopra 1 and Kurt J. Marfurt 2 Search and Discovery Article #41489 (2014) Posted November 17, 2014 *Adapted from the Geophysical Corner column prepared
GC Autotracking Horizons in Seismic Records* Satinder Chopra 1 and Kurt J. Marfurt 2 Search and Discovery Article #41489 (2014) Posted November 17, 2014 *Adapted from the Geophysical Corner column prepared
Quantitative Identification of Near-Fault Ground Motion using Baker s Method; an Application for March 2011 Japan M9.0 Earthquake
 Cite as: Tazarv, M., Quantitative Identification of Near-Fault Ground Motion using Baker s Method; an Application for March 2011 Japan M9.0 Earthquake, Available at: http://alum.sharif.ir/~tazarv/ Quantitative
Influence of Peak Factors on Random Vibration Theory Based Site Response Analysis
 6 th International Conference on Earthquake Geotechnical Engineering 1-4 November 2015 Christchurch, New Zealand Influence of Peak Factors on Random Vibration Theory Based Site Response Analysis X. Wang
On the GNSS integer ambiguity success rate
 On the GNSS integer ambiguity success rate P.J.G. Teunissen Mathematical Geodesy and Positioning Faculty of Civil Engineering and Geosciences Introduction Global Navigation Satellite System (GNSS) ambiguity
EPICENTRAL LOCATION OF REGIONAL SEISMIC EVENTS BASED ON EMPIRICAL GREEN FUNCTIONS FROM AMBIENT NOISE
 EPICENTRAL LOCATION OF REGIONAL SEISMIC EVENTS BASED ON EMPIRICAL GREEN FUNCTIONS FROM AMBIENT NOISE Michael H. Ritzwoller, Mikhail P. Barmin, Anatoli L. Levshin, and Yingjie Yang University of Colorado
Monitoring the 3 Dimensional Ionospheric Electron Distribution based on GPS Measurements
 Monitoring the 3 Dimensional Ionospheric Electron Distribution based on GPS Measurements Stefan Schlüter 1, Claudia Stolle 2, Norbert Jakowski 1, and Christoph Jacobi 2 1 DLR Institute of Communications
_h - Variance Fractal Dimension Analysis of Seismic Refraction Signals
 163 Variance Fractal Dimension Analysis of Seismic Refraction Signals Lingxiu Jiao', Wooil Moon' and W. Kinsne? 'Department of Geological Sciences and 'Department of Electrical and Computer Engineering
April - 1 May, GNSS Derived TEC Data Calibration
 2333-44 Workshop on Science Applications of GNSS in Developing Countries (11-27 April), followed by the: Seminar on Development and Use of the Ionospheric NeQuick Model (30 April-1 May) 11 April - 1 May,
Enhanced subsurface response for marine CSEM surveying Frank A. Maaø* and Anh Kiet Nguyen, EMGS ASA
 rank A. Maaø* and Anh Kiet Nguyen, EMGS ASA Summary A new robust method for enhancing marine CSEM subsurface response is presented. The method is demonstrated to enhance resolution and depth penetration
Analysis of Ground Motions from Nov. 5, 2015 earthquake sequence near Fundao Dam, Brazil July 20, 2016 Gail M. Atkinson, Ph.D., P.Geo.
 1 Analysis of Ground Motions from Nov. 5, 2015 earthquake sequence near Fundao Dam, Brazil July 20, 2016 Gail M. Atkinson, Ph.D., P.Geo., FRSC Introduction This report presents an analysis of the ground
INFLUENCE OF STATIC DISPLACEMENT ON PEAK GROUND VELOCITY AT SITES THAT EXPERIENCED FORWARD-RUPTURE DIRECTIVITY
 Seismic Fault-induced Failures, 115-1, 1 January INFLUENCE OF STATIC DISPLACEMENT ON PEAK GROUND VELOCITY AT SITES THAT EXPERIENCED FORWARD-RUPTURE DIRECTIVITY Mladen V. Kostadinov 1 and Fumio Yamazaki
2008 Monitoring Research Review: Ground-Based Nuclear Explosion Monitoring Technologies
 BASIC RESEARCH ON SEISMIC AND INFRASONIC MONITORING OF THE EUROPEAN ARCTIC Frode Ringdal, Tormod Kværna, Svein Mykkeltveit, Steven J. Gibbons, and Johannes Schweitzer NORSAR Sponsored by Army Space and
Identification and Extraction of Surface Waves from Three-Component Seismograms Based on the Normalized Inner Product
 6 th International Conference on Earthquake Geotechnical Engineering -4 November 25 Christchurch, New Zealand Identification and Extraction of Surface Waves from Three-Component Seismograms Based on the
Broadband Temporal Coherence Results From the June 2003 Panama City Coherence Experiments
 Broadband Temporal Coherence Results From the June 2003 Panama City Coherence Experiments H. Chandler*, E. Kennedy*, R. Meredith*, R. Goodman**, S. Stanic* *Code 7184, Naval Research Laboratory Stennis
G003 Data Preprocessing and Starting Model Preparation for 3D Inversion of Marine CSEM Surveys
 G003 Data Preprocessing and Starting Model Preparation for 3D Inversion of Marine CSEM Surveys J.J. Zach* (EMGS ASA), F. Roth (EMGS ASA) & H. Yuan (EMGS Americas) SUMMARY The marine controlled-source electromagnetic
ASSESSING LOCATION CAPABILITY WITH GROUND TRUTH EVENTS: THE DEAD SEA AND SOUTH AFRICA REGIONS. Clifford Thurber, Haijiang Zhang, and William Lutter
 ASSESSING LOCATION CAPABILITY WITH GROUND TRUTH EVENTS: THE DEAD SEA AND SOUTH AFRICA REGIONS Clifford Thurber, Haijiang Zhang, and William Lutter University of Wisconsin-Madison Sponsored by Defense Threat
University of Molise Engineering Faculty Dept. SAVA Engineering & Environment Section. C. Rainieri, G. Fabbrocino
 University of Molise Engineering Faculty Dept. SAVA Engineering & Environment Section C. Rainieri, G. Fabbrocino Operational Modal Analysis: overview and applications Carlo Rainieri Strucutural and Geotechnical
Resolution and location uncertainties in surface microseismic monitoring
 Resolution and location uncertainties in surface microseismic monitoring Michael Thornton*, MicroSeismic Inc., Houston,Texas mthornton@microseismic.com Summary While related concepts, resolution and uncertainty
TOWARD A RAYLEIGH WAVE ATTENUATION MODEL FOR CENTRAL ASIA
 TOWARD A RAYLEIGH WAVE ATTENUATION MODEL FOR CENTRAL ASIA Anatoli L. Levshin 1, Xiaoning (David) Yang 2, Michael H. Ritzwoller 1, Michail P. Barmin 1, Anthony R. Lowry 1 University of Colorado at Boulder
Geophysical Journal International
 Geophysical Journal International Geophys. J. Int. (2012) doi: 10.1111/j.1365-246X.2012.05631.x Refinements to the method of epicentral location based on surface waves from ambient seismic noise: introducing
A generic procedure for noise suppression in microseismic data
 A generic procedure for noise suppression in microseismic data Yessika Blunda*, Pinnacle, Halliburton, Houston, Tx, US yessika.blunda@pinntech.com and Kit Chambers, Pinnacle, Halliburton, St Agnes, Cornwall,
SIMPLIFIED METHOD FOR PREDICTING AVERAGE SHEAR-WAVE VELOCITY OF GROUND AT STRONG-MOTION STATIONS
 SIPLIFIED ETHOD FOR PREDICTING AVERAGE SHEAR-WAVE VELOCITY OF GROUND AT STRONG-OTION STATIONS K. Fujimoto and S. idorikawa 2 Lecturer, Dept. of Risk and Crisis anagement System, Chiba Institute of Science,
Th P6 01 Retrieval of the P- and S-velocity Structure of the Groningen Gas Reservoir Using Noise Interferometry
 Th P6 1 Retrieval of the P- and S-velocity Structure of the Groningen Gas Reservoir Using Noise Interferometry W. Zhou* (Utrecht University), H. Paulssen (Utrecht University) Summary The Groningen gas
McArdle, N.J. 1, Ackers M. 2, Paton, G ffa 2 - Noreco. Introduction.
 An investigation into the dependence of frequency decomposition colour blend response on bed thickness and acoustic impedance: results from wedge and thin bed models applied to a North Sea channel system