Analysis of Ground Motions from Nov. 5, 2015 earthquake sequence near Fundao Dam, Brazil July 20, 2016 Gail M. Atkinson, Ph.D., P.Geo.
|
|
|
- Ashlie Gibson
- 5 years ago
- Views:
Transcription
1 1 Analysis of Ground Motions from Nov. 5, 2015 earthquake sequence near Fundao Dam, Brazil July 20, 2016 Gail M. Atkinson, Ph.D., P.Geo., FRSC Introduction This report presents an analysis of the ground motions that were generated by the seismic events that occurred on Nov. 5, 2015 in the area near the Fundao Dam, Minas Gervais, Brazil. The analysis considers regional seismographic data available from IRIS ( the regional Brazilian network ( and University of San Paulo ( felt reports and security camera footage from Nov. 5, and data collected on an accelerometer that was installed in November following the events. This information was supplemented using ground-motion data collected to May 20, 2016 on a six-station local broadband array installed by Nanometrics Inc. at the end of April, The report focus is on the strongest ground motions, which occurred near 2 pm (14:00) local time on Nov. 5, 2015, as a result of a series of small local earthquakes. Ground motion analysis is used to construct a time history of motions that represents those that likely occurred at the site as a result of these events. The time history sequence includes three earthquakes closely spaced in time: M 2.2 at 14:12:15 (foreshock) (local time) M 2.6 at 14:13:51 (mainshock) M 1.8 at 14:16:03 (aftershock) where M is moment magnitude; local time is 2 hours behind Universal Time. The estimation of the moment magnitudes is described in the next section. These motions can be used as input to explore the likely response of structures. The focus is on the motions that occurred near 2 pm because the analysis of regional seismograms, in addition to felt reports, indicate that these were the strongest motions. Two other events occurred a few minutes before 4pm (15:56 and 15:59) and were detected on the regional seismographic network, but with weaker amplitudes than the events near 2 pm. Note that the timing of these last two events means that they were recorded about 10 minutes after the failure, which is believed to have occurred at 15:48 (personal communication from Review Panel, Feb. 10, 2016). It is possible that the last two events represent, or are at least contaminated by, the seismic noise from the mudflow (e.g. Agurto-Detzel et al., 2016).
, in the time period from 2010 to April 2016 in a broad region surrounding the site, along with the stations used by RSBR to locate the events and determine their regional magnitudes (m R ).")
2 2 Analysis of seismic data for events in the vicinity of Fundao Dam Figure 1 shows a screenshot of the events detected on RSBR, the Brazilian regional seismic network ( in the time period from 2010 to April 2016 in a broad region surrounding the site, along with the stations used by RSBR to locate the events and determine their regional magnitudes (m R ). The nearest seismographic stations to Fundao Dam are at distances >150 km, which limits the ability of the network to resolve event magnitudes and locations in the region of interest. The regional magnitudes in Brazil are measured using a peak-amplitude scale that was calibrated to give similar values to the 1- sec P-wave teleseismic magnitude, m b (Assumpcao, 1983). The RSBR catalogue of seismic events in a small region within ~45 km of Fundao Dam (search area S, W) was compiled from the catalogue and is provided in Table 1. Figure 1 RSBR Catalogue events from 01/ /2016 (orange circles) and the stations of the Brazilian network, within ~500 km of the site area (15 to 25 S, 40 to 50 W). Screenshot from Note the lack of stations near the map centre, which is the area where the Fundao Dam is located.
3 3 Table 1 List of seismic events in the area S; W in Brazilian catalogue (as of ). Time is Universal Time (2 hours ahead of local time). Note that locations are uncertain by 10 to 20 km due to station distribution. Events on Nov. 5 are indicated in bold, with those that post-date the failure marked with *. Magnitudes (m R ) are regional magnitude as given by RSBR. Note that moment magnitudes (M) have been computed for events near Fundao dam, and are given in Table 2; values of M are generally less than mr. YEAR MM DD Hour(UT) MM SS LATITUDE LONG m R
4 * * The network stations are mostly broadband seismograph stations, and all stations are at distances greater than 150 km from Fundao Dam. Because of the large distances, the ground motions at the site need to be evaluated with the aid of ground-motion prediction equations (GMPEs) which can be checked or calibrated with the regional data. The felt intensity data for the Nov. 5 event also aids in checking the estimated level of ground motions. Moreover, some constraints on projecting the regional motions to the source are provided by an accelerometer record obtained on-site for a small earthquake (M2.0, m R 3.0) that occurred on Nov. 18, This event was also recorded on the regional seismograph stations. Note that the accelerometer was not installed until Nov. 11, 2015, and so there are no near-distance ground-motion records of the Nov. 5 events. Finally, a six-station broadband array was installed by Nanometrics at the end of April, 2016, and it provides further information. The array recordings, available for May 1- May 20, 2016, are comprised of 21 local blast records and one regional earthquake record, for an event that occurred 60 to 70 km away. No detectable local earthquakes were recorded by the array (May 1-20, 2016). The array data can be used to place constraints on the attenuation and variability estimates used in the evaluation of the events of Nov. 5. The waveform data for a subset of events including all events of Nov. 5, 2015 are downloaded from IRIS and RSBR in standard seismological format (SEED format) and processed to obtain instrument-corrected response spectra (5% damped pseudo-spectral acceleration, PSA). The processing includes windowing, digital filtering and removal of
5 5 instrument response using the ICORRECT algorithm as described by Assatourians and Atkinson (2010). In order to obtain a more physically-based estimate of earthquake size, and to connect the ground motions to the predictions of GMPEs, we need an estimate of moment magnitude for the events of interest. The moment magnitude (M) was determined for selected events using the algorithm of Atkinson, Greig and Yenier (2014), which is based on the verticalcomponent amplitude of PSA at 3.33 Hz (for events of M<3), corrected for attenuation. The eastern attenuation formula was assumed, as Brazil is in a stable cratonic region that is analogous to the crustal attenuation conditions of central and eastern North America. The calculations used only those data within 400 km, to minimize noise contamination issues. The applicability of the attenuation model was checked by plotting the residuals as a function of distance, as shown in Figure 2 (where the residual for each observation is defined as the difference between the calculated magnitude value at that station and the average magnitude for that event). The lack of any distance trend in the residuals of Figure 2 indicates that the regional attenuation rate in the model used to estimate M is consistent with that in the data, and this supports the applicability of the eastern attenuation model. Figure 2 Residuals (=observed station M event average M) for the calculation of moment magnitude from PSA at 3.33 Hz (vertical component) versus distance. The eastern attenuation model of Atkinson, Greig and Yenier (2014) is assumed in the calculations.
6 6 Table 2 lists the subset of events for which ground motions were analyzed and moment magnitudes determined. It is noted that the moment magnitude values (M) are typically about 1 unit smaller than the local magnitudes determined by RSBR (m R ). Given the station distribution and the unavoidable contributions of seismic noise to regional records, the estimated uncertainty in the moment magnitudes is considered to be approximately 0.2 units. Table 2 Events in the Brazilian regional catalogue within ~30 km of Fundao Dam for which ground motions were analyzed. Events are classified as earthquake (EQ), suspected blast based on time (blast?), or confirmed blast from blasting records (blast). m R and location as given by RSBR to May 2016; ML and location for May 2016 as given by Nanometrics, or by blast location where known. Events known to have occurred at or near Samarco are indicated in bold; the assigned event numbers are referenced later in the text. Events in red (May 2016) are those recorded on the local seismic network. Date Time(UT) Lat. Lon. m R/ ML M type Event# 2/4/ :22: EQ 2/26/ :11: blast? 2/28/ :36: blast? 4/7/ :56: blast? 4/23/ :19: blast? 5/4/ :05: blast? 5/15/ :01: blast? 6/25/ :08: blast? 7/7/ :02: blast? 10/3/ :44: blast? 10/31/2015 5:02: EQ 11/5/ :01: blast 1 11/5/ :06: blast 2 11/5/ :12: EQ 3 11/5/ :13: EQ 4 11/5/ :16: EQ 4x 11/5/ :59: EQ 6 11/10/2015 6:17: EQ 7 11/10/2015 7:45: EQ 8 11/18/ :42: EQ 9 11/18/ :43: ~1 EQ 9x 12/9/ :03: blast 10 5/2/2016 9:12: EQ 101 5/2/ :12: blast 108
7 7 5/3/ :12: blast 109 5/3/ :12: blast 110 5/3/ :12: blast 111 5/6/ :12: blast 112 5/9/ :12: blast 113 5/10/ :12: blast 114 5/10/ :12: blast 115 5/11/ :12: blast 116 5/12/ :12: blast 117 5/12/ :12: blast 118 5/13/ :12: blast 119 5/14/ :12: blast 120 5/16/ :12: blast 121 5/16/ :12: blast 122 5/17/ :12: blast 123 5/18/ :12: blast 124 5/18/ :12: blast 125 5/19/ :12: blast 126 5/19/ :12: blast 127 5/20/ :12: blast 128 Figure 3 illustrates the attenuation of ground-motion amplitudes for the M 2.0 event of Nov. 18 (Event 9) that occurred very close to Fundao Dam (distance of 1 to 2 km based on S-P time), and which was recorded on the accelerometer installed Nov. 11, in comparison to two candidate GMPE models that have been developed to model amplitudes from small-tomoderate events at close distances. The accelerometer is believed to be sited on fractured bedrock (a highly-weathered phyllite). According to a shear-wave velocity study (AFC geofisica, 2016), the site is lower in velocity than the soft-rock condition assumed in the GMPE models, which is NEHRP B/C boundary (shear-wave velocity near 760 m/s). In order to minimize the effects of site amplification on the observed attenuation, the vertical component is plotted for the regional records, while all three components are plotted for the accelerometer. The most directly-applicable model to describe the attenuation rate is the Yenier and Atkinson (2015) GMPE (YA15), which was developed for events in central and eastern North America (CENA) using an empirically-calibrated simulation model. The model features high-frequency source amplitudes (stress drops) that scale with focal depth, and has been evaluated in this application for an assumed focal depth of 2 km. For comparison, the strictly-empirical GMPE of Atkinson (2015) (A15) is also plotted. The A15 model was developed from California observations within 40 km, and has been extrapolated here to larger distances. It is noted that both the YA15 and A15 models were developed for events of M 3, and so are significantly extrapolated below their magnitude range of applicability for this small event of M2.0. In spite of these limitations, the observed amplitudes agree wells with the YA15 model, and even with the A15 model (in spite of the
8 latter model being extrapolated from close observations in California). Moreover, the neardistance amplitudes for the event connect well with the regional observations, using the GMPE model of YA15. The 3.3 Hz PSA recorded at the accelerometer is about a factor of 3 greater than the YA15 median level, while the 10 Hz PSA value is about a factor of 1.5 lower than the YA15 median. This lends confidence to the idea that we may use the regional observations of the Nov. 5 events, and correct them for attenuation to infer the corresponding near-source motions, albeit with considerable uncertainty. 8 Figure 3 Attenuation of PSA amplitudes (3.33 Hz and 10 Hz) for Nov. 18 M 2.0 event (event 9) compared to GMPE models of Yenier and Atkinson (2015) and Atkinson (2015) for B/C conditions. On Figure 4, the inferred near-source motions from the Nov. 18 event are obtained for both the vertical and horizontal components by correcting the regional records for the YA15 attenuation model (as shown on Figure 3) to a rupture distance of 1 km. The vertical component minimizes the effects of site response and is sometimes considered as a proxy for the expected horizontal-component motions on B/C conditions. The source spectrum inferred from the regional records agrees well with the near-source recording of the
9 accelerometer at low frequencies. At higher frequencies, the motions recorded on the accelerometer are weak. This suggests that there may be a significant high-frequency site response (kappa effect) that is altering the signature of the motions on the accelerometer. With the exception of the high-frequency discrepancy, the overall amplitude agreement between the source spectrum as inferred from the regional records and that recorded by the accelerograph for this event lends further confidence to the use of the regional records of Nov. 5 to infer the motions at Fundao Dam. The inferred near-source spectrum for this event agrees reasonably-well with the prediction of the YA15 model for an event at a depth of 2 km, at a rupture distance of 2 km, for B/C site conditions. For reference, the response spectrum of the small aftershock of M~1 that occurred on Nov. 18, a few seconds after the M2.0 event (event 10), is also shown on Figure 4. 9 Figure 4 Inferred source spectrum of Nov. 18 M2.0 event (event 9) from regional seismographic records compared to recorded spectrum from accelerometer. The spectrum for a M~1 aftershock (event 10) is also shown. Black line is the estimated near-source spectrum from the Yenier and Atkinson (2015) GMPE.
10 10 Distinguishing Earthquakes from Blasts A feature noted in the catalogue of events in the site area (Tables 1 and 2) is that most events take place during working hours, especially between 1 and 4 pm local time (15:00-18:00 UT). This is diagnostic that the catalogue contains many events that are actually mining blasts, not earthquakes, because earthquakes are randomly distributed in time over both the day and night-time hours. It is difficult to distinguish blasts from earthquakes based on regional records, which is why they often appear in regional earthquake catalogues. When near-distance records are available, the waveforms of blasts can be seen to be distinct from those of earthquakes; blasts have more energy on the vertical component, and tend to have energy concentrated in a narrow frequency band, leading to ringy (monotonic) waveforms. However, at regional distances these differences are obscured by the multi-pathing that has occurred. Thus we are not entirely sure which events in Tables 1 and 2 are blasts. We have indicated as confirmed blasts those for which nearby mines have confirmed blasting at the time (in Table 2). For the remainder of events, we have classified them as earthquakes if they occurred outside of normal working hours, and as suspected blasts if they are poorly-documented events that occurred at the usual blasting times. For the events that occurred on Nov. 5, the two events shortly after 13:00 local time have been confirmed as blasts at Vale, at a distance of 2.6 km. It is our understanding that Samarco and Vale have confirmed that no other blasting occurred in the site area on Nov. 5, and that we can thus be confident that the events near 14:00 were earthquakes. The felt event at Samarco at 14:12 was described as much stronger and very distinct from typical blasts by on-site personnel. Moreover, the waveforms recorded on regional seismographic stations are similar to those of a small earthquake (M~2) on Nov. 18 that was detected by the accelerometer installed on site after the incident. The similarity of regional waveforms for the Nov. 5 events at ~14:00 with those of the Nov. 18 event suggests that these events all have the same source. Specifically, when the source location, mechanism and travel path are identical for two events, they produce nearly-identical waveforms. On the basis of waveform signature, using correlation analysis, Agurto-Detzel et al. (2016) identified a list of earthquake events that are all thought to originate from the same source (i.e. the same fault plane), at close distance from the Fundao Dam. The table of the Samarco events from Agurto-Detzel et al. is reproduced below as Table 3, along with their local magnitudes (m R ). Note that some of these events are not listed in Table 2, because their signals were too weak (i.e. M<2) to be detected on any of the regional seismograph stations.
 Fabrica Nova (~3 km) Alegria (~6+ km) Alegria Sud (~5+ km) Alegria Norte (~8+ km) None")
11 11 Table 3 - Known events of the Samarco series, as given in Agurto-Detzel et al., A compilation was provided (by Samarco) of blasts in the area both before and after the Nov. 5 events. These include blasts in the following areas, with approximate distances from Fundao Dam: Samarco onsite (<2 km) Fabrica Nova (~3 km) Alegria (~6+ km) Alegria Sud (~5+ km) Alegria Norte (~8+ km) None of these blasts, with the exception of an event on Dec. 9, 2015 (event 10), appear in the regional catalogue of Table 1, possibly because their motions were too weak to be readily detected at regional seismograph stations. Moreover, the events which we have labelled as suspected blasts in Table 2 do not coincide with any of the blasts in the compiled list from Samarco. This could be because such events in Tables 1 and 2 are poorly-located blasts from mines at more distant locations than those listed above. Ten to twenty km is a typical location error for earthquakes in the area, and blasts are generally subject to larger location errors. An alternative explanation is that the list of mining blasts may not be complete. In any case, the most significant known motions at Fundao Dam in the period of instrumental record are those that occurred on Nov. 5, 2015 due to the earthquake sequence. The earthquakes have a waveform signature that is distinct from that of blasts. This is most clear when records at close distances are available. Figure 5 compares the velocity waveforms (filtered to show the frequency band from 4 to 12 Hz) recorded on the
12 12 accelerometer at Samarco for the two earthquake events on Nov. 18 (events 9 and 9x) in comparison to that for the blast that occurred on Dec. 9 (event 10). Note the similarity of the waveforms for the two earthquake records, while that for the blast is quite distinct in character. Note also that the blast amplitudes are weak. Figure 5 Comparison of filtered waveforms recorded on accelerometer for two earthquakes of Nov. 18 with that of a blast that occurred on Dec. 9 (events 9, 9x, 10 in Table 2). Vertical components. Velocity filtered 4 to 12 Hz. Note factor of 10 difference in y-axis amplitude scale for top panel (largest event). The similarity of the two earthquake signals shown in Figure 5, and their distinct difference from the blast signal, can be demonstrated by taking the cross-correlation of each signal with respect to that of the Nov. 18 M~2 event. This is provided in Figure 6, in which the cross-correlation for the velocity trace (filtered from 4 to 12Hz) is shown for a 2-second window beginning with the signal onset, for the vertical component. Lag times of ±1 second
13 from the signal onset (for each signal) are considered. The correlation of the M1 event with the M 2 event is compelling, with a maximum correlation coefficient value of about 0.6, while the correlation plot for the blast behaves very differently and has a maximum value near Figure 6 Cross-correlation of signals from M2, M1 earthquakes of Nov. 18 (events 9, 9x in Table 2), and the Dec. 9 blast (Event 10), with respect to the M2 Nov. 18 signal, all as recorded on the accelerometer. Note the correlation of the M2 signal with itself is its autocorrelation and by definition =1 for 0 lag time. Time axes are shifted such that the maximum correlation occurs at a relative time of t=0. At regional distances, it is difficult to confidently distinguish blasts from earthquakes. The closest station to Fundao, station BSCB at a distance of ~150 km, provides the best signalto-noise ratio and is therefore the best station at which to compare the waveform signature from different events. In Figure 7, the P-wave signature at BSCB (vertical component of velocity) is compared for the two strongest earthquakes of Nov. 5 (events 3 and 4, at 14:12 and 14:14) with that of the blast at Vale at 13:01 (event 1), all filtered from 4 to 12 Hz. Note the much higher amplitudes for the earthquakes and the relative similarity of their traces. The blast P-wave signature is mostly noise.
14 14 Figure 7 P-wave arrival (vertical component of velocity) at BSCB, ~150 km from Fundao Dam, for events of Nov. 5, Signal filtered from 4 to 12 Hz. The similarity of the signals at BSCB for the later earthquake events at Samarco to those on Nov. 5 can be seen in Figure 8, which compares the first few seconds of the P-wave trace for two small events on Nov. 10 and Nov. 18 (events 8 and 9) to the largest event of Nov. 5 (event 4).
15 15 Figure 8 P-wave arrival (vertical component of velocity) at BSCB, ~150 km from Fundao Dam, for events of Nov. 10 and Nov. 18, 2015 (top two traces, events 8 and 9) compared to that for the 14:14 event of Nov. 5 (event 4). Signal filtered from 4 to 12 Hz. In Figure 9, the cross-correlation of the first two seconds of the P-wave trace (vertical component) is taken with respect to the largest event signal, all as recorded at BSCB, for the earthquake events. Note that all signals have a similar correlation function, with maximum correlation values exceeding 0.5. By contrast, for the cross-correlation of the blast signals with the largest event signal (as recorded at BSCB), the correlation functions are less similar, and have maximum values that are less than 0.5, as shown in Figure 10. This supports the conclusion that a series of similar earthquake events took place at Samarco, beginning on Nov. 5, 2015; these are events 3, 4, 4x, 6, 7, 8 and 9 of Table 2.
16 Figure 9 Cross-correlation of signals from earthquake events at Samarco, with respect to the M2.5 Nov. 5 signal (event 4), all as recorded at BSCB. Event numbers as in Table 2. Note the correlation of event 4 with itself is its autocorrelation and by definition =1 for 0 lag time. Time axes are shifted such that the maximum correlation occurs at a relative time of t=0. 16
17 17 Figure 10 Cross-correlation of known blast signals near Samarco with respect to the M2.5 earthquake of Nov. 5 (event 4), all as recorded at BSCB. Event numbers as in Table 2. Note the correlation of event 4 with itself is its autocorrelation and by definition =1 for 0 lag time. Time axes are shifted such that the maximum correlation occurs at a relative time of t=0. Ground Motions and Attenuation for Nov. 5 Events near Fundao Dam The regional ground motion observations are used in conjunction with GMPE models and felt observations to infer the likely motions for the sequence of Nov. 5, 2015 that occurred prior to the dam failure (where the failure is believed to have occurred at 15:48 local time) M 2.2 at 14:12:15 local time (foreshock; event 3) M 2.6 at 14:13:51 local time (mainshock; event 4) M 1.8 at 14:16:03 local time (aftershock; event 4x) The main source of ground motion information for the events is the regional ground-motion records. However, near-source ground motions can be estimated for the mainshock based on the intensity observations. We first describe these estimates, then compare all groundmotion information for the events with GMPE models to infer the motions at the site and their uncertainty.
18 18 Motions Inferred from Felt Effects An intensity survey was conducted at Samarco following the incidents of Nov. 5, as on-site personnel had reported strongly feeling one or more earthquakes in the afternoon in the hours leading up to the failure, and this was considered an unusual occurrence. A review was made of these questionnaires, considering them in the context of the questions asked in the U.S.G.S. Did you feel it (DYFI) methodology to determine the community decimal intensity (Dengler and Dewey, 1998). Each response was reviewed to assess how the respondent would likely have answered each of the standard DYFI questions, which deal with the relative intensity of motion, whether light or heavy objects moved, what sounds were heard, and what damage was observed. Based on averaging the responses assigned, and using the Dengler and Dewey algorithm, the assigned community intensity for the mainshock event is 5.3. Considering the uncertainty in assessing the intensity in this manner, we can consider the Modified Mercalli Intensity to be in the range from 5 to 5.5. It may be noted that review of video footage from security cameras (4 such films, provided by Samarco) indicated that personnel who were on foot outside of buildings showed no perceptible reaction to the events, even though it was apparent in the videos that motion was occurring. The motion appeared to be of a few seconds duration in general, perhaps as long as 6 seconds at Area H. This would suggest that the motion was not at an alarming level and/or that personnel were accustomed to feeling such motions. This supports the assessment that the intensity could not have been much greater than 5. However, it should be recognized that intensity can be quite variable from one location to another, and that motions are felt more strongly indoors. It is also noted that witnesses at the dam at the time of these events did not report feeling them, which also suggests that the levels of motion and/or their felt effects may have varied considerably over the Samarco facilities. It may be that the events occurred closer to the location of the strongest observations, or it could be that the motions or their effects were stronger for reasons other than proximity. The intensity can be used to estimate the ground motions, with considerable uncertainty, by using ground motion intensity conversion equations (GMICE). One can use GMICE to estimate peak ground motion and response spectral parameters from intensity, but it is important to keep in mind that intensity is a single number, whereas the ground motion is an entire spectrum in which the amplitude varies with frequency. Typically, it is the strongest effect that dictates the intensity. For example, if the high-frequency motions are strong, and the low-frequency motions are weak, the intensity is likely to be attributable to the high-frequency amplitudes, and those at low frequencies may not be correlated with intensity. For this reason, to judge the likely ground motions that occurred, it is helpful to begin with a spectrum of motion that contains the expected amplitude-frequency distribution, based on the event magnitude and distance, and scale this spectrum up or down as needed to be consistent with the intensity. Following this approach, we begin with the spectrum expected for a M=2.5 event at 1 to 2 km from the rupture, based on GMPEs and regional observations (horizontal components), as shown on Figure 11. We also plot the range of ground motions that is consistent with
19 an intensity of 5 to 5.5, considering the GMICE of Worden et al. (2012), Atkinson and Kaka (2007) and Dangkua and Cramer (2011). The Worden et al. GMICE are generally preferred as they are based on the most extensive database, but the Dangkua and Cramer GMICE may be well-suited to this application because they were developed for CENA events, and implicitly carry a different spectral shape (more high-frequency and less low-frequency). To obtain bounds for each frequency, we evaluate the GMICE for small nearby events for MMI 5 to 5.5 and take the largest and smallest values from among the relations, also considering that the standard deviation of ground motion about the median for the given MMI should be at least a factor of two. This results in a large range of potential motions associated with the observed intensity, as shown on Figure 11. The green line is our best estimate of the median mainshock motions on B/C in the near-source region, considering the regional observations and the GMPEs for an event of M=2.5 at 1 to 2 km from the rupture. However, the intensities reflect motions observed on soil. As discussed later in the report, the average site amplification is expected to be about a factor of 1.4. Moreover, the larger intensities are likely to represent motions significantly above the median. Since one standard deviation of the ground motion distribution, representing random (aleatory) uncertainty is about a factor of 2, the observed intensities on soil likely correspond to motion about a factor of 3 above the B/C median level (e.g. 1.4*2=2.8). Thus the inferred spectra from the GMPEs and the regional observations are consistent with those from the intensity observations in a broad sense. The observed intensity likely reflects highfrequency felt effects (peak ground acceleration, PGA) rather than the motions at lower frequencies, which would have been weak. 19
20 Figure 11 Estimation of spectrum of Nov. 5 mainshock event at near-source distance, based on GMPEs, regional records corrected to source, and felt observations. The range of ground motions typically associated with MMI=5 to 5.5 is shown with vertical bars, in comparison to the spectra from the GMPEs and regional records. The target spectrum discussed in the next section is also shown. Note that the target for median motions on B/C (green line) is a factor of 3 lower than that for +1 sigma motions on soil (purple line). PGA is plotted for reference at 99 Hz. 20
21 21 Near-source spectra for Nov. 5 Events Based on Figure 11, our best-estimate of the median horizontal-component ground motions that were experienced during the Nov. 5 events, for near-source motions on B/C reference site conditions, is obtained by drawing a line that follows the median A15 and YA15 GMPEs for an event of M2.5 at a distance of 1 km from the rupture, and is also consistent with the regional seismographic observations (green line on Figure 11). The event would certainly need to be very shallow and very nearby to produce the observed motions on-site. These motions likely varied considerably over the site area, with some locations experiencing stronger motions and other locations experiencing weaker motions. Time History for Events of Nov. 5 We can construct a time history of acceleration for the motions of the M2.5 mainshock of Nov. 5 by using the model spectrum for the event as shown on Figure 11 to scale up the motions recorded on the accelerometer for the M2 event of Nov. 18. As shown in Figure 12, we consider the source spectra inferred from the regional observations, as well as the GMPE models, to define a target spectrum that is believed to represent the median motions that likely occurred onsite on Nov. 5, on B/C site conditions. There is a significant element of judgement in defining this target. The vertical-component target is defined by reducing the horizontal-component target slightly at high frequencies, by an amount that reflects typical high-frequency site amplification for B/C site conditions (e.g. as in Atkinson and Boore, 2006); this is also consistent with the difference between the inferred source spectra for the vertical and horizontal components based on regional observations (e.g. see Figure 4). Figure 12 also shows the spectrum of the M2 event that we wish to scale to meet the target spectrum. It can be noted that the required scale factor to boost the M2 event at lower frequencies is approximately a factor of 5, but at higher frequencies the M2 event as recorded on the accelerometer has a spectrum that is deficient, and thus would require a scale factor of 8 to 10. In particular, there appears to be a strong kappa effect in the records obtained on the accelerometer. It is likely that this deficiency reflects site conditions at the accelerometer site rather than a source effect, because it was not seen in the regional records when corrected to source (see Figure 4) the regional records suggest a rich high-frequency content. Moreover, the strength of the felt effects of the mainshock also suggests strong high-frequency content. Finally, records obtained on a local seismographic network installed in 2016 (discussed further in the following sections) suggest that other sites in the vicinity in the dam have frequency content consistent with that inferred from the regional records. Thus it is desirable to scale the M2 time history as recorded on the accelerometer by a larger factor at high frequencies than at low frequencies, to better match the target spectrum. This can be accomplished by using a frequency-dependent scale factor instead of a constant scale factor.
22 22 Figure 12 Target spectrum for the M2.5 mainshock and M2 PSA seed record, for B/C site conditions. The horizontal-component target is the same as that shown on Figure 6. Solid blue and green lines show spectrum of mainshock time histories after scaling. The essence of the scaling approach is that we apply a frequency-dependent scale factor to the M2 time history, rather than a simple linear scale factor. This allows us to boost the higher frequencies in the record more than the lower frequencies. To accomplish this, we take the Fourier transform of the accelerometer record, after applying zero-padding, baseline correction and tapering to ensure a well-behaved record. We filter the record in the frequency domain to remove noisy components below 0.3 Hz and above 80 Hz, then multiply the Fourier spectrum by the ratio of the target PSA spectrum to the recorded PSA spectrum of the time history. This ratio is frequency-dependent and boosts the high frequencies to a greater extent than the low frequencies. The inverse transform to the time
23 domain provides the scaled time history. The process is performed for each of the horizontal components using the horizontal target, then repeated for the vertical component using the vertical target. The scaled time histories are very similar in appearance to the original records in the time domain, but have greater amplitudes. This is shown in Figures 13-15, which compare the original records in acceleration, velocity and displacement to the scaled records, for the two horizontal components and the vertical component respectively. 23 Figure 13 Original M2 time history of Nov. 18 and time history scaled to represent the M2.5 Nov. 5 mainshock. H1 component. B/C site conditions.
24 Figure 14 Original M2 time history of Nov. 18 and time history scaled to represent the M2.5 Nov. 5 mainshock. H2 component. B/C site conditions. 24
25 25 Figure 15 Original M2 time history of Nov. 18 and time history scaled to represent the M2.5 Nov. 5 mainshock. Vertical component. B/C site conditions. The same approach can be used to construct time histories for the M2.2 foreshock and the M1.8 aftershock. For the M2.2 foreshock, we use the same seed record as we used for the mainshock (the M2 Nov. 18 event), but scale it to a slightly lower target spectrum, as illustrated in Figure 16. Here, the target is a scaled-down version of the M2.5 mainshock target, where the scaling reduces the amplitudes to account for the 0.3 unit difference in magnitudes between the mainshock and foreshock, considering the magnitude-scaling in the YA15 GMPE. The foreshock target is compared to the YA15 and A15 GMPE spectra for an event of M=2.2 at 1 km.
26 26 Figure 16 Target spectrum for the M2.2 foreshock (orange lines), compared to YA15 and A15 GMPEs for M=2.2 at 1 km (B/C site conditions). Dotted lines show spectra of M2 PSA seed record, while solid lines show scaled spectra. For the M1.8 aftershock, we select the M~1 aftershock of the Nov. 18 event as the seed record, in order to provide a different record sample, and scale it to the M1.8 target spectrum, as illustrated in Figure 17.
27 27 Figure 17 Target spectrum for the M 1.8 aftershock (orange lines), compared to YA15 and A15 GMPEs for M~2 at 1 km (B/C site conditions). Dotted lines show spectra of M1 PSA seed record, while solid lines show scaled spectra. Figure 18 provides a sample of the original and scaled time history for the foreshock, while Figure 19 provides this for the aftershock.
28 Figure 18 Original M2 time history of Nov. 18 and time history scaled to represent the M2.2 Nov. 5 foreshock. H1 component. B/C site conditions. 28
29 29 Figure 19 Original M1 aftershock time history of Nov. 18 and time history scaled to represent the M1.8 Nov. 5 aftershock. H1 component. B/C site conditions. In constructing the time histories provided in the foregoing, a judgement was made that the high-frequency content to be input for median B/C motions should match that indicated by the regional seismograph records corrected to source, rather than matching the suppressed high-frequency content noted on the accelerometer record. It could be argued that because the accelerometer record was obtained near the dam, it may indicate that the motions input to the dam may also have been lacking in high frequency content (e.g. like the accelerometer records), perhaps due to some local effect. This might explain why observers
30 near the dam did not report feeling the earthquakes, while those in the Samarco offices felt the events strongly. To construct time histories to consider this possibility, one could use a constant scaling factor for all frequencies (scaling by a factor of ~5) in order to scale the M1.8 accelerometer record up to represent the M2.5 mainshock record. Similarly, the foreshock and aftershock records for such a scenario could also be constructed using constant scaling. Such motions would be within the bounds of uncertainty for the median motions input in the vicinity of the dam for B/C site conditions. In this report, the more conservative assumption that the frequency content input to the dam is reflected by the motions observed over the site area as a whole, rather than by the motions recorded at the accelerometer site has been adopted in constructing the best-estimate for the median motions. This assumption, its rationale, and its implications, will be discussed further later. 30 Best-Estimate Composite Time History for B/C site conditions In order to consider the composite effect of the sequence of events that occurred closely spaced in time on Nov. 5, we add together the accelerograms of the foreshock, mainshock and aftershock in the time domain, with the appropriate time delays, according to the timing of these events. (Note: these records are all for B/C site conditions and thus the composite also applies to B/C site conditions.) Because the events were part of a sequence, it is likely that there were additional small events that occurred between the foreshock and mainshock and between the mainshock and aftershock. These events are assumed to be below the felt threshold, and are taken as a series of M~1 events. To model these events, we use the M0.8 aftershock accelerogram of Nov. 18 (all three components) to generate additional small time series, by multiplying each record component by a simple linear scaling factor ranging from 1.5 to 3.2. We place each of these 3 record components between the foreshock and mainshock, and placed each of them twice between the mainshock and aftershock. The series of 3 records is also added following the aftershock, for a total of 12 very small events that are added to the sequence. This is in line with what we would expect for a minimum number of small events embedded in an aftershock sequence. For example, using the Gutenberg-Richter relation we would expect that for each M~2 event in a sequence there may be ~10 M~1 events. Thus the addition of 12 such events in the sequence is reasonable. Figure 20 illustrates the 3 components of acceleration for the composite time history. Note that the time axis is much longer in this figure than in the previous time history figures, which is why the individual events look so much shorter in duration. In Figure 20, the added small events are not readily visible, because their amplitudes are so small (<1 cm/s 2 ). In order to be able to see these events, a version of the figure with the y-axis amplified is provided in Figure 21.
31 Figure 20 Accelerogram for composite time history of event sequence of Nov. 5. B/C site conditions. 31
32 32 Figure 21 Composite accelerogram of events of Nov. 5 with y-axis zoomed to show small added events. B.C. site conditions. The time history of the composite events, for B/C site conditions, is provided for all three components (two orthogonal horizontal components of random orientation, plus the vertical component) in an appended excel file (OutputNov5accn.xlsx). This is a best-estimate time history, and represents the median-level motions that may have occurred for the reference

33 B/C site condition for near-source sites. These best-estimate motions represent those for the site as a whole, and do not attempt to distinguish whether the input to sub-regions within the Samarco property (e.g. at the dam versus at the offices) might have been higher or lower than indicated by the generic median near-source record. Site Amplification at Samarco Sites The motions of the best-estimate composite time history for B/C sites are subject to both epistemic and aleatory uncertainty, and could also be amplified significantly on soil sites. Based on seismic surveys conducted at two Samarco sites, including a site near the accelerometer location and a site near the main office (AFC geofisica, 2016), the soil profiles at Samarco are gradational, characterized by near-surface shear-wave velocities of ~250 m/s, increasing to values of ~450 m/s at depths greater than 10m. V s30 values are in the range from ~ 340 m/s to 400 m/s (NEHRP C/D sites). The maximum depth sampled was ~36m, at which velocities are ~450 m/s. A typical profile near the accelerometer site is shown in Figure Figure 22- Typical shear-wave velocity profile for Samarco site (Survey#1, x=24) (AFC geofisica, 2016). The depth to B/C conditions (760 m/s) is not known, nor is it known if there is a significant impedance contrast at the base of the soil layer that might have amplified certain frequencies. If we assume that the soil profile continues in a gradational manner, with increasing velocities at increasing depths but with no significant impedance contrasts,
34 then the amplification expected from the profiles can be estimated using the quarterwavelength amplification method described by Boore and Joyner (1997). Using this method, the estimated site amplification factors for the sites are generally in the range from 1.2 to 1.6 at frequencies from 3 to 10 Hz, depending on how much attenuation is assumed for the near-surface soil (kappa effect). The amplification is relatively uniform in the frequency range from 3 to 7 Hz, then gradually decreases at higher frequencies due to the effects of kappa. At lower frequencies, the behavior will depend on the velocity structure in the deeper part of the soil profile (below the 36 m sampled). This amplification behavior is very similar to that of typical California sites. For example, the generic soil amplification functions for C/D sites according to empirical amplification models such as those of Seyhan and Stewart (2014) would also predict this type of behavior. Given the other uncertainties in estimating the ground motions, the details of the site response function are not particularly critical. We may therefore assume a nominal expected amplification of approximately a factor of 1.4 over the relevant frequency band. Our best estimate of the median ground motions at the Samarco site can thus be taken as the median values provided for B/C, multiplied by a factor of 1.4. More detailed site response studies for the layered structure may be conducted by inputting the B/C time histories to the site response profile. 34 Assessment of Uncertainty in Ground Motions, Based on Recent (May 2016) Network Data Additional insights into the likely ground motions at Samarco and their uncertainty is obtained using ground motions obtained by a 6-station local broadband seismographic network installed for Samarco at the end of April 28, 2016 by Nanometrics Inc. In the first three weeks of May, the network detected and located one regional earthquake, a M~3 event about 70 km west of Samarco, and 21 blasts. Most of the events are poorly located by the network because they are outside its perimeter. For the location of the May 2 earthquake, regional data were used by Nanometrics to help constrain the location. Figure 23 shows the locations of the stations and detected events from May 1 to May 20 (where the plotted locations are those determined by Nanometrics); these are the events listed in Table 2. Note that station FD001 is co-located with the accelerometer. Stations FD001 and FD003 are closest to Fundao Dam (a few hundred meters southwest and northeast of the failed section, respectively).

35 35 Figure 23 Events and stations of the local network, May 1-20, All events shown are believed to be blasts. Note that most blasts are poorly located as they are outside the network perimeter; for known blasts the location can be improved over those shown by using the actual blast coordinates. The M3 regional earthquake of May 2 (not shown) is about 60 km west of the map area. The failed dam section lies between FD001 and FD003. The recorded ground motions on the local network provide additional information on source, attenuation and site characteristics that are relevant to the assessment of the median motions, their uncertainty, and their likely variability. Each of these aspects are discussed in the following. The variability of ground motions for the May 2 earthquake as recorded at different locations across the site area is shown in Figure 24. All stations are located between 65 km and 80 km from the site, and moreover are at the same azimuth. Therefore the variability in observed motions is largely attributable to site response and random variability. Overall
36 the motions are consistent with the expectations of Yenier and Atkinson (YA15) GMPE for a shallow event (depth ~ 5 to 7 km) of M=3 at a distance of 60 to 80 km; these motions have been plotted for reference. The observed motions are higher on average than the YA15 predicted median for B/C site conditions. This is consistent with our expectations because the sites are in general Class C, which should be amplified by about a factor of 1.4 relative to B/C, on the horizontal component. The shape of the spectra, and the similarity of the horizontal and vertical components at each station, also support an average classification of C for the site conditions. At site FD002 there appears to be an amplification peak due to site response near 4 Hz. It is notable that the motions at FD001, which is co-located with the accelerometer, are weak at higher frequencies relative to the other stations. This is in qualitative agreement with the observation of weak high frequencies on the accelerometer for the events of Nov. 18, The lack of high-frequency motion at this location may explain why observers at the dam did not feel the mainshock motions on Nov. 5. However, note that the nearest neighbouring station, FD003, is at a similar distance from the epicenter and from the failed section of the dam, and shows much stronger high-frequency motions. Overall, there is a factor of 10 amplitude difference at high frequencies between the weakest record and the strongest record amongst the six nearly-equidistant sites across the Samarco region, for the May 2 earthquake. 36
37 Figure 24 Response spectra for the M3 event of May 2, 2016, which occurred ~70 km west of Samarco, for stations of the local network (red=horizontal components; blue=vertical components). Average site conditions for the observations are likely Class C. The median predictions of the Yenier and Atkinson (2015) GMPE for an event of M=3 with a stress of 80 bars at distances of 60 km and 80 km (B/C site conditions) are shown for comparison. 37


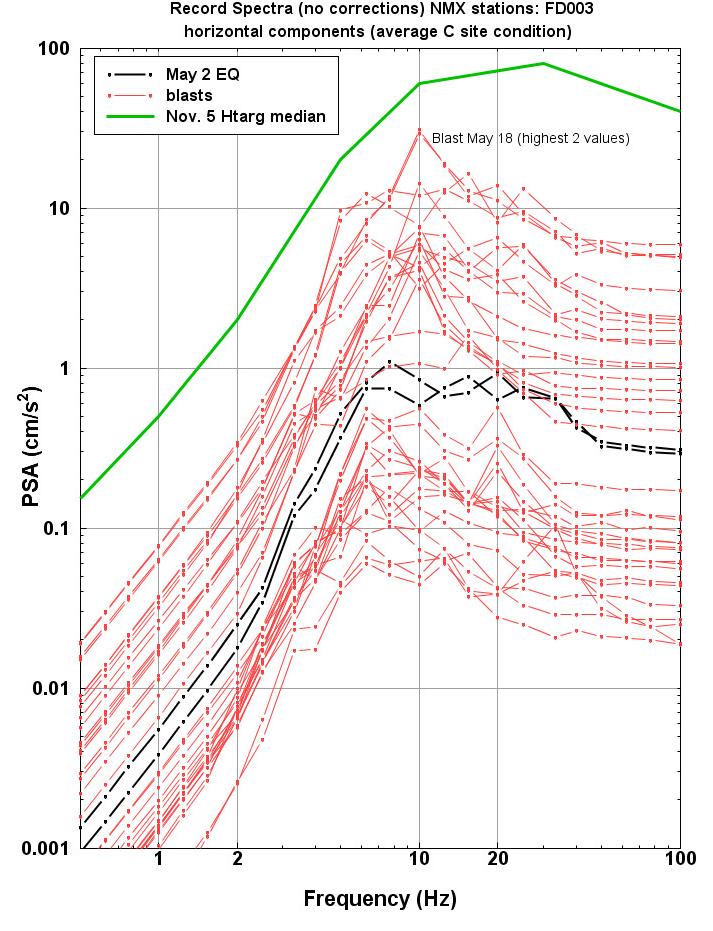
38 A snapshot of all of the recorded blast amplitudes at each of the stations is provided in Figure 25, in comparison to the target median spectrum for the Nov. 5 M2.5 earthquake. The amplitudes vary considerably from station to station. This is expected as the effects of attenuation for local blasts will be very significant across the network. Site response also plays a role, as can be appreciated by noting that the blast amplitudes as recorded at FD001 are about a factor of 10 lower than those recorded at FD003 overall. The response peak near 4 Hz noted for the May 2 earthquake on station FD002 is clearly visible in most of the blast records and is thus likely to be a site effect. Many of the blasts have a peak near 10 Hz, which may be a source effect. The source effects of the blasts are in general expected to be quite different from those of earthquakes. An interesting observation is that while overall the blasts are of lower amplitude than the motions from the Nov. 5 earthquake, some of the blast records approach the spectral level of the Nov. 5 earthquake in at least some frequency band. Considering that Samarco personnel often feel nearby blasting operations, it may be surmised from Figure 25 that the felt threshold for high frequency motions is likely in the 1 to 10 cm/s 2 range for high-frequency spectral acceleration. Samarco personnel reported the Nov. 5 mainshock as being much stronger shaking than typical blast motions, consistent with the observation that the target spectrum on Figure 25 is significantly above the blast amplitudes. 38
39 39
40 Figure 25 Recorded horizontal-component records for all events (May 1- May 20, 2016) at Nanometrics stations FD001 through FD006. The May 2 earthquake is shown by black lines, while red lines are believed to be blasts. The Nov spectrum is shown for comparison (green line). 40 The data collected on the local network can be used in combination with regional data on the USP and IRIS stations to gain insight into the regional attenuation characteristics, and to check the assumed attenuation model that was used to project regional observations from the Nov. 5 mainshock back to the source. There is some caution required in this exercise as blasts may attenuate differently than earthquakes due to their more monochromatic source characteristics. Moreover, the blast signals are very weak at regional distances (>150 km) and therefore both their low and high frequency amplitudes are significantly contaminated by noise at large distances, which could bias the attenuation slope. For these reasons, the attenuation characteristics are considered most robust in the mid-frequency band, where the signal is strongest, from approximately 3 to 5 Hz. Figure 26 provides a representative example of the attenuation, showing the amplitude decay of the two on-site blasts that occurred on May 3 and May 10, 2016 to regional distances, in comparison with the corresponding data for the May 2, 2016 M3 earthquake and the Nov. 5, 2015 M2.5 earthquake. Overall, the attenuation shape supports the assumed eastern North America attenuation model of Yenier and Atkinson (2015) that was used to project the Nov. 5 motions back to the source.
41 41 Figure 26 Example of blast attenuation (green symbols) to regional distances, compared to attenuation data for the M3 May 2 earthquake (red) and the M2.5 Nov. 5 earthquake (blue). The Yenier and Atkinson (2015) model (focal depth 2 km) is plotted for events of M2.0, 2.5 and 3.0 (lines). Data are response spectral amplitude at 3.33 Hz, horizontal components. We can use all of the attenuation data in the mid-frequency band, from local to regional distances, to estimate the uncertainty involved in projecting regional seismographic amplitudes back to the source. This helps to constrain the uncertainty in the source amplitudes for the Nov. 5 event. To do this, we calculate the residuals of observed response spectra, for both the blasts and earthquakes, with respect to the Yenier and Atkinson GMPE for a shallow event (depth 2 km), using the moment magnitude as determined for each event. The residual is defined as the difference between the log of the observed PSA
42 and the log of the predicted PSA (e.g. from YA15). For each event, at each considered frequency, we calculate an event term as the average residual taken over all of the regional stations (e.g. the stations at >100 km) that recorded that event. We subtract the average event term (for the corresponding event) from the residuals, to obtain normalized residuals. These normalized residuals show the deviation of amplitudes from the attenuation shape of the Yenier and Atkinson (2015) GMPE. Moreover, because we used just the data at R>100 km to calculate the event terms, the spread in residuals at local distances reflects both the aleatory variability in ground motions (random scatter) and the epistemic uncertainty that is involved in projecting regional amplitudes back to near-source distances. Note that using the event-corrected residuals will remove average site effects, but leave their variability effects, assuming that site conditions on the regional stations are similar on average to those on the local network. This is a reasonable assumption based on the similarity of the horizontal-to-vertical component ratios (an indicator of site response) on the stations. Figure 27 plots event-normalized residuals for those events for which we have well-known locations. These are blasts recorded by Nanometrics for which Samarco has provided the actual blast coordinates, enabling an accurate distance calculation. The May 2 earthquake residuals are also shown for reference. The figure shows that overall the attenuation model, when applied to the regional data, does a good job of reproducing the observed amplitudes at near distances in the mid-frequency band. Overall, the mean residual in the near-distance range (<20 km) is approximately zero. The standard deviation, representing both the aleatory and epistemic uncertainty, is approximately 0.5 log units, or a factor of 3.2. Thus the 84 th percentile confidence limits for the ground motions that occurred in the vicinity of the Fundao Dam on Nov. 5, 2015 (for B/C site conditions) are a factor of 3.2 times larger than the median (50 th percentile) motions as obtained by projecting the regionally-recorded motions back to near-source distances. The largest residuals represent ground motions that exceed the median by more than a factor of
43 43 Figure 27 Event-corrected residuals with respect to Yenier and Atkinson (2015) attenuation model, for horizontal component PSA at 3.33 and 5 Hz, for events with known locations. The spread of residuals at distances <10 km represents the range of uncertainty in estimating near-source motions from regional observations. One log unit is a factor of 10. Alternative Time History for Fundao for Nov. 5 event Additional time series can be constructed to represent the motions in the vicinity of Fundao Dam on Nov. 5 by correcting the records of the May 2, 2016 earthquake for the effects of attenuation. Figure 28 shows the effects of both attenuation and magnitude on ground motions for these two events, for the mid-frequency band where the regional records are most robust. The observations are in good accord with the GMPE. We use the attenuation rate given by the GMPE predictions to project the motions from 70 km back to a distance of 1 to 2 km, and also consider that the Nov. 5 event had a lower magnitude by ~0.5 units relative to the May 2 earthquake. The net effect is that the recorded motions at Samarco from the May 2 event should be scaled by a factor of approximately 50 to represent the amplitudes near-source for the Nov. 5 event.
 GMPE (focal depth 2 km) predictions (for B/C) are shown for comparison.")
. The record at FD005 was chosen because its spectral shape is closest to the target spectrum for B/C conditions.")
44 44 Figure 28 Attenuation of response spectra (2.5 Hz and 5 Hz, horizontal components) for the May 2, 2016 M3.0 earthquake, in comparison to the data from the Nov. 5, 2015 M2.5 earthquake. The Yenier and Atkinson (2015) GMPE (focal depth 2 km) predictions (for B/C) are shown for comparison. On Figure 29, the amplitudes recorded on station FD005 for the May 2 event, scaled by a factor of 50, are compared to the target spectrum for the Nov. 5 event (same target as was shown in previous figures). The record at FD005 was chosen because its spectral shape is closest to the target spectrum for B/C conditions. The choice of a record with the correct shape allows simple linear scaling to approximately match the target spectrum. Note that the scaled spectrum from May 2 on FD005 agrees well with the median near-source spectrum implied by the regional observations from the Nov. 5 earthquake. The 84 th
Short Note Orientation-Independent, Nongeometric-Mean Measures of Seismic Intensity from Two Horizontal Components of Motion
 Bulletin of the Seismological Society of America, Vol. 100, No. 4, pp. 1830 1835, August 2010, doi: 10.1785/0120090400 Short Note Orientation-Independent, Nongeometric-Mean Measures of Seismic Intensity
Chapter 8 3 September 2002 M = 4.75 Yorba Linda, California, earthquake
 272 Chapter 8 3 September 2002 M = 4.75 Yorba Linda, California, earthquake The M = 4.75 Yorba Linda, California earthquake occurred at 07 : 08 : 51.870 UT on 3 September 2002 in Orange County, in a densely
27th Seismic Research Review: Ground-Based Nuclear Explosion Monitoring Technologies
 SOURCE AND PATH EFFECTS ON REGIONAL PHASES IN INDIA FROM AFTERSHOCKS OF THE JANUARY 26, 2001, BHUJ EARTHQUAKE Arthur Rodgers 1, Paul Bodin 2, Luca Malagnini 3, Kevin Mayeda 1, and Aybige Akinci 3 Lawrence
Coda Waveform Correlations
 Chapter 5 Coda Waveform Correlations 5.1 Cross-Correlation of Seismic Coda 5.1.1 Introduction In the previous section, the generation of the surface wave component of the Green s function by the correlation
Effects of Surface Geology on Seismic Motion
 th IASPEI / IAEE International Symposium: Effects of Surface Geology on Seismic Motion August 6, University of California Santa Barbara COMPARISON BETWEEN V S AND SITE PERIOD AS SITE PARAMETERS IN GROUND-MOTION
Hector Mine, California, earthquake
 179 Chapter 5 16 October 1999 M=7.1 Hector Mine, California, earthquake The 1999 M w 7.1 Hector Mine earthquake sequence was the most recent of a series of moderate to large earthquakes on the Eastern
=, (1) Summary. Theory. Introduction
 Summary. Theory. Introduction") Noise suppression for detection and location of microseismic events using a matched filter Leo Eisner*, David Abbott, William B. Barker, James Lakings and Michael P. Thornton, Microseismic Inc. Summary
Noise suppression for detection and location of microseismic events using a matched filter Leo Eisner*, David Abbott, William B. Barker, James Lakings and Michael P. Thornton, Microseismic Inc. Summary
Identification of High Frequency pulse from Earthquake asperities along Chilean subduction zone using strong motion
 Identification of High Frequency pulse from Earthquake asperities along Chilean subduction zone using strong motion S. Ruiz 1,2, E. Kausel 1, J. Campos 1, R. Saragoni 1 and R. Madariaga 2. 1 University
A COMPARISON OF SITE-AMPLIFICATION ESTIMATED FROM DIFFERENT METHODS USING A STRONG MOTION OBSERVATION ARRAY IN TANGSHAN, CHINA
 A COMPARISON OF SITE-AMPLIFICATION ESTIMATED FROM DIFFERENT METHODS USING A STRONG MOTION OBSERVATION ARRAY IN TANGSHAN, CHINA Wenbo ZHANG 1 And Koji MATSUNAMI 2 SUMMARY A seismic observation array for
Bulletin of the Seismological Society of America, Vol. 73, No. 1. pp , February 1983
 Bulletin of the Seismological Society of America, Vol. 73, No. 1. pp. 297-305, February 1983 AN EARTHQUAKE ALARM SYSTEM FOR THE MAUI A OFFSHORE PLATFORM, NEW ZEALAND BY R. G. TYLER AND J. L. BECK ABSTRACT
Simulated Strong Ground Motion in Southern China based on Regional Seismographic Data and Stochastic Finite-Fault Model
 Simulated Strong Ground Motion in Southern China based on Regional Seismographic Data and Stochastic Finite-Fault Model Yuk Lung WONG and Sihua ZHENG ABSTRACT The acceleration time histories of the horizontal
Site-specific seismic hazard analysis
 Site-specific seismic hazard analysis ABSTRACT : R.K. McGuire 1 and G.R. Toro 2 1 President, Risk Engineering, Inc, Boulder, Colorado, USA 2 Vice-President, Risk Engineering, Inc, Acton, Massachusetts,
Influence of Peak Factors on Random Vibration Theory Based Site Response Analysis
 6 th International Conference on Earthquake Geotechnical Engineering 1-4 November 2015 Christchurch, New Zealand Influence of Peak Factors on Random Vibration Theory Based Site Response Analysis X. Wang
A COMPARISON OF TIME- AND FREQUENCY-DOMAIN AMPLITUDE MEASUREMENTS. Hans E. Hartse. Los Alamos National Laboratory
 OMPRISON OF TIME- N FREQUENY-OMIN MPLITUE MESUREMENTS STRT Hans E. Hartse Los lamos National Laboratory Sponsored by National Nuclear Security dministration Office of Nonproliferation Research and Engineering
Summary of Geometrical Spreading and Q Models from Recent Events
 Summary of Geometrical Spreading and Q Models from Recent Events Robert Graves, PhD Research Geophysicist US Geological Survey Pasadena, CA rwgraves@usgs.gov http://peer.berkeley.edu/ngaeast/ SMiRT-22:
Seismic intensities derived from strong motion instruments in New Zealand
 Seismic intensities derived from strong motion instruments in New Zealand P.N. Davenport Institute of Geological and Nuclear Sciences, Lower Hutt NZSEE 2001 Conference ABSTRACT: Intensity of ground shaking
Spatial coherency of earthquake-induced ground accelerations recorded by 100-Station of Istanbul Rapid Response Network
 Spatial coherency of -induced ground accelerations recorded by 100-Station of Istanbul Rapid Response Network Ebru Harmandar, Eser Cakti, Mustafa Erdik Kandilli Observatory and Earthquake Research Institute,
Ground Mo1on Database for SCRs: Development, and Products
 Ground Mo1on Database for SCRs: Development, A@ributes, and Products By Chris H. Cramer A presenta1on at the NGA East Special Session at SMiRT- 22 August 23, 2013 Goal: ground motions and metadata for
DQ-58 C78 QUESTION RÉPONSE. Date : 7 février 2007
 DQ-58 C78 Date : 7 février 2007 QUESTION Dans un avis daté du 24 janvier 2007, Ressources naturelles Canada signale à la commission que «toutes les questions d ordre sismique soulevées par Ressources naturelles
Contents of this file 1. Text S1 2. Figures S1 to S4. 1. Introduction
 Supporting Information for Imaging widespread seismicity at mid-lower crustal depths beneath Long Beach, CA, with a dense seismic array: Evidence for a depth-dependent earthquake size distribution A. Inbal,
28th Seismic Research Review: Ground-Based Nuclear Explosion Monitoring Technologies
 SEISMIC SOURCE LOCATIONS AND PARAMETERS FOR SPARSE NETWORKS BY MATCHING OBSERVED SEISMOGRAMS TO SEMI-EMPIRICAL SYNTHETIC SEISMOGRAMS: IMPROVEMENTS TO THE PHASE SPECTRUM PARAMETERIZATION David. Salzberg
FOURIER SPECTRA AND KAPPA 0 (Κ 0 ) ESTIMATES FOR ROCK STATIONS IN THE NGA-WEST2 PROJECT
 ESTIMATES FOR ROCK STATIONS IN THE NGA-WEST2 PROJECT") 10NCEE Tenth U.S. National Conference on Earthquake Engineering Frontiers of Earthquake Engineering July 21-25, 2014 Anchorage, Alaska FOURIER SPECTRA AND KAPPA 0 (Κ 0 ) ESTIMATES FOR ROCK STATIONS IN
10NCEE Tenth U.S. National Conference on Earthquake Engineering Frontiers of Earthquake Engineering July 21-25, 2014 Anchorage, Alaska FOURIER SPECTRA AND KAPPA 0 (Κ 0 ) ESTIMATES FOR ROCK STATIONS IN
Anisotropic Frequency-Dependent Spreading of Seismic Waves from VSP Data Analysis
 Anisotropic Frequency-Dependent Spreading of Seismic Waves from VSP Data Analysis Amin Baharvand Ahmadi* and Igor Morozov, University of Saskatchewan, Saskatoon, Saskatchewan amin.baharvand@usask.ca Summary
INFLUENCE OF STATIC DISPLACEMENT ON PEAK GROUND VELOCITY AT SITES THAT EXPERIENCED FORWARD-RUPTURE DIRECTIVITY
 Seismic Fault-induced Failures, 115-1, 1 January INFLUENCE OF STATIC DISPLACEMENT ON PEAK GROUND VELOCITY AT SITES THAT EXPERIENCED FORWARD-RUPTURE DIRECTIVITY Mladen V. Kostadinov 1 and Fumio Yamazaki
Response spectrum Time history Power Spectral Density, PSD
 A description is given of one way to implement an earthquake test where the test severities are specified by time histories. The test is done by using a biaxial computer aided servohydraulic test rig.
Module 2 WAVE PROPAGATION (Lectures 7 to 9)
") Module 2 WAVE PROPAGATION (Lectures 7 to 9) Lecture 9 Topics 2.4 WAVES IN A LAYERED BODY 2.4.1 One-dimensional case: material boundary in an infinite rod 2.4.2 Three dimensional case: inclined waves 2.5
Module 2 WAVE PROPAGATION (Lectures 7 to 9) Lecture 9 Topics 2.4 WAVES IN A LAYERED BODY 2.4.1 One-dimensional case: material boundary in an infinite rod 2.4.2 Three dimensional case: inclined waves 2.5
Quantitative Identification of Near-Fault Ground Motion using Baker s Method; an Application for March 2011 Japan M9.0 Earthquake
 Cite as: Tazarv, M., Quantitative Identification of Near-Fault Ground Motion using Baker s Method; an Application for March 2011 Japan M9.0 Earthquake, Available at: http://alum.sharif.ir/~tazarv/ Quantitative
A Rayleigh wave back-projection method applied to the 2011 Tohoku earthquake
 A Rayleigh wave back-projection method applied to the 2011 Tohoku earthquake Daniel Roten, Hiroe Miyake, and Kazuki Koketsu (2012), GRL Earthquake of the Week - 27 January 2012 Roten, D., H. Miyake, and
DERIVATION OF ATTNUATION RELATIONS OF ARIAS INTENSITY USING THE CHI-CHI EARTHQUAKE DATA
 13 th World Conference on Earthquake Engineering Vancouver, B.C., Canada August 1-6, 2004 Paper No. 3108 DERIVATION OF ATTNUATION RELATIONS OF ARIAS INTENSITY USING THE CHI-CHI EARTHQUAKE DATA Howard HWANG
Selection of Near-Fault Pulse Motions for Use in Design
 Selection of Near-Fault Pulse Motions for Use in Design C.P. Hayden, J.D. Bray, N.A. Abrahamson & A.L. Acevedo-Cabrera University of California, Berkeley, CA, USA SUMMARY: Earthquake ground motions in
Nonlinear Analysis of Pacoima Dam with Spatially Nonuniform Ground Motion
 Nonlinear Analysis of Pacoima Dam with Spatially Nonuniform Ground Motion Thesis by Steven W. Alves In Partial Fulfillment of the Requirements for the Degree of Doctor of Philosophy California Institute
Characterizing average properties of Southern California ground motion envelopes
 Characterizing average properties of Southern California ground motion envelopes G. Cua and T. H. Heaton Abstract We examined ground motion envelopes of horizontal and vertical acceleration, velocity,
A k-mean characteristic function to improve STA/LTA detection
 A k-mean characteristic function to improve STA/LTA detection Jubran Akram*,1, Daniel Peter 1, and David Eaton 2 1 King Abdullah University of Science and Technology (KAUST), Saudi Arabia 2 University
Magnitude determination using duration of high frequency energy radiation for the 2011 Off the Pacific Coast of Tohoku Earthquake
 Magnitude determination using duration of high frequency energy radiation for the 2011 Off the Pacific Coast of Tohoku Earthquake Tatsuhiko Hara International Institute of Seismology and Earthquake Engineering
Strong Motion Data: Structures
 Strong Motion Data: Structures Adam Pascale Chief Technology Officer, Seismology Research Centre a division of ESS Earth Sciences Treasurer, Australian Earthquake Engineering Society Why monitor buildings?
The high-frequency limit of usable response spectral ordinates from filtered analogue and digital strong-motion accelerograms
 EARTHQUAKE ENGINEERING AND STRUCTURAL DYNAMICS Earthquake Engng Struct. Dyn. 211; 4:1387 141 Published online 17 January 211 in Wiley Online Library (wileyonlinelibrary.com)..195 The high-frequency limit
Magnitude & Intensity
 Magnitude & Intensity Lecture 7 Seismometer, Magnitude & Intensity Vibrations: Simple Harmonic Motion Simplest vibrating system: 2 u( x) 2 + ω u( x) = 0 2 t x Displacement u ω is the angular frequency,
Performance of the GSN station SSE-IC,
 Performance of the GSN station SSE-IC, 1996-2009 A report in a series documenting the status of the Global Seismographic Network WQC Report 2010:10 March 4, 2010 Göran Ekström and Meredith Nettles Waveform
A hybrid method of simulating broadband ground motion: A case study of the 2006 Pingtung earthquake, Taiwan
 A hybrid method of simulating broadband ground motion: A case study of the 2006 Pingtung earthquake, Taiwan Y. T. Yen, C. T. Cheng, K. S. Shao & P. S. Lin Sinotech Engineering Consultants Inc., Taipei,
Estimating the epicenters of local and regional seismic sources, using the circle and chord method (Tutorial with exercise by hand and movies)
") Topic Estimating the epicenters of local and regional seismic sources, using the circle and chord method (Tutorial with exercise by hand and movies) Author Version Peter Bormann (formerly GFZ German Research
Topic Estimating the epicenters of local and regional seismic sources, using the circle and chord method (Tutorial with exercise by hand and movies) Author Version Peter Bormann (formerly GFZ German Research
IDENTIFICATION OF NONLINEAR SITE RESPONSE FROM TIME VARIATIONS OF THE PREDOMINANT FREQUENCY
 IDENTIFICATION OF NONLINEAR SITE RESPONSE FROM TIME VARIATIONS OF THE PREDOMINANT FREQUENCY K.L. Wen 1, C.W. Chang 2, and C.M. Lin 3 1 Professor, Institute of Geophysics, Central University (NCU), Taoyuan,
Chapter 4 Results. 4.1 Pattern recognition algorithm performance
 94 Chapter 4 Results 4.1 Pattern recognition algorithm performance The results of analyzing PERES data using the pattern recognition algorithm described in Chapter 3 are presented here in Chapter 4 to
Improvement of signal to noise ratio by Group Array Stack of single sensor data
 P-113 Improvement of signal to noise ratio by Artatran Ojha *, K. Ramakrishna, G. Sarvesam Geophysical Services, ONGC, Chennai Summary Shot generated noise and the cultural noise is a major problem in
TitleApplication of MEMS accelerometer t. AIZAWA, Takao; KIMURA, Toshinori; M Toshifumi; TAKEDA, Tetsuya; ASANO,
 TitleApplication of MEMS accelerometer t Author(s) AIZAWA, Takao; KIMURA, Toshinori; M Toshifumi; TAKEDA, Tetsuya; ASANO, Citation International Journal of the JCRM ( Issue Date 2008-12 URL http://hdl.handle.net/2433/85166
ESTIMATION OF SHEAR WAVE VELOCITY PROFILES USING MICROTREMOR ARRAY EXPLORATIONS IN ISMAILIA CITY, EGYPT
 ESTIMATION OF SHEAR WAVE VELOCITY PROFILES USING MICROTREMOR ARRAY EXPLORATIONS IN ISMAILIA CITY, EGYPT Mohamed Maklad MEE16704 Supervisor: Toshiaki Yokoi Takumi Hayashida ABSTRACT The Spatial Autocorrelation
Comparison of regional seismic phases interpretation in REB and KazNDC bulletins. Zlata I. Sinyova, Natalya N. Mikhailova
 Comparison of regional seismic phases interpretation in REB and bulletins. Zlata I. Sinyova, Natalya N. Mikhailova Institute of Geophysical Research, Almaty, Kazakhstan Abstracts. Three seismic arrays
DATABASE: SUMMARY, STATUS AND GROUND MOTION PRODUCTS
 07/14/2014 NGA-East SSHAC Workshop 2 1 DATABASE: SUMMARY, STATUS AND GROUND MOTION PRODUCTS Tadahiro Kishida Pacific Earthquake Engineering Research Center NGA-East SSHAC Workshop 2, Berkeley International
PACIFIC EARTHQUAKE ENGINEERING RESEARCH CENTER
 PACIFIC EARTHQUAKE ENGINEERING RESEARCH CENTER A Methodology for the Estimation of Kappa ( ) from Large Datasets: Example Application to Rock Sites in the NGA-East Database and Implications on Design Motions
(i) Sine sweep (ii) Sine beat (iii) Time history (iv) Continuous sine
 Sine sweep (ii) Sine beat (iii) Time history (iv) Continuous sine") A description is given of one way to implement an earthquake test where the test severities are specified by the sine-beat method. The test is done by using a biaxial computer aided servohydraulic test
A description is given of one way to implement an earthquake test where the test severities are specified by the sine-beat method. The test is done by using a biaxial computer aided servohydraulic test
Here I briefly describe the daily seismicity analysis procedure: Table 1
 A: More on Daily Seismicity Analysis Here I briefly describe the daily seismicity analysis procedure: Table 1 The broadband continuous data set was acquired as hour-long files. For this purpose I wrote
New Metrics Developed for a Complex Cepstrum Depth Program
 T3.5-05 Robert C. Kemerait Ileana M. Tibuleac Jose F. Pascual-Amadeo Michael Thursby Chandan Saikia Nuclear Treaty Monitoring, Geophysics Division New Metrics Developed for a Complex Cepstrum Depth Program
GENERAL GUIDELINES FOR APPLICATION OF THE EXTENDED SUBTRACTION METHOD IN SASSI SOIL-STRUCTURE INTERACTION ANALYSIS
 Transactions, SMiRT-22 GENERAL GUIDELINES FOR APPLICATION OF THE EXTENDED SUBTRACTION METHOD IN SASSI SOIL-STRUCTURE INTERACTION ANALYSIS C. C. Chin 1, Nan Deng 2, and Farhang Ostadan 3 1 Senior Engineer,
I\1AA/5EA WARFARE CENTERS NEWPORT
 I\1AA/5EA WARFARE CENTERS NEWPORT DEPARTMENT OF THE NAVY NAVAL UNDERSEA WARFARE CENTER DIVISION NEWPORT OFFICE OF COUNSEL PHONE: 401 832-3653 FAX: 401 832-4432 DSN: 432-3653 Attorney Docket No. 99213 Date:
24th Seismic Research Review Nuclear Explosion Monitoring: Innovation and Integration
 ON INFRASOUND DETECTION AND LOCATION STRATEGIES Rodney Whitaker, Douglas ReVelle, and Tom Sandoval Los Alamos National Laboratory Sponsored by National Nuclear Security Administration Office of Nonproliferation
Resolution and location uncertainties in surface microseismic monitoring
 Resolution and location uncertainties in surface microseismic monitoring Michael Thornton*, MicroSeismic Inc., Houston,Texas mthornton@microseismic.com Summary While related concepts, resolution and uncertainty
Design of a Line Array Point Source Loudspeaker System
 Design of a Line Array Point Source Loudspeaker System -by Charlie Hughes 6430 Business Park Loop Road Park City, UT 84098-6121 USA // www.soundtube.com // 435.647.9555 22 May 2013 Charlie Hughes The Design
Theoretical Aircraft Overflight Sound Peak Shape
 Theoretical Aircraft Overflight Sound Peak Shape Introduction and Overview This report summarizes work to characterize an analytical model of aircraft overflight noise peak shapes which matches well with
EXPLOITING AMBIENT NOISE FOR SOURCE CHARACTERIZATION OF REGIONAL SEISMIC EVENTS
 EXPLOITING AMBIENT NOISE FOR SOURCE CHARACTERIZATION OF REGIONAL SEISMIC EVENTS ABSTRACT Michael H. Ritzwoller, Anatoli L. Levshin, and Mikhail P. Barmin University of Colorado at Boulder Sponsored by
Phased Array Velocity Sensor Operational Advantages and Data Analysis
 Phased Array Velocity Sensor Operational Advantages and Data Analysis Matt Burdyny, Omer Poroy and Dr. Peter Spain Abstract - In recent years the underwater navigation industry has expanded into more diverse
Solution of Pipeline Vibration Problems By New Field-Measurement Technique
 Purdue University Purdue e-pubs International Compressor Engineering Conference School of Mechanical Engineering 1974 Solution of Pipeline Vibration Problems By New Field-Measurement Technique Michael
Communication Engineering Prof. Surendra Prasad Department of Electrical Engineering Indian Institute of Technology, Delhi
 Communication Engineering Prof. Surendra Prasad Department of Electrical Engineering Indian Institute of Technology, Delhi Lecture - 16 Angle Modulation (Contd.) We will continue our discussion on Angle
EDDIE: Spectral Seismology
 EDDIE: Spectral Seismology This module was initially developed by Soule, D. S., M. Weirathmuller, G. Kroeger, and R. Darner Gougis. 20 March 2017. EDDIE: Spectral Seismology. EDDIE Module 10, Version 1.
Short Notes Characterization of a Continuous, Very Narrowband Seismic Signal near 2.08 Hz
 Bulletin of the Seismological Society of America, 91, 6, pp. 1910 1916, December 2001 Short Notes Characterization of a Continuous, Very Narrowband Seismic Signal near 2.08 Hz by Kelly H. Liu and Stephen
P34 Determination of 1-D Shear-Wave Velocity Profileusing the Refraction Microtremor Method
 P34 Determination of 1-D Shear-Wave Velocity Profileusing the Refraction Microtremor Method E. Baniasadi* (University of Tehran), M. A. Riahi (University of Tehran) & S. Chaychizadeh (University of Tehran)
Infrasonic Observations of the Hekla Eruption of February 26, 2000
 JOURNAL OF LOW FREQUENCY NOISE, VIBRATION AND ACTIVE CONTROL Pages 1 8 Infrasonic Observations of the Hekla Eruption of February 26, 2000 Ludwik Liszka 1 and Milton A. Garces 2 1 Swedish Institute of Space
Real-time testing of the on-site warning algorithm in southern California and its performance during the July M w 5.4 Chino Hills earthquake
 Click Here for Full Article GEOPHYSICAL RESEARCH LETTERS, VOL. 36, L00B03, doi:10.1029/2008gl036366, 2009 Real-time testing of the on-site warning algorithm in southern California and its performance during
29th Monitoring Research Review: Ground-Based Nuclear Explosion Monitoring Technologies
 SEISMIC SOURCE LOCATIONS AND PARAMETERS FOR SPARSE NETWORKS BY MATCHING OBSERVED SEISMOGRAMS TO SEMI-EMPIRICAL SYNTHETIC SEISMOGRAMS: APPLICATIONS TO LOP NOR AND NORTH KOREA David Salzberg and Margaret
Microtremor Array Measurements and Three-component Microtremor Measurements in San Francisco Bay Area
 Microtremor Array Measurements and Three-component Microtremor Measurements in San Francisco Bay Area K. Hayashi & D. Underwood Geometrics, Inc., United States SUMMARY: Microtremor array measurements and
Geophysical Journal International
 Geophysical Journal International Geophys. J. Int. (2014) 197, 458 463 Advance Access publication 2014 January 20 doi: 10.1093/gji/ggt516 An earthquake detection algorithm with pseudo-probabilities of
EWGAE 2010 Vienna, 8th to 10th September
 EWGAE 2010 Vienna, 8th to 10th September Frequencies and Amplitudes of AE Signals in a Plate as a Function of Source Rise Time M. A. HAMSTAD University of Denver, Department of Mechanical and Materials
Precision of Geomagnetic Field Measurements in a Tectonically Active Region
 J. Geomag. Geoelectr., 36, 83-95, 1984 Precision of Geomagnetic Field Measurements in a Tectonically Active Region M.J.S. JOHNSTON,* R.J. MUELLER,* R.H. WARE,** and P.M. DAVIS*** * U.S. Geological Survey,
Application Note 106 IP2 Measurements of Wideband Amplifiers v1.0
 Application Note 06 v.0 Description Application Note 06 describes the theory and method used by to characterize the second order intercept point (IP 2 ) of its wideband amplifiers. offers a large selection
Electronic Noise Effects on Fundamental Lamb-Mode Acoustic Emission Signal Arrival Times Determined Using Wavelet Transform Results
 DGZfP-Proceedings BB 9-CD Lecture 62 EWGAE 24 Electronic Noise Effects on Fundamental Lamb-Mode Acoustic Emission Signal Arrival Times Determined Using Wavelet Transform Results Marvin A. Hamstad University
Assessing the accuracy of directional real-time noise monitoring systems
 Proceedings of ACOUSTICS 2016 9-11 November 2016, Brisbane, Australia Assessing the accuracy of directional real-time noise monitoring systems Jesse Tribby 1 1 Global Acoustics Pty Ltd, Thornton, NSW,
Interference in stimuli employed to assess masking by substitution. Bernt Christian Skottun. Ullevaalsalleen 4C Oslo. Norway
 Interference in stimuli employed to assess masking by substitution Bernt Christian Skottun Ullevaalsalleen 4C 0852 Oslo Norway Short heading: Interference ABSTRACT Enns and Di Lollo (1997, Psychological
RAPID MAGITUDE DETERMINATION FOR TSUNAMI WARNING USING LOCAL DATA IN AND AROUND NICARAGUA
 RAPID MAGITUDE DETERMINATION FOR TSUNAMI WARNING USING LOCAL DATA IN AND AROUND NICARAGUA Domingo Jose NAMENDI MARTINEZ MEE16721 Supervisor: Akio KATSUMATA ABSTRACT The rapid magnitude determination of
Broadband Signal Enhancement of Seismic Array Data: Application to Long-period Surface Waves and High-frequency Wavefields
 Broadband Signal Enhancement of Seismic Array Data: Application to Long-period Surface Waves and High-frequency Wavefields Frank Vernon and Robert Mellors IGPP, UCSD La Jolla, California David Thomson
Study of Hydrocarbon Detection Methods in Offshore Deepwater Sediments, Gulf of Guinea*
 Study of Hydrocarbon Detection Methods in Offshore Deepwater Sediments, Gulf of Guinea* Guoping Zuo 1, Fuliang Lu 1, Guozhang Fan 1, and Dali Shao 1 Search and Discovery Article #40999 (2012)** Posted
A multi-window algorithm for real-time automatic detection and picking of P-phases of microseismic events
 A multi-window algorithm for real-time automatic detection and picking of P-phases of microseismic events Zuolin Chen and Robert R. Stewart ABSTRACT There exist a variety of algorithms for the detection
Multicomponent seismic polarization analysis
 Saul E. Guevara and Robert R. Stewart ABSTRACT In the 3-C seismic method, the plant orientation and polarity of geophones should be previously known to provide correct amplitude information. In principle
ANALYSIS ON RESPONSE OF DYNAMIC SYSTEMS TO PULSE SEQUENCES EXCITATION
 International Journal of Advanced Structural Engineering, Vol., No., Pages 3-5, July 9 Islamic Azad University, South Tehran Branch ANALYSIS ON RESPONSE OF DYNAMIC SYSTEMS TO PULSE SEQUENCES EXCITATION
Supplementary Materials for
 advances.sciencemag.org/cgi/content/full/1/11/e1501057/dc1 Supplementary Materials for Earthquake detection through computationally efficient similarity search The PDF file includes: Clara E. Yoon, Ossian
Ambient Passive Seismic Imaging with Noise Analysis Aleksandar Jeremic, Michael Thornton, Peter Duncan, MicroSeismic Inc.
 Aleksandar Jeremic, Michael Thornton, Peter Duncan, MicroSeismic Inc. SUMMARY The ambient passive seismic imaging technique is capable of imaging repetitive passive seismic events. Here we investigate
The COMPLOC Earthquake Location Package
 The COMPLOC Earthquake Location Package Guoqing Lin and Peter Shearer Guoqing Lin and Peter Shearer Scripps Institution of Oceanography, University of California San Diego INTRODUCTION This article describes
Understanding Seismic Amplitudes
 Understanding Seismic Amplitudes The changing amplitude values that define the seismic trace are typically explained using the convolutional model. This model states that trace amplitudes have three controlling
Noise Measurements Using a Teledyne LeCroy Oscilloscope
 Noise Measurements Using a Teledyne LeCroy Oscilloscope TECHNICAL BRIEF January 9, 2013 Summary Random noise arises from every electronic component comprising your circuits. The analysis of random electrical
Empirical Attenuation of Ground-Motion Spectral Amplitudes in Southeastern Canada and the Northeastern United States
 Bulletin of the Seismological Society of America, Vol. 94, No. 3, pp. 79 95, June 4 Empirical Attenuation of Ground-Motion Spectral Amplitudes in Southeastern anada and the Northeastern United States by
Module 4 TEST SYSTEM Part 2. SHAKING TABLE CONTROLLER ASSOCIATED SOFTWARES Dr. J.C. QUEVAL, CEA/Saclay
 Module 4 TEST SYSTEM Part 2 SHAKING TABLE CONTROLLER ASSOCIATED SOFTWARES Dr. J.C. QUEVAL, CEA/Saclay DEN/DM2S/SEMT/EMSI 11/03/2010 1 2 Electronic command Basic closed loop control The basic closed loop
Low wavenumber reflectors
 Low wavenumber reflectors Low wavenumber reflectors John C. Bancroft ABSTRACT A numerical modelling environment was created to accurately evaluate reflections from a D interface that has a smooth transition
System Inputs, Physical Modeling, and Time & Frequency Domains
 System Inputs, Physical Modeling, and Time & Frequency Domains There are three topics that require more discussion at this point of our study. They are: Classification of System Inputs, Physical Modeling,
Is VS30 an Effective Parameter for Site Characterization? Norm Abrahamson PG&E
 Is VS3 an Effective Parameter for Site Characterization? Norm Abrahamson PG&E Before VS3 Generic Site Categories Used in Western U.S. GMPEs Soft soil Soil Requires special consideration Deep soil excluding
1.Earthquake Early Warning System. Japan Meteorological Agency
 1 st Process 1.Earthquake Early Warning System Estimation Estimation of of Hypocenter, Hypocenter, Magnitude Magnitude and and Seismic Seismic Intensity Intensity Dissemination Dissemination 2. 2. Present
Experimental investigation of crack in aluminum cantilever beam using vibration monitoring technique
 International Journal of Computational Engineering Research Vol, 04 Issue, 4 Experimental investigation of crack in aluminum cantilever beam using vibration monitoring technique 1, Akhilesh Kumar, & 2,
ON LOW-FREQUENCY ERRORS OF UNIFORMLY MODULATED FILTERED WHITE-NOISE MODELS FOR GROUND MOTIONS
 EARTHQUAKE ENGNEERNG AND STRUCTURAL DYNAMCS, VOL. 16, 381-388 (1988) ON LOW-FREQUENCY ERRORS OF UNFORMLY MODULATED FLTERED WHTE-NOSE MODELS FOR GROUND MOTONS ERDAL SAFAK* AND DAVD M. BOORE+ U.S. Geological
System Identification and CDMA Communication
 System Identification and CDMA Communication A (partial) sample report by Nathan A. Goodman Abstract This (sample) report describes theory and simulations associated with a class project on system identification
Dependence of GMRotI50 on Tmax4Penalty for the penalty function: Recommend use RotD50 rather than GMRotI50
 Dependence of GMRotI5 on Tmax4Penalty for the penalty function: Recommend use RotD5 rather than GMRotI5 David M. Boore 24 June 21 Last year Norm Abrahamson suggested a new measure of ground motion that
29th Monitoring Research Review: Ground-Based Nuclear Explosion Monitoring Technologies
 BASIC RESEARCH ON SEISMIC AND INFRASONIC MONITORING OF THE EUROPEAN ARCTIC ABSTRACT Frode Ringdal, Tormod Kværna, Svein Mykkeltveit, Steven J. Gibbons, and Johannes Schweitzer NORSAR Sponsored by Army
High Precision Positioning Unit 1: Accuracy, Precision, and Error Student Exercise
 High Precision Positioning Unit 1: Accuracy, Precision, and Error Student Exercise Ian Lauer and Ben Crosby (Idaho State University) This assignment follows the Unit 1 introductory presentation and lecture.
FACTORS AFFECTING DIMINISHING RETURNS FOR SEARCHING DEEPER 1
 Factors Affecting Diminishing Returns for ing Deeper 75 FACTORS AFFECTING DIMINISHING RETURNS FOR SEARCHING DEEPER 1 Matej Guid 2 and Ivan Bratko 2 Ljubljana, Slovenia ABSTRACT The phenomenon of diminishing
(Gibbons and Ringdal 2006, Anstey 1964), but the method has yet to be explored in the context of acoustic damage detection of civil structures.
, but the method has yet to be explored in the context of acoustic damage detection of civil structures.") ABSTRACT There has been recent interest in using acoustic techniques to detect damage in instrumented civil structures. An automated damage detection method that analyzes recorded data has application
ABSTRACT There has been recent interest in using acoustic techniques to detect damage in instrumented civil structures. An automated damage detection method that analyzes recorded data has application