IAT 355 Visual Analytics. Luminance, Contrast and Colour in Information Display. Lyn Bartram
|
|
|
- Clement Chambers
- 6 years ago
- Views:
Transcription
1 IAT 355 Visual Analytics Luminance, Contrast and Colour in Information Display Lyn Bartram

2 Simultaneous contrast effects a gray patch placed on a dark background looks lighter than the same gray patch on a light background. Contrast, Luminance and Colour IAT
3 Assimilation of lightness The gray background with black lines appears to be darker while the gray background with white lines appears to be lighter. Contrast, Luminance and Colour IAT

4 Mach bands Illusory Mach bands appear when gradients from darker to lighter shades are created Contrast, Luminance and Colour IAT
5 Mach bands The effect is robust with different shapes and numbers of gradients Image from perceptualstuff.org Contrast, Luminance and Colour IAT

6 Mach bands The effect is robust with different shapes and numbers of gradients Image from perceptualstuff.org Contrast, Luminance and Colour IAT

7 Mach bands The effect is robust with different shapes and numbers of gradients Image from perceptualstuff.org Contrast, Luminance and Colour IAT

8 Chevreuil Illusion When a sequence of gray bands is generated, the bands appear darker at one edge than at the other, even though they are uniform Contrast, Luminance and Colour IAT

9 Chevreuil Illusion Again, this also works in colour and with irregular borders. Note we are not talking about hue change but luminance change Image from perceptualstuff.org Contrast, Luminance and Colour IAT

10 Dynamic Luminance Changes in apparent brightness with quick changes in viewing distance Image from perceptualstuff.org Contrast, Luminance and Colour IAT

11 The Breathing Light Illusion Change in apparent brightness as you move closer in and farther away quickly Gori, S. & Stubbs, D. A. ( 2006). A new set of illusions - The Dynamic Luminance-Gradient Illusion and the Breathing Light Illusion. Perception. 35, Image from perceptualstuff.org Contrast, Luminance and Colour IAT

12 The Café Wall Illusion The tiles appear to be wedge shaped and the lines curved but are actually evenly rectangular Contrast, Luminance and Colour IAT
13 Effects cause error! Simultaneous contrast effects can result in large errors of judgment when reading quantitative (value) information displayed using a gray scale. Ware et al showed an average error of 20% of the entire gray scale in a map encoding gravity fields using 16 levels of gray. Contrast, Luminance and Colour IAT
14 Cornsweet effect Which area is lighter than the other? These areas appear different in lightness, but are in fact the same Contrast, Luminance and Colour IAT

15 Cornsweet effect These areas appear different in lightness, but are in fact the same Contrast, Luminance and Colour IAT

16 On the other hand.. The enhancement of edges is also an important part of some artists techniques Seurat deliberately enhanced edge contrast to make his figures stand out. Contrast, Luminance and Colour IAT


17 Low spatial frequency modulation Contrast, Luminance and Colour IAT
18 Luminance, Brightness and Lightness Luminance refers to the measured amount of light coming from some region of space. Physical measure, not perceptual quantity Brightness generally refers to the perceived amount of light coming from a source. It is used to refer only to things that are perceived as selfluminous. A bright light Lightness generally refers to the perceived reflectance of a surface. A white surface is light. A black surface is dark Contrast, Luminance and Colour IAT

19 Luminance, Contrast and Constancy Contrast, Luminance and Colour IAT

20 Crispening Contrast, Luminance and Colour IAT
21 What about colour? Colour perception is relative We are sensitive to small differences hence need sixteen million colours Not sensitive to absolute values hence we can only use < 10 colours for coding Contrast, Luminance and Colour IAT

22 Vischeck Simulates color vision deficiencies Web service or Photoshop plug-in Robert Dougherty and Alex Wade Deuteranope Protanope Tritanope Contrast, Luminance and Colour IAT

23 2D Color Space Contrast, Luminance and Colour IAT
24 Similar Colors protanop e deuteranop e Contrast, Luminance and Colour IAT luminance
25 Contrast, Luminance and Colour IAT

26 Smart Money Contrast, Luminance and Colour IAT

27 Color Design Terminology Hue (color wheel) Red, yellow, blue (primary) Orange, green, purple (secondary) Opposites complement (contrast) Adjacent are analogous Many different color wheels* *See for examples Chroma (saturation) Intensity or purity Distance from gray Value (lightness) Dark to light Applies to all colors, not just gray
28 Tints and Tones Tone or shade Hue + black Decrease saturation Decrease lightness Tint Hue + white Decrease saturation Increase lightness

29

30 Gradations
31 Psuedo-Perceptual Models HLS, HSV, HSB NOT perceptual models Simple renotation of RGB View along gray axis See a hue hexagon L or V is grayscale pixel value Cannot predict perceived lightness Contrast, Luminance and Colour IAT


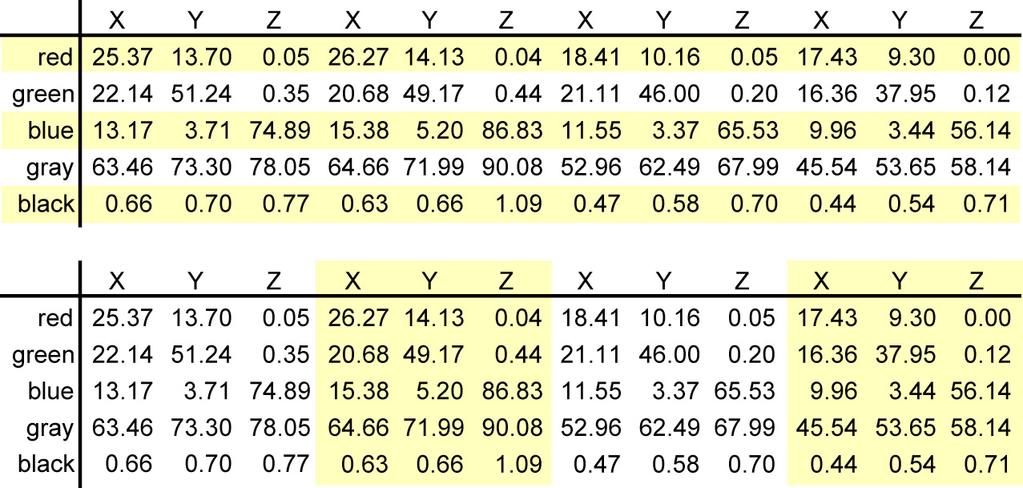
32 L vs. Luminance, L* Corners of the RGB color cube Luminance values (retinal response) L* values L from HLS All the same Contrast, Luminance and Colour IAT


33 What makes color effective? Good ideas executed with superb craft E.R. Tufte
34 Information Display Graphical presentation of information Charts, graphs, diagrams, maps, illustrations Originally hand-crafted, static Now computer-generated, dynamic Color is a key component Color labels and groups Color scales (colormaps) Multi-variate color encoding Color shading and textures And more Colour includes Grey


35 A quick revisit of data characteristics What kind of task are you hoping to support? What kind of data do you have? No single approach Techniques and tools in context
36 Types of values Nominal: names without ordering Continents: Africa, America, Asia, Australia, Europe No concept of relative relationship other than inclusion in the set Ordinal: Before-than than relationship holds Rental cars: Economy, Compact, Mid-sized, Full-sized Distance is not uniform Quantitative: Relative measurements, equal distances, numeric
37 Color Design Principles Control value (lightness) Ensure legibility Avoid unwanted emphasis Use a limited hue palette Control color pop out Define color grouping Avoid clutter from too many competing colors Use neutral backgrounds Control impact of color Minimize simultaneous contrast

38 Envisioning Information avoiding catastrophe becomes the first principle in bringing color to information: Above all, do no harm. E. R. Tufte
39 Fundamental Uses To label (colour as noun) To measure ( colour as quantity/value) To represent (colour as representation) to imitate reality To enliven or decorate (colour as beauty)
40 To Label (nominal coding)


41 Colour great for classification Rapid visual segmentation Colour helps us determine type Only about six categories Information Visualization Colin Ware

42 Product Categories Created by Tableau - Visual Analysis for Databases TM
43 Grouping, Highlighting
44 Considerations for Labels How critical is the color encoding? Unique specification or is it a hint? Quick response, or time for inspection? Is there a legend, or need it be memorized? Contextual issues Are there established semantics? Grouping or ordering relationships? Surrounding shapes and colors? Shape and structural issues How big are the objects? How many objects, and could they overlap? Need they be readable, or only visible (discernible)?
45 Psychophysics of Labeling Preattentive, pop out Time proportional to the number of digits Time proportional to the number of 7 s Both 3 s and 7 s Pop out
46 Contrast Creates Pop-out Hue and lightness Lightness only

47 Pop-out vs. Distinguishable Pop-out Typically, 5-6 distinct values simultaneously Up to 9 under controlled conditions Distinguishable 20 easily for reasonable sized stimuli More if in a controlled context Usually need a legend

48 Radio Spectrum Map (33 colors)


49 Distinguishable on Inspection
50 Cultural semantics The fact that certain colours are special is because they are hard wired The meaning of those colours is culturally determined
51 Summary: labeling Distinctiveness (perceptual distance) Unique hues Don t choose colours from the same category! Contrast with background Luminance Compensate for colour blindness Limited number of codes Size Objects should not be too small Cultural conventions
52 To Measure
 Most accurate if quantized Quantized Signal varies continuously Discretized Restricted to a prescribed set of")
53 Data to Color Types of data values Nominal, ordinal, numeric Qualitative, sequential, diverging Types of color scales Hue scale Nominal (labels) Cyclic (learned order) Lightness or saturation scales Ordered scales Lightness best for high frequency More = darker (or more saturated) Most accurate if quantized Quantized Signal varies continuously Discretized Restricted to a prescribed set of values
54 Pseudocoloring Pseudocoloring is the technique of representing continuously varying map values with a sequence of colours Sometimes overlaid on luminosity information Need to use an isoluminant color map to avoid distortion intuitive based on lightness, saturation No perceptually based hue scales Need to be learned


55 Pseudocoloring


56 Density Map Lightness scale Lightness scale with hue and chroma variation Rainbow hue scale Unordered hue, lightness

57 Different Scales Rogowitz & Treinish, How not to lie with visualization
58 Brewer Scales Qulitative scales nominal Distinct hues, but similar emphasis Sequential scale Vary in lightness and saturation Vary slightly in hue Diverging scale Complementary sequential scales Neutral at zero Cross-fade through a neutral color

59 Brewer s Categories Cynthia Brewer, Pennsylvania State University

60 Thematic Maps US Census Map Mapping Census 2000: The Geography of U.S. Diversity

61 Color Brewer
62 Heat Map (default ramp) Skewed Data Slightly negative

63 Full Range Skewed Data
64 Stepped Skewed Data

65 Threshold Skewed Data
 PET color highlights")
66 Color and Shading Shape is defined by lightness (shading) Color (hue, saturation) labels Image courtesy of Siemens CT image (defines shape) PET color highlights tumor

67 Color Overlay (Temperature) 3D line integral convolution to visualize 3D flow (LIC). Color varies from red to yellow with increasing temperature Victoria Interrante and Chester Grosch, U. Minnesota
68 Multivariate Color Sequences
69 How many dimensions? Univariate scale is a path in a colour space Progression along a line Multivariate is: Plane? 2D Volume? 3D Rules for color mixing Only perceptual coding is 2D lightness x saturation Color for multivariate only works well for highly quantized data Like a mnemonic for a labeling scheme

70 Multi-dimensional Scatter plot Variable 1, 2 X, Y Variable 3, 4, 5 R, G, B Do people interpret color blends as sums of variables? Using Color Dimensions to Display Data Dimensions Beatty and Ware
 Spatial texture")
 Haleh Hagh-Shenas, Victoria Interrante,")
71 Color Weaves 6 variables = 6 hues, which vary in brightness Additive mixture (blend) Spatial texture (weave) Weaving versus Blending (APGV06 and SIGGRAPH poster) Haleh Hagh-Shenas, Victoria Interrante, Christopher Healey and Sunghee Kim

72 Brewer System IAT355 Colour for Information Display


73 Brewer Examples
74 To Represent or Imitate Reality

75 Illustrative Color Gray s Anatomy of the Human Body Map of Point Reyes

76 ThemeView (original) Courtesy of Pacific Northwest National Laboratories
")
77 ThemeScape (commercial) Courtesy of Cartia
78 To Enliven or Decorate

79 Which has more information? Which would you rather look at? Visualization of isoelectron density surfaces around molecules Marc Levoy (1988)
80 More Tufte Principles Limit the use of bright colors Small bright areas, dull backgrounds Use the colors found in nature Familiar, naturally harmonious Use grayed colors for backgrounds Quiet, versatile Create color unity Repeat, mingle, interweave
81 Controlling Value
82 Get it right in black & white Value Perceived lightness/darkness Controlling value primary rule for design Value defines shape No edge without lightness difference No shading without lightness variation Value difference (contrast) Defines legibility Controls attention Creates layering

83 Controls Legibility colorusage.arc.nasa.gov

84 Legibility Drop Shadows Drop Shadow Drop shadow adds edge Primary colors on white Primary colors on white Primary colors on white Primary colors on white Primary colors on white Primary colors on white Primary colors on black Primary colors on black Primary colors on black Primary colors on black Primary colors on black Primary colors on black
85 Readability If you can t use color wisely, it is best to avoid it entirely Above all, do no harm If you can t use color wisely, it is best to avoid it entirely Above all, do no harm.
86 Why does the logo work?

87 Why does this logo work so well? Value control
88 Contrast and Layering Value contrast creates layering Context Urgent Normal Normal Context Context Urgent Normal Normal Context Context Urgent Normal Normal Context colorusage.arc.nasa.gov
89 What Defines Layering? Perceptual features Contrast (especially lightness) Color, shape and texture Task and attention Attention affects perception Display characteristics Brightness, contrast, gamma Emergency Emergency Emergency
90 General guidelines or from Tufte to practice [Stone, Ware] Assign colour according to function Use contrast to highlight Use analogy to group Control value contrast for legibility Break isoluminance with borders

91 From principles to palettes Limit palette to 2 or 3 colours and use variations within them Different choices convey different messages
92 Tableau Color Example Color palettes How many? Algorithmic? Basic colors (regular and pastel) Extensible? Customizable? Color appearance As a function of size As a function of background Robust and reliable color names

93 Tableau Colors

94 Maximum hue separation

95 Analogous, yet distinct
96 Sequential
97

98 Stephen Few s practical rules on charts 1. If you want different objects of the same color in a table or graph to look the same, make sure that the background the color that surrounds them is consistent. 2. If you want objects in a table or graph to be easily seen, use a background color that contrasts sufficiently with the object. Don t do this!


99 Few (2) 3. Use colour only when needed to serve a particular communication goal 4. Use different colours only when they correspond to differences of meaning in the data
100 Few (3) 5. Use soft, natural colors to display most information and bright and/or dark colors to highlight information that requires greater attention. 6. When using color to encode a sequential range of quantitative values, stick with a single hue (or a small set of closely related hues) and vary intensity from pale colors for low values to increasingly darker and brighter colors for high values.
101 Few (4) 7. Non-data components of tables and graphs should be displayed just visibly enough to perform their role, but no more so, for excessive salience could cause them to distract attention from the data 8. Avoid using red/green display without redundant cueing 9. Avoid using visual effects in graphs

102 Additional Resources on Color Even without the u. Stone Soup website Final copy of slides, references A Field Guide to Digital Color Maureen C. Stone Published by A.K. Peters Stephen Few s articles on color
CPSC / Colour
 CPSC 599.28/601.28 Colour Sheelagh Carpendale What makes colour effective? Good ideas executed with superb craft E.R. Tufte Effective colour needs a context Immediate vs. studied Anyone vs. specialist
CPSC 583 Colour. Sheelagh Carpendale
 CPSC 583 Colour Sheelagh Carpendale References Colin Ware. (2004) Information Visualization: Perception for Design. Morgan Kaufmann. Maureen Stone. (2003) A field guide to digital color. AK Peters Bernice
Color in Information Display RIT Seminar October 5, 2005
 Information Display Color in Information Display Maureen Stone StoneSoup Consulting Woodinville, WA Graphical presentation of information Charts, graphs, diagrams, maps, illustrations Originally hand-crafted,
CPSC 583 Colour. Sheelagh Carpendale
 CPSC 583 Colour Sheelagh Carpendale References Colin Ware. (2004) Information Visualization: Perception for Design. Morgan Kaufmann. Maureen Stone. (2003) A field guide to digital color. AK Peters Bernice
Colour + Perception. CMPT 467/767 Visualization Torsten Möller. Pfister/Möller
 Colour + Perception CMPT 467/767 Visualization Torsten Möller Recommended Reading http://www.stonesc.com/ 2 Where / What 3 Based on slide from Mazur Contours & Texture C. Ware, Visual Thinking for Design
A Brief Plug. Color in Information Display. Color includes Gray. Information Display. Color In Information Display, SIAT 1/24/2006
 A Brief Plug Color in Information Display Maureen Stone StoneSoup Consulting Woodinville, WA Information Display Color includes Gray Graphical presentation of information Charts, graphs, diagrams, maps,
Contrast, Luminance and Colour
 Contrast, Luminance and Colour Week 3 Lecture 1 IAT 814 Lyn Bartram Some of these slides have been borrowed and adapted from Maureen Stone and Colin Ware What is gray? Colour space is 3 dimensions 1 achromatic
Color. Maneesh Agrawala Jessica Hullman. CS : Visualization Fall Assignment 3: Visualization Software
 Color Maneesh Agrawala Jessica Hullman CS 294-10: Visualization Fall 2014 Assignment 3: Visualization Software Create a small interactive visualization application you choose data domain and visualization
Goals for this Course. Color in Information Display. What this Course is Not. Effective Color. Why Should You Care? What makes color effective?
 Goals for this Course Color in Information Display Maureen Stone StoneSoup Consulting Woodinville, WA Course Notes on http://www.stonesc.com/vis05 Improve the use of color in visualization Why use color?
What creates good color design?
 What about this wheel thingy? It sounds a terribly interesting project. Ah, said the marketing girl, well, we're having a little difficulty there. Difficulty? exclaimed Ford. Difficulty? What do you mean,
CSE512 :: 6 Feb Color. Jeffrey Heer University of Washington
 CSE512 :: 6 Feb 2014 Color Jeffrey Heer University of Washington 1 Color in Visualization Identify, Group, Layer, Highlight Colin Ware 2 Purpose of Color To label To measure To represent and imitate To
Comp/Phys/Apsc 715. Example Videos. Administrative 1/23/2014. Lecture 5: Trichromacy, Color Spaces, Properties of Color
 Comp/Phys/Apsc 715 Lecture 5: Trichromacy, Color Spaces, Properties of Color 1 Example Videos Segmentation and visualization of neurons Astro Visualization (the Millennium Run) Dragonfly Flight Analysis
Marks + Channels. Large Data Visualization Torsten Möller. Munzner/Möller
 Marks + Channels Large Data Visualization Torsten Möller Overview Marks + channels Channel effectiveness Accuracy Discriminability Separability Popout Channel characteristics Spatial position Colour Size
CSE 332/564: Visualization. Fundamentals of Color. Perception of Light Intensity. Computer Science Department Stony Brook University
 Perception of Light Intensity CSE 332/564: Visualization Fundamentals of Color Klaus Mueller Computer Science Department Stony Brook University How Many Intensity Levels Do We Need? Dynamic Intensity Range
Adapted from the Slides by Dr. Mike Bailey at Oregon State University
 Colors in Visualization Adapted from the Slides by Dr. Mike Bailey at Oregon State University The often scant benefits derived from coloring data indicate that even putting a good color in a good place
EnvSci 360 Computer and Analytical Cartography
 EnvSci 360 Computer and Analytical Cartography Lecture 6 Mapping with Color Why Use Color? It is one of the available visual variables you can mix with other graphic elements to improve communication Color
Colors in Images & Video
 LECTURE 8 Colors in Images & Video CS 5513 Multimedia Systems Spring 2009 Imran Ihsan Principal Design Consultant OPUSVII www.opuseven.com Faculty of Engineering & Applied Sciences 1. Light and Spectra
LECTURE 07 COLORS IN IMAGES & VIDEO
 MULTIMEDIA TECHNOLOGIES LECTURE 07 COLORS IN IMAGES & VIDEO IMRAN IHSAN ASSISTANT PROFESSOR LIGHT AND SPECTRA Visible light is an electromagnetic wave in the 400nm 700 nm range. The eye is basically similar
CS 544 Human Abilities
 CS 544 Human Abilities Color Perception and Guidelines for Design Preattentive Processing Acknowledgement: Some of the material in these lectures is based on material prepared for similar courses by Saul
Geography 360 Principles of Cartography. April 24, 2006
 Geography 360 Principles of Cartography April 24, 2006 Outlines 1. Principles of color Color as physical phenomenon Color as physiological phenomenon 2. How is color specified? (color model) Hardware-oriented
Hue is what makes a color identifiable and different from any other color, e.g. orange, red-orange, red.
 Hue Hue is what makes a color identifiable and different from any other color, e.g. orange, red-orange, red. Hues are determined (and can be measured) by a color's wavelength. There are millions of hues
Part I: Color Foundations The Basic Principles of COLOUR theory
 Part I: Color Foundations The Basic Principles of COLOUR theory Colour Systems Available colour systems are dependent on the medium with which a designer is working. When painting, an artist has a variety
The Use of Color in Multidimensional Graphical Information Display
 The Use of Color in Multidimensional Graphical Information Display Ethan D. Montag Munsell Color Science Loratory Chester F. Carlson Center for Imaging Science Rochester Institute of Technology, Rochester,
LIGHTIG FOR INTERIORS
 LIGHTIG FOR INTERIORS COLORS LIGHTING Interior Design Department Third grade/ Fall semester Siba nazem Kady COLORS THEORIES OF COLOR DESIGN Review The Hue REVIEW HUE,VALUE, AND SATURATION - Gradation of
Understand brightness, intensity, eye characteristics, and gamma correction, halftone technology, Understand general usage of color
 Understand brightness, intensity, eye characteristics, and gamma correction, halftone technology, Understand general usage of color 1 ACHROMATIC LIGHT (Grayscale) Quantity of light physics sense of energy
COLOR AS A DESIGN ELEMENT
 COLOR COLOR AS A DESIGN ELEMENT Color is one of the most important elements of design. It can evoke action and emotion. It can attract or detract attention. I. COLOR SETS COLOR HARMONY Color Harmony occurs
Figure 1: Energy Distributions for light
 Lecture 4: Colour The physical description of colour Colour vision is a very complicated biological and psychological phenomenon. It can be described in many different ways, including by physics, by subjective
Elements and Principles
 Elements and Principles of Art The building blocks and how we use them Your recipe for creating art! Lets learn the ingredients! ART INGREDIENTS! Elements of Art: The basic building blocks/ foundation
Art Vocabulary Assessment
 Art Vocabulary Assessment Name: Date: Abstract Artwork in which the subject matter is stated in a brief, simplified manner; little or no attempt is made to represent images realistically, and objects are
Color Theory and Mixing
 MODULE 4 Color Theory and Mixing? What is explored in this module? In this module, we ll look at basic color theory and mixing colors. You ll find that color theory and mixing is not a perfect science.
GRAPHICS TECHNOLOGY II
 GRAPHICS TECHNOLOGY II COLORS ARE PART OF OUR LIFE From the clothes we wear, to the things around us, the food we eat, the things we use- everything. Colors are said to activate the right brain for emotions.
Applying Colour & Style. Christopher Wesson London Borough of Redbridge
 Applying Colour & Style Christopher Wesson London Borough of Redbridge The components of colour Generally, the colours on our maps are made up of combinations of Red Green Blue from light sources such
Chapter 3 Part 2 Color image processing
 Chapter 3 Part 2 Color image processing Motivation Color fundamentals Color models Pseudocolor image processing Full-color image processing: Component-wise Vector-based Recent and current work Spring 2002
Color Perception and Applications. Penny Rheingans University of Maryland Baltimore County. Overview
 Color Perception and Applications SIGGRAPH 99 Course: Fundamental Issues of Visual Perception for Effective Image Generation Penny Rheingans University of Maryland Baltimore County Overview Characteristics
The human visual system
 The human visual system Vision and hearing are the two most important means by which humans perceive the outside world. 1 Low-level vision Light is the electromagnetic radiation that stimulates our visual
Notes on colour mixing
 INFORMATION SHEET These notes, with the diagrams in colour, can be found on the internet at: http://www.andrewnewland.com/homepage/teaching Notes on colour mixing Andrew Newland T E A C H I N G A R T &
Objective Explain design concepts used to create digital graphics.
 Objective 102.01 Explain design concepts used to create digital graphics. PART 1: ELEMENTS OF DESIGN o Color o Line o Shape o Texture o Watch this video on Fundamentals of Design. 2 COLOR o Helps identify
Color, Vision, & Perception. Outline
 Color, Vision, & Perception CS 160, Fall 97 Professor James Landay September 24, 1997 9/24/97 1 Outline Administrivia Review Human visual system Color perception Color deficiency Guidelines for design
Color Wheel. Warm Colors. Cool Colors
 Color Wheel Warm Colors Cool Colors How we see color: the light source gives a full spectrum of wavelengths (All 6 colors). The cup absorbs every wave length of color except Blue. Blue is reflected back
Introduction to Color Theory
 Systems & Biomedical Engineering Department SBE 306B: Computer Systems III (Computer Graphics) Dr. Ayman Eldeib Spring 2018 Introduction to With colors you can set a mood, attract attention, or make a
HISTOGRAMS. These notes are a basic introduction to using histograms to guide image capture and image processing.
 HISTOGRAMS Roy Killen, APSEM, EFIAP, GMPSA These notes are a basic introduction to using histograms to guide image capture and image processing. What are histograms? Histograms are graphs that show what
The basic tenets of DESIGN can be grouped into three categories: The Practice, The Principles, The Elements
 Vocabulary The basic tenets of DESIGN can be grouped into three categories: The Practice, The Principles, The Elements 1. The Practice: Concept + Composition are ingredients that a designer uses to communicate
Spears Art Studio High School and Adult Beginners Painting with Oil and/oracrylic. Can You Answer? Brushy Creek
 Spears Art Studio High School and Adult Beginners Painting with Oil and/oracrylic Can You Answer? Brushy Creek Brushy Creek reference photo and painting D. S. Spears oil on canvas image size: 40"x30" Spears
color basics theory & application Fall 2013 Ahmed Ansari Communication Design Fundamentals
 color basics theory & application Fall 2013 Ahmed Ansari Communication Design Fundamentals Presentation 7 Tom Fraser + Adam Banks Designer's Color Manual Johannes Itten The Art of Color Ellen Lupton &
Computers and Imaging
 Computers and Imaging Telecommunications 1 P. Mathys Two Different Methods Vector or object-oriented graphics. Images are generated by mathematical descriptions of line (vector) segments. Bitmap or raster
By: Zaiba Mustafa. Copyright
 By: Zaiba Mustafa Copyright 2009 www.digiartport.net Line: An element of art that is used to define shape, contours, and outlines, also to suggest mass and volume. It may be a continuous mark made on a
CS 565 Computer Vision. Nazar Khan PUCIT Lecture 4: Colour
 CS 565 Computer Vision Nazar Khan PUCIT Lecture 4: Colour Topics to be covered Motivation for Studying Colour Physical Background Biological Background Technical Colour Spaces Motivation Colour science
Cognition and Perception
 Cognition and Perception 2/10/10 4:25 PM Scribe: Katy Ionis Today s Topics Visual processing in the brain Visual illusions Graphical perceptions vs. graphical cognition Preattentive features for design
Elements of Art. Define: Line. Shape. Value. Texture. Color. Form. Space
 Elements of Art Line Shape Value Texture Color Form Space Directions: When we talk about the parts that make up a picture or work of art, we refer to them as elements. In the space below, draw a picture
Digital Image Processing. Lecture # 6 Corner Detection & Color Processing
 Digital Image Processing Lecture # 6 Corner Detection & Color Processing 1 Corners Corners (interest points) Unlike edges, corners (patches of pixels surrounding the corner) do not necessarily correspond
Slide 1. Slide 2. Slide 3. Light and Colour. Sir Isaac Newton The Founder of Colour Science
 Slide 1 the Rays to speak properly are not coloured. In them there is nothing else than a certain Power and Disposition to stir up a Sensation of this or that Colour Sir Isaac Newton (1730) Slide 2 Light
Introduction. The Spectral Basis for Color
 Introduction Color is an extremely important part of most visualizations. Choosing good colors for your visualizations involves understanding their properties and the perceptual characteristics of human
Our Color Vision is Limited
 CHAPTER Our Color Vision is Limited 5 Human color perception has both strengths and limitations. Many of those strengths and limitations are relevant to user interface design: l Our vision is optimized
THE MEANING OF COLOR VISUAL COMMUNICATION III 3D DESIGN PRINCIPLES
 COLOR THE MEANING OF COLOR Color in design is very subjective. What evokes one reaction in one person may evoke a very different reaction in someone else. Sometimes this is due to personal preference,
ARTS D Design. Project 1: Art Elements. Reading Guide: form. elements of art. line. shape. value. texture. color. principles of organization
 ARTS 101 2-D Design Project 1: Art Elements Reading Guide: form elements of art line shape value texture color principles of organization harmony variety balance proportion dominance movement economy unity
In order to manage and correct color photos, you need to understand a few
 In This Chapter 1 Understanding Color Getting the essentials of managing color Speaking the language of color Mixing three hues into millions of colors Choosing the right color mode for your image Switching
Image and video processing (EBU723U) Colour Images. Dr. Yi-Zhe Song
 Colour Images. Dr. Yi-Zhe Song") Image and video processing () Colour Images Dr. Yi-Zhe Song yizhe.song@qmul.ac.uk Today s agenda Colour spaces Colour images PGM/PPM images Today s agenda Colour spaces Colour images PGM/PPM images History
Image and video processing () Colour Images Dr. Yi-Zhe Song yizhe.song@qmul.ac.uk Today s agenda Colour spaces Colour images PGM/PPM images Today s agenda Colour spaces Colour images PGM/PPM images History
Overview of Human Cognition and its Impact on User Interface Design (Part 2)
") Overview of Human Cognition and its Impact on User Interface Design (Part 2) Brief Recap Gulf of Evaluation What is the state of the system? Gulf of Execution What specific inputs needed to achieve goals?
Overview of Human Cognition and its Impact on User Interface Design (Part 2) Brief Recap Gulf of Evaluation What is the state of the system? Gulf of Execution What specific inputs needed to achieve goals?
A Basic Guide to Photoshop Adjustment Layers
 A Basic Guide to Photoshop Adjustment Layers Photoshop has a Panel named Adjustments, based on the Adjustment Layers of previous versions. These adjustments can be used for non-destructive editing, can
Elements Of Art Study Guide
 Elements Of Art Study Guide General Elements of Art- tools artists use to create artwork; Line, shape, color, texture, value, space, form Composition- the arrangement of elements of art to create a balanced
Choose Paint Colors and Schemes
 Choose Paint Colors and Schemes When you re decorating your home, choosing the right paint colors is the most important decision you ll make. As fun as choosing colors can be, this part of the planning
H10: Description of Colour
 page 1 of 7 H10: Description of Colour Appearance of objects and materials Appearance attributes can be split into primary and secondary parts, as shown in Table 1. Table 1: The attributes of the appearance
Lecture 8. Human Information Processing (1) CENG 412-Human Factors in Engineering May
 CENG 412-Human Factors in Engineering May") Lecture 8. Human Information Processing (1) CENG 412-Human Factors in Engineering May 30 2009 1 Outline Visual Sensory systems Reading Wickens pp. 61-91 2 Today s story: Textbook page 61. List the vision-related
Lecture 8. Human Information Processing (1) CENG 412-Human Factors in Engineering May 30 2009 1 Outline Visual Sensory systems Reading Wickens pp. 61-91 2 Today s story: Textbook page 61. List the vision-related
COLOR Cartographic Design & Principles Winter 2016
 COLOR Cartographic Design & Principles Winter 2016 Edward Tufte s Color Tufteisms Graphical excellence is the well-designed presentation of interesting data a matter of substance, of statistics, and of
Elements of Art Principles of Organization
 Elements of Art Principles of Organization Robert Spahr Associate Professor Department of Cinema & Photography rspahr@siu.edu http://www.robertspahr.com Pieter Claesz. (Dutch, about 1597 1660), Still
Lecture 3: Grey and Color Image Processing
 I22: Digital Image processing Lecture 3: Grey and Color Image Processing Prof. YingLi Tian Sept. 13, 217 Department of Electrical Engineering The City College of New York The City University of New York
Value. Value-It is the lightness or darkness of an object, regardless of color. Value is relative to the background color and other items on the page.
 Value Value-It is the lightness or darkness of an object, regardless of color. Value is relative to the background color and other items on the page. Value is created by a light source that shines on an
Fig Color spectrum seen by passing white light through a prism.
 1. Explain about color fundamentals. Color of an object is determined by the nature of the light reflected from it. When a beam of sunlight passes through a glass prism, the emerging beam of light is not
Name: Period: THE ELEMENTS OF ART
 Name: Period: THE ELEMENTS OF ART Name: Period: An element of art that is used to define shape, contours, and outlines, also to suggest mass and volume. It may be a continuous mark made on a surface with
Art & Design visual elements
 Make your own colour scheme Which 20 colours suit you best? Choose 20 of your favourite colours out of the different stacks on the tables. Make sure to group harmonious colours together. Discuss the place
ART CRITICISM: elements//principles
 ART CRITICISM: elements//principles ELEMENTS OF DESIGN LINE SHAPE FORM SPACE TEXTURE COLOR PRINCIPLES OF DESIGN RHYTHM MOVEMENT BALANCE EMPHASIS VARIETY UNITY PROPORTION ELEMENTS building blocks of art
Color Reproduction. Chapter 6
 Chapter 6 Color Reproduction Take a digital camera and click a picture of a scene. This is the color reproduction of the original scene. The success of a color reproduction lies in how close the reproduced
Seeing the Values of Colors
 Level: Beginner to Intermediate Flesch-Kincaid Grade Level:. Flesch-Kincaid Reading Ease:. Drawspace Curriculum..R - Pages and 9 Illustrations Seeing the Values of Colors A richly-illustrated introduction
Art 2D Mid-Term Review 2018
 Art 2D Mid-Term Review 2018 Definition: What is a Line? Definition: Line is the most basic design tool. A line has length, width, tone, and texture. It may divide space, define a form, describe contour,
Understanding Color Theory Excerpt from Fundamental Photoshop by Adele Droblas Greenberg and Seth Greenberg
 Understanding Color Theory Excerpt from Fundamental Photoshop by Adele Droblas Greenberg and Seth Greenberg Color evokes a mood; it creates contrast and enhances the beauty in an image. It can make a dull
Colors in Scientific Visualization. Mike Bailey Oregon State University
 Colors in Scientific Visualization Mike Bailey Oregon State University The often scant benefits derived from coloring data indicate that even putting a good color in a good place is a complex matter. Indeed,
Color Science. What light is. Measuring light. CS 4620 Lecture 15. Salient property is the spectral power distribution (SPD)
") Color Science CS 4620 Lecture 15 1 2 What light is Measuring light Light is electromagnetic radiation Salient property is the spectral power distribution (SPD) [Lawrence Berkeley Lab / MicroWorlds] exists
Color Science CS 4620 Lecture 15 1 2 What light is Measuring light Light is electromagnetic radiation Salient property is the spectral power distribution (SPD) [Lawrence Berkeley Lab / MicroWorlds] exists
For a long time I limited myself to one color as a form of discipline. Pablo Picasso. Color Image Processing
 For a long time I limited myself to one color as a form of discipline. Pablo Picasso Color Image Processing 1 Preview Motive - Color is a powerful descriptor that often simplifies object identification
A Basic Guide to Photoshop CS Adjustment Layers
 A Basic Guide to Photoshop CS Adjustment Layers Alvaro Guzman Photoshop CS4 has a new Panel named Adjustments, based on the Adjustment Layers of previous versions. These adjustments can be used for non-destructive
CIE tri-stimulus experiment. Color Value Functions. CIE 1931 Standard. Color. Diagram. Color light intensity for visual color match
 CIE tri-stimulus experiment diffuse reflecting screen diffuse reflecting screen 770 769 768 test light 382 381 380 observer test light 445 535 630 445 535 630 observer light intensity for visual color
IMAGES AND COLOR. N. C. State University. CSC557 Multimedia Computing and Networking. Fall Lecture # 10
 IMAGES AND COLOR N. C. State University CSC557 Multimedia Computing and Networking Fall 2001 Lecture # 10 IMAGES AND COLOR N. C. State University CSC557 Multimedia Computing and Networking Fall 2001 Lecture
Line. The path created by a point moving through space. i n. Horizontal Line. Thin Line. Thick Line
 Line The path created by a point moving through space. V er Horizontal Line Diagonal Line Zig-Zag Line Wavy Line t i c a l L i n e Spiral Line Thin Line Thick Line Line can help create the illusion of
Color Image Processing
 Color Image Processing Jesus J. Caban Outline Discuss Assignment #1 Project Proposal Color Perception & Analysis 1 Discuss Assignment #1 Project Proposal Due next Monday, Oct 4th Project proposal Submit
Properties of Color. Value: Tint: Shade: Tone: Intensity:
 Seeing Color Color and light are inseparable, without light there would be no color When light passes through a prism a spectrum of colors becomes visible Defining Color Hue The name of a color, such
Digital Image Processing
 Digital Image Processing IMAGE PERCEPTION & ILLUSION Hamid R. Rabiee Fall 2015 Outline 2 What is color? Image perception Color matching Color gamut Color balancing Illusions What is Color? 3 Visual perceptual
Using Color in Scientific Visualization
 Using Color in Scientific Visualization Mike Bailey The often scant benefits derived from coloring data indicate that even putting a good color in a good place is a complex matter. Indeed, so difficult
VC 16/17 TP4 Colour and Noise
 VC 16/17 TP4 Colour and Noise Mestrado em Ciência de Computadores Mestrado Integrado em Engenharia de Redes e Sistemas Informáticos Hélder Filipe Pinto de Oliveira Outline Colour spaces Colour processing
Color images C1 C2 C3
 Color imaging Color images C1 C2 C3 Each colored pixel corresponds to a vector of three values {C1,C2,C3} The characteristics of the components depend on the chosen colorspace (RGB, YUV, CIELab,..) Digital
Introduction to computer vision. Image Color Conversion. CIE Chromaticity Diagram and Color Gamut. Color Models
 Introduction to computer vision In general, computer vision covers very wide area of issues concerning understanding of images by computers. It may be considered as a part of artificial intelligence and
With colours you can set a mood, attract attention, or make a statement. You can use colour to energise, or to cool down. By selecting the right
 COLOUR With colours you can set a mood, attract attention, or make a statement. You can use colour to energise, or to cool down. By selecting the right colour scheme, you can create an ambiance of elegance,
COLOR and the human response to light
 COLOR and the human response to light Contents Introduction: The nature of light The physiology of human vision Color Spaces: Linear Artistic View Standard Distances between colors Color in the TV 2 How
Color & Graphics. Color & Vision. The complete display system is: We'll talk about: Model Frame Buffer Screen Eye Brain
 Color & Graphics The complete display system is: Model Frame Buffer Screen Eye Brain Color & Vision We'll talk about: Light Visions Psychophysics, Colorimetry Color Perceptually based models Hardware models
Color in Scientific Visualization
 Color in Scientific Visualization Mike Bailey mjb@cs.oregonstate.edu colorinvis.pptx The often scant benefits derived from coloring data indicate that even putting a good color in a good place is a complex
Color and Color Model. Chap. 12 Intro. to Computer Graphics, Spring 2009, Y. G. Shin
 Color and Color Model Chap. 12 Intro. to Computer Graphics, Spring 2009, Y. G. Shin Color Interpretation of color is a psychophysiology problem We could not fully understand the mechanism Physical characteristics
check it out online at
 check it out online at www.belyea.com/svc/all_about_color.pdf Who am I? I got the blues Experience and Emotions through color PASSION JOY Depression HARMONY CREATIVITY PEACE MOURNING It s a bird, it s
Additive Color Synthesis
 Color Systems Defining Colors for Digital Image Processing Various models exist that attempt to describe color numerically. An ideal model should be able to record all theoretically visible colors in the
Visual Perception. Jeff Avery
 Visual Perception Jeff Avery Source Chapter 4,5 Designing with Mind in Mind by Jeff Johnson Visual Perception Most user interfaces are visual in nature. So, it is important that we understand the inherent
DESIGNING FLOWER BEDS with
 DESIGNING FLOWER BEDS with Good flower bed designs incorporate many different features Relative surface feel or look On plants, texture comes from Leaves Twigs Bark Texture also comes from Rocks Pavement
CREATIVITY AND DESIGN SKILLS QUESTION BANK
 UNIVERSITY OF CALICUT SCHOOL OF DISTANCE EDUCATION BMMC (2011 Admn.) IV SEMESTER CORE COURSE CREATIVITY AND DESIGN SKILLS QUESTION BANK 1. Creativity a. Origination of new thing b. Duplication c. modified
LIGHTIG FOR INTERIORS
 LIGHTIG FOR INTERIORS COLORS- Lecture 4 LIGHTING Interior Design Department Third grade/ Fall semester Siba nazem Kady COLORS 1. COLOR 2. FORM AND COLOR 1. COLOR COLORS Color Interaction Color never appears