Far field intensity distributions of an OMEGA laser beam were measured with
|
|
|
- Dinah Robbins
- 5 years ago
- Views:
Transcription
1 Experimental Investigation of the Far Field on OMEGA with an Annular Apertured Near Field Uyen Tran Advisor: Sean P. Regan Laboratory for Laser Energetics Summer High School Research Program Abstract Far field intensity distributions of an OMEGA laser beam were measured with either an annular or a circular aperture placed in the near field. Annular and circular apertures were constructed and installed in the down-collimated beam of the OMEGA Wavefront Sensor (OWS). The annular aperture blocked the central portion of the beam with radii less than two thirds of the near field radius, while the circular aperture allowed only the central portion of the beam to propagate to the far field. One-nanosecond square laser pulses smoothed with 1 THz Smoothing by Spectral Dispersion (SSD) and polarization smoothing were studied. Power spectra of far fields measured with the UV Equivalent Target Place (UVETP) diagnostic were computed for each aperture and compared with measurements of the standard configuration on OMEGA with no near field aperture. Simulations show good agreement with the experimental data.
2 Introduction Laser beam smoothing is essential for direct-drive inertial confinement fusion. Nonuniformities in laser irradiation imprint target mass perturbations, which seed the ablative Rayleigh-Taylor hydrodynamic instability and degrade target performance. Single beam laser-irradiation nonuniformities are reduced using the following smoothing techniques: (1) smoothing by spectral dispersion (SSD), (2) distributed phase plates (DPPs), and (3) polarization smoothing (PS). This investigation centered mainly upon the measurements of far field intensity distributions of an OMEGA laser beam with an annular apertured near field, a circular near field and a non-apertured near field. The non-apertured near field is the standard configuration used on OMEGA and is the control in this experiment. The apertures were constructed and installed in the down-collimated beam of the OMEGA Wavefront Sensor (OWS). One aperture was a circle with a diameter of two-thirds the diameter of the OMEGA near field and the other aperture, an annulus, was the inverse of the circular aperture. Far fields of one-nanosecond square laser pulses smoothed with 1 THz SSD and polarization smoothing (PS) were recorded with the ultraviolet equivalent target plane (UVETP) diagnostic and power spectra were calculated. Simulations are shown to be in good agreement with the experimental results. The following sections discuss (1) the simulations of the near field, the far field, and the power spectral density of the far field intensity distribution and what they signify, (2) the construction and installation of near field apertures on the OWS and the far-field measurements with the ultraviolet equivalent target plane (UVETP) diagnostic, and (3)
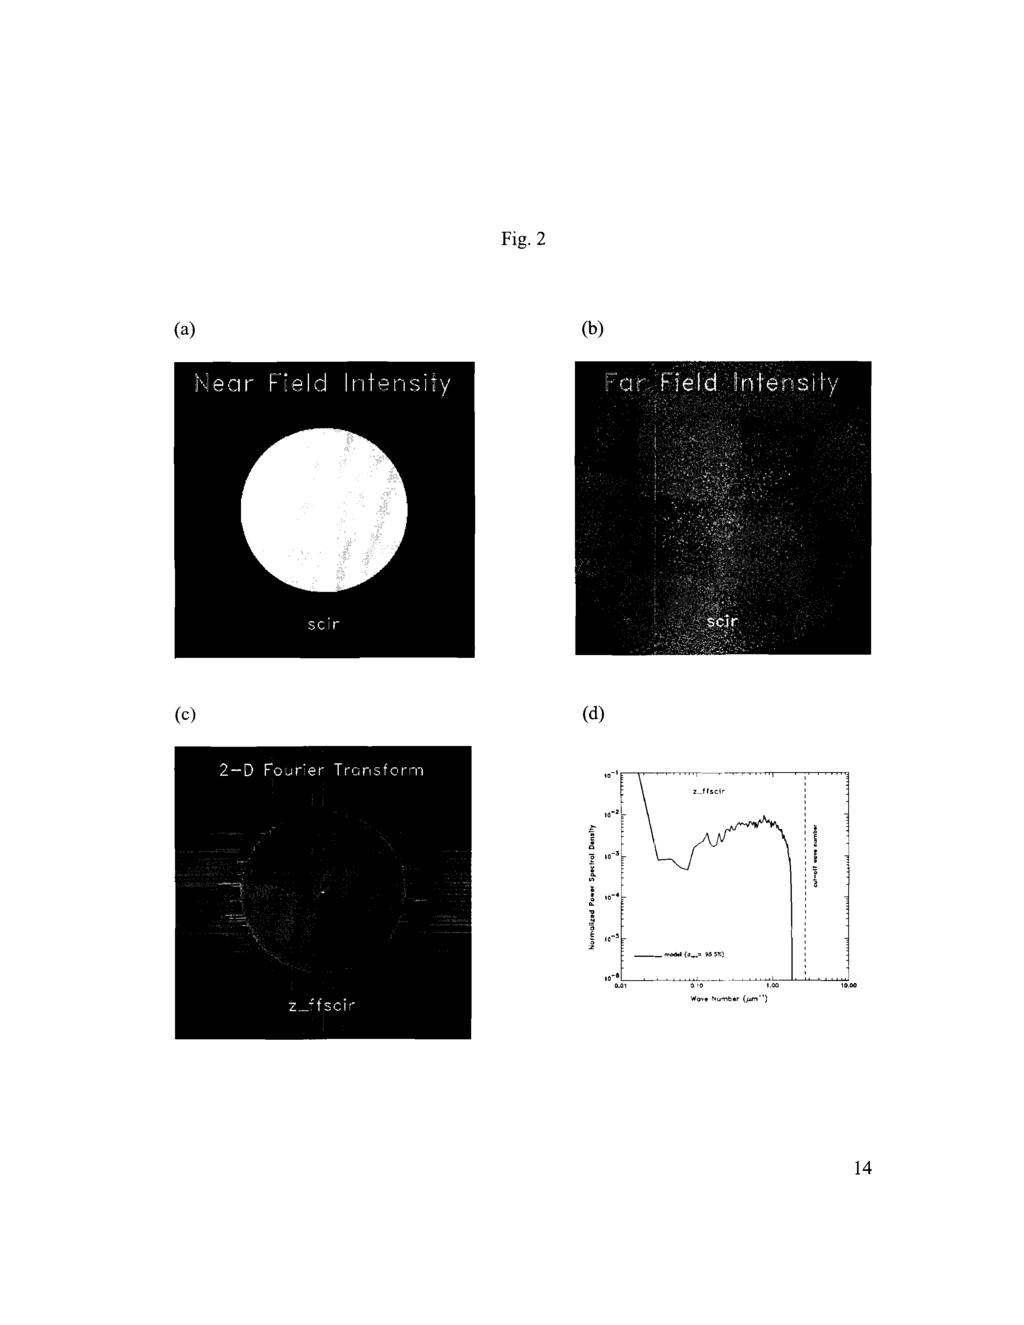
3 the results of this investigation. The discussed results can be extrapolated to SSD smoothing of beams that irradiate only a portion of the phase plate, such as the dynamic focal spot size using a static phase plate. Far Field Analysis Using computer codes written in the PV-WAVE language, models were made to simulate the near field of the OMEGA laser beam. The first type of near field that was modeled was the near field that corresponds to the control in this experiment. This is a near field without an aperture. The diameter of the circular near field on OMEGA is approximately 27 cm as seen in Fig. la. The modulus squared of the two-dimensional Fourier transform of the UV near field electric field is the far field, which is shown in Fig. 1 b. Taking another Fourier transform yielded an image shown in Fig. lc that resembled the near field. But more importantly, this image allowed the power spectrum of the far field intensity distributions to be analyzed. To obtain the power spectrum, the azimuthal sum of the square of the Fourier amplitudes was taken. The power spectrum is the intensity of the beam at various wave numbers k. The power spectral density (PSD) in Fig. 1 d can be used to quantify the smoothness of the laser beam intensity profile. For example, one may compare the PSD of one model to another, or one experiment to another, or even a model to an experiment. Smoothing can also be compared by calculating the single beam irradiation nonuniformity om,, which is defined as the square root of the ratio of the power in the high frequencies (k>0.04 pm-') to the power in the low frequencies (k<0.04 pm-'). The or,, of the beam modeled in Fig. 1 without SSD and PS is 100%. Laser beam smoothing reduces the om,.
4 Secondly, a model of a near field with a circular aperture in place was created using PV-WAVE. The circular aperture made the near field a circle with a diameter of approximately 18 cm, or two thirds of the diameter of the non-apertured near field. This may be viewed in Fig. 2a. A far field image was obtained, shown in Fig. 2b, and it was noted that the speckle pattern produced contained speckles that were larger than those of the far field produced by a Fourier transform of a near field without an aperture. The power spectrum for the far field produced by this type of near field was calculated (Fig. 2c) and analyzed. The power spectrum shown in Fig. 2d resembled the one produced by the non-apertured near field, but a notable difference was that this graph, Fig. 2d, had a lower cutoff wavenumber than the graph associated with the near field without an aperture. This can be explained when one compares Fig. lc with Fig. 2c. Both of the images are circular, but Fig lc has more power at larger radii. The equation used to calculate the cut-off wave number is given as 2xDlhF where I>=27 cm is the diameter of the OMEGA beam, k0.351 pm is the laser wavelength, and F=180 cm is the focal length of the OMEGA lens. When the circular aperture was placed in the near field, it caused the near field to have a smaller diameter. Nothing was changed in this equation except for D, which is directly proportional to k. Therefore if D gets smaller so does k. A third near field with an annular aperture was modeled. This aperture made the near field a ring with a maximum diameter of 27 cm and a minimum diameter of 18 cm as shown in Fig. 3a. The far field here was also calculated. The result is in Fig. 3b. It was observed that the speckles produced were notably smaller than those of the far field created by the control. So the trend thus far is that the larger the near field the smaller the
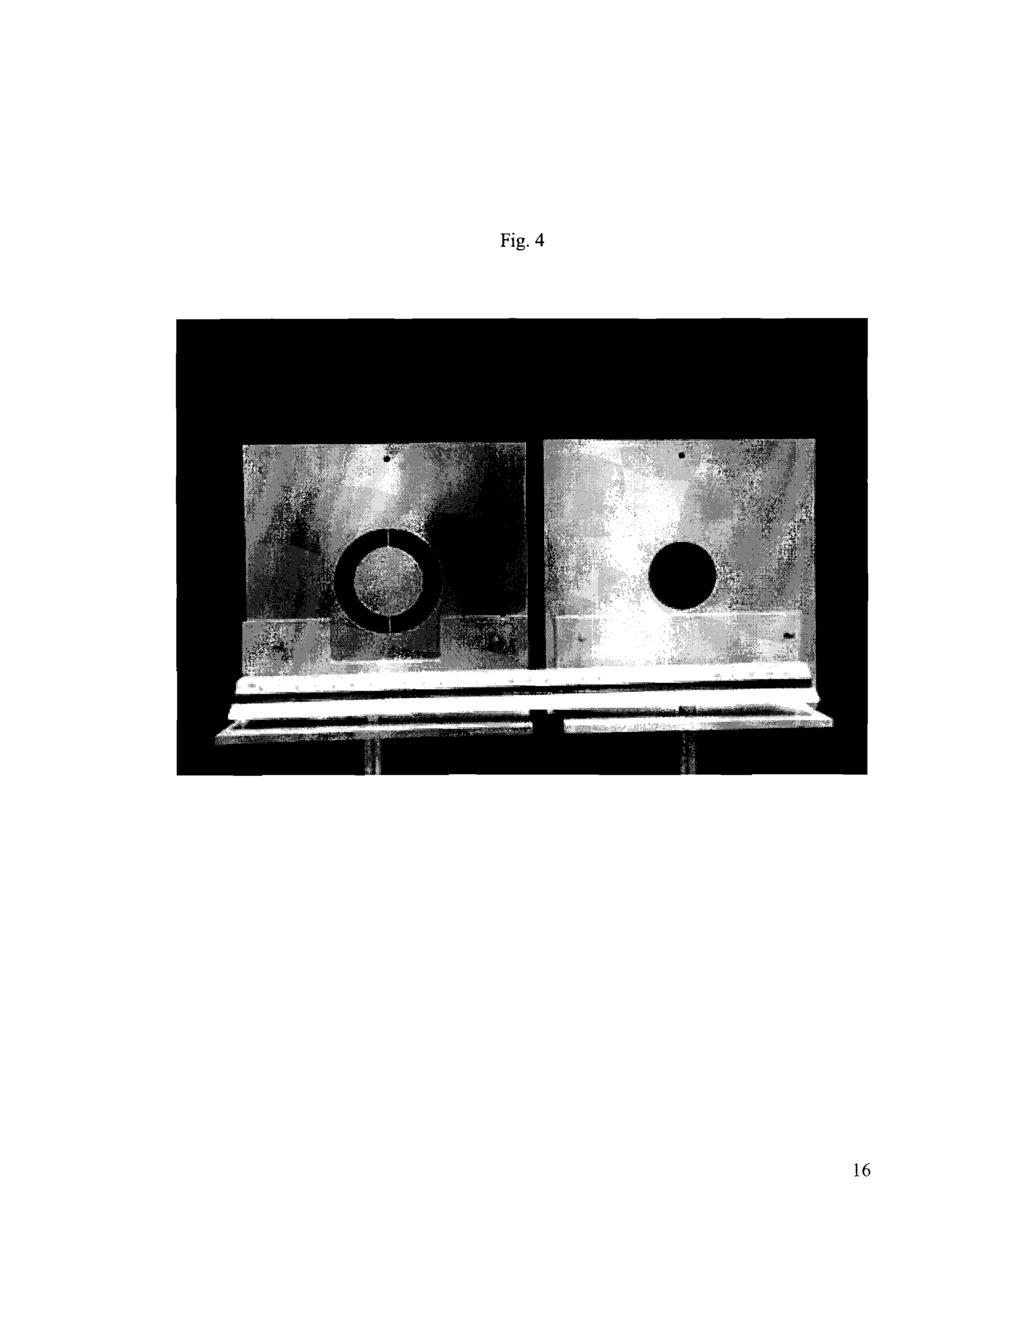
5 speckle in the far field. Next, the power spectrum of this far field was obtained. The power spectrum is shown in Fig. 3d. It was compared to that of the non apertured near field in Fig. Id and it was found that the graph of the PSD for the annulus had a different shape than that of the non-apertured near field, but the cutoff wavenumber was the same. Figures I, 2, and 3 show how the near field irradiance affects the power spectrum of the far field intensity distributions. Near Field Apertures Before any data could be taken, the apertures had to be fabricated and installed in the near field. The beam used in this experiment was down-collimated with the OWS to 63 mm which is equivalent to 30 cm in the OMEGA near field and allows for the use of smaller apertures and easy modification of the near field. The circular aperture was fabricated to allow only a small amount of the beam in the shape of a in. diameter circle to pass from the near field to the far field. The annular aperture was made in the same way but in lieu of a circle, a ring with an outer diameter of 2.48 in. and an inner diameter of in. blocked the central portion of the beam and allowed the outer portion of the beam to pass from the near field to the far field. The diameter of the circular aperture and the inner diameter of the annulus are equivalent to the two-thirds the diameter of the near field on OMEGA. These apertures are shown in Fig. 4. They were fabricated in the LLE machine shop. Installation of the near field apertures on the OWS required more hardware to be made. The translator that the apertures were to be mounted on couldn't hold the apertures as they were. Rods and brackets were fabricated to allow the apertures to be compatible
6 with the translator, and to place the apertures at the height of the beamline of the OWS. This height was approximately 10 in. The rods were able to move vertically which allowed for precision alignment in that direction. The brackets had to allow the desired amount and shape of the beam to pass, which was kept in mind as the brackets were designed. As shown in Fig. 4, the bracket for the circular aperture was made with two tapped holes to fasten the aperture to the bracket and one through hole to connect the bracket to the rod. The bracket for the annular aperture was made in a similar fashion; however, it had to have a cut out between the two tapped holes (see Fig. 4). This was because without the cut out, a part of the beam would have been obstructed. An obstruction such as the one that would have been produced by the bracket would have been unfavorable due to the fact that it would have altered the near field in a way that was unwanted. Experimental Results The investigation was conducted on the OWS. This is where 4% of the energy from an OMEGA beam is delivered for sampling. In this investigation, the beam propagates through a distributed phase plate (DPP) and an OMEGA lens. Next, the beam is down-collimated to a diameter of approximately 6 cm. The near field aperture positioned in the down-collimated beam of the OWS is shown in Fig. 5. The aperture was mounted on a translator and then aligned to the center of the beam on the OWS. Steps were taken to record the exact positions that would allow the apertures to be centered properly. The rods had mechanical locks that kept the height properly aligned with the optic axis of the OWS, and the translator was marked to record
7 the horizontal location that would keep the aperture aligned to the center of the beam. During an OMEGA laser shot the far field of one of the apertures was recorded on a charged coupled device (CCD) of the UVETP diagnostic. When the data acquisition was completed, the aperture that was in the near field was replaced with another one and the procedure was again performed. The Fourier transforms of the far fields were calculated using PV-WAVE and the PSD's of each of the near field apertured beams were compared to their respective models. Laser beam smoothing simulations of the 1 ns square laser pulse smoothed with 1 THz SSD and PS were performed by Dr. John Marozas for the three apertured near fields. Laser beam smoothing was not simulated in the models presented in figures 1-3. The laser beam smoothing effects of 1 THz SSD and PS are obvious after viewing the simulated power spectra shown in Fig. 6. Fig. 6a shows the power spectrum of the far field with an annular near field aperture and no laser beam smoothing, and Fig. 6b shows the power spectrum of the far field with an annular aperture and 1 THz SSD and PS. Simulations to account for 1 THz SSD and PS were run on the far fields that were recorded on OMEGA for the three apertures and the power spectra of the far field intensity distributions were calculated. The SSD smoothing technique involved temporal integration. The power spectra recorded for each aperture at the initial time looked similar to those presented in figures 1-3, except they had a lower om, because of the PS. The power spectra of the time integrated far fields simulated with 1 THz SSD and PS were found to be in good agreement with the experimental data for all the near field apertures that were studied. Fig. 7 contains the results for the annular near field aperture.
8 The power spectrum at the beginning of the laser pulse is also shown for reference. Notice how it (thin curve) has higher intensity modulations than the curves with the laser beam smoothing of 1 THz SSD and PS. The simulation (the thicker solid line) is plotted over the measured power spectrum (the dotted line) and they appear to be in good agreement. Fig. 8 has the results for the circular near field aperture. Once again the thin black line is the power spectrum without SSD, and the simulated data shows good agreement with the measured results. Fig. 9 shows the simulated and experimental power spectra for the standard configuration on OMEGA. Again, the thin curve is the model without SSD and the thicker line is the model with smoothing which shows good agreement with the measured power spectrum (the dotted line). The general shapes of the lines in Fig. 8 look similar to these, but the cut-off wave number for Fig. 8 is less. The cut-off wave number for Fig. 7 is the same as this one, but the shapes of the power spectra differ because of the different near field aperture shapes. Conclusion Far field intensity distributions of an OMEGA laser beam were measured with either an annular or a circular aperture placed in the near field. Models were created with PV-WAVE to understand the relationship between the near field irradiance and the power spectrum of the far field intensity distributions. Hardware was fabricated to install annular and circular apertures in the down-collimated beam of the OWS. Onenanosecond square laser pulses smoothed with 1 THz SSD and polarization smoothing were studied. Power spectra of far fields measured with the UVETP diagnostic were computed for each aperture and compared with measurements of the standard
9 configuration on OMEGA with no near field aperture. Laser beam smoothing simulations show good agreement with the experimental data. Results from this investigation can be extrapolated to SSD smoothing of beams that irradiate only a portion of the phase plate, such as the dynamic focal spot size using a static phase plate. Acknowledgments Thank you to Dr. Craxton for allowing me to participate in this program. Few high school students have the opportunity to work with the OMEGA laser system or the scientists who work on OMEGA. I am truly fortunate. Thank you also to Dr. Marozas for the simulations. Without the simulations, I would have nothing to compare the experimental data with. I give special thanks to my advisor Dr. Regan. He was patient with me when explaining concepts and helped me to complete this study. He taught me how scientists conduct experiments each step of the way. Thank you.
10 Figure Captions Figure 1. The models for the standard configuration used on OMEGA created using PV- Wave are shown here. The near field intensity is shown in (a), the modulus squared of the 2-D Fourier transform of the UV near field electric field is the far field shown in (b) and the Fourier transform of (b) is used to evaluate the power spectrum in (c), notice how it resembles the near field. Power spectral density is shown in (d) which is the azimuthal sum of the square of the Fourier amplitudes. Figure 2. These are models for the circular aperture. The image (a) is the near field intensity, (b) is the far field intensity, notice how the speckles are larger here than for Fig. 1 b. (c) is the Fourier transform of (b) and (d) is the power spectrum. Notice that the cutoff wave number for this power spectrum is less than the one for Fig. Id. This is because the diameter of the circular near field is smaller, so the cut-off wave number has to be smaller. Figure 3. These are models for the annular aperture. The image (a) is the near field intensity, which now looks like a ring because the aperture is blocking the central portion. (b) is the far field intensity, notice that speckles are smaller here than for Fig. 1 b. (c ) is the Fourier transform of the (b) and (d) is the power spectrum. The cut-off wave number is the same as in Fig. Id because the diameters are the same, but the shape is different due to the annular near field aperture.
11 Figure 4. These are the near field apertures. The diameter of the circle and the inner diameter of the annulus are equal to in. The apertures can be this small when the beam is 30 cm because the beam was down-collimated to 63 rnrn on the OWS. So the diameter of the apertures above is really just a little less than two-thirds of the near field diameter on OMEGA. Figure 5. This is the experimental setup. The table is the OWS in the OMEGA target bay. A sample beam with 4% of the laser light energy is passed through a DPP and an OMEGA lens. The beam is then down-collimated, passed through an aperture, and brought to a focus on a CCD camera to measure the far field. Figure 6. These are power spectra for the annulus. The graph of (a) is the one modeled with PV-Wave. It didn't take into account SSD so the oms was high. Graph (b) is the power spectrum of the far field of a 1 ns square laser pulse smoothed with 1 THz SSD and PS, so the intensity modulations were much lower. Figure 7. This graph shows the power spectra for the annulus. Notice how the thin curve has a higher intensity than the curves with the laser beam smoothing of 1 THz SSD and PS. The simulation (the thicker solid line) is plotted over the measured power spectrum (the dotted line) and they appear to be in good agreement. Figure 8. The power spectra for the circular aperture are shown here. Once again the
12 thin black line is the power spectrum without SSD. The dotted line is the measured spectrum with 1 THz SSD and PS. The thicker solid curve represents the simulated data with 1 THz SSD and PS and shows good agreement with the experimental result. Figure 9. These are the power spectra for the standard configuration on OMEGA. Again, the thin curve is the model without SSD and the thicker line is the model with smoothing which shows good agreement with the measured power spectra (the dotted line). The general curve of the lines in Fig. 8 look similar to these, but the cut-off wave number for Fig. 8 is less. The cut-off wave number for Fig. 7 is the same as this one, but the shapes differ.
13 Fig. 1
14 Fig. 2
15 Fig. 3 Wove Number ()'rn-')
16 Fig. 4
17
18 Fig W 10.W Wove Number (pm-') Wave Number (pm-')
19 Wove Number (prn-')
20 Wave Number (pn-')
21 Fig Wave Number (prn-')
Experiment 1: Fraunhofer Diffraction of Light by a Single Slit
 Experiment 1: Fraunhofer Diffraction of Light by a Single Slit Purpose 1. To understand the theory of Fraunhofer diffraction of light at a single slit and at a circular aperture; 2. To learn how to measure
MASSACHUSETTS INSTITUTE OF TECHNOLOGY Department of Electrical Engineering and Computer Science
 Student Name Date MASSACHUSETTS INSTITUTE OF TECHNOLOGY Department of Electrical Engineering and Computer Science 6.161 Modern Optics Project Laboratory Laboratory Exercise No. 3 Fall 2005 Diffraction
Determination and Correction of Optical Distortion in Cryogenic Target Characterization
 Determination and Correction of Optical Distortion in Cryogenic Target Characterization Francis White McQuaid Jesuit High School Rochester, NY Advisors: Dana Edgell, Mark Wittman Laboratory for Laser Energetics
FRAUNHOFER AND FRESNEL DIFFRACTION IN ONE DIMENSION
 FRAUNHOFER AND FRESNEL DIFFRACTION IN ONE DIMENSION Revised November 15, 2017 INTRODUCTION The simplest and most commonly described examples of diffraction and interference from two-dimensional apertures
Be aware that there is no universal notation for the various quantities.
 Fourier Optics v2.4 Ray tracing is limited in its ability to describe optics because it ignores the wave properties of light. Diffraction is needed to explain image spatial resolution and contrast and
1 Laboratory 7: Fourier Optics
 1051-455-20073 Physical Optics 1 Laboratory 7: Fourier Optics 1.1 Theory: References: Introduction to Optics Pedrottis Chapters 11 and 21 Optics E. Hecht Chapters 10 and 11 The Fourier transform is an
1.0-MJ CH-Foam Ignition Targets on the NIF Using 1-D MultiFM SSD with 0.5 THz of Bandwidth
 -MJ CH-Foam Ignition Targets on the NIF Using 1-D MultiFM SSD with.5 THz of Bandwidth -MJ CH-foam target; end of acceleration 4 1-D SSD, 1.8 Å 1-D MultiFM, 6 Å (1/2 THz) 2-D SSD, 11 Å Density (g/cm 3 )
THz Pump Beam for LCLS. Henrik Loos. LCLS Hard X-Ray Upgrade Workshop July 29-31, 2009
 Beam for LCLS Henrik Loos Workshop July 29-31, 29 1 1 Henrik Loos Overview Coherent Radiation Sources Timing THz Source Performance 2 2 Henrik Loos LCLS Layout 6 MeV 135 MeV 25 MeV 4.3 GeV 13.6 GeV σ z.83
Optical Coherence: Recreation of the Experiment of Thompson and Wolf
 Optical Coherence: Recreation of the Experiment of Thompson and Wolf David Collins Senior project Department of Physics, California Polytechnic State University San Luis Obispo June 2010 Abstract The purpose
Physics 431 Final Exam Examples (3:00-5:00 pm 12/16/2009) TIME ALLOTTED: 120 MINUTES Name: Signature:
 TIME ALLOTTED: 120 MINUTES Name: Signature:") Physics 431 Final Exam Examples (3:00-5:00 pm 12/16/2009) TIME ALLOTTED: 120 MINUTES Name: PID: Signature: CLOSED BOOK. TWO 8 1/2 X 11 SHEET OF NOTES (double sided is allowed), AND SCIENTIFIC POCKET CALCULATOR
Physics 431 Final Exam Examples (3:00-5:00 pm 12/16/2009) TIME ALLOTTED: 120 MINUTES Name: PID: Signature: CLOSED BOOK. TWO 8 1/2 X 11 SHEET OF NOTES (double sided is allowed), AND SCIENTIFIC POCKET CALCULATOR
Educational Spectrophotometer Accessory Kit and System OS-8537 and OS-8539
 GAIN 1 10 Instruction Manual with Experiment Guide and Teachers Notes 012-06575C *012-06575* Educational Spectrophotometer Accessory Kit and System OS-8537 and OS-8539 100 CI-6604A LIGHT SENSOR POLARIZER
Kit for building your own THz Time-Domain Spectrometer
 Kit for building your own THz Time-Domain Spectrometer 16/06/2016 1 Table of contents 0. Parts for the THz Kit... 3 1. Delay line... 4 2. Pulse generator and lock-in detector... 5 3. THz antennas... 6
Laser Beam Analysis Using Image Processing
 Journal of Computer Science 2 (): 09-3, 2006 ISSN 549-3636 Science Publications, 2006 Laser Beam Analysis Using Image Processing Yas A. Alsultanny Computer Science Department, Amman Arab University for
Section 2 ADVANCED TECHNOLOGY DEVELOPMENTS
 Section 2 ADVANCED TECHNOLOGY DEVELOPMENTS 2.A High-Power Laser Interferometry Central to the uniformity issue is the need to determine the factors that control the target-plane intensity distribution
Evaluation of Confocal Microscopy. for Measurement of the Roughness of Deuterium Ice. Ryan Menezes. Webster Schroeder High School.
 Evaluation of Confocal Microscopy for Measurement of the Roughness of Deuterium Ice Webster Schroeder High School Webster, NY Advisor: Dr. David Harding Senior Scientist Laboratory for Laser Energetics
Supplementary Figure 1. Effect of the spacer thickness on the resonance properties of the gold and silver metasurface layers.
 Supplementary Figure 1. Effect of the spacer thickness on the resonance properties of the gold and silver metasurface layers. Finite-difference time-domain calculations of the optical transmittance through
CHAPTER 9 POSITION SENSITIVE PHOTOMULTIPLIER TUBES
 CHAPTER 9 POSITION SENSITIVE PHOTOMULTIPLIER TUBES The current multiplication mechanism offered by dynodes makes photomultiplier tubes ideal for low-light-level measurement. As explained earlier, there
Section 1 ADVANCED TECHNOLOGY DEVELOPMENTS. High-Efficiency Holographic Gratings for High-Power Laser Systems. l.a
 Section 1 ADVANCED TECHNOLOGY DEVELOPMENTS l.a High-Efficiency Holographic Gratings for High-Power Laser Systems Large-aperture holographic transmission gratings that possess high diffraction efficiency
YOUNGS MODULUS BY UNIFORM & NON UNIFORM BENDING OF A BEAM
 YOUNGS MODULUS BY UNIFORM & NON UNIFORM BENDING OF A BEAM RECTANGULAR BEAM PLACED OVER TWO KNIFE EDGES & DISTANCE BETWEEN KNIFE EDGES IS KEPT CONSTANT AS l= 50cm UNIFORM WEIGHT HANGERS ARE SUSPENDED WITH
AgilOptics mirrors increase coupling efficiency into a 4 µm diameter fiber by 750%.
 Application Note AN004: Fiber Coupling Improvement Introduction AgilOptics mirrors increase coupling efficiency into a 4 µm diameter fiber by 750%. Industrial lasers used for cutting, welding, drilling,
Comparison of FRD (Focal Ratio Degradation) for Optical Fibres with Different Core Sizes By Neil Barrie
 for Optical Fibres with Different Core Sizes By Neil Barrie") Comparison of FRD (Focal Ratio Degradation) for Optical Fibres with Different Core Sizes By Neil Barrie Introduction The purpose of this experimental investigation was to determine whether there is a dependence
Comparison of FRD (Focal Ratio Degradation) for Optical Fibres with Different Core Sizes By Neil Barrie Introduction The purpose of this experimental investigation was to determine whether there is a dependence
Imaging Systems Laboratory II. Laboratory 8: The Michelson Interferometer / Diffraction April 30 & May 02, 2002
 1051-232 Imaging Systems Laboratory II Laboratory 8: The Michelson Interferometer / Diffraction April 30 & May 02, 2002 Abstract. In the last lab, you saw that coherent light from two different locations
Chapter Ray and Wave Optics
 109 Chapter Ray and Wave Optics 1. An astronomical telescope has a large aperture to [2002] reduce spherical aberration have high resolution increase span of observation have low dispersion. 2. If two
Tutorial Zemax 9: Physical optical modelling I
 Tutorial Zemax 9: Physical optical modelling I 2012-11-04 9 Physical optical modelling I 1 9.1 Gaussian Beams... 1 9.2 Physical Beam Propagation... 3 9.3 Polarization... 7 9.4 Polarization II... 11 9 Physical
EDUCATIONAL SPECTROPHOTOMETER ACCESSORY KIT AND EDUCATIONAL SPECTROPHOTOMETER SYSTEM
 GAIN 1 10 100 Instruction Manual and Experiment Guide for the PASCO scientific Model OS-8537 and OS-8539 012-06575A 3/98 EDUCATIONAL SPECTROPHOTOMETER ACCESSORY KIT AND EDUCATIONAL SPECTROPHOTOMETER SYSTEM
X-ray generation by femtosecond laser pulses and its application to soft X-ray imaging microscope
 X-ray generation by femtosecond laser pulses and its application to soft X-ray imaging microscope Kenichi Ikeda 1, Hideyuki Kotaki 1 ' 2 and Kazuhisa Nakajima 1 ' 2 ' 3 1 Graduate University for Advanced
Characteristics of point-focus Simultaneous Spatial and temporal Focusing (SSTF) as a two-photon excited fluorescence microscopy
 as a two-photon excited fluorescence microscopy") Characteristics of point-focus Simultaneous Spatial and temporal Focusing (SSTF) as a two-photon excited fluorescence microscopy Qiyuan Song (M2) and Aoi Nakamura (B4) Abstracts: We theoretically and experimentally
Characteristics of point-focus Simultaneous Spatial and temporal Focusing (SSTF) as a two-photon excited fluorescence microscopy Qiyuan Song (M2) and Aoi Nakamura (B4) Abstracts: We theoretically and experimentally
Lab Report 3: Speckle Interferometry LIN PEI-YING, BAIG JOVERIA
 Lab Report 3: Speckle Interferometry LIN PEI-YING, BAIG JOVERIA Abstract: Speckle interferometry (SI) has become a complete technique over the past couple of years and is widely used in many branches of
1.D Beam Smoothing by Spectral Dispersion (SSD)
") LLE REVIEW, Volume 36 1.D Beam Smoothing by Spectral Dispersion (SSD) Techniques for improving laser beam uniformity currently involve breaking up the beam into a large number of beamlets whose diffraction-limited
LLE REVIEW, Volume 36 1.D Beam Smoothing by Spectral Dispersion (SSD) Techniques for improving laser beam uniformity currently involve breaking up the beam into a large number of beamlets whose diffraction-limited
Instructions for the Experiment
 Instructions for the Experiment Excitonic States in Atomically Thin Semiconductors 1. Introduction Alongside with electrical measurements, optical measurements are an indispensable tool for the study of
Exp No.(8) Fourier optics Optical filtering
 Fourier optics Optical filtering") Exp No.(8) Fourier optics Optical filtering Fig. 1a: Experimental set-up for Fourier optics (4f set-up). Related topics: Fourier transforms, lenses, Fraunhofer diffraction, index of refraction, Huygens
Exp No.(8) Fourier optics Optical filtering Fig. 1a: Experimental set-up for Fourier optics (4f set-up). Related topics: Fourier transforms, lenses, Fraunhofer diffraction, index of refraction, Huygens
APPLICATION NOTE
 THE PHYSICS BEHIND TAG OPTICS TECHNOLOGY AND THE MECHANISM OF ACTION OF APPLICATION NOTE 12-001 USING SOUND TO SHAPE LIGHT Page 1 of 6 Tutorial on How the TAG Lens Works This brief tutorial explains the
Parallel Mode Confocal System for Wafer Bump Inspection
 Parallel Mode Confocal System for Wafer Bump Inspection ECEN5616 Class Project 1 Gao Wenliang wen-liang_gao@agilent.com 1. Introduction In this paper, A parallel-mode High-speed Line-scanning confocal
DCS laser for Thomson scattering diagnostic applications
 DCS laser for Thomson scattering diagnostic applications Authors Jason Zweiback 10/6/2015 jzweiback@logostech.net 1 Summary Motivation DCS laser Laser for Thomson scattering diagnostics 2 What is the Dynamic
Design of null lenses for testing of elliptical surfaces
 Design of null lenses for testing of elliptical surfaces Yeon Soo Kim, Byoung Yoon Kim, and Yun Woo Lee Null lenses are designed for testing the oblate elliptical surface that is the third mirror of the
EE119 Introduction to Optical Engineering Spring 2003 Final Exam. Name:
 EE119 Introduction to Optical Engineering Spring 2003 Final Exam Name: SID: CLOSED BOOK. THREE 8 1/2 X 11 SHEETS OF NOTES, AND SCIENTIFIC POCKET CALCULATOR PERMITTED. TIME ALLOTTED: 180 MINUTES Fundamental
Supplementary Materials
 Supplementary Materials In the supplementary materials of this paper we discuss some practical consideration for alignment of optical components to help unexperienced users to achieve a high performance
Supplementary Information for. Surface Waves. Angelo Angelini, Elsie Barakat, Peter Munzert, Luca Boarino, Natascia De Leo,
 Supplementary Information for Focusing and Extraction of Light mediated by Bloch Surface Waves Angelo Angelini, Elsie Barakat, Peter Munzert, Luca Boarino, Natascia De Leo, Emanuele Enrico, Fabrizio Giorgis,
Design of a digital holographic interferometer for the. ZaP Flow Z-Pinch
 Design of a digital holographic interferometer for the M. P. Ross, U. Shumlak, R. P. Golingo, B. A. Nelson, S. D. Knecht, M. C. Hughes, R. J. Oberto University of Washington, Seattle, USA Abstract The
The below identified patent application is available for licensing. Requests for information should be addressed to:
 DEPARTMENT OF THE NAVY OFFICE OF COUNSEL NAVAL UNDERSEA WARFARE CENTER DIVISION 1176 HOWELL STREET NEWPORT Rl 0841-1708 IN REPLY REFER TO Attorney Docket No. 300048 7 February 017 The below identified
GEOMETRICAL OPTICS Practical 1. Part I. BASIC ELEMENTS AND METHODS FOR CHARACTERIZATION OF OPTICAL SYSTEMS
 GEOMETRICAL OPTICS Practical 1. Part I. BASIC ELEMENTS AND METHODS FOR CHARACTERIZATION OF OPTICAL SYSTEMS Equipment and accessories: an optical bench with a scale, an incandescent lamp, matte, a set of
plasmonic nanoblock pair
 Nanostructured potential of optical trapping using a plasmonic nanoblock pair Yoshito Tanaka, Shogo Kaneda and Keiji Sasaki* Research Institute for Electronic Science, Hokkaido University, Sapporo 1-2,
Diffuser / Homogenizer - diffractive optics
 Diffuser / Homogenizer - diffractive optics Introduction Homogenizer (HM) product line can be useful in many applications requiring a well-defined beam shape with a randomly-diffused intensity profile.
The KrF alternative for fast ignition inertial fusion
 The KrF alternative for fast ignition inertial fusion IstvánB Földes 1, Sándor Szatmári 2 Students: A. Barna, R. Dajka, B. Gilicze, Zs. Kovács 1 Wigner Research Centre of the Hungarian Academy of Sciences,
Optimal Pinhole Loading via Beam Apodization. Ted Lambropoulos
 Optimal Pinhole Loading via Beam Apodization Ted Lambropoulos Optimal Pinhole Loading Via Beam Apodization Ted Lambropoulos Pittsford-Mendon High School Pittsford, NY 14534 Advisor: Dr. John Marozas Laboratory
Design Description Document
 UNIVERSITY OF ROCHESTER Design Description Document Flat Output Backlit Strobe Dare Bodington, Changchen Chen, Nick Cirucci Customer: Engineers: Advisor committee: Sydor Instruments Dare Bodington, Changchen
Ultra-stable flashlamp-pumped laser *
 SLAC-PUB-10290 September 2002 Ultra-stable flashlamp-pumped laser * A. Brachmann, J. Clendenin, T.Galetto, T. Maruyama, J.Sodja, J. Turner, M. Woods Stanford Linear Accelerator Center, 2575 Sand Hill Rd.,
Infrared Single Shot Diagnostics for the Longitudinal. Profile of the Electron Bunches at FLASH. Disputation
 Infrared Single Shot Diagnostics for the Longitudinal Profile of the Electron Bunches at FLASH Disputation Hossein Delsim-Hashemi Tuesday 22 July 2008 7/23/2008 2/ 35 Introduction m eb c 2 3 2 γ ω = +
Physics 23 Laboratory Spring 1987
 Physics 23 Laboratory Spring 1987 DIFFRACTION AND FOURIER OPTICS Introduction This laboratory is a study of diffraction and an introduction to the concepts of Fourier optics and spatial filtering. The
DetectionofMicrostrctureofRoughnessbyOpticalMethod
 Global Journal of Researches in Engineering Chemical Engineering Volume 1 Issue Version 1.0 Year 01 Type: Double Blind Peer Reviewed International Research Journal Publisher: Global Journals Inc. (USA)
BLUE SKY RESEARCH BLUE
 BLUE SKY RESEARCH Blue Sky Research is a company dedicated to providing the best possible balance of performance, value and quality. We have fielded over 1 million lasers since our inception in 1989, and
ADVANCED TECHNOLOGY DEVELOPMENTS
 Section 2 ADVANCED TECHNOLOGY DEVELOPMENTS 2.A Experimental Investigation of Bessel-Beam Characteristics Previous work by ~urninl has shown that the J,Bessel function, as an exact solution to the free-space
Investigations towards an optical transmission line for longitudinal phase space measurements at PITZ
 Investigations towards an optical transmission line for longitudinal phase space measurements at PITZ Sergei Amirian Moscow institute of physics and technology DESY, Zeuthen, September 2005 Email:serami85@yahoo.com
Criteria for Optical Systems: Optical Path Difference How do we determine the quality of a lens system? Several criteria used in optical design
 Criteria for Optical Systems: Optical Path Difference How do we determine the quality of a lens system? Several criteria used in optical design Computer Aided Design Several CAD tools use Ray Tracing (see
ASE Suppression in a Diode-Pumped Nd:YLF Regenerative Amplifier Using a Volume Bragg Grating
 ASE Suppression in a Diode-Pumped Nd:YLF Regenerative Amplifier Using a Volume Bragg Grating Spectral density (db) 0 10 20 30 40 Mirror VBG 1053.0 1053.3 1053.6 Wavelength (nm) Frontiers in Optics 2007/Laser
Lab 5: Brewster s Angle and Polarization. I. Brewster s angle
 Lab 5: Brewster s Angle and Polarization I. Brewster s angle CAUTION: The beam splitters are sensitive pieces of optical equipment; the oils on your fingertips if left there will degrade the coatings on
Collimation Tester Instructions
 Description Use shear-plate collimation testers to examine and adjust the collimation of laser light, or to measure the wavefront curvature and divergence/convergence magnitude of large-radius optical
REAL TIME SURFACE DEFORMATIONS MONITORING DURING LASER PROCESSING
 The 8 th International Conference of the Slovenian Society for Non-Destructive Testing»Application of Contemporary Non-Destructive Testing in Engineering«September 1-3, 2005, Portorož, Slovenia, pp. 335-339
Application Note (A11)
") Application Note (A11) Slit and Aperture Selection in Spectroradiometry REVISION: C August 2013 Gooch & Housego 4632 36 th Street, Orlando, FL 32811 Tel: 1 407 422 3171 Fax: 1 407 648 5412 Email: sales@goochandhousego.com
Application Note (A11) Slit and Aperture Selection in Spectroradiometry REVISION: C August 2013 Gooch & Housego 4632 36 th Street, Orlando, FL 32811 Tel: 1 407 422 3171 Fax: 1 407 648 5412 Email: sales@goochandhousego.com
z t h l g 2009 John Wiley & Sons, Inc. Published 2009 by John Wiley & Sons, Inc.
 x w z t h l g Figure 10.1 Photoconductive switch in microstrip transmission-line geometry: (a) top view; (b) side view. Adapted from [579]. Copyright 1983, IEEE. I g G t C g V g V i V r t x u V t Z 0 Z
OPTICS AND LASER PHYSICS LABORATORY #10 INSIDE A LASER CAVITY -- EXPLORING STABILITY, POLARIZATION, AND MODES with Mark Chawla and Chris Baird
 -- EXPLORING STABILITY, POLARIZATION, AND MODES with Mark Chawla and Chris Baird What is a laser cavity and how is it deemed to be stable? Most laser cavities are made up of a surprisingly small number
( ) Deriving the Lens Transmittance Function. Thin lens transmission is given by a phase with unit magnitude.
 Deriving the Lens Transmittance Function. Thin lens transmission is given by a phase with unit magnitude.") Deriving the Lens Transmittance Function Thin lens transmission is given by a phase with unit magnitude. t(x, y) = exp[ jk o ]exp[ jk(n 1) (x, y) ] Find the thickness function for left half of the lens
Deriving the Lens Transmittance Function Thin lens transmission is given by a phase with unit magnitude. t(x, y) = exp[ jk o ]exp[ jk(n 1) (x, y) ] Find the thickness function for left half of the lens
Diffraction. Interference with more than 2 beams. Diffraction gratings. Diffraction by an aperture. Diffraction of a laser beam
 Diffraction Interference with more than 2 beams 3, 4, 5 beams Large number of beams Diffraction gratings Equation Uses Diffraction by an aperture Huygen s principle again, Fresnel zones, Arago s spot Qualitative
How-to guide. Working with a pre-assembled THz system
 How-to guide 15/06/2016 1 Table of contents 0. Preparation / Basics...3 1. Input beam adjustment...4 2. Working with free space antennas...5 3. Working with fiber-coupled antennas...6 4. Contact details...8
Week IV: FIRST EXPERIMENTS WITH THE ADVANCED OPTICS SET
 Week IV: FIRST EXPERIMENTS WITH THE ADVANCED OPTICS SET The Advanced Optics set consists of (A) Incandescent Lamp (B) Laser (C) Optical Bench (with magnetic surface and metric scale) (D) Component Carriers
Use of Computer Generated Holograms for Testing Aspheric Optics
 Use of Computer Generated Holograms for Testing Aspheric Optics James H. Burge and James C. Wyant Optical Sciences Center, University of Arizona, Tucson, AZ 85721 http://www.optics.arizona.edu/jcwyant,
Characterization of Laser Eyewear Using Varying Pulse Conditions and Wavelengths
 Characterization of Laser Eyewear Using Varying Pulse Conditions and Wavelengths Michael D. Thomas, Andrew Griffin Spica Technologies Inc. 18 Clinton Dr. #3 Hollis, NH 03049 Bonnie Simmons Kentek Corporation
BEAMAGE-3.0 KEY FEATURES BEAM DIAGNOSTICS AVAILABLE MODELS MAIN FUNCTIONS SEE ALSO ACCESSORIES. CMOS Beam Profiling Cameras
 BEAM DIAGNOSTICS BEAM DIAGNOSTICS SPECIAL PRODUCTS OEM DETECTORS THZ DETECTORS PHOTO DETECTORS HIGH POWER DETECTORS POWER DETECTORS ENERGY DETECTORS MONITORS CMOS Beam Profiling Cameras AVAILABLE MODELS
A Laser-Based Thin-Film Growth Monitor
 TECHNOLOGY by Charles Taylor, Darryl Barlett, Eric Chason, and Jerry Floro A Laser-Based Thin-Film Growth Monitor The Multi-beam Optical Sensor (MOS) was developed jointly by k-space Associates (Ann Arbor,
Optical Isolator Tutorial (Page 1 of 2) νlh, where ν, L, and H are as defined below. ν: the Verdet Constant, a property of the
 νlh, where ν, L, and H are as defined below. ν: the Verdet Constant, a property of the") Aspheric Optical Isolator Tutorial (Page 1 of 2) Function An optical isolator is a passive magneto-optic device that only allows light to travel in one direction. Isolators are used to protect a source
Aspheric Optical Isolator Tutorial (Page 1 of 2) Function An optical isolator is a passive magneto-optic device that only allows light to travel in one direction. Isolators are used to protect a source
Measuring 8- to 250-ps Short Pulses Using a High-Speed Streak Camera on Kilojule, Petawatt-Class Laser Systems
 Measuring 8- to 25-ps Short Pulses Using a High-Speed Streak Camera on Kilojule, Petawatt-Class Laser Systems Measuring 8- to 25-ps Short Pulses Using a High-Speed Streak Camera on Kilojoule, Petawatt-Class
Chapter 4: Fourier Optics
 Chapter 4: Fourier Optics P4-1. Calculate the Fourier transform of the function rect(2x)rect(/3) The rectangular function rect(x) is given b 1 x 1/2 rect( x) when 0 x 1/2 P4-2. Assume that ( gx (, )) G
ERS KEY FEATURES BEAM DIAGNOSTICS MAIN FUNCTIONS AVAILABLE MODEL. CMOS Beam Profiling Camera. 1 USB 3.0 for the Fastest Transfer Rates
 POWER DETECTORS ENERGY DETECTORS MONITORS SPECIAL PRODUCTS OEM DETECTORS THZ DETECTORS PHOTO DETECTORS HIGH POWER DETECTORS CAMERA PROFIL- CMOS Beam Profiling Camera KEY FEATURES ERS 1 USB 3.0 for the
P202/219 Laboratory IUPUI Physics Department THIN LENSES
 THIN LENSES OBJECTIVE To verify the thin lens equation, m = h i /h o = d i /d o. d o d i f, and the magnification equations THEORY In the above equations, d o is the distance between the object and the
2 CYCLICAL SHEARING INTERFEROMETER
 2 CYCLICAL SHEARING INTERFEROMETER Collimation Testing and Measurement of The Radius of Curvature of the Wavefront MODEL OEK-100 PROJECT #1 18 2.1 Introduction In many applications, it is desired to measure
ΘΘIntegrating closedloop adaptive optics into a femtosecond laser chain
 Θ ΘΘIntegrating closedloop adaptive optics into a femtosecond laser chain www.imagine-optic.com The Max Planck Institute of Quantum Optics (MPQ) has developed an Optical Parametric Chirped Pulse Amplification
The Formation of an Aerial Image, part 3
 T h e L i t h o g r a p h y T u t o r (July 1993) The Formation of an Aerial Image, part 3 Chris A. Mack, FINLE Technologies, Austin, Texas In the last two issues, we described how a projection system
Effects of spherical aberrations on micro welding of glass using ultra short laser pulses
 Available online at www.sciencedirect.com Physics Procedia 39 (2012 ) 563 568 LANE 2012 Effects of spherical aberrations on micro welding of glass using ultra short laser pulses Kristian Cvecek a,b,, Isamu
Real-Time Scanning Goniometric Radiometer for Rapid Characterization of Laser Diodes and VCSELs
 Real-Time Scanning Goniometric Radiometer for Rapid Characterization of Laser Diodes and VCSELs Jeffrey L. Guttman, John M. Fleischer, and Allen M. Cary Photon, Inc. 6860 Santa Teresa Blvd., San Jose,
STUDIES OF INTERACTION OF PARTIALLY COHERENT LASER RADIATION WITH PLASMA
 STUDIES OF INTERACTION OF PARTIALLY COHERENT LASER RADIATION WITH PLASMA Alexander N. Starodub Deputy Director N.G.Basov Institute of Quantum Radiophysics of P.N.Lebedev Physical Institute of the RAS Leninsky
Long-Range Adaptive Passive Imaging Through Turbulence
 / APPROVED FOR PUBLIC RELEASE Long-Range Adaptive Passive Imaging Through Turbulence David Tofsted, with John Blowers, Joel Soto, Sean D Arcy, and Nathan Tofsted U.S. Army Research Laboratory RDRL-CIE-D
Phase-sensitive high-speed THz imaging
 Phase-sensitive high-speed THz imaging Toshiaki Hattori, Keisuke Ohta, Rakchanok Rungsawang and Keiji Tukamoto Institute of Applied Physics, University of Tsukuba, 1-1-1 Tennodai, Tsukuba, Ibaraki, 305-8573
IMAGE SENSOR SOLUTIONS. KAC-96-1/5" Lens Kit. KODAK KAC-96-1/5" Lens Kit. for use with the KODAK CMOS Image Sensors. November 2004 Revision 2
 KODAK for use with the KODAK CMOS Image Sensors November 2004 Revision 2 1.1 Introduction Choosing the right lens is a critical aspect of designing an imaging system. Typically the trade off between image
Lecture 2: Geometrical Optics. Geometrical Approximation. Lenses. Mirrors. Optical Systems. Images and Pupils. Aberrations.
 Lecture 2: Geometrical Optics Outline 1 Geometrical Approximation 2 Lenses 3 Mirrors 4 Optical Systems 5 Images and Pupils 6 Aberrations Christoph U. Keller, Leiden Observatory, keller@strw.leidenuniv.nl
Pre-Lab 10. Which plan or plans would work? Explain. Which plan is most efficient in regard to light power with the correct polarization? Explain.
 Pre-Lab 10 1. A laser beam is vertically, linearly polarized. For a particular application horizontal, linear polarization is needed. Two different students come up with different plans as to how to accomplish
Measurement and alignment of linear variable filters
 Measurement and alignment of linear variable filters Rob Sczupak, Markus Fredell, Tim Upton, Tom Rahmlow, Sheetal Chanda, Gregg Jarvis, Sarah Locknar, Florin Grosu, Terry Finnell and Robert Johnson Omega
R.B.V.R.R. WOMEN S COLLEGE (AUTONOMOUS) Narayanaguda, Hyderabad.
 Narayanaguda, Hyderabad.") R.B.V.R.R. WOMEN S COLLEGE (AUTONOMOUS) Narayanaguda, Hyderabad. DEPARTMENT OF PHYSICS QUESTION BANK FOR SEMESTER III PAPER III OPTICS UNIT I: 1. MATRIX METHODS IN PARAXIAL OPTICS 2. ABERATIONS UNIT II
R.B.V.R.R. WOMEN S COLLEGE (AUTONOMOUS) Narayanaguda, Hyderabad. DEPARTMENT OF PHYSICS QUESTION BANK FOR SEMESTER III PAPER III OPTICS UNIT I: 1. MATRIX METHODS IN PARAXIAL OPTICS 2. ABERATIONS UNIT II
Single-photon excitation of morphology dependent resonance
 Single-photon excitation of morphology dependent resonance 3.1 Introduction The examination of morphology dependent resonance (MDR) has been of considerable importance to many fields in optical science.
Broadband Phase Conversion Using SSD
 LLE REVIEW, Volume 37 6. R. S. Craxton, S. D. Jacobs, J. E. Rizzo and R. Boni, IEEE J. Quantum Electron. QE-17, 1782 (1981). 7. M. Born and E. Wolf, Principles of Optics, 6th ed. (Pergamon Press, New York,
A broadband achromatic metalens for focusing and imaging in the visible
 SUPPLEMENTARY INFORMATION Articles https://doi.org/10.1038/s41565-017-0034-6 In the format provided by the authors and unedited. A broadband achromatic metalens for focusing and imaging in the visible
MASSACHUSETTS INSTITUTE OF TECHNOLOGY Department of Electrical Engineering and Computer Science
 Student Name Date MASSACHUSETTS INSTITUTE OF TECHNOLOGY Department of Electrical Engineering and Computer Science 6.161 Modern Optics Project Laboratory Laboratory Exercise No. 6 Fall 2010 Solid-State
Laser Speckle Reducer LSR-3000 Series
 Datasheet: LSR-3000 Series Update: 06.08.2012 Copyright 2012 Optotune Laser Speckle Reducer LSR-3000 Series Speckle noise from a laser-based system is reduced by dynamically diffusing the laser beam. A
Department of Electrical Engineering and Computer Science
 MASSACHUSETTS INSTITUTE of TECHNOLOGY Department of Electrical Engineering and Computer Science 6.161/6637 Practice Quiz 2 Issued X:XXpm 4/XX/2004 Spring Term, 2004 Due X:XX+1:30pm 4/XX/2004 Please utilize
Photon Diagnostics. FLASH User Workshop 08.
 Photon Diagnostics FLASH User Workshop 08 Kai.Tiedtke@desy.de Outline What kind of diagnostic tools do user need to make efficient use of FLASH? intensity (New GMD) beam position intensity profile on the
CHAPTER 2 MICROSTRIP REFLECTARRAY ANTENNA AND PERFORMANCE EVALUATION
 43 CHAPTER 2 MICROSTRIP REFLECTARRAY ANTENNA AND PERFORMANCE EVALUATION 2.1 INTRODUCTION This work begins with design of reflectarrays with conventional patches as unit cells for operation at Ku Band in
ASD and Speckle Interferometry. Dave Rowe, CTO, PlaneWave Instruments
 ASD and Speckle Interferometry Dave Rowe, CTO, PlaneWave Instruments Part 1: Modeling the Astronomical Image Static Dynamic Stochastic Start with Object, add Diffraction and Telescope Aberrations add Atmospheric
Accuracy Estimation of Microwave Holography from Planar Near-Field Measurements
 Accuracy Estimation of Microwave Holography from Planar Near-Field Measurements Christopher A. Rose Microwave Instrumentation Technologies River Green Parkway, Suite Duluth, GA 9 Abstract Microwave holography
Nuclear Associates
 Nuclear Associates 07-649 CDRH Fluoroscopic Phantom Users Manual March 2005 Manual No. 07-649-1 Rev. 2 2004, 2005 Fluke Corporation, All rights reserved. Printed in U.S.A. All product names are trademarks
Laser Induced Damage Threshold of Optical Coatings
 White Paper Laser Induced Damage Threshold of Optical Coatings An IDEX Optics & Photonics White Paper Ronian Siew, PhD Craig Hanson Turan Erdogan, PhD INTRODUCTION Optical components are used in many applications
1.6 Beam Wander vs. Image Jitter
 8 Chapter 1 1.6 Beam Wander vs. Image Jitter It is common at this point to look at beam wander and image jitter and ask what differentiates them. Consider a cooperative optical communication system that