No.4 December 2005 BERYLLIUM-TREATMENT
|
|
|
- Myra Dina Green
- 5 years ago
- Views:
Transcription

1 o.4 December 25 BRYLLIUM-TRATMT
2
3 ABSTRACT ditor Dr. A. Peretti, FGG, FGA, urogeol GRS Gemresearch Swisslab AG, P.O.Box 428, 62 Lucerne, Switzerland Swiss ditorial Review Board Prof. Dr. B. Grobety, Institute of Mineralogy and Petrography, University of Fribourg, Fribourg, Switzerland (Mineralogy and Special Methods) PD. Dr. J. Mullis, Institute of Mineralogy and Petrography, University of Basel, Basel, Switzerland (Fluid inclusions) Prof. Dr. W. Oberholzer, Institute of Mineralogy and Petrology, Swiss Federal Institute of Technology (TH), Zurich, Switzerland. Former Curator of the Mineralogical Museum (TH ZH). Prof. Dr. K. Ramseyer, Institute for Geological Sciences, University of rne, Switzerland (CL) Prof. Dr. D. Günther, Institute of Chemistry, TH (SFIT), Zurich, Switzerland (LA-ICP-MS) Distributor GRS (Thailand) Co., LTD. 919/257 JTC 1 orth Building, Silom Rd., Silom, Bangrak, Bangkok 15, Thailand Journal and Website Copyrighted by GRS (Thailand) Co. LTD, Bangkok, Thailand and GRS Gemresearch Swisslab AG, Lucerne, Switzerland Forward GRS is honoured and proud to welcome you to our Fourth Issue of Contributions to Gemology. We have named this the Summary dition which compiles almost 5 years of research on the topic of ryllium-treatment of Corundum. This continues our tradition on working and striving to share knowledge, research and detailed information concerning the exciting field of modern gemology. In this Summary dition, we have compiled our previously published research which also includes the results from the co-operation with world-recognized Universities and internationally respected Research Institutes. GRS strives to continue it s in depth research utilizing sophisticated scientific methods. We have invested significant resources in research and development. This includes for example the invention of a new type of Laser Induced Plasma Spectrometer (LIPS) using a UV Laser. This technology is the answer to a non-destructive test to detect ryllium-treated corundum. Its calibration is based upon solid scientific research using sophisticated instruments which produced a masterpiece set of unique standards. The collection of this data and standards are summarized in this 4th Issue of Contribution to Gemology. We are convinced that this dition is a landmark in the world of research on ryllium-treated corundum. We, at GRS, believe that international acceptance can be achieved through information and knowledge that is shared with the world. Thank you and please enjoy our topic-related Summary dition of GRS s Contribution to Gemology. December 25, Lucerne, Switzerland Price: 25.- US $ Dr. Adolf Peretti FGG FGA urgeol
4 COTTS The ryllium-treatment of Fancy Sapphires with a ew Heat-Treatment Technique Part A: Second dition of Contribution to Gemology o.1, with corrections (originally published in May 22, see Lit. 1) Introduction Materials UV Fluorescence and UV Treatment Color Fading Test (Unstable Color-Centers) UV-Treatment Protocol (Table 1) Scanning lectron Microscope Analysis (SM) SM Photo-Album 9-1 SM-DS Analysis 1 Stable Mg(2+) - trapped Hole Color Center + Fe 2+ - Ti 4+ Cr 3+ Fe 3+ Cr 3+ Fe 3+ Cr 3+ + Fluorescence Chemical Analysis of atural Unheated Colored Sapphires (D-XRF) Origin of Color of atural Unheated Colored Sapphires Data Chemical Analysis D-XRF (Table 5) Origin of Color Analysis of atural Colored Sapphires and ryllium-treated Fancy Sapphires (UV-VIS-IR) LA-ICP-MS Methods Sampling and Probing Details for LA-ICP-MS (Table 6) LA-ICP-MS Results of ryllium-treated atural "Padparadscha" and ryllium-treated atural Colorless Sapphires LA-ICP-MS Profile of ryllium-treated atural "Padparadscha" Sapphires LA-ICP-MS Analysis of ryllium-treated atural Blue Sapphires LA-ICP-MS Profile ryllium-treated atural Yellow Sapphires LA-ICP-MS Profile atural Purple Sapphires, Unheated () Comparison Surface Diffusion-Treated and ryllium-treated Sapphires Cathodoluminescence of ryllium-treated atural "Padparadscha" Sapphires Conclusion Part A Blue Halo Inclusions in ryllium-treated Fancy Sapphires
5 COTTS The ryllium-treatment of Fancy Sapphires with a ew Heat-Treatment Technique Part B: Second dition of Contribution to Gemology o.2, Page (originally published in August 23, see Lit. 2) ryllium-treatment Part B 43 Inclusions in ryllium-treated Corundum 44 ryllium-treatment of Synthetic Pink Sapphires ryllium-treatment of Synthetic Rubies 48-5 Triangular Identification Charts for ryllium-treated atural and Synthetic Corundum 51 Conclusion Part B Origin of Color in ryllium-treated atural and Synthetic Corundum 52 Part C: Inclusions xplanation Inclusion Images Inclusions in Unheated and Heat-Treated Colored Sapphires Inclusions in ryllium-treated Pink and Yellow Sapphires Inclusions in ryllium-treated Blue Sapphires 59-6 Tables of LA-ICP-MS Analyses of ryllium-treated Synthetic Corundum Tables of LA-ICP-MS Analyses of ryllium-treated and Conventional Heated atural Corundum Literature References 64-65
6 1 The ryllium-treatment of atural Fancy Sapphires with a ew Heat-Treatment Technique: Introduction The ryllium-treatment of atural Fancy Sapphires with a ew Heat-Treatment Technique Part A By Dr. A. Peretti, FGG, FGA, urgeol GRS Gemresearch Swisslab AG, Lucerne, Switzerland and Prof. Dr. D. Günther Institute of Chemistry, Swiss Federal Institute of Technology (SFIT), Zurich, Switzerland (Reprinted with corrections from Contributions to Gemology, o.1, 22) ITRODUCTIO Sapphires and rubies of different colors are routinely heat-treated to produce products of better clarity and color. As long as the treatment does not involve diffusion of color influencing trace elements - such as Ti, Fe and Cr - into the gemstones surface or irradiation, the trade generally accepts the enhanced gem materials as being highly valuable, depending on size, rarity and beauty. In mid 21, sapphires and rubies treated with a new method appeared on the market with dominantly - colors, which are commonly known in the trade as the "Padparadscha" colors. atural Padparadschas are among the world's most requested, and rarest, gemstones, and therefore highly-priced. Depending on the exact nature of this new enhancement process, and hence the wording used to disclose and supply these sapphires to the market, the price of these materials may vary considerably. arly Internet published reports initiated a worldwide controversy on the nature of the treatment, ranging from pure heat treatment to a full blown diffusion treatment. The uncertainty about the exact nature of the treatment method, and therefore the lack of investor confidence, caused the worldwide market for the new sapphire materials to collapse (February - March 22). Of particular interest to the trade is the question: "Are these new materials diffusion-treated?" This is based on earlier reports of the presence of ryllium in these sapphires, and the occasional presence of color zoning confined to the sapphires' facets (See Internet References found in Lit. 1). A key factor to understand the color giving mechanism is the use of special analytical methods, such as UV-VIS-IR (origin of color analyses), D-XRF (e.g. Iron (Fe), Chromium (Cr) and Titanium (Ti) trace element analyses), SM-DS (chemical analyses of contaminated substances at the gemstones' surface), visual and spectroscopic cathodoluminescence investigations (analyses of internal growth structures), color-stability measurements (long-term color-stability to UV and visible light), and, most importantly, Laser Ablation Inductively Coupled Plasma Mass Spectrometry (LA-ICP-MS). The LA-ICP-MS method - used to characterize the content and variation of all trace elements, including light elements such as Lithium (Li), Boron (B) and ryllium () on a micro scale - turned out to be the key factor in understanding the new heat treatment technique. This report contributes to the understanding of the new heat treatment with ryllium and to differentiate from conventional heat-enhancement () and conventional surface diffusion treatment (T). MATRIALS The majority of the tested material included natural fancy sapphires from Tanzania and (both enhanced and unenhanced), as well as other comparison materials (described below). The entire collection of materials (32 reference samples) is the property of one of the authors' companies (GRS Gemresearch Swisslab AG (Switzerland) and GRS (Thailand) Co. LTD, and is stored in the companies' reference collections. The sapphire material can be divided into the following groups: a.) Unheated (). b.) Conventional heat-treated (). c.) Conventional diffusion-treated (T). d.) Synthetic (Syn) and Irradiated (IR). e.) ryllium-treatment, short noted as.(*) f.) ryllium-treatment, Chantaburi Dec 21, Table A6, Part A. g.) With conventional heat treatment and the additional new heat treatment method, Chantaburi Dec 21 to Jan 22, Table A6, Part A. Tested before and after ryllium-treatment. h.) Unheated and conventional heat-treated gemstones, with additional ryllium-treatment, Bangkok, Feb 22, Table A6, Part B. Samples tested before and after treatment with ryllium. Details a.) GRS acquired 12 rough (pre-polished) fancy sapphires (unheated) of different colors (including "Padparadscha" sapphires) between 1999 and 22 from K.V. Gems Co., Ltd. (Bangkok), AJS GMS LTD. (Bangkok), GMR (Gem Mining Resources, ), and from Bangkok and Chantaburi open markets in Thailand. The material from revealed inclusions typical of the Illakaka mining area (clusters of small zircons). This study also includes untreated Songea sapphires from the GRS collection (acquired in 1996) b.) For the purpose of comparison with heat-treated natural sapphires from previous years, 3 further heat-treated yellow sapphire samples - as well as "Padparadscha" colors - were investigated. c.) For further comparison with diffusion-treated
7 2 Sampling Lemon Yellow Vivid Yellow Golden Yellow Orange Orangy-Pink Padparadscha Vivid Red Pigeon s Blood Pink Vivid Purple Violet Cornflower Blue Royal Blue Fig. A1 GRS Color ames for Selected atural Colored Sapphires and Rubies samples, eight diffusion-treated blue sapphires were available, including three samples acquired in 1996 (in Tucson, USA) and five samples acquired in 22 in Bangkok. These samples from Bangkok were sold as surface diffusion-treated (the element used for diffusion was declared as titanium, and the diffused basic corundum was declared as originally being a natural white sapphire). d.) More than 5 synthetic corundum samples and 15 irradiated synthetic samples were available for comparison. e.) Commercially representative products of this new treatment included faceted natural orangy- and and yellow sapphires (origin ). They were obtained from three different companies: In ovember 21 from K.V. Gems Co. LTD (Thailand), and in December 21 from 2 other companies in Bangkok. This study also includes samples of African origin (Tanzania), samples obtained in February 22, and 12 faceted -red to vivid orangy-red sapphires, produced by the new treatment in Chantaburi in December 21. f.) Further samples of this new treatment were selected from a large lot of sapphires - investigated in Chantaburi on 14th December 21 - which were heated with the new method, but not repolished. This lot arrived directly at the heat treatment laboratory in Chantaburi after treatment (Fig. A2 and A3). The samples for this report were color sorted, then master sets of different colors were made, including white, blue, yellow, and - ("Padparadscha") colors produced by the new method. Outside of the dominantly produced typical colors in this lot, 12 white and four natural blue sapphires were also sorted. Some of this lot's sapphires were clustered together (due to the melting of non-sapphire materials in the treatment process (Fig. A3)). Three of these clusters were selected for this study from the same lots. Three "Padparadscha" samples from these lots have been re-cut, with 1%, 2% and 5% weight loss respectively. g.) Typical samples suitable for the new heat treatment include faceted natural purplish- sapphires (heart and triangular shape) between.3 to 1ct, which were studied in ovember 21 and subsequently heat-treated with the new method in commercial runs together with other dealers' samples in Chantaburi (the heat treating laboratory was not aware of GRS making test runs). 15 pieces from this lot were treated in Chantaburi between ovember and December 21. The samples were studied before and after treatment. h.) 15 natural sapphire pieces, as well as unheated violet, purple and "padparadscha" sapphires, were treated at a factory in Bangkok in February 22 through a Thai Gems Jewelry and Trader Association (TGJTA) initiative (Further details see Table A6). The heat treating laboratory was aware of GRS making tests. The material was studied before and after treatment. Treatment details were not disclosed and the treatment laboratory not shown. (*) is a trademark of GRS Gemresearch Swisslab AG (Switzerland)
(see Table A1).")

8 3 Gemological Testing Gemological Testing During routine gemological testing, samples were checked for fluorescence and subjected to a color-stability test procedure. The samples included sapphires of different colors, origin and treatment (,, T, and synthetic samples)(see Table A1). Of particular interest are the samples for which the trace element concentration, ryllium in particular, has been analyzed (See Table A6).The samples were first graded for color and saturation according to the GRS Master, and then half-covered with Aluminium Foil. They were than exposed to UV light (ickhorst lamp, Type Mulitspec UV-AC) for two days at a distance of 1cm. Two wavelength were used: 366 and 254nm. After both the covered and uncovered parts were subjected to UV radiation, the samples were subjected to a 1 Watt halogen lamp for two days and, in a repeating experiment, warmed for 3 seconds in a gas flame. Results UV Fluorescence xposed to UV light, the -samples showed a particular reaction (Fig. A6) The -samples from exhibited intense yellowish- fluorescence in long wavelength UV (Fig. A6a.) and medium yellowish- fluorescence in short wavelength UV. This reaction was not found in the other tested groups (,, T and synthetic). This particular reaction to UV light was observed in all samples of the -groups, and absent in the reference samples (,). Another group of samples thoroughly examined for ryllium (Sample 1999, Table A6), revealed a very particular reaction to UV light - an intense outer rim with whitish-blue (milky) fluorescence was present. This phenomenon was not observed in the unheated half piece from the same sample. Fig. A2 Dr. A. Peretti selects samples (Chantaburi, 14th December, 21) heated-treated with ryllium, sorts the different colors of produced sapphires and non-sapphire crystals (as shown in Fig. A8) and then carries out gemological tests (using a portable microscope, portable fiber-optic light source of 1 watt power, Geiger counter, Dichroscope, Polariscope, Refractometer and UV-lamp). Later, in Bangkok, he continues the tests using a vertical trinocular microscope (65x magnification) and a horizontal microscope from ickhorst with an immersion unit (GMMASTR SUPRSCOP).

.")


9 Color Fading xperiment and Unstable Color Centers Fig. A3 Different colors produced by the new treatment (including, yellow,, and blue) are sorted for this report. Sapphires of different colors are accidentally clustered together by the melting of minerals other than sapphire during heat treatment with ryllium. Only a small portion of the sapphires showed this accidental cluster. ote: Different colors are produced in the same heating runs. Sample o.grs Sample o.grs white Fig. A4 atural blue and white ryllium-treated sapphires exposed to UV radiation. One half of the piece was kept for reference (left side). Both the blue and white sample developed yellow and rims respectively. These rims were found to be the zone of -enrichment by LA-ICP-MS (See Fig. A34 and Fig. A45). The color is found to be unstable. The rims are fading after mild exposure to heat. Absorbance -> Unstable Color Centers Color shift due to unstable yellow color included by UV-Treatment Fig. A5 Polarized UV-VIS-IR absorption spectra of ryllium-treated yellow sapphire before and after treatment with UV light. Yellow curve: Spectrum after exposure to UV. Black curve: After fading of yellow sapphire to white color. ote: Shift of the absorption spectrum towards higher absorptions in the blue causes the yellow color in the sapphires due to the presence of color centers Wavelength (nm) -> Fig. A6a Fluorescence experiment with ickhorst UV Lab lamp (long wave 366nm) on faceted sapphires, which had previously been subjected to ryllium-treatment. Left: Orangy- sapphires (origin: ) showing intense y fluorescence with more yellowish fluorescence at rim. At right: two samples (origin: Songea) with medium -red fluorescence (Faceted gemstones between 2 and 5 cts in size). ote: Yellowish fluorescence is confined to the rim of a ryllium-treated orangy- sapphire (Fig. A6b) 4
10 5 Table A1: UV- Treatment Protocol. Groups: = Unheated, = Conventional Heat Treatment, = ryllium-treated T = Conventional Surface Diffusion-Treated, Synthetic UV xperiments for color change Color Change nhancement Origin GRS o. Weight before UV Treatment after UV Treatment /O Group O pastel *.262 O *.324 orangy- ish pastel pastel O ish pastel pastel O pastel pastel pastel O pastel pastel pastel O sl. ish- pastel pastel pastel O pastel brownish-orangy- brownish-orangy- O pastel 1272 purple purple O pastel purple lilac () brownish-orangy- ish- GRS pastel pastel O pastel O intense golden vivid lime yellow lime yellow O Sri Lanka lime yellow lime yellow O Sri Lanka golden yellow golden yellow O Sri Lanka golden yellow golden yellow O Sri Lanka O Sri Lanka GRS modified modified O Sri Lanka sl.orangy- Sri Lanka O O O O O O O O GRS colorless colorless O Synthetic GRS O Synthetic GRS pastel pastel O Synthetic GRS 14b pastel pastel O Synthetic GRS Sl.orangy- Synthetic GRS yellow yellow O Synthetic GRS 19a.297 blue blue O T (surface diffusion) GRS 19b.164 blue blue O T (surface diffusion)
11 6 Table A1 (Continued) GRS o Weight UV xperiments for color change before UV Treatment after UV Treatment colorless pastel yellow colorless pastel yellow colorless pastel yellow colorless pastel yellow colorless pastel yellow colorless pastel yellow l.pastel brownish-yellow light orangy- light orangy- light orangy- lime yellow vivid yellow lime yellow vivid yellow yellow golden sl.ish- sl.ish- ish- ish- ish- pastel orangy- orangy- orangy- orangy- v.l.pastel purple brownish-yellow pastel purple pastel violet with pastel brown violet violet with edge blue blue with edge blue blue with edge Color Change /O O O O nhancement Group, recut, recut Origin GRS 15 GRS 15b GRS 16 GRS 16b GRS 21 GRS pastel pastel colorless colorless medium medium with rim pastel orangy- with pastel orangy- with Songea, Tanzania Songea, Tanzania Songea, Tanzania Songea, Tanzania Songea, Tanzania Songea, Tanzania b GRS GRS white white colorless colorless v.light yellow v.light yellow v.light yellow v.light yellow v.light yellow light yellow yellow light lime yellow purple light yellow with yellow rim light yellow with yellow rim yellow yellow light yellow V.light yellow V.light yellow V.light yellow yellow light yellow yellow yellow lilac O O O O O O O O O O Sri Lanka Sri Lanka Burma Burma Sri Lanka Burma Burma Sri Lanka Sri Lanka Burma Sri Lanka Sri Lanka Burma Burma Burma
12 7 Ultraviolet (UV) - Treatment xperiments Results Long Term UV xposure Of particular interest to this study, however, is the reaction of the stones after long-term exposure to intense UV light. The ryllium-treated samples from reacted differently to all other samples, excluding unheated ones (See Table A1). Significant changes in the color were seen in samples heated with ryllium, and a shift towards more yellow or was observed (as shown in the Table A1). A color change from near colorless to yellow was also observed in untreated sapphires of Sri Lankan origin (Table A1). This unheated group of sapphires is known to contain specific color centers (Lit. 16). In ryllium-treated gemstones with an body color before the UV experiments, the color shift is more difficult to see. The color change towards more yellow or could be reversed when exposed to a gas flame for a short time, and within two days when exposed to a 1 watt halogen lamp at slightly elevated temperatures. A set of white sapphires, which did not change color during the rylllium-treatment process developed a thin layer of yellow color during the long term UV exposure (shown in Fig. A4). This observation was also made on ryllium-treated blue sapphires (Fig. A4) which have been exposed to UV. The blue samples developed edges, while the body color of the sapphires remained unchanged. The color induced by UV treatment could be reversed by short application of heat to all the samples, beside one exception. Scanning lectron Microscope Analysis (SM) Sampling of colored sapphires heated by the new treatment in Chantaburi included the study of faceted ryllium-treated gemstones (Materials group f.). These gemstones were already faceted in briolette and princess-cut style sapphires prior to heat treatment. By sorting the lots after heat treatment, a set of non-sapphire materials were detected (Fig. A8). The colored samples showed a thin film of interference color at the surface, and were indented by craters due to contact with other minerals in the same heating process. These craters were also found indented on the surface of the sapphires (Fig. A13). The materials were identified as consistent with glass-aggregates, zircon and chrysoberyl (Table A2). February 22 at the University of Basel's Central Laboratory for Microscopy (ZMB) by Chief Technician M. Duggelin and D. Mathys. Five samples were selected (including minerals with an interference film (zircon and chrysoberyl), and sapphire clusters. Results SM Analyses of zircon and chrysoberyl did not reveal any further information on chemicals present, other than expected from their chemical compositions and attention was placed on the sapphire clusters and the white matrix around the sapphire materials. Cracks and intended craters were investigated, and a series of newly formed crystallizes were detected in these cracks (Fig. A15-A17), mostly composed of Zr-oxide, plus additional element Silicon (Si), Aluminium (Al), Magnesium (Mg), Calcium (Ca) and Fluorine (F). ryllium can not be measured with SM, and no indications for Chromium (Cr), Titanium (Ti), or Iron (Fe), were found on the surfaces of the enhanced gemstones. Most of the detected elements can be explained as originating from decomposed minerals present in the runs (Silicon (Si) and Zirconium (Zr) from zircon, Aluminium (Al) from corundum, or chrysoberyl), yet the source of Fluorine (F) is unclear. Melting on the surface of these minerals is very visible, as different craters are present on the surface of the former faceted materials (Fig. A8) and also by the craters produced at the surface of the sapphires (Fig. A13, A14). They were formed when they came into contact with other chemical compositions present in other minerals - of the same shape, cutting style and size - in the heating run. Chrysoberyl is a potential source for ryllium. Its role in the heat treatment process has been confimed (See later publications Lit ). Weight Color pastel yellowish-green pastel yellowish-green almost colorless Density DR yes yes yes RI OTL ID chrysoberyl chrysoberyl zicron Furthermore, clusters of sapphires, sintered together by a whitish matrix, were detected. Only an extremely small portion of the gemstones showed this phenomena and it was clear that these were accidental circumstances almost colorless colorless colorless colorless colorless yes intr. intr. intr. intr. OTL not readable not readable not readable not readable zicron glass glass glass glass In order to analyze the surfaces of these materials, and to search for potential trace elements used in the process, the materials were studied with a Scanning lectron Microscope (Philips XL 3 SM) in Table A2: Selected representative ID Data on the identified minerals accompanying the sapphires heat-treated in the presence of ryllium. Samples cut in half and polished.
.")
, for microchemical analysis. Fig. A8 A set of non-sapphire materials sorted after heat treatment experiments.")
. Third row: Chrysoberyl minerals.")
13 8 Analysis of Other Minerals than Sapphires Fig. A7 An example of a SM-DS recently used for resarch is shown from the University of Fribourg, arth Science Department, Switzerland. On the left: Prof. B. Grobety operating the SM (FI XL 3 Sirion FG). To the right details of the SM: An opened sample chambre, surrounded by a variety of detectors, such as Secondary lectron Detector (S), Backscattered lectron Detector (BS) and an X-Ray Detector (DS) with a Polymer Window (S-UTW), for microchemical analysis. Fig. A8 A set of non-sapphire materials sorted after heat treatment experiments. In December 21, heat treatment was carried out with the new method in Chantaburi (Thailand) on a lot of briolette sapphires and then inspected by GRS at the source. First row: Melted non-sapphire materials transformed to whitish glassaggregates. Second row: Zircon minerals (radioactive). Third row: Chrysoberyl minerals. (ote: Craters on the surface of the zircon and chrysoberyl crystals due to contact with other minerals in the heat treatment process and partial melting of the surface, See arrows). Overgrowing layers of thin films with interference colors were found on zircon and Chrysoberyl samples, indicating some chemical reactions on their surfaces. Samples collection GRS.

. Fig.")


14 Analysis of on-sapphire Materials by Scanning lectron Microscopy (SM) Fig. A9 Dr. A. Peretti mounts the chrysoberyl samples for SM-DS analysis in February 22 at the University of Basel (Switzerland). Fig. A1 SM-S image of a faceted chrysoberyl crystal after heat treatment. The crystal has a thin film overgrowth with interference color. Sample not carbon-coated for analysis. Acceleration voltage 2kV Fig. A11 Macrophotograph of glass-aggregate formed by the melting of non-sapphire materials during heat-treatment with ryllium. Fig. A12 SM-S image of different colored sapphires clustered together in accidental circumstances during the ryllium treatment experiments. Acceleration voltage 15kV. Fig. A13 SM-S image of sapphire showing craters due to surface melting of the sapphire material (See arrow). Acceleration voltage 3kV. 9 Fig. A14 SM-BS image of enlarged area of Fig. A13. The crack is shown as well as a melting crater in the sapphire (arrow) in course of the ryllium-treament. Acceleration voltage 3kV.

 as shown by SM-DS spectrum on right (Acceleration Voltage 2kV). ote also: Presence of fuorine (F).")
-oxide and SM-DS spectrum of the same")
, titanium (Ti) or chromium (Cr) were detected as shown by SM-DS spectrum on right")
15 1 Surface Analysis (SM-S, SM-BS and SM-DS) of ryllium-treated Sapphires Fig. A15 SM-BS image of the matrix between sapphires. ote: Presence of more heavy elements is seen as a white color. These heavy elements are mostly composed of Zirconium (Zr)-oxide of unknown crystal structure (Aluminium (Al) from corundum contamination) as shown by SM-DS spectrum on right (Acceleration Voltage 2kV). ote also: Presence of fuorine (F). Samples carbon (C) coated. Fig. A16 SM-S enlarged portion of the crack shows the growth of dendrites of Zirconium (Zr)-oxide and SM-DS spectrum of the same area (Aluminium (Al) from corundum). o high concentrations of iron (Fe), titanium (Ti) or chromium (Cr) were detected as shown by SM-DS spectrum on right (Acceleration Voltage 3kV). Fig. A17 SM-S image of crystallites composed of Zirconium (Zr)-oxide. This crystallite must have been formed over the course of the ryllium-heating experiments. SM-DS spectrum on right (Acceleration voltage 15kV). Sample carbon (C) coated.
 and Bulk Chemical An")
16 Origin of Color: Absorption Spectroscopy (UV-VIS-IR) and Bulk Chemical Analysis (D-XRF) nergy Dispersive X-Ray Fluorescence Analysis (D-XRF) The D-XRF analyses were carried out by Dr. A. Burkhardt at the IFZAA Laboratory (Institute for on-destructive Analysis + Archaeometry), in Basel, Switzerland, using an D-XRF Spectrometer Methods For the excitation an X-ray tube with a rhodium target and a 125 micron ryllium-window was used. The X-ray generator was operated in a series of KV increments between 4 KV to 5 KV with current adjustable in.2 ma increments and a maximum power of 5 W, using cellulose, aluminium, palladium and copper filters. The background was optimised in combination with the acceleration voltage. A thermoelectric cooled Si(Li)-detector with a comfortable Peltier system with a detector window of 12 microns thickness was used. For the light elements (a to Ti), the system was operated in vacuum which was required to improve the sensitivity. A complex measurement procedure was optimised for the measurement conditions for all elements of the periodic table from atomic number 11 (a) to 92 (U). A collimator with a diameter of 2 mm was used to condense and focus the X-Ray beam. The average weigh of the samples was.5 to approx. 5 ct. For each corundum sample four different energy spectra were collected with a total of 6 seconds lifetime. To avoid strong diffraction peaks, the sample were rotated. The penetration depth of the x-rays in the sample for a particular analysed element and the intensity of the excited signals (M-L-K lines) are correlated with the acceleration voltage and the atomic number. The penetration depth is increasing from microns for the K-lines of the light elements (a, Mg, Al) to millimetres (Ga-K, Sr-K, Zr-K) as well as for the L-lines of the heavy elements such as Pt-L, Au-L, Pb-L, Bi-L. In a corundum matrix the penetration depths is for example: 3 microns for a, 1 microns for Cl, 75 microns for Cr, 12 microns for Fe; from Ga to Sr the penetration depth is increasing from 36 microns to 1.3 mm and for the L-lines of Pt to Bi it is increasing from 39 microns to 1.5 mm. The penetration depth of the strong K-lines of silver (Ag) is 4.7 mm in an Al 2 O 3 matrix. After the primary energy spectrum was saved on a Pentium-PC the raw intensities for four energy spectra for each sample were calculated and combined in an intensity file. The Fundamental Parameter Programme was used to quantify the raw data and the results were normalized to 1% (weight-percent). Standards were used to setup a standard-table. The quality of the quantitative D-XRF data (accuracy, precision and detection limits) were found to be critically related to the correct selection of the analytical parameters (collimator, voltage, current, filter) as well as on the quality of the standards. The standards are used to obtain calibration curves. The D-XRF method cannot be 11 Fig. A18a xample of an D-XRF Spectrometer used for chemical testing of corundum at GRS. A sample is positioned at the window above a X-ray generator by Dr. A. Peretti. used to differentiate between thin layers or in-homogeneities in the samples, such as natural inclusions or small scale chemical layering. Therefore, the data are averaged chemical analyses, with the additional inconvenience of the different penetration depth of the M-, L-, and K-lines. In the first survey of our project a database of 12 D-XRF spectra have been collected and only 2 elements including a, Mg, Al, Si, K, Ca, Ti, V, Cr, Mn, Fe, i, Cu, Zn, Ga, As, Ge, Rb, Sr and Au were quantified. All spectra can be recalculated and quantified for a selection of other elements (atomic number Z = 11 to 92). The D-XRF quantitative data are compared with the data of LA-ICP-MS for selected samples. (Tab A5b). LA-ICP-MS have already compared to another D-XRF instrument on a larger scale and found to be compatible (Lit. 5) with the exception of Gallium (Ga), therefore confirming that trace element determinations have been checked for accurate consistency with other methods as to the best of our possibilities at this stage.the analytical error on the concentrations for TiO2 is given here as maximal approx. +/-.1 wt-%, for Cr2O3 approx. +/-.1 wt-%, for Fe2O3 approx.+/-.1 wt-% and for Ga2O3 approx. +/-.2 wt-% and for V2O3 approx. +/-.1 wt-%. These errors are small enough to allow us to interpret the data (See Fig. A18, A19). rrors on the lighter elements (such as Mg) are considerably higher for this method. Li, B, and ryllium are not measurable by D- XRF analyses due to limited detection capabilities. D-XRF Results The trace elements used for this report s results are given in Table A3 and shown in Fig. A18, A19, A21 and A3a,b. The data revealed considerable variation mainly in the trace elements Iron (Fe), Chromium (Cr), Vanadium (V), Titanium (Ti), and Gallium (Ga). The elements a, Mg, Ca, K, Mn, i, Cu, Zn, As, Rb, Zr, Tl, Bi, Ge and Sr concentrations are occasionally found. o final conclusion are given here to interpret the presence of these trace elements.
 Yellow Green () Green () Green Blue () Yellowish Green ().2.4.6.8.2.4.6.8 Cr 2 O 3 Cr 2 O 3 Fig.")
17 12 Chemical Composition of Fancy Sapphires from Songea (Tanzania), Unheated and ryllium-treated and Origin of Color Analysis of Unheated atural Fancy and atural Pink Sapphires from Fe 2 O Fe 2 O Orange Red Orange Red () Yellow Green () Green () Green Blue () Yellowish Green () Cr 2 O 3 Cr 2 O 3 Fig. A18 Representation of D-XRF data on the dominant trace element concentrations in natural colored sapphires unheated () and heat-treated in the presence of ryllium, in oxide wt.-%. These intense saturated colors are found in the sapphires originating from Songea (Tanzania). Fe 2 O Y B BO.4.2 LP P Fe 2 O Cr 2 O 3 TiO 2 BO Y B LP P Blue Light Blue Violet Light Purple Purple Brown Brownish Orange Pink Orange Pink Orange Yellow Greenish Yellow Green Pink Fig. A19 Representation of D-XRF data on the dominant trace element concentrations (in oxide wt.-%) in natural colored sapphires unenhanced by heat () from. Color groups: Y = yellow, greenish yellow, green; BO = brown, -; B = light blue, blue; LP = light purple and purple; P = purple violet Absorbance -> Fe 3+ Fe 3+ Cr Cr 3+ Fe 2+ - Ti 4+ Cr 3+ + Fluorescence 1 = dark brown 2 = vivid yellow 3 = purple.5 4 = Wavelength (nm) -> Fig. A2a UV-VIS-IR non-polarized absorption spectra of natural unheated Fancy Sapphires (origin ). The observed absorption bands and lines can be explained by variable concentrations in chromium (Cr 3+ ), iron (Fe 2+, Fe 3+ ) and titanium (Ti 4+ ) (Trace elements confirmed by D-XRF analyses). See Fig. A19 and Compare Lit. 2. Fig. A2b The samples of four different colors of atural Sapphires spectroscopically measured (Fig A2a).
18 13 Table A3: D-XRF Chemical Analysis of atural Sapphires of Different Colors Unheated (), nhanced by Heat () and ryllium-treated () Origin: and Tanzania (in oxide wt-%, Al 2 O 3 by 1% difference) VIOLT BROW BROW BROW4-.23 BROW BROW YLLOW YLLOW3-.17 YLLOW LAVD LAVD LAVD LAVD LAVD LMO1 LMO2 LMO3 LMO4 LMO5 LMO6 LMO ORAG1 ORAG2 ORAG3 ORAG4 ORAG5 ORAG6 ORAG7 ORAG8 ORAG9 ORAG1 ORAG11 ORAG12 ORAG13 ORAG14 ORAG15 ORAG16 ORAG WHIT1 WHIT2 WHIT3 WHIT4 WHIT5 WHIT6 MIX MIX YLLOW MIX TU5-.83 TU TU TU7-.9 blue brown brown brown brown brown golden-yellow golden-yellow golden-yellow lavendar lavendar lavendar lavendar lavendar lemon lemon lemon lemon lemon lemon lemon lime yellow - - vivid golden white white white white white white white white-blue yellow yellowish-blue vivid yellow vivid yellow vivid yellow dark blue green pastel blue violet D D SAMPL SAMPL Origin Color Origin Songea Color Treatment Treatment TiO 2 TiO 2 V 2 O 5 V 2 O 5 Cr 2 O 3 Cr 2 O 3 MnO MnO Fe 2 O 3 Fe 2 O 3 Ga 2 O 3 Ga 2 O 3
19 14 Table A3 (Continued) PURPL SILVRB MAD MAD PIK SOG3-.3 SOG5-.44 SOG8-.71 SOG1-.87 SOG SOG SOG7-.5 SOG TU-.24 TU-.26 TU-.32 TU TU-.37 SOG1-.26 SOG4-.31 light purple purple purple purple purple purple purple purple violet purple light purple light purple purple purple light blue light blue green light blue light purple light blue blue green light blue yellow padparadscha padparadscha oranga brown padparadscha brownish padparadscha red green green blue green blue yellow green yellow green yellowish green red red red red red red red red red SAMPL SAMPL Origin Color Origin Songea Color Treatment Treatment TiO 2 TiO 2 V 2 O 5 V 2 O 5 Cr 2 O 3 Cr 2 O 3 MnO MnO Fe 2 O 3 Fe 2 O 3 Ga 2 O 3 Ga 2 O 3
, chromium (Cr) and titanium (Ti) concentrations (D-XRF analysis in oxide wt.-%, See Tab.")
 in comparison to those unheated (). Absorbance 2.5 2. 1.5 1.")
20 15 Origin of Color Analysis of atural Unheated "Padparadscha" and ryllium-treated Sapphires Fe 2 O Cr 2 O 3 Fe 2 O TiO 2 Unheated Fig. A21 Iron (Fe), chromium (Cr) and titanium (Ti) concentrations (D-XRF analysis in oxide wt.-%, See Tab. 5) of natural fancy color sapphires, unheated (blue), and ryllium-treated (red). Origin:. ote: ryllium-treated sapphires are not enriched in these trace elements (Fe, Cr and Ti) in comparison to those unheated (). Absorbance Stable Mg 2+ - Trapped-Hole Color Centers Fe 3+ Cr 3+ Cr 3+ Cr 3+ + Fluorescence Wavelenqth [nm] Fig. A22 Representative absorption spectra of natural brownish orangy- sapphires from unenhanced by heat. Some of the samples are reminiscent of Padparadscha colors. ote: Similarity of the absorption spectra of the samples treated with ryllium (See Fig. A23). The interpretation of origin of color, indicated for chromium (Cr 3+ ), iron (Fe 3+ and Fe 3+ pairs) as well as color centers, based on chemical compositions determined by D-XRF (Fig. A19), LA-ICP-MS analysis and literature (Lit. 4 and 24). Representative LA-ICP-MS analysis: Mg= 91 wt.-ppm, Ti= 89 wt.-ppm, V=21 wt.-ppm, Cr=521 wt.-ppm, Fe= 4937 wt.-ppm, Ga= 11 wt.-ppm (Average 17 analysis, sample o. GRS 12737, LA-ICP-MS, Table A6, Part B). + Stable Trapped-Hole Color Centers Absorbance Fe 3+ Cr 3+ Fe 3+ Cr 3+ Cr 3+ + Fluorescence Wavelenqth [nm] Fig. A23 Polarized UV-VIS-IR absorption spectra of natural pastel orangy- sapphires (origin: ) to vivid -red sapphires (origin: Songea, Tanzania) heat-treated with ryllium. Absorption spectra can be interpreted as absorption bands and lines caused by trace elements iron (Fe 3+, Fe 3+ -pairs) and chromium (Cr 3+ ) and magnesium (Trapped Hole Color Centers). Chemical analyses by D-XRF and LA-ICP-MS (See Fig. A18, A3 and Tables 3,4 and 7b,c).
21 16 Origin of Color Analysis of atural ryllium-treated Fancy Sapphires from Sample Color o. Analyses Mg Ti Cr Fe Orange 4 Average rim analysis Std Dev Blue 24 Average Std Dev Padparadscha 32 Average Std Dev Yellow 15 Average Std Dev White 19 Average Std Dev Table A4: Averaged chemical compositions (LA-ICP-MS data in wt.-ppm) of samples investigated by UV-VIS-IR absorption spectroscopy (Fig. A24). Detection limits See page 2. Absorbance Stable Trapped-Hole Color Centers Fe 3+ Cr 3+ Fe 3+ Cr 3+ Fe 2+ - Ti 4+ Cr 3+ + Fluorescence Wavelenqth [nm] Corresponding LA-ICP-MS data see sample numbers in Tab.4: - GRS (Vivid Orange Sapphire) - GRS (Blue Sapphire) - GRS (Padparadscha) - GRS 1254 (Yellow Sapphire) - GRS (White to ear Colorless Sapphire) Fig. A24 UV-VIS-IR absorption spectra of natural sapphires from heat-treated with ryllium. Sapphire Colors: White (black line), yellow (yellow line), ish- - Padparadscha - ( line), vivid (brown line) and blue sapphire (blue line). The chemical compositions are dominated by Mg, Fe, Cr and Ti (ryllium subordinate). All samples are as produced from pastel colors after heat-enhancement in the same heating run. D-XRF and LA-ICP-MS data on chemical compositions See Tab.A3 and A4. ffect of unstable color centers to the absorption spectra See Fig. A5 and Fig. A26. Interpretation of color centers based on measured divalent-cation-concentrations and absorption in the blue region of the spectrum (See also Lit. 4, Lit. 24).

22 17 UV-VIS-IR Absorption Spectroscopy of ryllium-treated Padparadscha - Sapphires BOX: Methods UV-VIS-IR Absorption Spectroscopy Spectroscopic analysis was carried out with a multi-channel TIDAS spectrometer with 124 diode arrays and an 8Watt Xenon lamp. Quartz fiberoptics of 2mm diameter, and quartz lens optics, were used to condense the signal to the sample, with another quartz lens optic utilized to collect the signal. fore the sample, and after the condenser optic, a diffuser was implemented, then, after the signal, and before the second quartz lens optics, a UV-VIS polarizing filter was used to obtain polarized absorption spectra. This set-up enabled the spectra to be recorded from 26nm to 124nm. low 3nm, an increase in background noise was present due to the characteristics of the Xenon lamp and the increase in absorption of the UV filter towards the lower UV region. The resolution of the absorption lines is restricted by the number of diodes used to approx. 1nm, as lines narrower than this constraint could not be seen. The measuring time was 1 milliseconds. 2 spectra were collected in one run and averaged to obtain one spectrum. The data was computed by software from the manufacturer. The Zero absorption line was collected for each set up which allows correcting for the absorption characteristics of the polarizing filter before every measurement. Due to the nature of multi-channel spectroscopy, fluorescent emission lines (as seen, for example, as a white fluorescent line in a hand-held Fig. A25 The GRS UV-VIS-IR multi-channel spectrometer used for recording the absorption spectra of the gemstones. A special measuring chamber set-up (Center of picture) enables the collection of non-polarized, or polarized absorption spectra, between 29nm (UV) and 124nm (IR) on rough or faceted gemstones in all different crystallographic directions within milliseconds. spectroscope) will also appear in an absorption spectrum as a negative peak towards lower absorptions. Results of these analyses are given in Fig. A5, A2a, A22, A23, A24, A26, A27, A28 and A29. Absorbance - > Stable Trapped-Hole Color Centers and Unstable Color Centers Color shift due to unstable yellow color centers Fe 3+ Cr 3+ Fe 3+ Cr 3+ Cr 3+ + Fluorescence Absorbance - > Stable Trapped-Hole Color Centers Fe 3+ Cr 3+ Fe 3+ Cr 3+ Cr 3+ + Fluorescence Wavelength - > Wavelength - > Fig. A26 Right side: Polarized UV-VIS-IR absorption spectra of a pastel - sapphire heat-treated with ryllium. Absorption parallel and perpendicular to the c-axis are shown, responsible for - to pleochroism in the gemstones. Left side: Color shift after long term UV- exposure (shift to higher absorption in the blue region of the spectrum). Two absorption curves due to the presence of different types of color centers are indicated. Trapped-hole color centers are interpreted as stable (See blue curve at lower absorptions in the blue region of the spectrum) (Compare Lit. 4 and Lit. 24).


. + Stable Trapped-Hole Color Centers 2. 1 Fe 3+ Fe 3+ 1.")
23 UV-VIS-IR Absorption Spectroscopy of ryllium-treated atural Yellow Sapphires, Orangy-Red and Blue Sapphires, and Surface Diffusion-Treated Blue Sapphires. + Stable Trapped-Hole Color Centers Absorbance - > Fe 3+ Cr 3+ Cr 3+ + Fluorescence Sample o.grs Wavelength - > Fig. A27 Polarized UV-VIS-IR absorption spectra of a vivid sapphire heat-treated in the presence of ryllium. Absorption parallel and perpendicular to the c-axis are shown, responsible for yellow- to -red dichroism in the gemstone. ote: Strong effect of pleochroism to the development of the 55nm band and the presence of a prominent 45nm line (Due to higher Fe3+-concentrations) in the spectra. Chemical composition for Mg,, Cr, Fe see Table A18. (Mg- concentrations 1x higher than -concentrations if expressed in wt.-ppm). + Stable Trapped-Hole Color Centers 2. 1 Fe 3+ Fe Absorbance - > Wavelength - > Fig. A28 Polarized UV-VIS-IR absorption spectra in the direction of the c-axis of yellow sapphires with increasing saturation produced by heat-treatment with ryllium. The spectra is dominated by iron (Fe3+ and Fe3+ -pairs) for spectrum o. 3. Increase of Fe-concentrations (from 1 to 3) as determined by D-XRF analyses. Presence of color centers based on spectral curve (absorption in the blue region of the spectrum) and divalent cation (+Mg)-concentrations (See LA-ICP-MS Data Table A4). Compare also with Lit. 4 and Lit 24. Absorbance - > Stable Trapped-Hole Color Centers Cr 3+ Fe 3+ Cr 3+ Fe 2+ - Ti 4+ Cr 3+ + Fluorescence Sample o.grs Wavelength - > Sample o.grs T-Blue Fig. A29 Polarized UV-VIS-IR absorption spectra of a diffusion-treated blue sapphire (T ) (See blue line), and ryllium-treated blue sapphire. ote: Major differences in the absorption characteristics in the UV region of the spectrum. Surface diffusion-treated sapphires (T) show more transparency in the lower UV und blue region of the spectrum between 3 and 45nm. 18
24 Chemical Composition of atural Sapphires of Different Colors Heat-Treated in the Presence of ryllium Conclusions on Origin of Color (D-XRF, UV-VIS-IR) The chemical analysis and spectroscopic study were carried out on fancy sapphires of different colors from, both for gemstones unenhanced by heat () and, in comparison, for gemstones heat-treated with ryllium (Compare Fig. A19, A21, A3a). Comparing the quantitative data, (e.g. focusing on the concentration of trace elements between and unenhanced () sapphires of the same color, and the intensity of the absorption lines, Compare Fig. A2a, A22 with Fig. A23 and A24), the following major differences were noticed: For the large group of sapphires heat-treated in the presence of ryllium, it was found that chemical concentrations (Fe and Cr) were much lower than those found in the natural counterparts of the same color family. The presence of iron (Fe 3+, Fe 3+ -pairs) cause absorptions in the gemstones typical for yellow sapphires. Chromium (Cr3+) and iron (Fe 3+, Fe 3+ -pairs) were found to contribute to the color of orangy- sapphires. However, the iron caused absorptions as determined by UV-VIS-IR absorption spectroscopy are too weak to explained the extent of the color contribution (See Fig. A23 and A24). Two different reasons can be given to explain this: - The presence of other origins of color are present such as color centers related to light elements (such as Mg or ) (Compare Lit. 4 and Lit. 24). Fe 2 O 3 Fe 2 O 3 Fe 2 O Y Cr 2 O P Cr 2 O Tio 2 Y Golden Yellow Lemon Yellow Orange Viv Golden Orange Orange Pink White Golden Yellow Lemon Yellow Orange Viv Golden Orange Orange Pink Vivid Yellow 2 Orange 2 Vivid Yellow 2 Golden Yellow Lemon Yellow Orange Viv Golden Orange Orange Pink White - The origin of color must be concentrated in certain levels within the gemstones, not necessarily accessible by D-XRF analysis. This is confirmed by the microscopic studies. D-XRF cannot see these layers within the gemstones due to the restricted analytical sampling volume. Therefore, the color, as seen face up, cannot be explained sufficiently by the chemical analysis as determined by D-XRF on the surface. Similar trends, however, such as the correlation of the color with the dominant trace element present, were still possible. The correlation of the chemistry with UV-VIS-IR spectroscopy is restricted, because UV-VIS-IR is a bulk analysis which measures the light absorbed in certain colored levels of the gemstone. The intensity of the absorption spectrum depends on the light path through the gemstone. The layers of color measured by UV-VIS-IR spectroscopy may not be at the same position as the part of the gemstone measured by D-XRF analysis. Therefore, further conclusions are difficult for samples with color zoning. To further clarify the origin of color, it is therefore necessary to extend the D-XRF to another method which focuses precisely on the micro-chemical Fig. A3a,b D-XRF chemical analyses (in oxide wt.-%) of different natural colored sapphires heat-treated with ryllium. The samples from the first two graphs originate from the same heat treatment run of pastel colored sapphires from (See materials f.).the group of colors indicated via o. 2 corresponds to samples which were re-polished after treatment, and which are not from the same heating run or the same heat treatment laboratory. The golden yellow, and lemon and yellow, group (Y) is indicated, as well as the field of to orangy- colors (P). ote: White sapphires are those that did not change after heat-treatment with ryllium. Compare group P (these figures) with counterparts in Fig. A19 (the field BO) and the fields Y in both figures Fig. A3b and Fig. A19. It can be noted that the chemical compositions (as determined at the surface of the gemstones by D-XRF analysis, See Fig. A3) are much lower than the natural unenhanced counterparts with the same color (compare Fig. A19). variations within the gemstone, and which allows correlation of micro-banding of chemical compositions with microscopic color banding. Further tests require a complicated sampling procedure (See Table A6) and extensive measurements by LA-ICP-MS as shown in the following pages. 19

25 2 Methods Laser Ablation (LA) Inductively Coupled Plasma (ICP) Mass Spectrometry (MS) Methods: LA-ICP-MS Inductively coupled plasma mass spectrometry (ICP-MS) has developed rapidly and is now a routine method for multi-elemental analysis of many types of samples. As the use of aqueous solutions is not very convenient when working with solid samples (dissolution, contamination, etc), alternative solid sample introduction techniques, such as laser ablation, are used with ICP-MS. Ablation of solid samples, using a laser with a flow of carrier gas to carry the ablated material from a suitable cell to the ICP, is a very powerful technique. The development of new laser systems (Quadrupled D:YAG [Lit. 5], excimer [Lit. 8]), homogenization optics, increased mass spectrometer sensitivity, accompanied by an increased linear dynamic range, has led to a large number of new applications (Lit. 5). In this work, an ArF excimer laser (193nm; Compex 11I, Lamda Physik, Goettingen, Germany), coupled with a quadrupole mass spectrometer (lan 61 DRC Perkin lmer/siex, Toronto, Canada), was used (See Fig. A32). A homogenized laser beam with a flat top beam profile was imaged onto the sample surface using mirror optics, homogenizer arrays, and a petrographic microscope. This system allows the laser beam onto the sample, while allowing the operator to observe the sample during ablation. An in-house fabricated ablation cell, which can hold five samples, including a reference material for calibration, had a total volume of 2 cm3. Helium was used as the sample carrier gas (1.2 l min -1 ), introduced into the cell using a nozzle with an inside diameter of 1 micrometers. of the normalized sensitivity over 2 analyses (run) was corrected by measuring the reference material four times - twice at the beginning, and twice at the end of an analytical run using a linear interpolation of the sensitivity with time. For this study more than 3 samples were analyzed - with mainly, Mg, Al, Cr, Mn, Ti, and some 3 other trace elements, measured in all samples. Detection limits for selected elements: =.3 to.5 ppm Mg =.2 to.5 ppm Ti = 1 ppm Cr = 2 ppm V = ppm Fe = 3 ppm Ga =.6 to.12 ppm (variation depending on the concentrations measured) In most samples, a profile across the gemstones was probed using an 8 micron crater diameter to determine the edge rim concentration. Blank level determinations were placed randomly across the sample (e.g. See Fig. A55) to determine differences between enhanced (), unheated () and in rylllium-treated samples, shortly noted as in Table A6. An argon gas flow (.85 l min-1) was mixed with the helium gas flow at.5cm after the cell, and this mixture was transported though 1m length PVC-tubing (inside diameter.4cm) to the ICP. For data collection, the LA-ICP-MS system was operated in time resolved mode. very 52 ms, the intensities of 4 selected isotopes are measured and stored. At this data acquisition repetition frequency (approximately 2 Hz), no significant fluctuation of the time resolved signal was observed. The integration intervals (background and gross analyte) were selected manually, and then the gross signal was background corrected using the preablation signal. The concentrations in the samples were calculated using SRM IST 612 glass as external standard, with Al being used as internal standard. Using AI normalized sensitivity, the changes in the volume (mass) of the sample, which was ablated, was corrected. The data for samples slightly exceeding 1% have not been corrected, because the correction results in insignificant concentrations changes (smaller than the detection limit). A small drift Fig. A31 LASR ABLATIO ICP-MS Analyses by Prof. D. Günther in early 22 (details see Fig. A32).
 the material (crater diameter 4 to 8 microns) (3).")
26 21 Details Method LA-ICP-MS Fig. A32 Laser Ablation Mass Spectroscopy (LA-ICP-MS) at the Laboratory for Inorganic Chemistry, SFIT ZH, Switzerland (Prof. D. Günther) xplanation of method The laser ablation technique (LA) uses a 193 nm excimer laser (1) which is focused onto the sample surface via microscope lenses (2). The laser is ablating (carrying away) the material (crater diameter 4 to 8 microns) (3). The mobilized material is suspended in a carrier gas (4) and transported via transport tube into an Inductively Coupled Plasma Mass Spectrometer (ICP-MS) (5). The material/elements (except those that cannot be ionized, such as gases and fluorine) are vaporized, atomized and ionized within the ICP. The created ions are then transferred to the mass spectrometer and separated by their mass divided by charge (5). The detector allows measuring major, minor and trace elements within a single analysis. Very light elements, such as boron, lithium or beryllium, can be detected, along with a large series of other elements at concentrations of less then 1 ppm. The quantification at low concentrations is possible by LA-ICP-MS due to a matrix-independent calibration, including special computer analysis and specific software (6). The use of complementary solid-analysis methods (such as MPA and XRF) for comparison and validation purposes (e.g. for quantitative measurement of silicon and aluminium) must be applied (see Table A5b). Repeated Measurement Average 5 Ratio Repeated Measurement Average 17 Ratio Average 15 Ratio Sample Or Or D-XRF D-XRF LA-ICP-MS D-XRF/LA D-XRF D-XRF LA-ICP-MS D-XRF/LA D-XRF LA-ICP-MS D-XRF/LA Average O D D.33 D D D.175 MgO D D.129 D D.152 D.192 Al 2 O K 2 O CaO TiO V 2 O 5.12 D Cr 2 O MnO D Fe 2 O Ga 2 O Table A5b Comparison of LA-ICP-MS and D-XRF data (in oxide-wt.-%). Values given for D-XRF represent bulk analysis, whereas LA-ICP-MS data is multiple local analysis (averaged). Therefore, variation of concentrations are sample dependant. D = low detection limit or not detectable. CaO- and K 2 O-concentrations are due to surface contaminations. Repeated measurements include repositioning of the sample.
27 22 Table A5a: Averaged LA-ICP-MS Data of Various atural Sapphires of Different Colors ryllium-treated and Untreated Table A5a Averaged LA-ICP-MS trace element concentration (in wt.-ppm) of natural sapphires of different colors heat-treated in presence of ryllium and two unheated natural sapphires (purple and violet). Sample Color Average Mg Ti V Cr Fe Ga Orange 4 Average Std Dev Blue 2 Average Std Dev Blue 24 Average Std Dev Padparadscha 2 Average Std Dev Padparadscha 26 Average Std Dev Padparadscha 32 Average Std Dev Padparadscha 5 Average rim analysis Std Dev Yellow 15 Average Std Dev White 19 Average Std Dev White 19 Average Std Dev Purple 1 Average < Std Dev Violet 17 Average < Std Dev
28 23 Table A6: Sampling and Probing Strategy for LA-ICP-MS Analysis (Part A and Part B) Sample Weight (ct) Color Material Treatment Preparation Source Origin LA-ICP-MS Profile PART A Peretti Peretti pieces same original sample.35 recut.21 center slice.22 center silce * 2 pieces purple orangy- ish- ish- ish- ish- vivid yellow blue atural Purple Sapphire atural Pastel Padparadscha atural Pastel Padparadscha atural Pastel Padparadscha atural Pastel "Padparadscha" atural Pastel "Padparadscha" atural Yellow Sapphire atural Sapphire 1. rough 2. cut half 1. treated new method 2. faceted 3. recut by GRS 1. faceted 2. treated new method 3. cut thick section same as above 1. faceted 2. rreated new method 3. cut half for profile same as above same as above same as above GRS's collection Chantaburi market GRS supply to Chantaburi Factory Jan 22 GRS supply to Chantaburi Factory Dec 21 same above same above same above 1 profile 13 spot analysis girdle analysis 5 spot analysis scattered 2 dim. 32 spot analysis scattered 2 dim. 26 spot analysis 1 profile 2 spot points 4 profiles 66 spot points 1 profiles 3 control points 2 spot points 4 profiles 5 spot points colorless to light cream atural White Sapphire same as above same above 4 profiles 46 spot points T-blue pieces.8.7 vivid vivid orangy-red blue purplish- ish- atural Orange Sapphire Fancy Sapphire "Intense Padparadscha" Diffusion-treated Sapphire atural Pink Sapphire atural Pastel "Padparadscha T heat-treatment and diffusion treatment with Titanium 1. faceted 2. treated new method (surface analysis) 1. heated 2. faceted 3. cut half 1. treated 2. faceted 3. cut half cut half piece (keep for reference before treatment) heat treated (not repolished) same above Chantaburi market Jan 22 Bangkok Mar 22 GRS supplied to Bangkok Factory Feb 22 same above Songea (Tanzania) natural white sapphire origin not known surface anlysis 4 spot analysis 2 dim. mapping (2 pieces) 37 spot analysis 2 dimensional mapping 16 spot analysis 1 profile 14 spot analysis surface profile depth profile 34 spot analysis purplish- ish- violet atural Pink Sapphire atural Pastel "Padparadscha atural Violet Sapphire cut half piece (keep for reference before treatment) 1. faceted 2. cut half 3.heated new method 4. cut half for profile keep half piece for ref not heated same above 1 profile 14 spot analysis Surface profile depth profile 34 spot analysis 17 spot analysis profile PART B quarter piece half-piece ish- ish- "ish- slightly brown" - purplish- - - atural Pastel "Padparadscha atural Pastel "Padparadscha atural Pastel "Padparadscha atural Pastel "Padparadscha atural Purplish-Pink Sapphire atural Pastel Padparadscha atural "pastel" Padparadscha 1. cut half 2. treatment for halfpiece 1. cut half piece 2. treatment 3. cut half after treating keep half for reference untreated 1. cut half 2. treatment of half piece keep half for reference untreated 1. cut half 2. treatment of half piece 1. faceted 2. treated 3. cut half piece same above same above same above same above same above surface profile depth profile 42 spot analysis core/rim 3 analysis 17 spot analysis 34 spot analysis surface profile depth profile profile 14 spot analysis surface profile depth profile 31 spot analysis 1 profile 16 spot analysis surface analysis 4 spot analysis vivid -red vivid yellow Fancy Sapphire "Intense Padparadscha" atural Yellow Sapphire at elevated pressures (oxidizing conditions) 1. heated 2. faceted 3. recut to expose inclusion with halo 1. heated 2. recut Chantaburi market Jan 22 Rogers (Bangkok) songea (Tanzania) Sri Lanka porfile over inclusion 8 spot analysis 2 profiles 4 spot analysis
29 24 Results of LA-ICP-MS Analysis of ryllium-treated atural White and Orangy-Pink Sapphires Results LA-ICP-MS The different colors analyzed (Table A6, Part A) are discussed below, including orangy-, white, blue, and yellow sapphires heat-treated with ryllium. Details of sampling strategy and preparation are summarized in Table A6, and discussed in more details below. The results are given in Tab. A7, A8, A9, A1, A11, A12 and presented on page in more details. atural Orangy-Pink Sapphires Heat-Treated with ryllium: Results LA-ICP-MS The color of the starting material of the orangy- sapphire (prior to heat-enhancement) was. The samples were each approx. 1 ct in size, and one sample was kept untreated. The samples were first checked by routine gemological testing, including recording of the absorption spectrum, and subsequently sent for heat experimentation in Chantaburi in December 21. To recognize the stone after heat-enhancement, heart shaped samples were chosen and placed together in a lot with sapphires of different shapes. After the heat experiments, the samples were cut in half and their profiles analysed with LA-ICP-MS (See Laser probing ablation craters Fig. A35 and Fig. A4). Two of the samples were later sliced into a 3mm thick plate and checked with Cathodoluminescence, as shown on page 4. Pink sapphires and unheated samples were measured for comparison, with the number of measured points by LA-ICP-MS indicated in Table A6. Typical measured profiles are shown in Fig. A35, A39, A4 and A54. The purpose of the sampling arrangement was to get information on variations in the chemical compositions of the gemstones within steps of 1 micrometers. The profile was positioned in such a way that the variations in chemistry between core and rim on the faceted stones could be studied. The data found is shown in Fig. A36, A37, A38, A41, A42 and also given in Tab. A8, A9, A15. Concentrations of ryllium (), Magnesium (Mg), Titanium (Ti), Vanadium (V), Chromium (Cr), Iron (Fe), and Gallium (Ga) are shown in wt.-ppm (comparison with D-XRF needs conversion into oxide wt.-%) - Table A5b. Other elements such as a, Ca, K, and heavy elements, such as Cd and Pb, were found to be unimportant along with other light elements (Lithium and Boron). Two representative samples were checked for additional elements present (Zn, Ge, Ag, Pt, Sn, Pt, Au, Tl and Bi). In all the profiles tested, the dominant elements present were Fe and Cr, followed by minor concentrations of Mg, Ti, V and Ga, as well as. All gemstones were enriched with elements in similar areas: Fe, Cr, V, Ti and Mg were depleted in the rim and enriched in an inner rim, while, towards the core, the concentrations decreased, but were less pronounced than towards the outer rim. In contrast, ryllium concentrations were highest (maximum concentration approx. 3wt.-ppm) in the outer rim, and penetrated the samples to a depth of about 2-3 micrometers, decreasing within the rim. The highest concentrations of Cr and Fe were not found in the same zones as the ryllium concentrations. The orangy- color is concentrated in the inner rim at the positions of the Fe and Cr enrichments. The highest ryllium concentrations were reached in the rim where coloratrion was found (Fig. A38, A41b). Regarding the origin of color, unstable yellow color centers are found in the outer zones of the rim where ryllium concentrations are located (Fig. A26). Regarding the presence of other divalent ions in these zones, it is noted that Magnesium (Mg) is enriched in the zones of higher Cr and Fe. This compositional zoning is confined to the surface of faceted gemstones. The chemical trends with pronounced depletion in the rim were confirmed in total of seven profiles. Details of two other samples of orangy- sapphires are given in this report, and a further two samples have been analyzed by both cathodoluminescence, and LA-ICP-MS (Fig. A58). For comparison purposes, further samples unenhanced by heat and sapphires were analyzed (Fig. A52). It was found that all the elements were already present in the original material before treatment, with the exception of ryllium, and that the distribution was homogeneous without pronounced rims with Fe and Cr enrichments (Fig. A52). In conclusion, element trends in the treated gemstones are therefore produced by the new ryllium-treatment - ryllium has been introduced from outside sources, as it is not present in the original material. atural White Sapphires Heat-Treated with ryllium: Results LA-ICP-MS Although these type sapphires were also subjected to the new heat treatment with ryllium, almost no change in color did occur. The studied sample was cut in half after the heat treatment experiment and in the subsequently studied with LA-ICP MS (as shown in Fig. A33-A34). Fe concentrations of maximal 7wt.-ppm and more than 1wt.-ppm Mg were achieved by the new treatment in the gemstones more central portions, along with relatively high Ti concentrations (Ti = 1-2wt.-ppm) yet this was not enough to create color in the gemstone, besides a very pale cream. The gemstone s outer rim (where concentrations are found) is the location of unstable color centers produced by UV treatment. These faded after exposure to heat (See Fig. A4 and Fig. A5). Only unstable color centers at the rims were detected, obviously related to areas of lowest Ti, Fe and Cr and highest -concentrations (Mg/-ratio are approx. 1, based on calculation of wt.-ppm values).
30 25 LA-ICP-MS Analysis of atural White Sapphires Heat-Treated with ryllium. Details on Selected Trace lement Concentrations PPM Mg Ti V Cr Fe Ga PPM Cross Section Cross Section Fig. A33 Chemical compositions in a profile across the white sapphire heat-treated with ryllium as determined by LA-ICP-MS. ote chemical compositions are dominated by trace element Fe only, while light elements, such as and Mg, are subordinate. The ryllium concentrations are restricted to the outer zone and do not exceed 15wt.-ppm. ote: Decrease of trace elements including Fe and Mg concentrations towards the rim and the increase towards the center of the faceted gemstone, a trend which is confined to the surface of the faceted gemstone. Ti-concentrations are higher than Mg-concentrations (based on calculations of wt.-ppm values). PPM Cross Section Mg Fig. A34 LA-ICP-MS analysis in a profile across the sample. It is shown that the ryllium concentrations are restricted to the outer rim outside the observed color zonings. The maximum concentrations are below 15wt.-ppm. It is evident that -enrichments occurred outside the zones enriched by Mg. Table A7: Trace lement Concentrations (in wt.-ppm) of a atural White Sapphire Heat-Treated with ryllium. Profile 1-19 across the sample Sample o.grs white Mg Ti V Cr Fe Ga
, produced during the measurement of the chemical composition of the gemstones, due to evaporation of test material by applying the")

31 LA-ICP-MS Results of atural Orangy-Pink ("Padparadscha") Heat-Treated with ryllium Sample o.grs Fig. A35 Faceted orangy- sapphire cut in half after Heat-Treatment with ryllium. A trail of Laser ablation craters is visible (8 micrometer diameter), produced during the measurement of the chemical composition of the gemstones, due to evaporation of test material by applying the Laser. A data point every 1 micrometers could be obtained. PPM Mg Ti V Cr Fe Ga PPM Cross Section Cross Section Fig. A36 Chemical variation in a profile through an orangy- sapphire heat-treated with ryllium. All the elements found are shown except Al (in wt.-ppm). ote: Dominant concentrations of Fe and Cr, and the symmetrical variation in composition (depletion of Fe, Cr, Ti, Mg in the outer zone (1-3 and 18-2) and enrichment in points 5-7 and ). Fig. A37 Same profile as Fig. 44, but only the ryllium concentrations are shown. Highest -concentrations (in wt.-ppm) are found in the rim (points 1-3 and 18-2). The -concentrations gradually decrease towards the center (penetration depth into sample approx. 2-3 micrometer ) PPM Mg Cross Section Fig. A38 LA-ICP-MS analysis in a profile across the sample. Comparison of Mg and -enriched zones in the enhanced sapphire. The Mg-concentrations (in wt.-ppm) are about 5-1 times higher than the ryllium concentrations (based on wt.-ppm values). 26
32 27 LA-ICP-MS Analysis of atural Orangy-Pink Sapphires ( Padparadscha ) Heat-Treated with ryllium with Details ontrace lements Concentrations Table A8: Trace lement Concentrations (in wt.-ppm) of a atural Orangy-Pink Sapphire "Padparadscha" Heat-Treated with ryllium, Profile 1-32 across the sample Sample o.grs Mg Ti V Cr Fe Ga Table A9: Trace lement Concentrations (in wt.-ppm) of a atural Orangy-Pink Sapphire"Padparadscha" Heat-Treated with ryllium, Profile 1-2 across the sample Sample o.grs Mg Ti V Cr Fe Ga

.")
33 LA-ICP-MS Analysis of atural Orangy-Pink Sapphires ( Padparadscha ) Heat-Treated with ryllium Sample o.grs Fig. A39 Heart-shaped sapphires were subjected to heat-treatment with ryllium. On the left, a sample which was heat-treated and subsequently cut in half, while on the right, a half piece from another sapphire kept untreated for comparison. ach is about.5ct in weight. ote: Color change from to orangy- due to the ryllium-treatment process Mg Ti V Cr Fe Ga Cross Section Fig. A41a The chemical variations in a profile across the faceted and ryllium-treated orangy- sapphire is shown (in wt.-ppm). ote: depletion of trace elements in the rim (including Ti) of the faceted gemstone and enrichment in an inner rim (o. 5-8 and 19-22), including Cr, Fe and Mg. ryllium is enriched in the outer rim. PPM Fig. A4 An orangy- sapphire cut in half after treatment. The trail of Laser Ablation craters is also shown. The chemical data obtained allows for conclusions on the chemical composition in the faceted gemstone in profile across the sample Cross Section Fig. A41b The distribution of ryllium in a profile through a faceted orangy- sapphire. ote: concentrations are found in the outer rim only (max. 14wt.-ppm) PPM Mg Cross Section Fig. A42 LA-ICP-MS analysis in a profile across the sample (in wt.-ppm). Mg and -enriched concentrations in the enhanced sapphire are shown. The Mg-concentrations are depleted at the outer rim and the -concentrations are enriched 28


34 Details of atural Blue Sapphires Heat-Treated with ryllium with Details on Color Zoning and LA-ICP-MS Probing atural Blue Sapphires Heat-Treated with ryllium: Results LA-ICP-MS The study of the blue sapphires ryllium-treated shows that color zoning in the gemstones is not related to the presence of ryllium. The color zoning is produced in this sample from a pre-existing whitish band containing titanium. A diffusion of titanium, seen as a blue halo around the white band, occurred. The diffusion of titanium is restricted to about 2 micrometers, and well supported by chemical data. Due to a pre-existing in homogeneous chemical composition in the gemstone, heat-enhancement produced a complicated color zoning pattern with orangy- and blue oscillations (Fig. A45). The chemical zoning regarding Fe and Cr is following the faceted surface of the gemstone, with depletion in the rim and enrichments towards the center. Interference with the titanium zoning, at positions of both titanium and Fe-enrichments, has produced a blue color. Padparadscha colors were produced at Fe greater than 8wt.-ppm, Cr greater than 2-3 wt.-ppm, Ti lower than 2wt.-ppm, and Mg greater than 8wt.-ppm, while blue colors were produced at Fe greater than 8wt.-ppm and Ti greater than 2wt.-ppm. All the trace elements found in these samples which are responsible for the color can be found in the natural unheated colored sapphires (Fig. A19, A52 and Table 5 and Appendix page 46 and 47). The zones of ryllium in this sample were found to be concentrated in the outer areas containing unstable color centers (Fig. A4). Therefore colors were formed both, in areas with and without ryllium. Sample o.grs Fig. A43 Microphotograph of a princess cut sapphire heat-treated with ryllium (second half of the piece shown in Fig. A46). The sample was cut in half after treatment and probed by LA-ICP MS in a profile across the sample. Craters are due to Laser sampling Fig. A44 xtended part of Fig. A43 shows that the sampling is sufficient to collect information on the chemical variations in the gemstone in relation to color zoning present. ote a broad band of blue color on both sides of a whitish-blue band, defining an approximately 2 micron broad blue diffusion zone on each side Fig. A45, page 3 The chemical compositions (in wt.-ppm) in a profile across a ryllium-treated sapphire as determined by LA-ICP-MS. ote: Chemical compositions are dominated by trace elements Cr, Fe, and Ti - light elements, such as and Mg, are subordinate. The ryllium concentrations are restricted to the outer zone and do not exceed 3wt.-ppm. Magnesium (Mg) is found in the entire profile with concentrations of about 5 to 1wt.-ppm. ote: Zones rich in Mg at the absence of are found at points 6 to 1. At Ti below 15wt.-ppm, Cr above 2wt.-ppm and Fe above 1wt.-ppm "Padparadscha" colors may be formed. This corresponds well to the observed color banding in the gemstone. ote: Point o. 1 (See arrow) is a Padparadscha color band containing Fe, Cr, V, Ti and Mg but no ryllium. Orange color in zones containing ryllium are found in the outer zone between point

35 LA-ICP-MS Analysis of atural Blue Sapphires Heat-Treated with ryllium with Details of Trace lement Concentrations Fig. A46 xpanded area of Fig. A44 shows details of the color zoning, and the points measured by LA-ICP-MS. The numbers refer to the measured points. color zoning is suivided into orangy- Padparadscha (P), pastel blue (S), cornflower blue (CB) and royal blue (RB). ryllium concentrations are restricted to the zones. (1-5 and 23-24). lement concentrations expressed in wt.-ppm PPM Mg Ti V Cr Fe Ga PPM PPM 6 Mg Cross Section 3
 in a profile across the blue sapphire (heat-treated with ryllium) as determined by LA-ICP-MS.")
36 LA-ICP-MS Analysis of atural Blue Sapphires Heat-Treated with ryllium with Details on Trace lement Concentrations. Sample o.grs PPM Mg Ti V Cr Fe Ga Fig. A46a,b The chemical compositions (in wt.-ppm) in a profile across the blue sapphire (heat-treated with ryllium) as determined by LA-ICP-MS. ote: Chemical compositions are dominated by trace elements Cr, Fe, and Ti and light elements, such as and Mg, are subordinate. The ryllium concentrations (in wt.-ppm) are restricted to the outer zone and do not exceed 3wt.-ppm. ote: Zones rich in Fe and Ti are found in broader zone at points 5 to 15 with a maximum at point 12. The blue band is confined to the zones enriched in both Fe and Ti. ote: Decrease of Fe concentrations towards the rim and the increase towards the center of the faceted gemstone. Mg concentrations are depleted in the rim and concentrated towards the core (Range between 26 and 16wt.-ppm). At high Ti concentrations no "Padparadscha" colors are formed Cross Section Mg Cross Section Cross Section Fig. A47a,b LA-ICP-MS analysis in a profile across the sample. It is shown that the ryllium concentrations (in wt.-ppm) are restricted to the outer rim outside the observed color zonings. The maximum concentrations are below 3wt.-ppm. In Fig. A47a, it is evident that ryllium ()-enrichments occurred outside the enrichment of Mg. PPM 31 PPM
37 32 LA-ICP-MS Analysis of atural Blue Sapphires Heat-Treated with ryllium with Details on Trace lement Concentrations. Table A1: Trace lement Concentrations (in wt.-ppm) of a atural Blue Sapphire Heat-Treated with ryllium, Profile 1-2 across the sample Sample o.grs Mg Ti V Cr Fe Ga Table A11: Trace lement Concentrations (in wt.-ppm) of a atural Blue Sapphire Heat-Treated with ryllium, Profile 1-24 across the sample Sample o.grs Mg Ti V Cr Fe Ga

38 LA-ICP-MS Analysis of atural Yellow Sapphires Heat-Treated with ryllium with Details ontrace lement Concentrations. atural Yellow Sapphires Heat-Treated with ryllium: Results LA-ICP-MS The yellow sapphire was produced from a near colorless sapphire by heat-treatment with ryllium, cut in half, and then the chemical compositions were measured in a profile across the sample (See Table A6). Chemical zoning was found in the gemstone confined to the faceted surface of the sample as shown in Fig. A49 and A5. This zoning was therefore produced by the ryllium-treatment. The dominant trace element in this gemstone is Fe, while all other elements found in the gemstone are below 2wt.-ppm. ryllium concentrations are restricted to the gemstone s outer zone (15 wt.-ppm maximum), the rim of the gemstone shows a depletion in Fe, and Fe and Mg is enriched towards the center. A large portion of the gemstone reaches levels higher than approx. 8wt.-ppm of Fe-, and Mg concentrations are always greater than Ti-concentrations (based on wt.-ppm values). This seems to be the ideal combination for coloring the sample yellow by the ryllium-treatment (such as divalent-cation-trapped hole color-centers) (Lit. 4 and Lit. 24). The gemstone s outer rim - where concentrations are found - is the location of colored unstable color centers produced by UV light exposure (See Table A1). These faded after mild exposure to heat. PPM PPM Cross Section Cross Section Mg Fig. A49 LA-ICP-MS analysis in a profile across the sample. It is shown that the ryllium concentrations (in wt.-ppm) are restricted to the outer rim. Mg is enriched in an inner rim.the maximum ryllium concentrations are below 15wt.-ppm. Mg Ti V Cr Fe Ga PPM Sample o.grs Cross Section Fig. A48 Microphotograph of a princess cut yellow sapphire heat-treated with ryllium. The sample was cut in half after treatment and probed by LA-ICP-MS in a profile across the sample (See craters). Fig. A5a,b Chemical compositions (in wt.-ppm) in a profile across the yellow sapphire heat-treated with ryllium as determined by LA-ICP- MS. ote: Chemical compositions are dominated by trace element Fe and Mg compositions, while light elements, such as ryllium are subordinate (in wt.-ppm). The ryllium concentrations are restricted to the outer zone and do not exceed 15wt.-ppm. Decrease of Fe and Mg concentrations towards the rim, and the increase towards the center of the faceted gemstone. Mg/Ti-ratio is high (based on wt.-ppm values). 33
39 34 LA-ICP-MS Analysis of atural Yellow Sapphires Heat-Treated with ryllium with Details ontrace lement Concentrations. Table A12:Trace lement concentrations (in wt.-ppm) of a atural Yellow Sapphire Heat-Treated with ryllium, Profile 1-15 across the sample Sample o.grs 1254 Mg Ti V Cr Fe Ga
.")
40 LA-ICP-MS Analysis of atural Unheated Purple Sapphires with Details of Trace lement Concentrations atural Unheated Purple Sapphires Results LA-ICP-MS This sample is representative for those that can be successfully heat treated using ryllium (See Fig. A19 (Field LP and P). The same elements are found in the treated samples (Fe, Cr, Ti, V, Mg, Ga), except which is missing in the natural sancy sapphires not enhanced by heat. Of particular interest is the ratio of Mg/Ti which in this sample is almost equal to 1 (based on wt.-ppm). ote: The pronounced chemical zoning (observed in the treated samples) is absent. Sample o.grs Fig. A51 Microphotograph of a purple sapphire unenhanced by heat. LA-ICP MS craters are shown (8 micrometer diameter). Representative for samples that can be successfully heat treated with ryllium. wt.-ppm Mg Ti V Cr Fe Ga Fig. A52 Profile across the sample of Fig. A51 shows the chemical variations (in wt.-ppm) in the gemstone due to its natural composition. o depletion and no symmetric chemical zonings were present, particularly regarding the lighter elements Mg and Ti. ote: Similar chemical compositions (dominantly Fe, Cr, Ti, V, Mg, Ga) are present as in the enhanced counterparts, with the exception of ryllium which is absent. Ti concentrations are almost equal to Mg concentrations if expressed in wt.-ppm. Cross Section Table 13: Trace lement Concentrations (in wt.-ppm) of a atural Purple Sapphire Unenhanced by Heat Profile 1-1 across the sample Sample o.grs 1498 Mg Ti V Cr Fe Ga
41 36 LA-ICP-MS Analysis of atural Unheated Violet Sapphires and ryllium-treated Orangy-Pink Sapphire with Details of Trace lement Concentrations Table A14:Trace lement Concentrations (in wt.-ppm) of a atural Violet Sapphire Unenhanced by Heat (). Profile 1-17 across the sample Sample o.grs 1272 Mg Ti V Cr Fe Ga Table A15: Trace lement Concentrations (in wt.-ppm) of a atural Orangy-Pink Sapphire "Padparadscha" Heat-Treated with ryllium, Profile 1-26 across the sample Sample o.grs Mg Ti V Cr Fe Ga
 with Surface Diffusion-Treated Sapphires (T) Diffusion-treated and fancy sapphires heat with ryllium the new treatment (pastel colors and vivid")
42 37 Comparison of nhanced atural Orangy-Pink Sapphires, ryllium-treated Vivid Orange-Red Sapphires and Surface Diffusion-Treated Sapphires (T). Comparison of ryllium-treated Fancy Sapphires () with Surface Diffusion-Treated Sapphires (T) Diffusion-treated and fancy sapphires heat with ryllium the new treatment (pastel colors and vivid colors) can be easily distinguished by both gemological properties (Lit. 14 and Lit. 15) and chemical composition as discussed below. For comparison purposes, we use a blue surface diffusion-treated sapphire. The randomly selected diffusion-treated sample (Fig. A53 and Table A16a) does not contain any ryllium, Ti-concentrations are concentrated at the outer rim, and other chemical elements do not follow Ti-enriched trends. Ti is introduced into the gemstone by diffusion from outside, and only one element is enriched in the rim (Ti concentrations are embedded in a chemistry typical of a natural sapphire, with considerable Fe present, as a natural white sapphire was used for the diffusion treatment). The blue color is interpreted as being produced by Fe2+-Ti 4+ pairs (For further discussions See Table A16a-A16c). Fig. A53 Two ryllium-treated orangy- sapphires and three surface diffusion-treated sapphires as seen in Oil immersion. ote the near-surface related blue coloration induced by Ti-diffusion and the more deep penetration of the coloratrion due to ryllium-treatment. Average Position Mg Ti V Cr Fe Ga Al 7 Center Average Std Dev norm 4 Rim Average Std Dev norm Table A16a T - xample: Surface Diffusion-treated Sapphire. Chemical composition (LA-ICP-MS in wt.-ppm) of a diffusion-treated sapphire (Fig. A53). The rim and the core of the sample were measured to show characteristics of a so-called surface diffusion-treated sapphire (T). ote: Increase of Ti only in the rim (with Fe from the sapphires composition) is responsible for the formation of color in these treated sapphires, while the other elements remain unchanged (Alumina Al fixed by normalisation to wt.-ppm).
.")
. Fig. A54 Sample o.grs 1291 atural orangy- sapphire heat-treated with ryllium.")
43 38 Averaged LA-ICP-MS Data of Representative ryllium-treated Fancy Sapphires Average Position Mg Ti V Cr Fe Ga Al 7 Center Average Std Dev norm 4 Rim Average Std Dev norm Table A16b ryllium-treated xample: atural Orangy-Pink Sapphire ("Padparadscha"). Origin: Chemical compositions (LA-ICP-MS in wt.-ppm) of a orangy- sapphire ( Padparadscha ) (Fig. A54) treated with ryllium with compositional differences in the outer rim and core. ote: Decrease of trace elements in the gemstones rim and the presence of ryllium (). Fig. A54 Sample o.grs 1291 atural orangy- sapphire heat-treated with ryllium. Craters from LA-ICP-MS testing (3 Profiles). Average Position Mg Ti V Cr Fe Ga Al 7 Center Average Std Dev norm 7 Rim Average Std Dev norm Table A16c ryllium-treated xample: atural Orange-Red Sapphire of Songea (Tanzania)Origin. Fig. A55 Sample o.grs 782 atural -red sapphire from Songea (Tanzania) heat-treated with ryllium. Craters from scattered LA-ICP-MS testing. Chemical composition (LA-ICP-MS in wt.-ppm) of -red sapphire from Songea (Tanzania) (Fig. A55) heat-treated with ryllium. ote: Presence of Cr, Ti and Fe within the gemstone, along with ryllium of approx 8wt.-ppm. The ryllium concentrations were found within the entire body of the gemstone, while Fe concentrations are concentrated towards the core - a trend followed by other elements (All are characteristically present in the natural equivalents, except ryllium).
44 39 Cathodoluminescence Analysis of ryllium-treated atural Orangy-Pink Sapphires ("Padparadscha") Cathodoluminescence (CL) Investigations and contributions to the interpretations were carried out by Prof. K. Ramseyer - karl.ramseyer@geo.unibe.ch - at the University of rne, Institute of Geological Sciences, rne (Switzerland) and Dr. J. Mullis, IMP, University of Basel (Switzerland) (See Lit. 19 and lit. 22). Visual and spectroscopic cathodoluminescence investigations were carried out to characterize the natural orangy- sapphires heat-treated ryllium. Methods atural ryllium-treated orangy- sapphires were prepared as 3 µm thick thin-section and coated with a semi-transparent Al film. An improved cathodoluminescence (CL) microscope (Lit. 25), with an energy of 25 kev, and a source current of 7 µa for photographic recording and 4 µa for spectrographic analyses, was used. The luminescence characteristics were recorded on ktachrome 4 color slide film and developed at 8 ASA. The CL spectra between 4 and 9nm (1nm resolution) was recorded from a 2 µm spot using a PTI model 1-1 monochromator equipped with a Hamamatsu R928 photomultiplier. The monochromator was linked to the CL microscope by a flexible optic fiber bundle. The CL spectra were not corrected for the spectral response of the instrument. Results CL CL clearly documents that the corundum crystal has a homogeneous red luminescing core and a slightly brighter luminescing outer zone of similar thickness (Fig. A58). tween the core and the outer zone, a transitional boundary exists with a lower luminescence intensity than the outer zone (Fig. A56 and Fig. A57). The red CL from both areas contains identical peaks, with peak positions indicative for Cr3+-induced luminescence (Fig. A57). LA-ICP-MS data confirms the presence of Cr but also Mg, Fe, Ti, and Ga are present (Fig. A56). As shown by LA-ICP-MS, a depletion of the elements Mg, Fe, Ti, Cr, and Ga is found in the outer zone of this sample and ryllium is enriched. The outer zone was formed after crystallization and reshaping of the crystal and thus represents the result of a treatment. The results of the CL investigation on two samples are shown in Fig. A58g and A58h. More confirmation is found that the trace element distribution is completely rearranged by the heat-treatment with rylllium. This was evident by extinction of chemical and structural patterns in the ryllium-treated outer rim of the fancy sapphires (Fig. A58h). As shown in Fig. A58g, an additional inner core was detected. This inner core is formed outside the zones enriched in ryllium Core 7 Outer Zone Core Frequency CL-Intensity Transitional Boundary Outer Zone Gray Scale : white 255: black Wavelength (nm) Fig. A56 Luminescence intensity distribution of Fig. A57. Fig. A57 Representative CL-spectra from the core (blue) and the outer transitional zone (red) of sample Fig. A56.
 microphotographs and projected chemical analysis (in wt.-ppm) as determined by LA-ICP-MS analysis (a-e) in an orangy- sapphire heat-treated with ryllium.")
 enriched in the outer zone. Fig. A58c Chromium (Cr) - concentrations (in wt.-ppm) depleted in the outer zone. 1mm Fig. A58d Titanium (Ti) - concentrations (in wt.")
. The ryllium treatment produces a zoning of chemical and/or structural defect contrasts showing an outer rim, inner rim and an inner core.")
45 4 Correlation of LA-ICP-MS and Cathodoluminescence Analysis of ryllium-treated atural Orangy-Pink Sapphires ( Padparadscha ) Fig. A58 Cathodoluminescence (CL) microphotographs and projected chemical analysis (in wt.-ppm) as determined by LA-ICP-MS analysis (a-e) in an orangy- sapphire heat-treated with ryllium.visual color zoning is concentrated in the transitional zone. Sample o.grs Fig. A58a Magnesium (Mg) - concentrations (in wt.-ppm) depleted in the outer zone. Fig. A58b ryllium () - concentrations (in wt.-ppm) enriched in the outer zone. Fig. A58c Chromium (Cr) - concentrations (in wt.-ppm) depleted in the outer zone. 1mm Fig. A58d Titanium (Ti) - concentrations (in wt.-ppm) depleted in the outer zone. Fig. A58e Gallium (Ga) - concentrations (in wt.-ppm) depleted in the rim. Fig. A58f Iron (Fe) - concentrations (in wt.-ppm) depleted in the rim. Fig. A58g Cathodoluminescence microphotograph of a ryllium-treated natural orangy- sapphire (by Prof. K. Ramseyer). The ryllium treatment produces a zoning of chemical and/or structural defect contrasts showing an outer rim, inner rim and an inner core. Craters from LA-ICP-MS (8 micrometers in diameter). Fig. A58h Cathodoluminescence microphotograph of a ryllium-treated natural orangy- sapphire (by Prof. K. Ramseyer). The picture shows the chemical and/or structural defect contrasts of the natural growth in the centre of a faceted gemstone (diagonal growth lines). The ryllium treatment resets this contrast in a rim perpendicular to the natural growth zones.
46 41 Conclusion: Part A Heat-Treatement with ryllium and the Formation of Color Centers Conclusion Part A Over the course of the traetment with ryllium, the following alterations were made to the original sapphire materials. 1.) ryllium is diffused into the surface of the gemstones, either restricted to the rim or penetrating the entire sapphire material (See Fig. A34, A37, A41b, A45, A47b, A5b, A49 and Table A16). 2.) Unstable color centers are formed in the zones containing ryllium. They are interpreted as crystal defects (Fig. A4, A5 and A26) not corresponding to fading color centers caused by irradiation (Lit. 16). 3.) The treatment is characterised by a reaction zone, with indications that the atomic structure of the sapphire is completely rearranged (See Cathodoluminescence analysis (Fig. A58)). 4.) The entire set of cations present in the original sapphire material (Fe, Cr, Ti, V, Ga and Mg) is redistributed in the reaction zone over the course of the treatment. In this case study, the cations are depleted in the rim and enriched in an inner rim (in the samples), See Fig. A33, A36, A41a and A49. In the Songea (Tanzania) samples, the entire crystal is involved and the trace elements are enriched at the core (Table A16c). These samples, however, may also show natural chemical zoning. 5.) The color is formed at a particular mix of trace elements, including Fe3+, Cr 3+, and with Mg 2+ and 2+ where crystal defects are present (Fig. A23, A24, A26, A27, A28). In this case study, ryllium concentrations (in wt.-ppm) are ten times lower (*) than the Mg-concentrations (Table A4) and thus their direct contribution to the color needs further research (Part B, this work and Lit 2). The color is also formed outside the zone containing ryllium (See Fig. A45) as well as inside. The presence of higher Ti concentrations hampered the formation of these color centers (Fig. A45). The nature of these color centers are interpreted as trapped-hole type (See Lit. 4 and Lit. 24)(**). Orangy- colors "Padparadscha" are formed in the presence of different color causes, such as Fe3+-pairs, Cr 3+, Trapped-hole color centers, and at Ti-concentrations below a critical level (Fig. A23, A24, A26, and A27). 6.) The concentrations of Mg and are directly correlated in the treated part of the gemstone. As increasing -concentrations correlate with decreasing Mg-concentrations (Fig. A42, A45 and A49), this suggests replaces Mg positions in the corundum lattice. Profile studies show that the diffusion of Mg towards the core occurred (e.g. Fig. A42 and Fig. A49), however other elements - such as Ti - also diffuse. Titanium-difusion is best seen when related to pre-existing whitish rutile dust bands (Fig. A45), or around Ti-oxide minerals (Fig. A61). A very distinct blue halo is formed (Fig. A61), interpreted as color from Fe2+-Ti 4+ pairs (Ti from diffusion and Fe from the sapphire s composition) (Fig. A45). The formation of color in the ryllium-treated sapphires depends on the chemical differences in the parent sapphire material, while the presence of Ti is found to be the most critical element in preventing the treatment s success (See Fig. A33 and A45). Color zoning is related to the reaction zone of the treatment and can be either confined to the rim or found within the gemstone, depending on the extent of the treatment and the gemstone s chemical composition (See Table A16b and A16c). The use of a high temperature is indicated by the surface melting of the sapphires (Fig. A13 and A14). Such treatment conditions - including diffusion of elements into the surface, change of oxidation state of Fe, and formation of color centers - can be achieved during heating at a very high temperature near the sapphire s melting point under oxidation conditions (See Lit. 4 and Lit ). Identification Test The identification of this material can be based on gemological tests, including the use of a microscope, particularly in differentiating against other diffusion-treated gemstones. Use of special methods - including the detection of ryllium - are extremely difficult and costly. It uses SIMS (Lit. 24), or LA-ICP-MS (this work)(***). These instruments are commonly unavailable for routine testing. In addition UV-xperiments can be of help (Table A1, Fig. A4 and Fig. A6). This test cannot be used to differentiate against irradiated gemstones or unheated gemstones, but can help to differentiate against other heated gemstones (group ). (*) If expressed in atomic-ppm (ppma), ryllium to Magnesium- ratios are much higher due to corrections by the atomic weight. (**) Lit appeared after the first version of this Report was published in 22 (Lit. 1) (***) Since 24, GRS developed a LASR based testing technology (UV-LIPS). The analysis produces an extremely small mark (not visibel to the naked eye) on the girdle with no damage to the gemstone. (See also Fig. A62)
")


. Fig.")

47 42 UV-LIPS ryllium-testing Fig. A61 Microphotographs of inclusions in natural -red sapphires from Songea (Tanzania) which have been heat-treated with ryllium. Round blue halos have been formed around opaque solid inclusions in course of the ryllium-treatment. ote: The blue halos around these inclusions are absent in samples unenhanced by heat, but are also been observed previously in other heat-treated corundun materials (J. Koivula, personal comunication). Fig. A62 UV-LIPS at GRS (LIPS = Laser Induced Plasma Spectroscopy) provided non-destructive analyses of ryllium in corundum since 24. A similar method has been developped elsewhere, but with major differences in the detection of the ryllium-signal as well as in the type of Laser used (Compare with Lit 27). More details on the GRS method will be provided in due course.
, Detlef Günther(**) and Anne-Liese Graber (**) (Reprinted with corrections from Contributions to Gemology, o.")

48 ryllium-treatment Part B The ryllium-treatment of Fancy Sapphires with a ew Heat-Treatment Technique (Part B). by Adolf Peretti (*), Detlef Günther(**) and Anne-Liese Graber (**) (Reprinted with corrections from Contributions to Gemology, o.2, 23) (*) GRS Gemresearch Swisslab LTD, Switzerland (**) Institute of Chemistry, Swiss Federal Institute of Technology, Zurich, Switzerland. Introduction The new heat treatment of corundum is a technique that involves extremely high temperatures, oxidation conditions and diffusion of ryllium into the corundum's surface (Lit 1, Lit 2 and Lit.23 to 33). Part A of this study (Lit 1) concentrated on the interaction of ryllium with the parent chemistry of natural fancy sapphires and other gemological aspects. It was noticed that only very minor concentrations of ryllium were present in the treated sapphires. This data was confirmed later (Lit 23). As mentioned earlier, the understanding of the direct contribution of ryllium to the color of these treated natural sapphires needed additional research (see Lit 1 page 39). As pointed out in a recently published article on this new treatment (Lit 24), the understanding of the new treatment needs more precise data on various trace elements that are not yet available in world literature. In part B of the characterization of the new treatment, we provide extended chemical analyses of natural and synthetic materials, including sapphires, and test the models proposed elsewhere (Lit 24). Further studies appeared after Part B of our study (Lit. 2) was published (Lit ) Fig. B1 atural Pink sapphires and brownish sapphires were also subjected to the new ryllium-treatment. ote: Color change from to orangy- due to the treatment. Materials and Methods The studied materials include synthetic materials from various manufacturers. Colorless synthetic sapphires were from watch glass producers in Switzerland, synthetic, and yellow Verneuil sapphires were obtained from Djevahirdijan SA (Monthey, Switzerland), and synthetic hydrothermal rubies were from ovosibirk (Russia). Further natural samples are listed in Tab. A6 and additional samples of rubies and blue sapphires were collected in the market in Bangkok (see Tab. B2 and B3). The synthetic samples included rough, as well as faceted materials. They were cut in half. One piece was kept untreated for reference ("reference samples"), and one half piece sent for commercial ryllium-treatment with the new method to a specialized commercial factory in Chantaburi 43 (Thailand). The heating experiments were reportedly carried out at very high temperature near the melting point of corundum under high oxidation conditions, including ryllium diffusion. Details of the method remain the intellectual property of the factory. After the ryllium-treated samples came back from Chantaburi, untreated and treated samples were compared and color changes investigated (Fig. B1, B26). The treated samples were cut in half for further chemical and spectroscopic analyses (e.g. Fig. B5). Further samples of natural blue sapphires, fancy sapphires and rubies have also been ryllium-treated by the same factory as well as by another factory in Bangkok. For comparison, additional natural sapphires were investigated which were heated by conventional methods (Tab. B3).
. These inclusion patterns can not be found in the synthetic counterparts.")
 GRS 1 (from GRS 2) light brown,")
 GRS 1 light (*) K, Cr, Si GRS 11 (from GRS 1) GRS 17 Ti, Mg, Si, Cr GRS 18 (from GRS 17) GRS 19 yellow Mg, Si, i GRS 2 (from GRS 19) GRS 25 purplish")
49 44 Inclusions in ryllium-treated atural Corundum Fig. B2 Fig. B3 Fig. B4 Fig. B2-4 Microphotograph of inclusions in ryllium-treated natural sapphires. Melted inclusions with feathers characteristic for high temperature treatment (See also Lit. 24). These inclusion patterns can not be found in the synthetic counterparts. Magnification in the microscope 6x-8x. Fibre optic illumination. Pictures by John de Jaegher. Copyright GRS. Synthetic Corundum Synthetic Ruby fore - Treatment After -Treatment Color Sample Color Doped by Sample Color Doped by Change GRS 2 colorless a, Mg, K, (Si, Fe, Ti, Cu) GRS 1 (from GRS 2) light brown, a, K, (Si, Fe, Ti) (x) GRS 12 light Mg, Ca, Cr, Si (Fe, a, Ti) GRS 13 (from GRS 12) orangy-**, a, Mg, Ca, Cr (x) GRS 4 a, Cr (Mg, Si) GRS 5 (from GRS 4) GRS 8 vivid a, Cr (Fe) GRS 9 (from GRS 8) GRS 15 vivid Mg, Si, Ti, Cr, Fe GRS 16 (from GRS 15) GRS 1 light (*) K, Cr, Si GRS 11 (from GRS 1) GRS 17 Ti, Mg, Si, Cr GRS 18 (from GRS 17) GRS 19 yellow Mg, Si, i GRS 2 (from GRS 19) GRS 25 purplish ish red a, Ti, Cr, Fe, i GRS 26 (from GRS 25) GRS 27 red Mg,Ti, Si, Cr, Fe, i GRS 28 (from GRS 27) vivid yellow -red, Cr (Mg, Si), Cr (Si), a, Mg, Si, K, Ti, Cr, Cr, Zr, Ti, Mg, Si, Cr, Mg, Si, i, Ti, Si, Cr, Fe, i, Mg, Si, Ti, Cr, Fe, i x x x (x) x x GRS 29 dark red a, Mg, Si, K, Ti, Cr, Fe, i GRS 3 dark orangy-red (from GRS 29) (*) color change from to ish- induced by irradiation treatment, Mg, Si, Ti, Cr, Fe, i x Table B1: Synthetic Rubies and Synthetic Colored Sapphires before and after treatment with ryllium. Dominant trace elements are in bold. ote: Only Cr-rich samples were reacting to the ryllium-treatment. = ryllium, a = Sodium, Mg = Magnesium, Si = Silica, K= Potassium, Ti = Titanium, Cr = Chromium, Fe = Iron, i = ickel.
 and ryllium-treatment synthetic sapphires.")
50 45 ryllium-treatment of Synthetic Pink Sapphires Absorbance - > Wavelength - > Fig. B5 Polarized UV-VIS-IR absorption spectra of synthetic sapphires (reference sample) and ryllium-treatment synthetic sapphires. Inserted picture shows the untreated reference () and ryllium-treated samples () (including fluorescent lines produced by multi-channel spectroscopic measurements). Spectra are recorded in the same crystallographic direction. There is a shift in absorption due to a different sampling volume. Increase in absorption towards the blue region of the spectrum is interpreted as ryllium ()-Chromium (Cr)-color centers superimposed to Cr 3+ (See also discussion in Lit. 24). LA-ICP-MS chemical analyses The LA-ICP-MS measurements were carried out by the Laboratory of Inorganic Chemistry at the Swiss Federal Institute of Technology, Honggerberg Zurich). The details on the methods, data calculation, normalization procedures and error margins see Page An additional set of more than 4 samples has been analyzed including various categories of synthetic, unheated, conventional heated, as well as ryllium treated samples (see Tab. B1, B2 and B3). Due to detailed series of spots in various profiles on the samples, a total of approx. 1 chemical data points were collected. ach spot was analyzed for 4 elements. The data shown in Tab. B2 and B3. ryllium-treated Synthetic Pink and other Synthetic Colored Sapphires The results of ryllium-treated Synthetic Sapphires are shown in Fig. B6 to B25 and in Tab. B1, B2 and Fig. B47a. The group of synthetic Pink Sapphires can be suivided into two different categories depending on the reaction to the ryllium-treatment. One group of synthetic sapphires did not color-change after ryllium-treatment. The non color-changing category includes synthetic and yellow sapphires that contain various elements including a, Mg, i, Sn and Zr (see Tab. B1 and B2). The second group of color-changing samples include synthetic sapphires that became more with ryllium-treatment (Tab. B1 and B2). These samples were dominated by traces of chromium (Cr). Another sample which was doped by Cr and Mg was only partially color-changed. All the ryllium-treated samples contain traces of ryllium, with enriched concentrations at the rim (e.g. Fig. B12). Increasing Cr and ryllium-concentrations are correlated with increasing intensity in color. Trace element concentrations of many of the elements were heterogeneous (Fig. B8, B12, B16, B22, B19, B25): This is interpreted as chemical zoning in the stones, which is not uncommon in the synthetic Verneuil corundum materials. ryllium-treated Hydrothermal Synthetic Rubies (TAIRUS, ovosibirsk) After ryllium-treatment, synthetic rubies changed to more or less dark colors (Tab. B1). The results of the chemical analyses are shown in Fig. B26 to B45). This color change can be correlated with increasing -concentrations, independently of the concentrations of Fe (Fig. B47b). A series of other trace elements are present in these synthetic hydrothermal rubies, including Mg, Ti, Si, Cr, Mn, Fe, i and minor Sn. They did not prevent the treatment success (Fig. B29. B33, B37, B4 and B46). ryllium-treated Synthetic Colorless Sapphire White corundum (without Cr-concentrations) slightly color-changed to light brown after the ryllium-treatment. Additional traces of ryllium were detected in the samples (Table B2)
 Fig. B1 Microphotograph of GRS 9 (synthetic sapphire) Fig. B11 Drawing of GRS 9.")

51 46 ryllium-treatment of Synthetic Corundum fore ryllium-treatment After ryllium-treatment Fig. B6 Microphotograph of GRS 8 (Synthetic light sapphire) Fig. B7 Drawing of GRS 8. Analysis was performed with 61 spots along the broken line (crater diameter : 8 µm) Fig. B1 Microphotograph of GRS 9 (synthetic sapphire) Fig. B11 Drawing of GRS 9. Analysis was performed with 12 spots along the broken line (crater diameter : 8 µm) Mg, Ti, Cr and Fe concentrations in GRS 8, Ti and Cr concentrations in GRS Cr (wt.-pp Mg, Ti, Fe (wt.-pp Cr Mg Ti Fe Cr (wt.-pp , Ti (wt.-pp Cr Ti Pit Pit Fig. B8 The chemical variations in a profile across a synthetic sapphire (GRS 8) are shown (in wt.-ppm). Complete data see Tab. B2 Fig. B12 The chemical variations in a profile across a ryllium-treated synthetic sapphire (GRS 9) are shown (in wt.-ppm). Untreated reference sample is GRS 8). For complete data, see Tab. B Absorbance - > Absorbance - > Wavelength - > Wavelength - > Fig. B9 Polarized UV-VIS-IR absorption spectra of synthetic sapphires (GRS 8) parallel and perpendicular to the c-axis. Absorption characteristics (including fluorescent lines produced by multi-channel spectroscopic measurements) due to Cr 3+. Fig. B13 Polarized UV-VIS-IR absorption spectra of ryllium-treated synthetic sapphires parallel and perpendicular to the c-axis. Absorption characteristics (including fluorescent lines produced by multi-channel spectroscopic measurements) due to Cr 3+ and Cr- color centers. The untreated reference sample is GRS 8.
 Fig. B2 Microphotograph of GRS 13 (synthetic sapphire) Fig. B21 Drawing of GRS 13.")

 are shown (in wt.-ppm). The untreated corresponding sample is GRS 12. complete data see Tab. B2. Fig.")
52 47 ryllium-treatment of Synthetic Pink and Orange Sapphire fore ryllium-treatment After ryllium-treatment Fig. B14 Microphotograph of GRS 12 (synthetic sapphire) Fig. B 15 Drawing of GRS 12. Analysis was performed with 4 spots along the broken line (crater diameter: 8 µm) Fig. B2 Microphotograph of GRS 13 (synthetic sapphire) Fig. B21 Drawing of GRS 13. Analysis was performed with 33 spots along the broken line (crater diameter: 8 µm) Mg, Ti, Cr, Si and Zr concentrations in GRS 12, Ti, Si and Cr concentrations in GRS Mg, Si (wt.-pp Cr, Ti, Zr (wt.-pp Mg Si Ti Cr Zr Cr, Si (wt.-pp , Ti (wt.-pp Cr Si Ti Pit Fig. B16 The chemical variations in a profile across a synthetic sapphire are shown (in wt.-ppm). Complete data see Tab. B Pit Fig. B22 The chemical variations in a profile across a ryllium-treated synthetic - sapphire (GRS 13) are shown (in wt.-ppm). The untreated corresponding sample is GRS 12. complete data see Tab. B2. Fig. B17 Microphotograph of GRS 17 (synthetic deep sapphire) Fig. B18 Drawing of GRS 17. Analysis was performed with 8 spots along the broken line (crater diameter: 8 µm) Fig. B23 Microphotograph of GRS 18 (synthetic deep sapphire) Fig. B24 Drawing of GRS 18. Analysis was performed with 35 spots along the broken line (crater diameter: 8 µm) Mg, Ti, Si, Cr, Ga and Zn concentrations in GRS 17, Ti, Si, Cr and Mo concentrations in GRS Cr,Si,Ti (wt.-ppm) Mg, Ga, Sn (wt.-ppm) Ti Cr Si Mg Ga Sn Cr, Mo, Si (wt.-ppm) , Ti (wt.-ppm) Cr Mo Si Ti Pit Fig. B19 The chemical variations in a profile across a synthetic deep sapphire (GRS 17) are shown (in wt.-ppm). Complete data see Tab. B Pit Fig. B25 The chemical variations in a profile across a ryllium-treated synthetic deep sapphire (GRS 18) (in wt.-ppm). Corresponding untreated sample is GRS 17. For complete data, see Tab. B2
 and ryllium-treated synthetic deep sapphires (including fluorescent lines produced by multi-channel")
53 48 ryllium-treatment of Synthetic Rubies Absorbance - > Wavelength - > Fig. B26 Polarized UV-VIS-IR absorption spectra of synthetic hydrothermal rubies (reference sample) and ryllium-treated synthetic deep sapphires (including fluorescent lines produced by multi-channel spectroscopic measurements). Inserted picture shows the untreated reference (red) and ryllium-treated samples (). Spectra are recorded in the same crystallographic direction. A shift in absorption is due to a different sampling volume. Increase in absorption towards the blue region of the spectrum is interpreted as color centers involving ryllium and other trace elements superimposed to Cr 3+ -absorptions (see Lit. 24). Chemical Identification Charts for ryllium-treated Corundum For further interpretation of the data, we selected 66 spot analyses from our data bank, which included various samples unheated, enhanced and ryllium-treated sapphires. A further selection was made for the group of ryllium-treated samples, from which we did not take into account the data that were obtained from measurements at or near the surface. In such a way, we eliminated contamination resulting from the treatment experiments which were found at the surface of the samples (high, Mg, Cr, Fe, Zr). The data were transformed from wt.-ppm to ppma (a = atomic) and are graphically presented in Fig. B47 and B48. UV-VIS-IR Spectroscopic Origin of Color Analyses Polarized spectra were measured on synthetic corundum, both for untreated and for ryllium- Treated samples. The results are shown in Figs. B5, B9, B13, B26, B3 and B34. In comparison to the untreated reference samples, it was found that the absorption curves increased towards the blue region of the spectrum. These broad bands in the UV region of the spectrum can be interpreted as proof of the presence of color centers involving ryllium and other elements (See Lit. 24). ryllium-treated atural Rubies and Sapphires The measured samples of natural rubies and sapphires are listed in Tab B3 and shown in Fig. B47c and Fig. B48. Reviewing the data of Tab. B3, it is evident that concentrations of Silica (Si) were found in all samples. Comparing the values with those in Literature (Lit. 24), it was found that much higher Si concentrations were measured in our investigation. They are approx 1 to 2 times higher than the values published (Lit. 24) on similar samples. The distribution of Si in the samples, however, was found to be heterogeneous, e.g. areas that had Si below the detection limit were found in a distance of 5 to 1 microns next to areas of significant Si concentrations. Only minor concentrations of Sn, i, Mn, Ca and Li were occasionally also detected in addition to the elements Mg, Ti, V, Cr, and Fe, both in samples before and after ryllium-treatment (Tab. B3). ryllium was found in all ryllium-treated samples. The concentration of ryllium increased towards the rim as previously reported (See Lit. 1).
 Fig. B32 Drawing of GRS 26.")
54 49 ryllium-treatment of Synthetic Rubies fore ryllium-treatment After ryllium-treatment Fig. B27 Microphotograph of GRS 25 (synthetic ruby) Fig. B28 Drawing of GRS 25. Analysis was performed with 18 spots along the broken line. (Crater diameter: 8 µm Fig. B31 Microphotograph of GRS 26 (synthetic -red sapphire) Fig. B32 Drawing of GRS 26. Analysis was performed with 16 spots along the broken line (crater diameter: 8 µm) Chemical variations in GRS 25 Chemical variations in GRS wt.-p 1 1 Mg Ti Cr Mn Fe i Si Cr, Fe, Si (wt.-pp , Mg, Ti, V, i (wt.-pp Cr Fe Si Mg Ti V i Pit Pit Fig. B29 The chemical variations in a profile across a synthetic hydrothermal ruby are shown (in wt.-ppm). Sample o. GRS 25. complete data see Tab. B2. Fig. B33 The chemical variations in a profile across a ryllium-treated synthetic -red sapphire are shown (in wt.-ppm). Sample o. GRS 26 (untreated reference sample is GRS 25). Silica concentrations out of scale Absorbance - > Absorbance - > Wavelength - > Wavelength - > Fig. B3 Polarized UV-VIS-IR absorption spectra of a synthetic hydrothermal ruby in a direction parallel and perpendicular to the c-axis. Absorption characteristics (inclusive fluorescence lines) due to Cr 3+ (including fluorescent lines produced by multi-channel spectroscopic measurements). Fig. B34 Polarized UV-VIS-IR absorption spectra of a ryllium-treated synthetic -red sapphire (GRS 26) in a direction parallel and perpendicular to the c-axis. Absorption characteristics (including fluorescent lines produced by multi-channel spectroscopic measurements) due to Cr 3+ and color centers involving ryllium and other trace elements (General increase in absorption in the blue region of the spectrum). Untreated reference sample is GRS 25.
 2 45 Fig. B41 Microphotograph of GRS 28 (synthetic sapphire, ryllium-treated sample GRS 27) Fig.")
 Side 1: 23 pits; Side 2: 15 pits Chemical variations in GRS 27 Chemical variations in GRS 28 18 35 18 4 16 3 16 35 14 Cr, Fe,")
 are shown (in wt.-ppm). Complete data see Tab. B2. 2 4 6 8 1 12 14 Pit Fig.")
 Fig. B39 Drawing of GRS 29. Analysis was performed with 21 spots along the broken line (crater diameter: 8 µm) Fig.")
55 5 ryllium-treatment of Synthetic Rubies fore ryllium-treatment After ryllium-treatment Fig. B35 Microphotograph of GRS 27 (synthetic ruby) Fig. B36 Drawing of GRS 27. Analysis was performed with 16 spots along the broken line (crater diameter: 8 µm) 2 45 Fig. B41 Microphotograph of GRS 28 (synthetic sapphire, ryllium-treated sample GRS 27) Fig. B42 Drawing of GRS 28. Analysis was performed along the two broken lines (crater diameter: 8 µm) Side 1: 23 pits; Side 2: 15 pits Chemical variations in GRS 27 Chemical variations in GRS Cr, Fe, Si (wt.-ppm) Mg, Ti, i (wt.-ppm) Cr Fe Si Mg Ti i, Cr, Fe, Si (wt.-pp Mg, Ti, i, Sn (wt.-pp Cr Fe Sn Si Mg Ti i Pit Fig. B37 The chemical variations in a profile across a synthetic hydrothermal ruby (GRS 27) are shown (in wt.-ppm). Complete data see Tab. B Pit Fig. B43 The chemical variations in a profile across a ryllium-treated synthetic sapphire (GRS 28) are shown (in wt.-ppm). Untreated reference sample is GRS 27. complete data see Tab. B2. Fig. B38 Microphotograph of GRS 29 (synthetic ruby) Fig. B39 Drawing of GRS 29. Analysis was performed with 21 spots along the broken line (crater diameter: 8 µm) Fig. B44 Microphotograph of GRS 3 (synthetic sapphire, ryllium-treated sample GRS 29) Fig. B45 Drawing of GRS 3. Analysis was performed with 2 spots along the broken line (crater diameter: 8 µm) 3 Chemical variations in GRS 29 Chemical variations in GRS Cr, Fe, Si (wt.-ppm) B, Mg, Ti, Mn, i (wt.-ppm) Cr Fe Si B Mg Ti Mn i Cr, Fe, Si (wt.-ppm) , Mg, Ti, i, b (wt.-ppm) Cr Fe Si Mg Ti i b Pit Fig. B4 The chemical variations in a profile across a synthetic hydrothermal ruby (GRS 29) are shown (in wt.-ppm). Complete data see Tab. B Pit Fig. B46 The chemical variations in a profile across a ryllium-treated synthetic sapphire (GRS 3) are shown (in wt.-ppm). Untreated reference sample is GRS 29. complete data see Tab. B2.
56 Triangular Identification Charts for ryllium-treated atural and Synthetic Corundum Fe Fe Fig. B47a Fig. B47b *5 Ti/Fe Cr *2 Fe*2 Cr Fig. B47c Fig. B47d Mg Cr /Mg Cr*1 Legend 1. atural Padparadscha () 2. atural Violet Sapphire () 3. atural Purple Sapphire () 4. atural Purple to Violet Sapphire () 5. atural Yellow Sapphire () 6. atural Orange Sapphire () 7. atural Padparadscha () 8. atural Pink Sapphire () 9. atural Colorless Sapphire (ryllium-treated) 1. atural White Sapphire (ryllium-treated) 11. atural Yellow Sapphire (ryllium-treated) 12. atural Orange Sapphire (ryllium-treated) 13. atural Padparadscha Pinkish- (ryllium-treated) 14. atural Padparadscha (ryllium-treated) 15. atural Padparadscha (Orangy-) (ryllium-treated) 16. atural Orangy-red Sapphire (ryllium-treated) 17. atural Sapphire (ryllium-treated) 18. Synthetic hydrothermal Ruby GRS Synthetic hydrothermal Ruby GRS Synthetic hydrothermal Ruby GRS Synthetic hydrothermal Ruby (ryllium-treated) GRS Synthetic hydrothermal Ruby (ryllium-treated) GRS Synthetic hydrothermal Ruby (ryllium-treated) GRS Light cream Colorless Synthetic Sapphire (ryllium-treated) 25. Synthetic Pink Sapphire 26. Synthetic Orangy-Pink Sapphire (ryllium-treated) Fig. B47 Chemical comparison of ryllium-treated and untreated samples (see Legend below). Tab. B2 and B3 (non-averaged complete data set used, see text). Fig. B47a ryllium-treatment produces in synthetic sapphires caused by an increase in ryllium () in presence of Chromium (Cr). Fig. B47b ryllium-treatment of synthetic rubies shifts the color to, due to an increase in ryllium in presence of Cr, independent of Iron (Fe)-concentrations. Fig. B47c ryllium-treatment of natural fancy sapphires produces with increasing (Mg+)-concentration at variable Ti/Fe-ratios and variable Cr-concentrations (Mg = Magnesium, Ti = Titanium) Fig. B47d Padparadscha color is produced at variable /Mg-concentrations with increasing concentrations of Cr 51
57 52 Conclusion Part B Origin of Color in ryllium-treated atural and Synthetic Corundum Fig. B48a Si + Ti Ti Fig. B48b Fig. B48 Chemical composition of Si, Ti, and Mg in natural corundum heat-treated with conventional methods, and with ryllium-treatment. The additional color is formed in the field of Ti/( + Mg) <1 (Fig. B48b and Legend) and not in the field (Ti + Si)/( + Mg) <1. See Lit 24 for further discussion on Si in corundum. Symbols, see Legend below. Ratios are calculated from ppma values. Legend Orange Sapphire, Conventional heating Orange Sapphire, Conventional heating Padparadscha, Conventional heating Slightly orangy- Sapphire, ew Treatment Padparadscha, ew Treatment Padparadscha, ew Treatment (zoned) Padparadscha, ew Treatment (zoned) Ruby, vivid red, ew Treatment atural Sapphire, blue Conventional heating atural Sapphire, dark blue Conventional heating atural Sapphire, dark blue Conventional heating atural Sapphire, vivid blue ew Treatment atural Sapphire, deep blue ew Treatment (Si + Ti) / ( + Mg) > 1 (Si + Ti) / ( + Mg) < Mg Ti / ( + Mg) > Mg Ti / ( + Mg) < 1 2 GRS 35 S1 GRS 35 S2 Rosa 3.59 GRS 33 GRS S2 Rot S1 5.19ct S Conclusion Part B The new ryllium-treatment is characterized by the formation of an additional yellow to color in Corundum. Chemical and spectroscopic measurements show that the color change can be explained by color centers involving various trace elements including ryllium (See also page 41). From detailed LA-ICP-MS chemical analyses, it is evident that a large variety of trace elements are present in the ryllium-treated Synthetic samples (Fig. B12, B22, B25, B33, B43 and B46). As shown by our experiments with synthetic sapphires, Cr and alone, at the absence of other trace elements, are sufficient for the formation of color centers. From the ryllium-treatment of synthetic materials, it is concluded that corundum without Ti and Cr is not changing the color. Other trace element combinations without the presence of Ti, Mg and can also form yellow to coloration (e.g. i see Tab. B1). Synthetic materials, lacking V but with Cr, Ti, Mg, Fe did color change after treatment with ryllium. This indicates that V does not have to be present for a color change. In more chemically complex natural corundum, increasing relatively lower Ti-concentrations in the presence of other trace elements (such as ryllium) are favorable for the formation of the color. Special attention, however, needs to be paid to the additional presence of detectable concentrations of Si in the treated samples. A model for the explanation of the formation of color centers was proposed elsewhere (Lit 24) based on the (Ti+Si/Mg+)-ratio. As shown by our investigation (Fig. B48a and Fig.B48b), a better correlation is found using the Ti/(Mg+)-ratio, without taking into account the Si concentrations. The color is formed by the new ryllium-treatment in samples with Ti/(Mg+)<1 (Fig. B48b). From the distribution of Si in our samples, it seems that Si is hetrogeneously distributed in the ryllium-treated corundum and may not take part in the reaction with ryllium. For other trace elements that can theoretically be important to the origin of color in corundum, we found that the concentrations of Co, Cu, Zr, Ba and Pb were present at, or below, the detection limits. Therefore, their role in the treatment is limited as well as unlikely (Tab. B3). Other areas of additional research are necessary to understand the complex re-crystallization process that occurs in connection with this new treatment. Furthermore, it seems to us that modern multi-element cluster analyses (See Lit 21) are preferred for the final underrstanding of the new treatment with ryllium.
).")
58 53 Part C: xplanation Inclusion Images Identification of ryllium-treatment by Inclusion Analyses In Part A of our study we elaborated on the melting of zircon and transformation into Zr-Oxide and glass using Scanning lectron Microscope analyses. This melting of minerals other than corundum has been related to the high temperature used for ryllium-treatment (Lit. 1 (Fig. A15, A16, A17)). This findings have been recently confirmed (Lit. 24) on studies on zircons included in sapphires, where they found that the Zr-Oxides can be identified as badelleyite. This mineral melting phenomena has become a help in identifying this new treatment (see Fig. B2, B3, B4, C8 - C17). Further valid identification criteria in to -red sapphires from Songea (Tanzania) turned out to be the blue halos around mineral inclusions (Fig. A61, C11). The very recent appearence of gem quality ryllium-treated Blue Sapphires provided a completely new set of inclusion features (Fig. C18 - C22). xplanation Inclusion Images Abundant zircon inclusions in a violetish-blue sapphire from. o decompositions and no discoid cracks were detected around the inclusions. This is a good indication that the sapphire are unheated. Heat-treatment at low temperatures may still have been applied (which was not the case in this sample). Inclusion may best be seen at magnifications of 2 to 12times in transmitted light in combination with fibre optic illumination from various directions. See Figure C1 Rutile inclusions in an unheated ish-red sapphire from. In ryllium-treated corundum, no unaltered rutile inclusions have been observed yet. Fibre optic illumination between 3-6x in the microscope. See Figure C2, C7 Abundant zircon inclusions in a sapphire from. The unresorbed zircons and lack of newly formed discoid cracks or feathers around these inclusions is a good indication that no heat-enhancement was applied. Additional attention may be placed on the analyses of fluid feathers and other inclusions than zircon to collect further microscopical indications. st observed in transmitted or fibre optic illumination. 2-6x magnification. See Figure C3 SM-DS chemical analysis of a surface reaching zircon crystal (See presence of elements Zr and Si), which was found in an unheated natural sapphire from. See Figure C4

.")
59 54 Part C: xplanation Inclusion Images Orange crystal inclusions in an unheated sapphire from. o signs of melting or decomposition were found. This is indicative that no heat-treatment and no ryllium-treatment was applied. Magnification 6x in the microscope. Combination of transmitted and fibre optic illumination. See Figure C5 Zircon crystal clusters with a discoidl tension crack was found in a sapphire from which has been heat-treated without the use of ryllium. See Figure C6 Melted zircon inclusions surrounded by "discoid feathers" were found in various natural fancy sapphires from which had been treated with ryllium at high temperatures (see also Lit. 24). These features may also be present in other high-temperature heated corundum which have not been subjected to ryllium-diffusion.transmitted and fiber optic illumination at 4-6x magnification in the microscope. See Figure C8, C9, C1 C12-C17 Opaque inclusions in the center of a blue halo was found in this ryllium-treated natural yellow sapphire. Combined transmitted and fibre optic illumination. Magnification 12x. See Figure C9 Opaque inclusions associated with blue halos in -red ryllium-treated sapphire form Songea (Tanzania). Combined transmitted and fibre optic illumination. These features can be seen at various magnifications depending on their size, such as 3-6x. See Figure C11 Incrusted twinning planes with angular and triangular dense clouds of sub-microscopic whitish particles were found in ryllium-treated blue sapphires (origin of sapphires either from Madascar and Sri Lanka). Magnification 39-5x in the microscope. Fibre optic illumination. See Figure C19 Circular, curved and white lines associated to former zones of silk. Magnification 5-1x in the microscope. Fibre optic illumination. This inclusion have sofar only been detected in ryllium-treated blue sapphires. See Figure C18,C2, C21, C22

60 55 Inclusions in atural Unheated Sapphires and Pink Sapphires from Fig. C1 Fig. C2


61 56 Inclusions in atural Unheated and Heated Pink Sapphires from Fig. C3 Fig. C4 Fig. C5 Fig. C6 Fig. C7
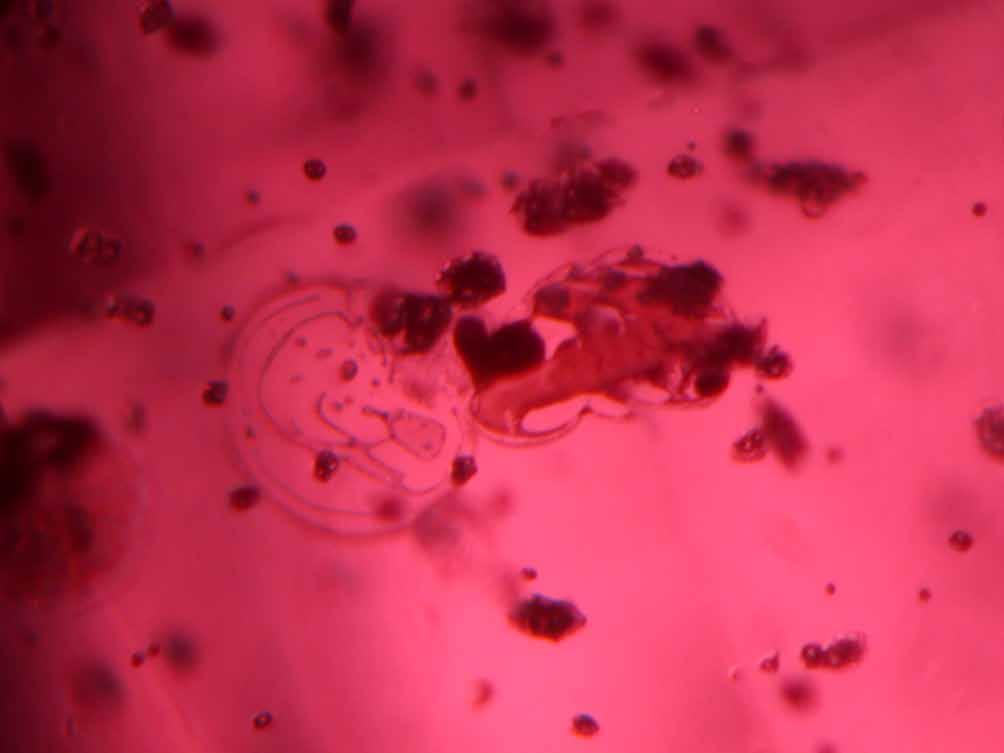
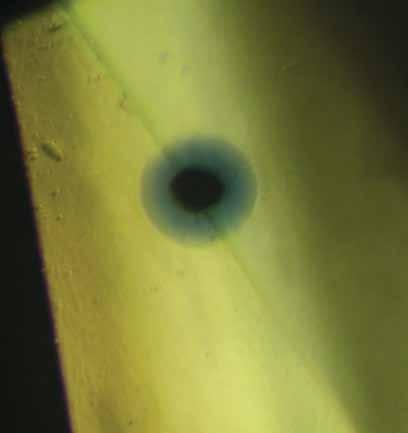
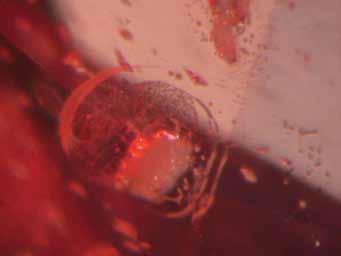
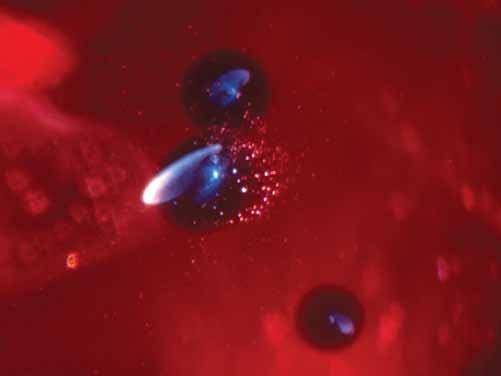
62 57 Inclusions in ryllium-treated Corundum Fig. C8 Fig. C9 Fig. C1 Fig. C11
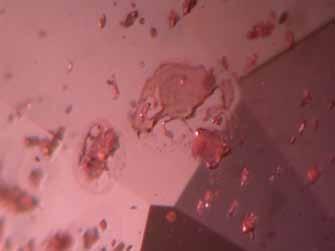
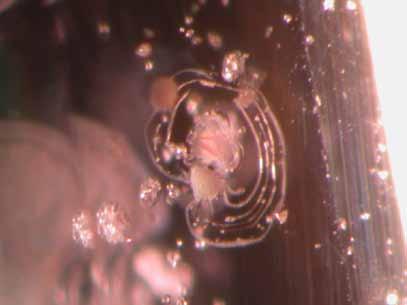
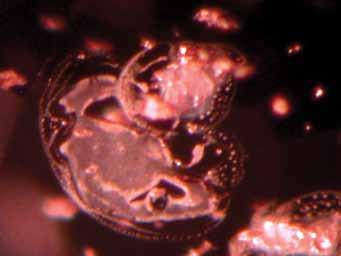
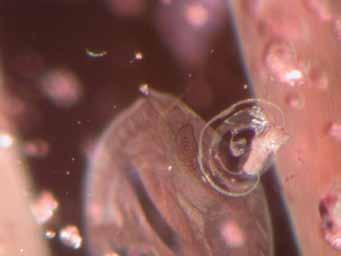
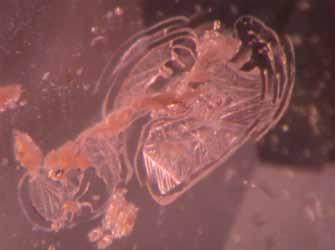
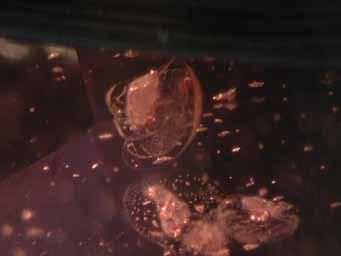
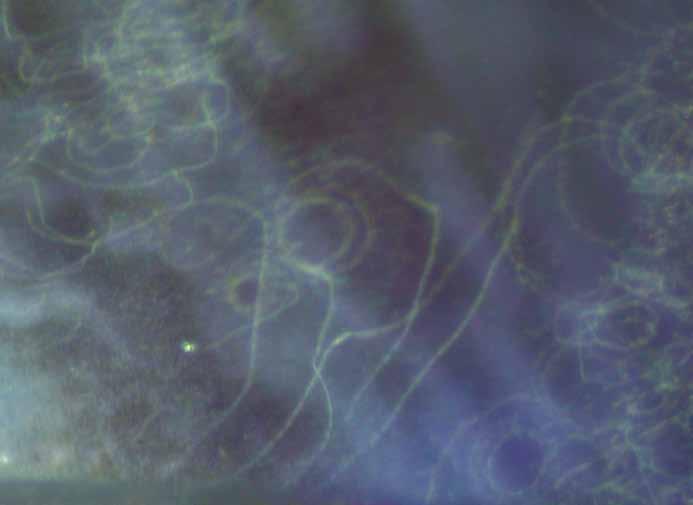
63 58 Inclusions in ryllium-treated Corundum Fig. C12 Fig. C13 Fig. C14 Fig. C15 Fig. C16 Fig. C17 Fig. C18


64 59 Inclusions in ryllium-treated Blue Sapphires Fig. C19 Fig. C2


65 6 Inclusions in ryllium-treated Blue Sapphires Fig. C21 Fig. C22
A New Technique for the Analysis of Corundum Using Laser Ablation ICP-MS Application
 A New Technique for the Analysis of Corundum Using Laser Ablation ICP-MS Application Gemology Author Ahmadjan Abduriyim, Hiroshi Kitawaki, Junko Shida, FGA, CGJ Gemological Association of All Japan Tokyo,
Selected Answer: a. an optical phenomenon resulting in 6 or 12 pointed star reflectance, caused by inclusion of rutile needles
 Question 1 1 out of 1 points Asterism in corundum is: a. an optical phenomenon resulting in 6 or 12 pointed star reflectance, caused by inclusion of rutile needles Question 2 1 out of 1 points The value
Advancing EDS Analysis in the SEM Quantitative XRF. International Microscopy Congress, September 5 th, Outline
 Advancing EDS Analysis in the SEM with in-situ Quantitative XRF Brian J. Cross (1) & Kenny C. Witherspoon (2) 1) CrossRoads Scientific, El Granada, CA 94018, USA 2) ixrf Systems, Inc., Houston, TX 77059,
Spectroscopy of Ruby Fluorescence Physics Advanced Physics Lab - Summer 2018 Don Heiman, Northeastern University, 1/12/2018
 1 Spectroscopy of Ruby Fluorescence Physics 3600 - Advanced Physics Lab - Summer 2018 Don Heiman, Northeastern University, 1/12/2018 I. INTRODUCTION The laser was invented in May 1960 by Theodor Maiman.
Georgia O'Keeffe. THE Alfred Stieglitz COLLECTION OBJECT RESEARCH Palladium print Alfred Stieglitz Collection. AIC accession number: 1949.
 Alfred Stieglitz (American, 1864 1946) Georgia O'Keeffe 1918 Palladium print Alfred Stieglitz Collection AIC accession number: 1949.745A Stieglitz Estate number: OK 19E Inscriptions: Unmarked recto; inscribed
WIDE ANGLE GEOMETRY EDXRF SPECTROMETERS WITH SECONDARY TARGET AND DIRECT EXCITATION MODES
 Copyright(C)JCPDS-International Centre for Diffraction Data 2000, Advances in X-ray Analysis, Vol.42 11 Copyright(C)JCPDS-International Centre for Diffraction Data 2000, Advances in X-ray Analysis, Vol.42
FLUORESCENCE CAGE : VISUAL IDENTIFICATION OF HPHT-TREATED TYPE I DIAMONDS
 NOTES & NEW TECHNIQUES FLUORESCENCE CAGE : VISUAL IDENTIFICATION OF HPHT-TREATED TYPE I DIAMONDS Inga A. Dobrinets and Alexander M. Zaitsev T HPHT-treated type I diamonds of various colors may exhibit
CHAPTER-V SUMMARY AND CONCLUSIONS
 CHAPTER-V SUMMARY AND CONCLUSIONS SUMMARY AND CONCLUSIONS The present work has been devoted to the differentiation and characterization of inkjet printed documents. All the four primary inks used in printers
Glass or Corundum, that's the Question
 Glass or Corundum, that's the Question Ruby and sapphire are gemstones that are treated extensively by heat since centuries. Untreated stones of high quality have always been rare and highly priced, and
GARNETS FROM MADAGASCAR WITH A COLOR CHANGE OF BLUE-GREEN TO PURPLE By Karl Schmetzer and Heinz-Jürgen Bernhardt
 GARNETS FROM MADAGASCAR WITH A COLOR CHANGE OF BLUE-GREEN TO PURPLE By Karl Schmetzer and Heinz-Jürgen Bernhardt Gemological, chemical, spectroscopic, and microscopic properties of bluegreen color-change
ISG Gemology Tools and Techniques
 ISG Gemology Tools and Techniques Lesson Sixteen: Advanced Testing Tools Introduction With an increase in the sophistication of interpretation software, the use of advanced technology is quickly becoming
Zaidi Embong and Husin Wagiran Physics Department, University Of Technology Malaysia, P.O Box 791, 80990, Johor Baharu
 MY9800971 Optimization of a Spectrometry for Energy -Dispersive X-ray Fluorescence Analysis by X-ray Tube in Combination with Secondary Target for Multielements Determination of Sediment Samples. Zaidi
Diamond Analysis. Innovation with Integrity. Reliable identification and type determination by FTIR spectroscopy FTIR
 Diamond Analysis Reliable identification and type determination by FTIR spectroscopy Innovation with Integrity FTIR FTIR Diamond Analysis Since the appearance of synthetic diamonds, nearly perfect imitates
 Lot 75 A Fine Platinum, Kashmir Sapphire and Diamond Ring, J.E. Caldwell, Circa 1910, containing one antique cushion cut sapphire weighing approximately 5.05 carats, and two old mine cut diamonds weighing
Add CLUE to your SEM. High-efficiency CL signal-collection. Designed for your SEM and application. Maintains original SEM functionality
 Add CLUE to your SEM Designed for your SEM and application The CLUE family offers dedicated CL systems for imaging and spectroscopic analysis suitable for most SEMs. In addition, when combined with other
CHART OF COMMERCIALLY AVAILABLE GEM TREATMENTS
 CHART OF COMMERCIALLY AVAILABLE GEM TREATMENTS Christopher P. Smith and Shane F. McClure This chart combines a comprehensive listing of the commercially available treatments for the most commonly used
Glass and Bioglass Nanopowders by Flame Synthesis
 Supplementary Information Glass and Bioglass Nanopowders by Flame Synthesis Tobias J. Brunner, Robert N. Grass, Wendelin J. Stark* Institute for Chemical and Bioengineering, Department of Chemistry and
3 Analytical report of glass beads from Hoa Diem site, Khanh Hoa, Viet Nam.
 3 Analytical report of glass beads from Hoa Diem site, Khanh Hoa, Viet Nam. Yoshiyuki Iizuka (Institute of Earth Sciences, Academia Sinica) Studied glass beads are listed and shown in Table 1 and Figure
Applications Information
 Applications Information Window Materials % TRANSMISSION 100 90 80 70 60 50 40 30 20 10 UV Sapphire UV Quartz Pyrex & Glass 100 200 300 400 500 600 700 800 900 Wavelength (nm) Pyrex only In applications
Applications of Steady-state Multichannel Spectroscopy in the Visible and NIR Spectral Region
 Feature Article JY Division I nformation Optical Spectroscopy Applications of Steady-state Multichannel Spectroscopy in the Visible and NIR Spectral Region Raymond Pini, Salvatore Atzeni Abstract Multichannel
Pearls with Unpleasant Odors
 Pearls with Unpleasant Odors Nick Sturman GIA Laboratory, Bangkok (March 23, 2009) Introduction Two pearls were submitted for routine gemological identification (Figure 1) at the GIA Laboratory in Bangkok
X-Ray Spectroscopy with a CCD Detector. Application Note
 X-Ray Spectroscopy with a CCD Detector In addition to providing X-ray imaging solutions, including CCD-based cameras that image X-rays using either direct detection (0.5-20 kev) or indirectly using a scintillation
Corundum C Axis Device for Sample Preparation Timothy Thomas, M.E., M.S.E.E. GIA Laboratory June 4, 2009
 Abstract Corundum C Axis Device for Sample Preparation Timothy Thomas, M.E., M.S.E.E. GIA Laboratory June 4, 2009 As a part of GIA s on going project to establish a comprehensive corundum database a need
CHAPTER 7. Components of Optical Instruments
 CHAPTER 7 Components of Optical Instruments From: Principles of Instrumental Analysis, 6 th Edition, Holler, Skoog and Crouch. CMY 383 Dr Tim Laurens NB Optical in this case refers not only to the visible
Possibility of Identifying Treated and Non-treated Sri Lankan Ruby and Sapphires by FT-IR Spectroscopy
 Possibility of Identifying Treated and Non-treated Sri Lankan Ruby and Sapphires by FT-IR Spectroscopy Sandun Illangasinghe 1, Hasintha Wijesekara 2 and Meththika Vithanage 2. 1.Research Officer, Gem &
Improving the Collection Efficiency of Raman Scattering
 PERFORMANCE Unparalleled signal-to-noise ratio with diffraction-limited spectral and imaging resolution Deep-cooled CCD with excelon sensor technology Aberration-free optical design for uniform high resolution
Pricing Color: The Methodology & Challenges Richard B. Drucker, GG (GIA), Honorary FGA
, Honorary FGA") Pricing Color: The Methodology & Challenges Richard B. Drucker, GG (GIA), Honorary FGA Thank you for attending the Scandinavian Gem Symposium presentation on 17 June, 2017. This synopsis includes information
Pricing Color: The Methodology & Challenges Richard B. Drucker, GG (GIA), Honorary FGA Thank you for attending the Scandinavian Gem Symposium presentation on 17 June, 2017. This synopsis includes information
Material analysis by infrared mapping: A case study using a multilayer
 Material analysis by infrared mapping: A case study using a multilayer paint sample Application Note Author Dr. Jonah Kirkwood, Dr. John Wilson and Dr. Mustafa Kansiz Agilent Technologies, Inc. Introduction
WORKSHOP. Fiber Optic Reflectance Spectrometry for pigments identification in paintings. Marco Gargano Department of Physics
 WORKSHOP Fiber Optic Reflectance Spectrometry for pigments identification in paintings Marco Gargano Department of Physics Light and Colors Primary source of color Incandescence luminescence Scattering
IDENTIFICATION OF GLASS FRAGMENTS BY THEIR PHYSICAL PROPERTIES FOR FORENSIC SCIENCE WORK
 IDENTIFICATION OF GLASS FRAGMENTS BY THEIR PHYSICAL PROPERTIES FOR FORENSIC SCIENCE WORK Walyaporn Jamjumrus 1,*, Ratchapak Chitaree 2, Kwan Arayathanitkul 2 1 Department of Forensic Science, Faculty of
THEIMER - lamps. The optimal type for every application. Ga - Fe doped: Multi spectrum type TH...2 Ga - Pb doped: Dual spectrum type THS...
 The optimal type for every application 12 12 1 1 8 8 6 6 4 4 2 2 3 35 4 45 5 55 6 65 7 Xenon puls: For reprographic camera type KX... 3 32 34 36 38 4 42 44 46 48 5 52 54 56 58 6 Hg undoped: For UV curing
Components of Optical Instruments
 Components of Optical Instruments General Design of Optical Instruments Sources of Radiation Wavelength Selectors (Filters, Monochromators, Interferometers) Sample Containers Radiation Transducers (Detectors)
NIR SPECTROSCOPY Instruments
 What is needed to construct a NIR instrument? NIR SPECTROSCOPY Instruments Umeå 2006-04-10 Bo Karlberg light source dispersive unit (monochromator) detector (Fibres) (bsorbance/reflectance-standard) The
Surface Analysis of one Pound from the Egyptian Coins
 Surface Analysis of one Pound from the Egyptian Coins S. A. Abd El Aal 1, N.Dawood 2, and A. I. Helal 1 1-Central Lab. for Elemental & Isotopic Analysis, NRC, AEA. 2-Taiba University Saudi Arabia. ABSTRACT
ECEN. Spectroscopy. Lab 8. copy. constituents HOMEWORK PR. Figure. 1. Layout of. of the
 ECEN 4606 Lab 8 Spectroscopy SUMMARY: ROBLEM 1: Pedrotti 3 12-10. In this lab, you will design, build and test an optical spectrum analyzer and use it for both absorption and emission spectroscopy. The
Certified Gemological Laboratory Programs Comparison Chart & Table
 Certified Gemological Laboratory Programs Comparison Chart & Table Required/Mandatory List of Equipment & Tools YOUR LAB AGA Accredited Gemologist Association AGS American Gem Society IJO Independent Jewelers
CONFIGURING. Your Spectroscopy System For PEAK PERFORMANCE. A guide to selecting the best Spectrometers, Sources, and Detectors for your application
 CONFIGURING Your Spectroscopy System For PEAK PERFORMANCE A guide to selecting the best Spectrometers, s, and s for your application Spectral Measurement System Spectral Measurement System Spectrograph
Prodigy DC Arc. The Ultimate Solution for Elemental Analysis of Solid Samples
 Prodigy DC Arc The Ultimate Solution for Elemental Analysis of Solid Samples Why Choose DC Arc for Elemental Analysis Fast, easy, quantitative, elemental analyses of difficult samples are hallmarks of
Cobalt-doped glass-filled sapphires: An update
 Cobalt-doped glass-filled sapphires: An update By Thanong Leelawatanasuk, Wilawan Atitchat, Visut Pisutha-Arnond, Pornsawat Wattanakul, Papawarin Ounorn, Wimon Manorotkul & Richard W. Hughes March 26,
Coating Thickness Measurement System
 Spectral Sensors by Carl Zeiss Coating Thickness Measurement System INTRODUCTION Designed to meet the needs of industry, the LABCOAT system provides a simple and precise way to measure transparent coatings
Diamonds were created anywhere from 1 Billion 3.3 Billion years ago... almost as old as the Earth itself!
 ANSWERS TO 50 DIAMOND QUESTIONS! www.jewelry Secrets.com 1) How are Diamonds Formed? Diamonds are made from 100% Pure Carbon (Diamond DNA), and formed by intense heat and pressure inside the Earth's Mantle.
ANALYTICAL MICRO X-RAY FLUORESCENCE SPECTROMETER
 Copyright(c)JCPDS-International Centre for Diffraction Data 2001,Advances in X-ray Analysis,Vol.44 325 ANALYTICAL MICRO X-RAY FLUORESCENCE SPECTROMETER ABSTRACT William Chang, Jonathan Kerner, and Edward
The SS6000 Gold Mate Series For analyzing all precious metals and other elements from Mg to U
 The SS6000 Gold Mate Series For analyzing all precious metals and other elements from Mg to U Portable desk top EDXRF analyzers Responsive, bright, color touch screen display Uses Silicon Drift or Silicon
FOURTEENTH ANNUAL SINKANKAS SYMPOSIUM SAPPHIRE
 102 FOURTEENTH ANNUAL SINKANKAS SYMPOSIUM SAPPHIRE Sapphire Origin Determination Past and Present Edward Boehm In the world of gems, origin can refer to the source country, mode of formation, or cause
Lab Report XRF 441 Elemental distribution analysis on geological samples with the M4 TORNADO
 Bruker Nano Spectrum Geological sample M4 TORNADO Quantification Lab Report XRF 441 Elemental distribution analysis on geological samples with the M4 TORNADO Geological samples are inhomogeneous. The distribution
Chemistry 524--"Hour Exam"--Keiderling Mar. 19, pm SES
 Chemistry 524--"Hour Exam"--Keiderling Mar. 19, 2013 -- 2-4 pm -- 170 SES Please answer all questions in the answer book provided. Calculators, rulers, pens and pencils permitted. No open books allowed.
MICRO SPECTRAL SCANNER
 MICRO SPECTRAL SCANNER The OEM μspectral Scanner is a components kit that can be interfaced to existing microscope ready to accept cameras with Cmount to obtain an hyper-spectral imaging system. With OEM
Introduction Visible light is an electromagnetic wave, characterized by a wavelength, an amplitude
 Thin Film Interferences of SiO2 and TiO2 : Thickness and Iridescence Eman Mousa Alhajji North Carolina State University Department of Materials Science and Engineering MSE 355 Lab Report 201 A Matthew
Basic Components of Spectroscopic. Instrumentation
 Basic Components of Spectroscopic Ahmad Aqel Ifseisi Assistant Professor of Analytical Chemistry College of Science, Department of Chemistry King Saud University P.O. Box 2455 Riyadh 11451 Saudi Arabia
MICRO XRF OF LIGHT ELEMENTS USING A POLYCAPILLARY LENS AND AN ULTRA THIN WINDOW SILICON DRIFT DETECTOR INSIDE A VACUUM CHAMBER
 Copyright JCPDS - International Centre for Diffraction Data 2005, Advances in X-ray Analysis, Volume 48. 229 MICRO XRF OF LIGHT ELEMENTS USING A POLYCAPILLARY LENS AND AN ULTRA THIN WINDOW SILICON DRIFT
Report on BLP Spectroscopy Experiments Conducted on October 6, 2017: M. Nansteel
 Report on BLP Spectroscopy Experiments Conducted on October 6, 2017: M. Nansteel Summary Several spectroscopic measurements were conducted on October 6, 2017 at BLP to characterize the radiant power of
NanoSpective, Inc Progress Drive Suite 137 Orlando, Florida
 TEM Techniques Summary The TEM is an analytical instrument in which a thin membrane (typically < 100nm) is placed in the path of an energetic and highly coherent beam of electrons. Typical operating voltages
The FTNIR Myths... Misinformation or Truth
 The FTNIR Myths... Misinformation or Truth Recently we have heard from potential customers that they have been told that FTNIR instruments are inferior to dispersive or monochromator based NIR instruments.
Light, Color, Spectra 05/30/2006. Lecture 17 1
 What do we see? Light Our eyes can t t detect intrinsic light from objects (mostly infrared), unless they get red hot The light we see is from the sun or from artificial light When we see objects, we see
Lecture 5. SPR Sensors: Principle and Instrumentation.
 Lecture 5 Optical sensors. SPR Sensors: Principle and Instrumentation. t ti Optical sensors What they can be based on: Absorption spectroscopy (UV-VIS, VIS IR) Fluorescence/phosphorescence spectroscopy
Ultraviolet Visible Infrared Instrumentation
 Ultraviolet Visible Infrared Instrumentation Focus our attention on measurements in the UV-vis region of the EM spectrum Good instrumentation available Very widely used techniques Longstanding and proven
StarBright XLT Optical Coatings
 StarBright XLT Optical Coatings StarBright XLT is Celestron s revolutionary optical coating system that outperforms any other coating in the commercial telescope market. Our most popular Schmidt-Cassegrain
Abstract No. 32. Arne Bengtson and Tania Irebo. Swerea KIMAB AB, Isafjordsgatan 28A, SE Kista, Sweden
 Abstract No. 32 Ultraviolet Fluorescence using a deep UV LED source and multiple optical filters new possibilities for advanced on-line surface inspection Arne Bengtson and Tania Irebo Swerea KIMAB AB,
Arab Journal of Nuclear Science and Applications, 46(4), (94-99) 2013
, (94-99) 2013") Arab Journal of Nuclear Science and Applications, 46(4), (94-99) 2013 Analysis of Some Elements in Egyptian Silver Coins by Different Techniques S. A. Abd El Aal, W. A. Ghaly, H.T.Mohsen,, A. A. El Falaky
Arab Journal of Nuclear Science and Applications, 46(4), (94-99) 2013 Analysis of Some Elements in Egyptian Silver Coins by Different Techniques S. A. Abd El Aal, W. A. Ghaly, H.T.Mohsen,, A. A. El Falaky
Chapter 16 Light Waves and Color
 Chapter 16 Light Waves and Color Lecture PowerPoint Copyright The McGraw-Hill Companies, Inc. Permission required for reproduction or display. What causes color? What causes reflection? What causes color?
M6 JETSTREAM. Innovation with Integrity. Large Area Micro X-ray Fluorescence Spectrometer. Micro-XRF
 M6 JETSTREAM Large Area Micro X-ray Fluorescence Spectrometer Innovation with Integrity Micro-XRF Spatially Resolved Elemental Analysis of Large Objects The Bruker M6 JETSTREAM is designed for the nondestructive
Lecture 3. Mass sensors Optical sensors. SPR Sensors.
 Lecture 3 Mass sensors Optical sensors. SPR Sensors. Lecture plan mass sensors (QCM, SAW, u-cantilevers) thermal sensors optical sensors: adsorption diffractive index change SPR history concept performance
Scientific Analysis of the mural paintings of Aruch, Kobayr and Akhtalà
 Scientific Analysis of the mural paintings of Aruch, Kobayr and Akhtalà Nicola Ludwig 1, Maria Pia Riccardi 2, Letizia Bonizzoni 1, Michela Cantù 2, Marco Gargano 1, Fabio Giacometti 2. 1 Università Statale
Treated and synthetic gem materials
 Treated and synthetic gem materials James E. Shigley GIA Research, Gemological Institute of America (GIA), Carlsbad, California 92008, USA Both treated and synthetic gem materials are encountered today
Chemical Analysis of 1794 & 1795 U. S. Silver Coins Part 2 David Finkelstein and Christopher Pilliod October 6, 2018
 Chemical Analysis of 1794 & 1795 U. S. Silver Coins Part 2 David Finkelstein and Christopher Pilliod October 6, 2018 1. Introduction This is the second article of a multi-part series. Part 1 was published
The equipment used share any common features regardless of the! being measured. Electronic detection was not always available.
 The equipment used share any common features regardless of the! being measured. Each will have a light source sample cell! selector We ll now look at various equipment types. Electronic detection was not
T.Y. B.Sc. Geology Course S.Geo 6.0 AC Title: Gemmology
 T.Y. B.Sc. Geology Course S.Geo 6.0 AC Title: Gemmology Learning Objectives: 1. To study and understand the evolution of gemstones and gem materials. 2. To identify and differentiate between natural and
Structural, optical, and electrical properties of phasecontrolled cesium lead iodide nanowires
 Electronic Supplementary Material Structural, optical, and electrical properties of phasecontrolled cesium lead iodide nanowires Minliang Lai 1, Qiao Kong 1, Connor G. Bischak 1, Yi Yu 1,2, Letian Dou
Fluorescence X-ray Spectrometer System ZSX Series
 The Rigaku Journal Vol. 16/ number 2/ 1999 Product Information Fluorescence X-ray Spectrometer System ZSX Series The ZSX: Innovative XRF Technology-Accelerated. 1 Introduction The ZSX is a revolutionary
USB. Part No Wavelength range. Spectral bandwidth 5 nm 4 nm Optical system
 Visible range spectrophotometers V-1100 and VR-2000 V-1100 MODEL WITH MANUAL WAVELENGTH SETTINGS AND AUTOMATIC BLANK. VR-2000 MODEL WITH AUTOMATIC WAVELENGTH SETTINGS AND BLANK. V-1100 Part no. 4120025
Basics of Light Microscopy and Metallography
 ENGR45: Introduction to Materials Spring 2012 Laboratory 8 Basics of Light Microscopy and Metallography In this exercise you will: gain familiarity with the proper use of a research-grade light microscope
Type the title of your paper here Effect of the focused light from the xenon arc lamp on the surface tension of the molten enamel
 Type the title of your paper here Effect of the focused light from the xenon arc lamp on the surface tension of the molten enamel A D Aleutdinov, S A Ghyngazov, T S Mylnikova and K A Aleutdinov National
Laser Speckle Reducer LSR-3000 Series
 Datasheet: LSR-3000 Series Update: 06.08.2012 Copyright 2012 Optotune Laser Speckle Reducer LSR-3000 Series Speckle noise from a laser-based system is reduced by dynamically diffusing the laser beam. A
Anderson Materials Evaluation, Inc.
 Anderson Materials Evaluation, Inc. Materials Characterization & Failure Analysis Laboratory XPS, FTIR, SEM/EDX, Thermal Analysis, Electrochemistry, Optical Microscopy Email: Charles.Anderson@AndersonMaterials.com
XRF Applications on Native American Collections
 XRF Applications on Native American Collections Cheryl Podsiki The Field Museum, Chicago Symposium School for Advanced Research Indian Arts Research Center, Santa Fe, NM May 28, 2009 Applications Manufactured
Sapphire & Ruby Sri Lanka (Ceylon), Africa, Thailand, Australia and Montana
, Africa, Thailand, Australia and Montana") 10% to 40% OFF!! Scroll to the end. Sapphire & Ruby Sri Lanka (Ceylon), Africa, Thailand, Australia and Montana This page was updated Dec 3, 2018 September birthstone! Sapphire is available in just about
10% to 40% OFF!! Scroll to the end. Sapphire & Ruby Sri Lanka (Ceylon), Africa, Thailand, Australia and Montana This page was updated Dec 3, 2018 September birthstone! Sapphire is available in just about
Content Spectrophotometers
 Spectroph Content Spectrophotometers Selection table Spectrophotometers Page 163 PRIM Page 164 UviLine Page 166 162 Selection table Spectrophotometers PRIM Light/ PRIM Advanced UviLine 9100/ UviLine 9400
QE65000 Spectrometer. Scientific-Grade Spectroscopy in a Small Footprint. now with. Spectrometers
 QE65000 Spectrometer Scientific-Grade Spectroscopy in a Small Footprint QE65000 The QE65000 Spectrometer is the most sensitive spectrometer we ve developed. Its Hamamatsu FFT-CCD detector provides 90%
BRUKER ADVANCED X-RAY SOLUTIONS. SPECTROMETRY SOLUTIONS ARTAX mxrf SPECTROMETER
 BRUKER ADVANCED X-RAY SOLUTIONS SPECTROMETRY SOLUTIONS ARTAX mxrf SPECTROMETER Microanalysis ARTAX Elemental Analysis for the Art Community and More Non-destructive elemental analysis is strictly required
ARTAX. Innovation with Integrity. Portable Micro-XRF Spectrometer. Micro-XRF
 ARTAX Portable Micro-XRF Spectrometer Innovation with Integrity Micro-XRF ARTAX Elemental Analysis for the Art Community and More The ARTAX is the first portable X ray fluorescence (XRF) spectrometer designed
FIRST Newsletter March 2013, Issue 20. Elemental Distribution Analysis of a Meteorite Sample from the Rochechouart Structure with the µ-xrf M4 TORNADO
 FIRST Newsletter March 2013, Issue 20 Elemental Distribution Analysis of a Meteorite Sample from the Rochechouart Structure with the µ-xrf M4 TORNADO By Dr. Roald Tagle, Ulrich Waldschlager, Dr. Michael
Fundamentals of color. Color temperature
 Fundamentals of color Color temperature color temperature, such as 3400 K for halogen lamps, 4200 K for certain fluorescent tubes (Temperature is measured in Kelvin, which is a scale that has its zero
photolithographic techniques (1). Molybdenum electrodes (50 nm thick) are deposited by
. Molybdenum electrodes (50 nm thick) are deposited by") Supporting online material Materials and Methods Single-walled carbon nanotube (SWNT) devices are fabricated using standard photolithographic techniques (1). Molybdenum electrodes (50 nm thick) are deposited
Supporting online material Materials and Methods Single-walled carbon nanotube (SWNT) devices are fabricated using standard photolithographic techniques (1). Molybdenum electrodes (50 nm thick) are deposited
Bandpass Interference Filters
 Precise control of center wavelength and bandpass shape Wide selection of stock wavelengths from 250 nm-1550 nm Selection of bandwidths Available in 1/2 and 1 sizes High peak transmission values Excellent
LASERS. & Protective Glasses. Your guide to Lasers and the Glasses you need to wear for protection.
 LASERS & Protective Glasses Your guide to Lasers and the Glasses you need to wear for protection. FACTS Light & Wavelengths Light is a type of what is called electromagnetic radiation. Radio waves, x-rays,
Bandpass Edge Dichroic Notch & More
 Edmund Optics BROCHURE Filters COPYRIGHT 217 EDMUND OPTICS, INC. ALL RIGHTS RESERVED 1/17 Bandpass Edge Dichroic Notch & More Contact us for a Stock or Custom Quote Today! USA: +1-856-547-3488 EUROPE:
Observational Astronomy
 Observational Astronomy Instruments The telescope- instruments combination forms a tightly coupled system: Telescope = collecting photons and forming an image Instruments = registering and analyzing the
TRACE EVIDENCE ANALYSIS UV-VIS-IR MICROSPECTROMETRY POLARIZED LIGHT MICROSCOPY
 ffta T TRACE EVIDENCE ANALYSIS W O R K S T A T I O N RAMAN SPECTROSCOPY UV-VIS-IR MICROSPECTROMETRY GRIM GLASS RI MEASUREMENT FLUORESCENT IMAGING POLARIZED LIGHT MICROSCOPY DIGITAL IMAGE PROCESSING For
Spectrophotometer. An instrument used to make absorbance, transmittance or emission measurements is known as a spectrophotometer :
 Spectrophotometer An instrument used to make absorbance, transmittance or emission measurements is known as a spectrophotometer : Spectrophotometer components Excitation sources Deuterium Lamp Tungsten
Agilent Cary 610/620 FTIR microscopes and imaging systems RESOLUTION FOR EVERY APPLICATION
 Agilent Cary 610/620 FTIR microscopes and imaging systems RESOLUTION FOR EVERY APPLICATION AGILENT CARY 610/620 FTIR MICROSCOPES ADVANCING FTIR MICROSCOPY AND IMAGING Agilent s 610/620 FTIR microscopes
Spectral Analysis of the LUND/DMI Earthshine Telescope and Filters
 Spectral Analysis of the LUND/DMI Earthshine Telescope and Filters 12 August 2011-08-12 Ahmad Darudi & Rodrigo Badínez A1 1. Spectral Analysis of the telescope and Filters This section reports the characterization
Conceptual Physics Fundamentals
 Conceptual Physics Fundamentals Chapter 13: LIGHT WAVES This lecture will help you understand: Electromagnetic Spectrum Transparent and Opaque Materials Color Why the Sky is Blue, Sunsets are Red, and
INFRARED ANALYSIS OF SINGLE AND MULTILAYER FILMS IN THE PRODUCTION AREA
 INFRARED ANALYSIS OF SINGLE AND MULTILAYER FILMS IN THE PRODUCTION AREA Sandy Rintoul Wilks Enterprise, Inc. South Norwalk, CT Scott Cobranchi Sealed Air Corporation Duncan, SC Nina Tani Sealed Air Corporation
5-2 Terahertz Spectroscopy for Non-Invasive Analysis of Cultural Properties
 5-2 Terahertz Spectroscopy for Non-Invasive Analysis of Cultural Properties The scientific analysis of materials used in art objects can determine the period in which the objects were created, how they
Chemical Imaging. Whiskbroom Imaging. Staring Imaging. Pushbroom Imaging. Whiskbroom. Staring. Pushbroom
 Chemical Imaging Whiskbroom Chemical Imaging (CI) combines different technologies like optical microscopy, digital imaging and molecular spectroscopy in combination with multivariate data analysis methods.
Lecture 18: Photodetectors
 Lecture 18: Photodetectors Contents 1 Introduction 1 2 Photodetector principle 2 3 Photoconductor 4 4 Photodiodes 6 4.1 Heterojunction photodiode.................... 8 4.2 Metal-semiconductor photodiode................
Integrated into Nanowire Waveguides
 Supporting Information Widely Tunable Distributed Bragg Reflectors Integrated into Nanowire Waveguides Anthony Fu, 1,3 Hanwei Gao, 1,3,4 Petar Petrov, 1, Peidong Yang 1,2,3* 1 Department of Chemistry,
GAFCHROMIC HD-810 Radiochromic Dosimetry Film Configuration, Specifications and Performance Data
 GAFCHROMIC HD-810 Radiochromic Dosimetry Film Configuration, Specifications and Performance Data Description GAFCHROMIC HD-810 dosimetry film is designed for the measurement of absorbed dose of high-energy
University of Wisconsin Chemistry 524 Spectroscopic Components *
 University of Wisconsin Chemistry 524 Spectroscopic Components * In journal articles, presentations, and textbooks, chemical instruments are often represented as block diagrams. These block diagrams highlight
Vision Lighting Seminar
 Creators of Evenlite Vision Lighting Seminar Daryl Martin Midwest Sales & Support Manager Advanced illumination 734-213 213-13121312 dmartin@advill.com www.advill.com 2005 1 Objectives Lighting Source