This strategy will identify a break of a trend and take advantage of the movement to the opposite direction.
|
|
|
- Myrtle Murphy
- 5 years ago
- Views:
Transcription
1

2 Thanks for checking out the RSI Trading Strategy, You are going to benefit from this strategy by learning to trade divergence, and finding a low risk way to sell near the top or buy near the bottom of a trend. This strategy will identify a break of a trend and take advantage of the movement to the opposite direction. In this Report, I am going to be showing you a simple trading strategy using the RSI indicator, which happens to be a well know tool to any trader. Before we get started, I want to let you know that we do have a special indicator that we developed that will show exactly when to trade using this strategy! To learn more about this powerful indicator now tap here. Indicators Used for RSI Trading Strategy The RSI indicator is one of the most popular indicators used by traders in any market (stocks, forex, futures, options). It is a great tool to have and use when you trade the market! Lets now take a look at what you need to change in the settings of the RSI indicator. Indicator Settings The default settings for this indicator is a smoothing period of 14. We are going to change that setting to 8. Make sure you change this setting before you jump into this strategy. The reason I like 8 rather than 14, is that the RSI will be much more responsive for us which is very important when are looking for overbought or oversold price areas. Also go ahead into the RSI setting and change the lines in the indicator to 80, 20. You will learn more about this later. 2

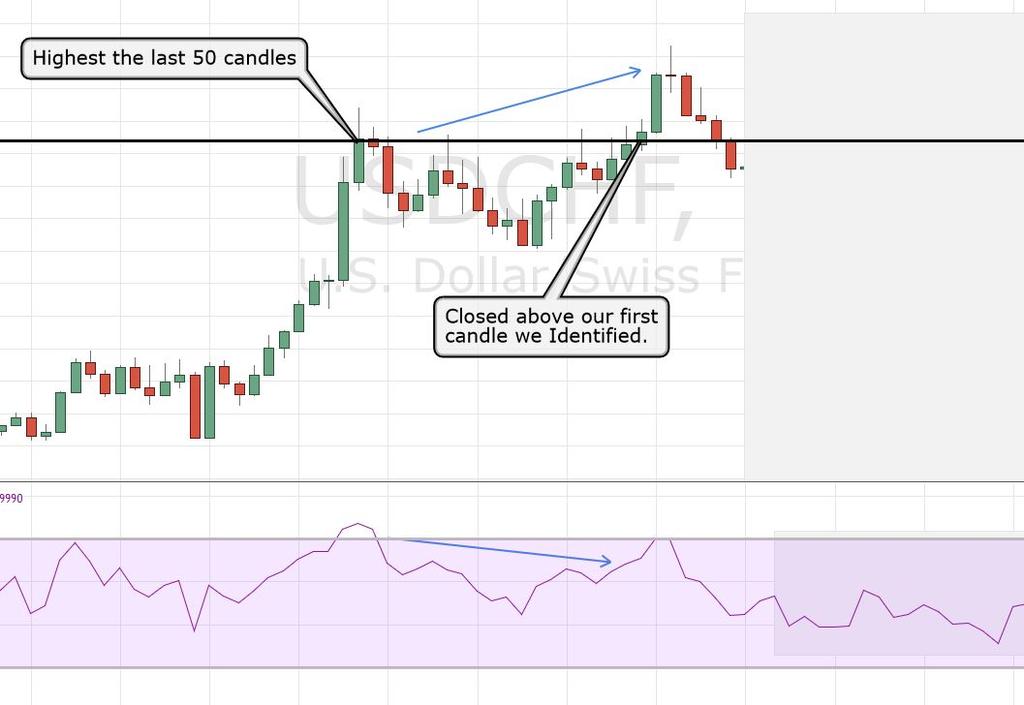
3 This indicator will be the only indicator we use for this strategy. The reason we only use this, is because we have a strict set of rules we need to follow before we can enter a trade. And these rules will, without a doubt, validate a reversal for us to enter a trade. So before you want to use this strategy make the following changes to the RSI indicator: Adjustments to RSI Indicator: 14 time period, to and 30 lines, to 80 and 20. This indicator comes standards on mostly all trading platforms. You just need to make these adjustment to this. If this seems a bit to complex for you go ahead and check out our indicator here because we built all this into it for you so that here is no need to change anything. Step One: Find the currency pair that is showing a high the last 50 candlesticks. (OR low depending on the trade) This strategy we can use any time period. The reason for that is that there are reversals of trends in virtually every time period. So this can be a swing trade, day trade, or a scalping trade. As long as it follows the rules it is a valid trade. The only thing we need to make sure of in this current step is that it is the low or the high the last 50 candles. Below is an example: Note** We will use this same example to explain this strategy. This is a USDCHF currency pair and will be a BUY trade. 3
4 Once we determine this low or high then we can move on to the next step. I drew vertical lines on the chart so that you can see the 50 candle low that we identified. If you need to use horizontal lines on your chart to verify that candle has closed the lowest the last 50 you can do so. This is not necessary but may be helpful for you to do and see how strong the trend is. 4
 Below we have a reading that hit the 20 line on the RSI and was the low the last 50 candles.")
5 Step Two: When we find 50 candle low, it needs to be coupled with RSI reading 20 or lower. (If it s a high it needs to be coupled with the RSI reading 80 or higher.) Below we have a reading that hit the 20 line on the RSI and was the low the last 50 candles. Once we see that we had a low the last 50 candles AND the RSI is BELOW 20 then we can move on the the next step. 5
6 Remember that this strategy is a reversal strategy. It is going to be breaking the current trend and moving the other direction. Step Three : Wait for a second price low candle to close after the first one that we already identified. The second price low must be below the first low but the RSI indicator must provide a higher signal than the first one. Remember, divergence can be seen by comparing price action and the movement of an indicator. If the price is making higher highs, the oscillator should also be making higher highs. If price is making lower lows, the oscillator should also be making lower lows. If they are not, that means price and the oscillator are diverging from each other. Which is why it s called divergence. Just because you see a divergence, it doesn t necessarily mean you should automatically jump in with a position. We have rules in place that will capitalize on this divergence so that we can make a great profit. Keep in mind that this step may take a bit to develope. It is very important to wait for this second low because it gets you in a better position to make a trade. This sounds a bit complex, but think of it like this for our example we are using: 6

7 Price goes down/rsi goes up. That is the Divergence. Remember, that our example is a current downtrend looking to break to the upside. If this was a 50 candle high we would be looking for the exact opposite with this step. With that said, let s take a look at our chart, Once this criteria has been met we can go ahead and look for an entry because the charts are showing us that a reversal is soon coming. Our special indicator has a built in divergence detector that will show you when this is occuring by signaling different candle colors. See how it works by tapping here! Below are two separate pictures that show you where divergence occurred with our EFC indicator. When you see dark blue, divergence as occured. 7

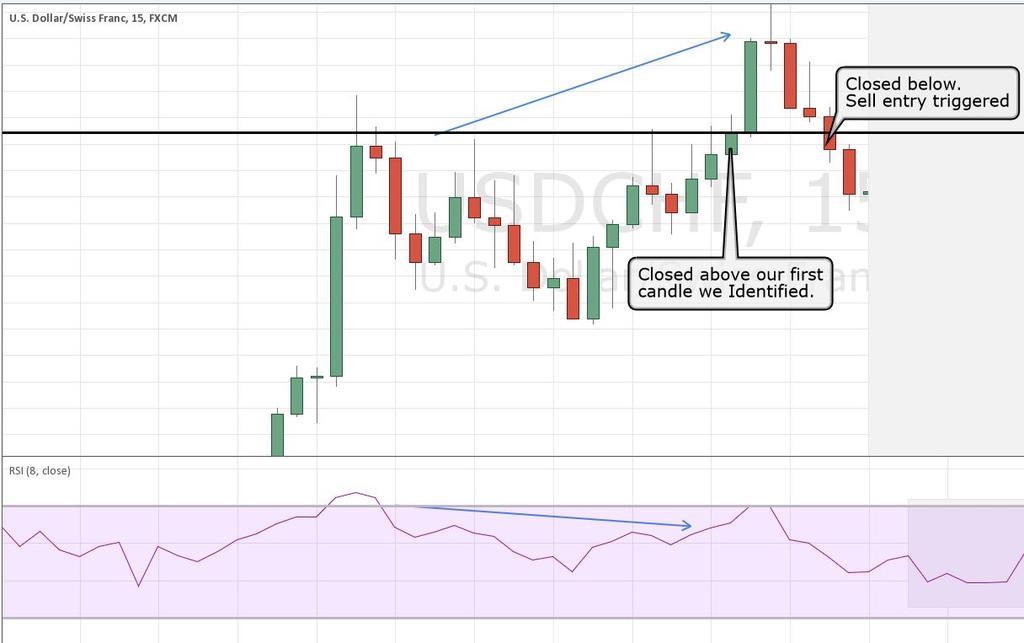
8 Step Four: How to Enter the Trade The way you enter a trade is actually very simple. You wait for the price to head in the direction of the trade and wait for a candle to close above the first candle that you identified that was previous 50 candle low. Save this picture for reference, if are struggling with this step. This will guide you when you look for a trade. Step five: Once you make you entry, place stop loss. To place your stop bump back 1-3 time periods and find a good level to place your stop that makes logical sense. So you are looking for prior resistance, support. 8


9 We placed our stop below this support area. That way if the trend continued and did not break it could hit this level and bounce back up in our direction. I recommend you follow at least a 1 to 3 profit vs. risk level. This will ensure that you are maximizing your potential to get the most out of this strategy. You can adjust as you wish, but most good strategies that identify breaks of a trend use a 1 to 3 profit vs. risk level. If you want to now check out our Special EFC indicator that uses this exact strategy go ahead and tap here to learn how you can get access to this along with some other special gifts we give you! To Recap, here are the rules of the RSI strategy: 9
 50 candle high has been identified.")
10 Since you have a great understand now as to how the RSI Strategy works, I will include for you some examples trades that follows this strategy and show you what our EFC indicator looks like: Example #1: (USDCHF 15 Minute time chart) 50 candle high has been identified. 10

11 RSI is reading over 80. At this point we need to wait for divergence. As you can see the RSI is going down, at the candles are going up. 11
12 12


13 Example #2: (USDCAD 60 minute chart) Step One: Find the currency pair that is showing a high the last 50 candlesticks. Step Two: When we find 50 candle high, it needs to be coupled with RSI reading 80 or higher. 13


14 Step Three : Wait for a second price high candle(s) to close after the first one that we already identified. Step Four: Enter the Trade by waiting for candle to close below the first candle we identified as the previous high the last 50 candles. 14


15 Step five: Once you make you entry, place stop loss, calculate risk. Example #3: (GBPUSD 4-hour time chart) Step One: Find the currency pair that is showing a high the last 50 candlesticks. 15

 to close after the first one that we")
16 Step Two: When we find 50 candle high, it needs to be coupled with RSI reading 80 or higher. Step Three : Wait for a second price high candle(s) to close after the first one that we already identified. 16


17 Step Four: Enter the Trade by waiting for candle to close below the first candle we identified. Step five: Once you make you entry, place stop loss and calculate your risk. 17

18 Now check out the EFC indicator using this strategy and giving you potential huge profits if you would have entered at the entry line: Tap Images to get your access today! 18
by Ashwani Gujral Getting the best of East and West.
 by Ashwani Gujral Getting the best of East and West. Candlestick charting signals can be used in conjunction with Western indicators and the results achieved might be better than using them individually.
EURAUD, EURUSD, GBPUSD, GBPCHF
 30 pip method This is an amazing strategy which can net you 20 30 pips every day. Once you hit 20 pips for the day stop. Trade this strategy either 1 hour after the London Open or if you are in USA, trade
Teodosi s Simple Oscillator-based System ( Forex Strategies Revealed - Simple System #8)
") ( Forex Strategies Revealed - Simple System #8) http://forex-strategies-revealed.com -DISCLAIMER- Virtually all of the information in this paper was sourced from the Forex Strategies Revealed website.
( Forex Strategies Revealed - Simple System #8) http://forex-strategies-revealed.com -DISCLAIMER- Virtually all of the information in this paper was sourced from the Forex Strategies Revealed website.
Chifbaw Oscillator User guide
 Chifbaw Oscillator User guide www.chifbaw.com Indicator and document revision: 1.2 Known bugs: -The alert function system gives sometimes a fake alert when the indicator is initiated on a given currency
The Stair Step Trade. Written By: Jason Ramus Copyright: 2017
 The Stair Step Trade Written By: Jason Ramus www.daytradingfearless.com Copyright: 2017 The Waterfall Introduction: Let me first say thank you for taking the time to read this amazing Book. I believe this
Blips By David Duty CTA Price $99.00 Includes 60 Minutes of Video on Blips
 Blips By David Duty CTA www.commonsensecommodities.com Price $99.00 Includes 60 Minutes of Video on Blips Page 1 My name is David Duty and I m a CTA or Commodity Trading Advisor and I started trading commodities
X-Man s Super Simple System
 X-Man s Super Simple System The 1H E/U method. 1. Timeframe 1 hour timeframe 2. Pair EUR/USD Once this pair is mastered then you can add another pair etc. 3. Main Indicators Synergy bars, Traders Dynamic
How to Read the Stock Chart
 How to Read the Stock Chart Stock charts There are several different kinds of charts: line chart OHLC chart candlestick Line charts The line chart is a single line with starting and ending points. The
Candlesticks by Louizos Alexander Louizos,
 CANDLESTICKS CHARTING As we mentioned before candlesticks behold some trend signals. In this chapter you will learn how to correctly evaluate trends using candlestick charts. Always remember: candlesticks
Prepared by Dave Forster April 9, 2016
 Candlesticks Prepared by Dave Forster April 9, 2016 Who is this guy? Methods of Technical Analysis Technical Analysis Inputs Price vs. Volume How I approach Charting How a Candlestick is Constructed Neutral
Basic Technical Analysis
 Basic Technical Analysis Disclaimer You may from time to time be provided with marketing material, investment & financial related information and reports, including but not limited to research reports
FIBO-ABCD Strategy by John Tsai Version 1.0
 FIBO-ABCD Strategy by John Tsai 05.23.07 Version 1.0 The purpose of writing this ebook is to share the strategy I use to trade the Forex market. In this ebook, I will focus on EUR/USD pair all time, and
Planetary 2 Library P O W E R P L A Y S I I L I B R A R Y. Introduction: Benefits: Included in this Library: L I B R A R I E S
 Planetary 2 Library P O W E R P L A Y S I I L I B R A R Y Introduction: The Power Plays II library introduces some new studies as well as some already well known ones. It also gives you access to some
Frontline FX: Key Candlestick Strategies for Profitable FX Trades Candlestick Essentials and Beyond for FX
 Frontline FX: With Steve Nison, CMT President: Candlecharts.com Easy to Understand Early Reversals Safety First East + West All FX markets All Time Frames Accelerates Analysis Current volatility in FX
SRDC Level II. By Orange Roshan. Compiled and Edited by Henry S. (Hensch)
") SRDC Level II By Orange Roshan Compiled and Edited by Henry S. (Hensch) No part of this document may be reproduced, without written permission of the author. Copyright 2006 SRDC Level II Orange Roshan
SRDC Level II By Orange Roshan Compiled and Edited by Henry S. (Hensch) No part of this document may be reproduced, without written permission of the author. Copyright 2006 SRDC Level II Orange Roshan
PREDICTOR INDICATOR FOREX LIBRA CODE
 PREDICTOR INDICATOR FOREX LIBRA CODE This short manual aims to explain how to use and apply the Predictor Indicator which is part of the Forex Libra Code software. The Predictor Indicator is available
Telemet Orion v5.0x New Features
 Telemet Orion v5.0x New Features What are: Trendlines Point and Figure Charts Candlesticks Trendlines Eight new trendline studies are offered in Telemet Orion v5.0x. Access these with the pull down menu
BunnyGirl s FAQ Rev 1.0
 BunnyGirl s FAQ Rev 1.0 Basic Entry & Exit Conditions Pairs traded EUR-USD, GBP-USD & USD-CHF. EUR-JPY traded sometimes. Other pairs have been tested for this strategy but were deemed not suitable. 5 WMA
TEB Candle Patterns. Here is a trade I took. when I see one as clear as this one I will take it and say thanks!
 TEB Candle Patterns 1st Candle Formation: 3 Candle Reversal with Pin Candle One of my favourite candle formations is the 3 candle reversal.. variation with a big pin candle (nose or tail)the Pin is the
With Steve Nison, CMT President: Candlecharts.com
 With Steve Nison, CMT President: Candlecharts.com Legal Notice: This recording is Candlecharts.com and may not be copied, retransmitted, nor distributed in any manner whatsoever, including, but not limited
Master Heikin-Ashi with this Trading Strategy
 Master Heikin-Ashi with this Trading Strategy Roman Sadowski - Humbletraders.com What is it? Heikin-Ashi chart looks like the candlestick chart but the method of calculation and plotting of the candles
If I was to suggest that the charts you are looking at could be literally speaking to you, would you think I had gone slightly mad?
 Section Two Get to know your Charts Runtime 10min 37s So we now have covered off the basics, you ve got your platform open, charts at the ready & your raring to find out how all these traders make mega
Neural pattern recognition with self-organizing maps for efficient processing of forex market data streams
 Neural pattern recognition with self-organizing maps for efficient processing of forex market data streams Piotr Ciskowski, Marek Zaton Institute of Computer Engineering, Control and Robotics Wroclaw University
Trendlines. Lesson 2.6 Created by Sebastian Kunysz
 Trendlines Lesson 2.6 Created by Sebastian Kunysz DISCLOSURE THIS VIDEO IS FOR DEMONSTRATION PURPOSES ONLY CombinePrepSchool.com provides this material for information and educational purposes only and
Copyright UCRP
 www.candlestickreversalpattern.com Copyright UCRP Introduction I don t want this book to have dozens of unnecessary pages of material that would do you no good in order to impress you. That s why I m going
Reversing candles. Three black crows. Exhibit 13.0 The three black crows pattern
 Three black crows Reversing candles Three black crows Exhibit 13.0 The three black crows pattern The pattern of upside gap two crows has two black candles gap upon the previous bullish real body. The three
My Top Strategies with LT Pulse and LT Gamma Confirmation. LIVE Class with Alessio Rastani
 My Top Strategies with LT Pulse and LT Gamma Confirmation LIVE Class with Alessio Rastani I did this trade during the filming of documentary The Agenda For Today 1. Introduction To LT Pulse 2. My Favourite
Candlesticks for Intraday and Swing Trading. Day 1 with Steve Nison, CMT President: Candlecharts.com
 Candlesticks for Intraday and Swing Trading Day 1 with Steve Nison, CMT President: Candlecharts.com Slide 2 Media Comments Japan's Candlesticks Light Traders' Path - Wall Street Journal Whether you day
SmartTool Calibration
 Smart Tool Calibration Instructions SmartTool Calibration The calibration process is simple and takes about 2 minutes. Just remember: 1. For best results perform all 8 calibration steps. If CAL ALL shows
Steve Nison s Candlecharts.com Secrets of Intraday Candlesticks for Day and Swing Traders
 With Steve Nison, CMT President: Candlecharts.com Legal Notice: This webcast and recording is Candlecharts.com and may not be copied, retransmitted, nor distributed in any manner whatsoever, including,
Shaftesbury Park Primary School. Wandsworth test examples
 Shaftesbury Park Primary School Wandsworth test examples Non-verbal reasoning Non-verbal reasoning is problem-solving based around pictures, diagrams and shapes, rather than words. Unlike verbal reasoning,
The secret meaning of Japanese Candlesticks
 The secret meaning of Japanese Candlesticks Part 2 By Vladimir Ribakov Creator of: www.vladimirforexsignals.com http://www.vladimirmarketsforecast.com/ www.forex-lst-syetem.com 2 nd edition, July 2013
Japanese candlestick charts, discussed in Chapter 3, are an alternative
 The Visual Investor: How to Spot Market Trends, Second Edition By John J. Murphy Copyright by John J. Murphy. APPENDIX B Japanese Candlesticks Japanese candlestick charts, discussed in Chapter 3, are an
Copyright Page 1
 Copyright 2008 www.forex4noobs.com Page 1 ALL RIGHTS RESERVED. No part of this publication may be reproduced, stored in a retrieval system, or transmitted in any form or by any means, electronic, mechanical,
Equal open and close candles. ( known as doji candles ) Short body candles. Long body candles.
 Short body candles. Long body candles.") I have broken down the patterns into 3 categories: Equal open and close candles. ( known as doji candles ) Short body candles. Long body candles. Within these categories are both bullish reversal and bearish
I have broken down the patterns into 3 categories: Equal open and close candles. ( known as doji candles ) Short body candles. Long body candles. Within these categories are both bullish reversal and bearish
The Secret to High Performance Trading. Discover Where your strength and weaknesses lie
 The Secret to High Performance Trading Discover Where your strength and weaknesses lie 1 Being able to perform as a winning trader requires action without a lot of theory and discussion start right now!
COPYRIGHTED MATERIAL. Candlesticks = Signals INTRODUCTION
 1 Candlesticks = Signals INTRODUCTION Traders and investors have been looking at charts for well over 85 years as Edwin Lefèvre wrote (1994, p. 61), I should say that a chart helps those who can read it
Rick Saddler s Introduction to Trading with. Japanese Candlesticks
 Rick Saddler s with Japanese Candlesticks him Learning to Read Stock Charts With Japanese Candlesticks Rick Saddler Hit and Run Candlesticks Trading for Profits, LLC Phone: (417) - 848-3519 www.hitandruncandlesticks.com
Use of Candlestick charts
 Use of Candlestick charts Candlestick chart was developed in 1700s in Japan by a man named Munehisa Homma, originally designed to trade rice futures in the 17th century, he invented a method to analyze
Tommy s Revenge Trading Method 2.0 (Module 2 Part 1)
") 1 Welcome to Tommy s Revenge Module 2 Part 1. I m not sure how many parts will be in this section. I think if we participate together we can make a module that s beneficial to all of us Be aware that anything
1 Welcome to Tommy s Revenge Module 2 Part 1. I m not sure how many parts will be in this section. I think if we participate together we can make a module that s beneficial to all of us Be aware that anything
THE POWER OF JAPANESE CANDLESTICK CHARTS
 THE POWER OF JAPANESE CANDLESTICK CHARTS Founded in 1807, John Wiley & Sons is the oldest independent publishing company in the United States. With offi ces in North America, Europe, Australia and Asia,
The Candlestick EXPRESS Class with Steve Nison
 With Steve Nison, CMT President: Candlecharts.com & the first to reveal candlesticks to the Western world Candlestick Charting Techniques Candles + Western Charting Tools Candles for Trade Management 1
Candlesticks: What they are and how to use them? NUS Investment Society Global Macro Department Gideon Wong & Devin Nathanael GM Research Analyst
 Candlesticks: What they are and how to use them? NUS Investment Society Global Macro Department Gideon Wong & Devin Nathanael GM Research Analyst Disclaimer NUS Invest is in no way affiliated or representative
The secrets of Candlestick Charts Unveiled
 NeW york ChICAgO LONDON DUBAI* TOkyO singapore sydney ADA The secrets of Candlestick Charts Unveiled By GFT Above all, Integrity. FUTURES FOREX CFDs Worldwide Leaders in Online Trading CD04U.041.102808
High Profit Candlestick Patterns Stephen Bigalow
 We have made it easy for you to find a PDF Ebooks without any digging. And by having access to our ebooks online or by storing it on your computer, you have convenient answers with high profit candlestick
Chapter 3 THEORETICAL FRAMEWORK OF CANDLESTICK CHARTS. way about candlestick charts. The details of the same is shown as follows.
 Chapter 3 THEORETICAL FRAMEWORK OF CANDLESTICK CHARTS After the extensive review of literature, this chapter gives the conceptual and back ground of the technicalities of the study. The study covers about
THE MAJOR CANDLESTICKS SIGNALS
 THE MAJOR CANDLESTICKS SIGNALS Profit BIG with Candlesticks Master these Major Candlestick Signals it you want to Master the Market. Copyright @ Stephen W. Bigalow May not be duplicated or distributed
Hilbert Sine Wave Don't Trade Cycles Without It!
 Hilbert Sine Wave Don't Trade Cycles Without It! Summary of what you'll learn in the feature article below: The Hilbert Sine Wave is a unique indicator it combines the best characteristics of an oscillator
Candlestick Patterns (Every trader should know)
") Candlestick Patterns (Every trader should know) A doji represents an equilibrium between supply and demand, a tug of war that neither the bulls nor bears are winning. In the case of an uptrend, the bulls
Candlestick Patterns (Every trader should know) A doji represents an equilibrium between supply and demand, a tug of war that neither the bulls nor bears are winning. In the case of an uptrend, the bulls
Candlestick Secrets for Profiting in Options Seminar Bonus module- Using NCS to set up option trades + Bouncing Ball strategy
 Bonus Module: Option trade setups using NCS+ The bouncing ball trade setup 1 For the FREE Ninja Trader (and other) platforms 2 Let NCS do the work for you! Save hours of research time Automatically find
EP72: Market Trends.
 EP72: Market Trends Announcer: We love to hold on to this belief that discretion is really important and I think a lot of the times we like to hold on to that is because it gives us that easy out. It gives
Tradeciety.com. My Trading Strategy. Name: Date:
 My Trading Strategy Name: Date: I am serious about my trading. I have enough and I want to see better results. I am committed to making a change and start treat trading like a profession. I am committed
17 Money Making CandleStick Formations. you can use today in MarketClub
 17 Money Making CandleStick Formations you can use today in MarketClub Candlestick lines and charts Candlestick lines and charts -- traditional Japanese charts whose individual lines look like candles,
SPECIAL REPORT: CANDLESTICK PATTERN SUMMARY
 SPECIAL REPORT: CANDLESTICK PATTERN SUMMARY Louise Bedford This Special Report is an extract from the Candlestick Charting Home Study Course. It is a handy, quick reference guide that you can refer to
Candles shed light on the market
 Candles shed light on the market By KIRA MCCAFFREY BRECHT When Steve Nison provided trade recommendations to brokers at Shearson Lehman Hutton, where he worked in the futures research department more than
The Best Trading Year Ever
 THE BOOKER REPORT From Rob Booker January 2016 Start a subscription in 60 seconds here. In this issue: 1.The Best Trading Year Ever 2.The 5 Trades I Love Right Now 3.How to Get Anything You Want 4.Conquering
Chapter 14. The Top 10 Trading Mistakes
 Chapter 14 The Top 10 Trading Mistakes I want to talk about the top ten common mistakes that most Forex traders make and more importantly how you can overcome them. So let s start right at the very beginning.
PCF s for TC2000 and TCNet Users 3 MAJOR SIGNALS. Volume II: The Hammer. The Shooting Star. The Harami
 PCF s for TC2000 and TCNet Users 3 MAJOR SIGNALS Volume II: The Hammer The Shooting Star The Harami A Candlestick Forum publication Years of Candlestick Analysis made available in concise formats. Information
Candlestick Charts: Your Complete Beginner's Guide To Reading Candlestick Charts By Christopher Daniels
 Candlestick Charts: Your Complete Beginner's Guide To Reading Candlestick Charts By Christopher Daniels For seasoned traders, candlesticks hold no secrets. However, for beginners they can seem intimidating
BULLISH ENGULFING. Confirmation: Suggested. No. of Sticks: 2
 BULLISH ENGULFING Type: Reversal Medium Engulfing Pattern is a pattern characterized by a large white real body engulfing a preceding small black real body, which appears during a downtrend. The white
CORONA CHARTS EXPLAINED Copyright by eminiz.com Permission granted for free distribution
 CORONA CHARTS EXPLAINED Copyright 2007-08 by eminiz.com Permission granted for free distribution Corona Charts are the next generation of super indicators that present a multidimensional view of market
S&P-PRO FXSUNDAYS GAME CHANGER
 S&P-PRO FXSUNDAYS GAME CHANGER Introduction We have called this course Game Changer because thats exactly what it is, for any level of Trader this will change the way you trade, will help you make the
We're excited to announce that the next JAFX Trading Competition will soon be live!
 COMPETITION Competition Swipe - Version #1 Title: Know Your Way Around a Forex Platform? Here s Your Chance to Prove It! We're excited to announce that the next JAFX Trading Competition will soon be live!
FOLLOW THE SMART MONEY: LET CANDLES & VOLUME GUIDE THE WAY
 FOLLOW THE SMART MONEY: LET CANDLES & VOLUME GUIDE THE WAY January 2009 By Todd Krueger Compared to the common bar chart, candlestick charts are visually more capable of revealing the psychology and sentiment
Candlestick Charting Quick Reference Guide
 Quickly and easily master the common Candlestick Charting patterns, with the Candlestick Charting Quick Reference Guide www.yourtradingcoach.com Because you d rather be trading for a living! Disclaimer
Getting Started in Forex Robots
 Getting Started in Forex Robots By Rob Booker and Wes Walton Version 1.0, August 29, 2016 WARNING Trading involves substantial risks. Forex trading is risky, and most traders lose money. Past performance
Findings. A Number of Candles Do Not Work as Expected
 1 Findings Arguably, you are reading the most important chapter because it discusses the discoveries I made about candles while researching this book. You may already know some of them, but the others
Oscilloscope Operation. Visualizing Signals and Making Measurements
 Oscilloscope Operation Visualizing Signals and Making Measurements Set Up Oscilloscope Start with the oscilloscope off, with the input plugged into channel one. Press the power button to turn the scope
The Candlestick Course
 We have made it easy for you to find a PDF Ebooks without any digging. And by having access to our ebooks online or by storing it on your computer, you have convenient answers with the candlestick course.
For next week support for the index is lies in the zone of and levels. The index can face its resistance at the level of &
 27 AUG 2018 GOLD: The bullion metal shows some strength and sustaining on major support level, after making the weekly low in previous trading week this week gold made big bullish candle on weekly chart.
Okay Jason, for the first question, can you please tell me what your background is and how you began your career as a trader?
 Jason Fielder is a 10 year trading veteran, and though you ve never seen him on CNBC, he s become a widely followed and respected trading guru because he s helped thousands of traders with the systems
Steve Nison s Quick Start Guide to Correctly Using Candlesticks. WithSteve Nison, CMT President: Candlecharts.com
 WithSteve Nison, CMT President: Candlecharts.com 1 Benefits of Nison Candlesticks Any market Any time frame Simple to apply Safety first trading Early reversals for razor sharp entries and exits Profit
KAD LED The Most Cost Effective 400W Metal Halide Replacement Available Today
 KAD LED The Most Cost Effective 400W Metal Halide Replacement Available Today Outdoor Trends Lower Prices and Quicker Paybacks Over 60% of Outdoor sales are now LED! New Technology. Familiar Forms Customers
MESA 1. INTRODUCTION
 MESA 1. INTRODUCTION MESA is a program that gives accurate trading signals based on the measurement of short term cycles in the market. Cycles exist on every scale from the atomic to the galactic. Therefore,
IDENTIFYING TREND MODES and CYCLE MODES
 IDENTIFYING TREND MODES and CYCLE MODES Left-Brained Concepts for Traders in their Right Minds 1 2008 Charles H. Dow award runner-up Author MESA, and Trading Market Cycles Rocket Science for Traders Cybernetic
Candlestick Patterns And Trading Strategies
 We have made it easy for you to find a PDF Ebooks without any digging. And by having access to our ebooks online or by storing it on your computer, you have convenient answers with candlestick patterns
DOWNLOAD PDF ENCYCLOPEDIA OF CHART PATTERNS BULKOWSKI
 Chapter 1 : Encyclopedia of Candlestick Charts (ebook, PDF) von Thomas N. Bulkowski - Portofrei bei the In this revised and expanded second edition of the bestselling Encyclopedia of Chart Patterns, Thomas
Monster Trading Plan Survey
 Monster Trading Plan Survey Published by: http://www.surefire-trading.com How Much Are You Losing Using The Wrong Trading Plan Or System On the 26 th July 06 I conducted one of the largest surveys of traders
9 Financially Devastating Mistakes Most Option Traders Make
 9 Financially Devastating Mistakes Most Option Traders Make Fortunes have been made and lost in the world of option trading. And those fortunes that were lost may very well have been lost due to making
Market Observations - as of Jun 29, 2018
 Market Observations - as of Jun 29, 2018 By Carl Jorgensen - For Objective Traders - For educational purposes only. Not Financial Advice. The Market changes we began to see last week, continued this week
Section 7B Slope of a Line and Average Rates of Change
 Section 7B Slope of a Line and Average Rates of Change IBM stock had a price of $186.91 at the end of September 2014. Over the next three months the stock price rose and fell and by the end of December
Predictive Indicators for Effective Trading Strategies By John Ehlers
 Predictive Indicators for Effective Trading Strategies By John Ehlers INTRODUCTION Technical traders understand that indicators need to smooth market data to be useful, and that smoothing introduces lag
The advantage of candlestick charts is the ability to highlight trend weakness and reversal signals that may not be apparent on a normal bar chart.
 CANDLESTICKS CHART Candlesticks contain the same data as a normal bar chart but highlight the relationship between opening and closing prices. The narrow stick represents the range of prices traded during
The Origins of Japanese Candlestick Charting
 The Origins of Japanese Candlestick Charting Munehisa Homma (1724-1803), also referred to as Sokyu Homma or Sokyu Honma, was a wealthy rice merchant and trader from Sakata, Japan who lived during during
Class 1: Introduction
 Japanese Trading Systems Class 1 Class 1: Introduction In This Lesson: History of Japanese Trading Candlesticks meet Clouds Introduction to Cloud Charts How to Build a Cloud PAGE 1 The Rich History of
Flavio Graziano & Aken Stienka: AKENDICATOR indicator tutorial AKENDICATOR TUTORIAL. Revolutionary indicator for Binary Options on Metatrader
 AKENDICATOR TUTORIAL Revolutionary indicator for Binary Options on Metatrader NOT REPAINT INDICATOR First of all, sorry for our not perfect English. However Akendicator is so easy and we hope you understand
Presents. LiberatorFX. Cheat Sheet for StratLab
 Presents LiberatorFX Cheat Sheet for StratLab 2 WHAT is a Trading System? A Mechanical Trading System is a SET of OBJECTIVE and formalized rules INDEPENDENT of the MIND and EMOTIONS of the Investor. Layman
An Investor's Guide to Candlestick Patterns
 An Investor's Guide to Candlestick Patterns By Gordon Kristopher Dec 12, 2014. 03:34 PM What Are Candlestick Patterns in Technical Analysis? Candlestick patterns In technical analysis, candlestick patterns
No Cost Online Marketing
 No Cost Online Marketing No matter what type of Internet business you have, you need to be promoting it at all times. If you don t make the effort to tell the right people about it (i.e. those people who
Sentiment: The emotions, plans, or thought processes that lead up to the buying or selling of a security. I personally define sentiment this way.
 Hi Traders! I trust this article finds you well! I am sure many of you know my affinity for candlesticks and their importance as it relates to trading. A good saying to remember is, The stock market rewards
Encyclopedia Of Candlestick Charts Wiley Trading
 ENCYCLOPEDIA OF CANDLESTICK CHARTS WILEY TRADING PDF - Are you looking for encyclopedia of candlestick charts wiley trading Books? Now, you will be happy that at this time encyclopedia of candlestick charts
Design and Implementation of Candlestick Chart Retrieval Algorithm for Predicting Stock Price Trend
 Design and Implementation of Candlestick Chart Retrieval Algorithm for Predicting Stock Price Trend Yoshihisa Udagawa Computer Science Department, Faculty of Engineering, Tokyo Polytechnic University Atsugi-city,
ANTICIPATING TURNING POINTS
 ANTICIPATING TURNING POINTS Left-Brained Concepts for Traders in their Right Minds 1 This Session is an excerpt from my Runner Up Paper for the MTA Charles H. Dow Award www.mta.org Activities Tab Charles
To accomplish great things, we must not only act, but also dream; not only plan, but also believe! ~ A. France
 Fluidity Trader Chat Room w/cynthia E. - Wednesday, January 02, 2019: Page Begin Page End Chat Roll Time Wednesday 1.02.19 1 11 CENTRAL Time Zone 6:30 *** Hello Fluidity Team Traders Welcome! *** 6:30
Building a Chart Using Trick or Treat Data a step by step guide By Jeffrey A. Shaffer
 Building a Chart Using Trick or Treat Data a step by step guide By Jeffrey A. Shaffer Each year my home is bombarded on Halloween with an incredible amount of Trick or Treaters. So what else would an analytics
House Design Tutorial
 Chapter 2: House Design Tutorial This House Design Tutorial shows you how to get started on a design project. The tutorials that follow continue with the same plan. When we are finished, we will have created
Encyclopedia Of Chart Patterns
 We have made it easy for you to find a PDF Ebooks without any digging. And by having access to our ebooks online or by storing it on your computer, you have convenient answers with encyclopedia of chart
Optical Pumping Control Unit
 (Advanced) Experimental Physics V85.0112/G85.2075 Optical Pumping Control Unit Fall, 2012 10/16/2012 Introduction This document is gives an overview of the optical pumping control unit. Magnetic Fields
Getting Back on Track with Your Business
 Getting Back on Track with Your Business Success is not final; failure is not fatal: it is the courage to continue that counts. -Winston Churchill Do you ever wonder why we have bad days, good days and
THE ROSEN MARKET TIMING LETTER
 THE ROSEN MARKET TIMING LETTER PRECIOUS METALS - FOREX - STOCK INDICES - COMMODITIES Time is more important than price; when time is up price will reverse. W.D.Gann RONALD L. ROSEN January, 2013 rrosen5@tampabay.rr.com