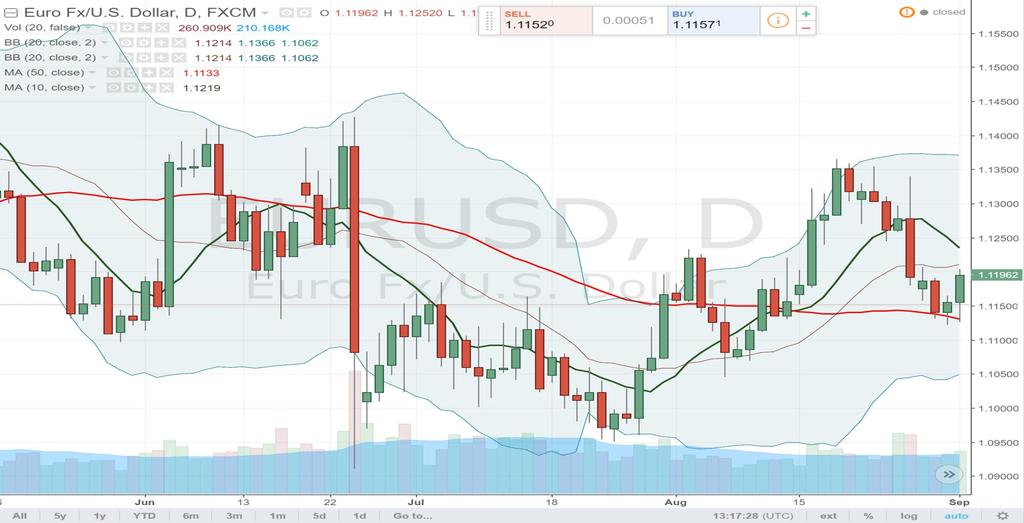
Candlesticks: What they are and how to use them? NUS Investment Society Global Macro Department Gideon Wong & Devin Nathanael GM Research Analyst
|
|
|
- Godwin Oliver
- 6 years ago
- Views:
Transcription

1 Candlesticks: What they are and how to use them? NUS Investment Society Global Macro Department Gideon Wong & Devin Nathanael GM Research Analyst
2 Disclaimer NUS Invest is in no way affiliated or representative of any other company, organisation, club or society, and the views presented are solely our own opinions. The author(s) is not a licensed investment advisor. Our services are educational tools designed to assist you in your personal judgment. It is not designed to replace your licensed financial consultant, and nothing in the content shall be construed to be an offer or solicitation for the purchase or sale of a security. All content on our website and related services is for informational purposes only, and opinions have been made on a general basis. No consideration has been given to any particular individual or specific investment objectives, financial situations or other circumstances. As such, the content should not be relied upon as authoritative without further being subject to the recipient s own independent verification and exercise of judgment. The fact that the content has been made available constitutes neither a recommendation to enter into a particular transaction nor a representation that any product described within is suitable or appropriate for the reader. Readers should be aware that many of the products which may be described within involve significant risks and may not be suitable for all investors, and that any decision to enter into transactions involving such products should not be made unless all such risks are understood and an independent determination has been made that such transactions would be appropriate.
3 Overview What are Candlesticks? Basic Candlestick Patterns How to use Candlesticks in trading?
4


5 History of Candlesticks Homma Steve Munehisa Nison Father of The Japanese Mr. Candlestick Candlestick Charting How it came about? Used by Japanese Rice Traders in the 17 th Century White Candlesticks Prices increased Black Candlesticks Prices decreased Introduced to the Western World in the 90 s

6 Purpose of Candlesticks What do they tell us? Historical representation of trading activity Price Fluctuations for a given time period Direction of the Market Insight into the Psychology of the Market More Buying Pressure (Bullish) or Selling Pressure (Bearish)

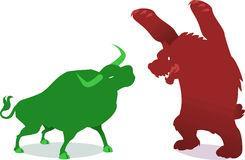
7 Bulls vs Bears
8 Buyers vs Sellers
9

10 Anatomy of a Candlestick Upper Shadow/Tail Real Body Lower Shadow/Tail

11 Reading Candlesticks
12 Tutorial 1 USD2.00 Low High USD1.50 Open USD1.00 USD2.50 Close
13 Tutorial 2 USD1.25 High Low USD1.50 Open USD2.25 USD1.00 Close
14 Overview What are Candlesticks? Basic Candlestick Patterns How to use Candlesticks in trading?
15 Candlestick Patterns
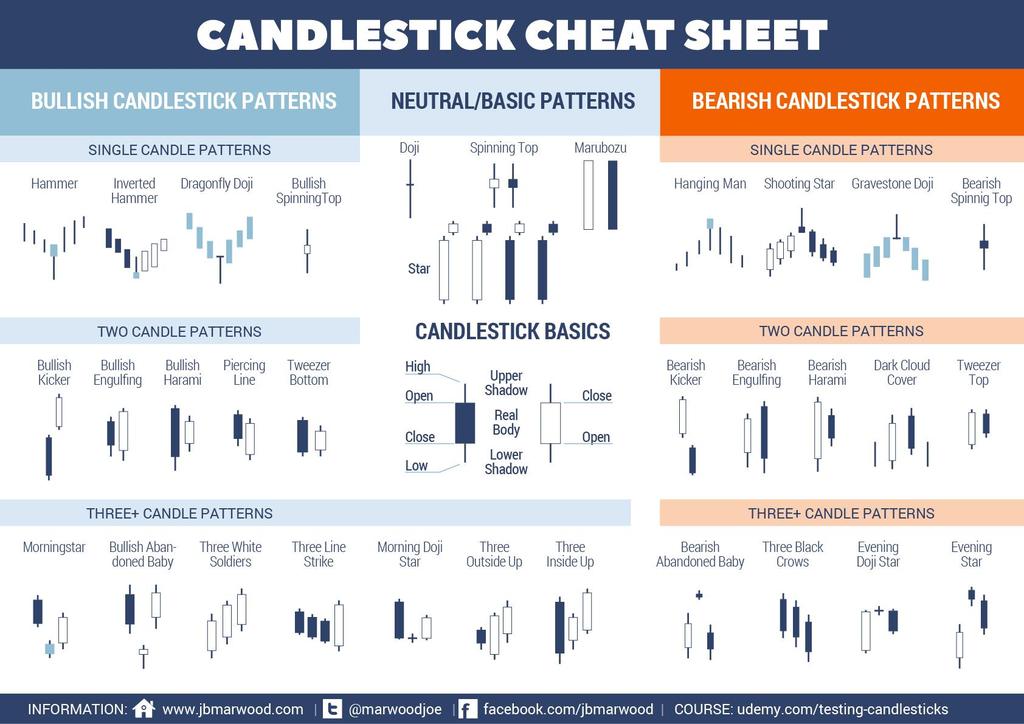
16 Basic Candlestick Patterns Doji (Clumsy) Small Bodies that appear as a thin line Upper Shadow and Lower Shadow usually similar in length Cross or Plus Sign
17 Doji High Open/Close Low Characteristics Opening and Closing Price virtually equal Even balance of Bulls and Bears Indecision between buyers and sellers Market is two-sided


18 Basic Candlestick Patterns Marubozu (Shaven Top) Long Body No Upper and Lower Shadows White Marubozu; Bulls controlled Price from Open to Close Black Marubozu; Bears controlled Price from Open to Close
19 Single Candlestick Patterns Hammer & Hanging Man Small Real Bodies Long Lower Shadow (Two to Three Times of Body) Little or No Upper Shadow Colour of the Real Body is unimportant
20 Hammer Characteristics Open High/Close Formed during downtrend (Bearish) Buyers able to over the strong Selling Pressure Signals a Bullish Reversal Low
21 Hanging Man Characteristics Open/High Formed during Uptrend (Bullish) Close Selling Pressure beginning to accumulate Signals a Bearish Reversal Low
22 Single Candlestick Patterns Recognition Small Real Bodies Long Upper Shadow (Two to Three Times of Body) Little or No Lower Shadow Inverted Hammer; Signals Bullish Reversal Shooting Star; Signals Bearish Reversal
23 Dual Candlestick Patterns Bearish/Bullish Engulfing Formed as part of a trend Small Candle Followed by a Larger Candle of the Opposite Nature Larger Candle Engulfs the entire range of previous candle
24 Bullish Engulfing Characteristics Bearish Candle immediately followed by larger Bullish Candle Buyers overpowered Sellers Signals strong Buying Pressure High Probability of Upward Move
25 Bearish Engulfing Characteristics Bullish Candle followed immediately by larger Bearish Candle Sellers overpowered Buyers Signals strong Selling Pressure High Probability of Downward Move
26 Dual Candlestick Patterns Tweezers First Candle Same as Overall Trend Second Candle Opposite from Overall Trend Lower/Upper Shadows of the Candle should be Equal Length Indicates an upcoming Reversal
27 Triple Candlestick Patterns Three White Soldiers/Three Black Crows Three Long Candles in a row First Candle (Reversal Candle) opposite nature from previous Candle Second Candle larger than first Third Candle should be at least same size as Second Candlestick and have small or no Shadow
28 Three White Soldiers Characteristics Formed after a downtrend Bears exhausted, Bulls take in control Shift from Bear Market to Bull Market Uptrend expected to continue
29 Three Black Crows Characteristics Formed after an uptrend Bulls exhausted, Bears take in control Shift from Bull Market to Bear Market Downtrend expected to continue
30 Overview What are Candlesticks? Basic Candlestick Patterns How to use Candlesticks in trading?
31 Trading The Candlestick LONG VS SHORT TREND, SUPPORT & RESISTANCE USING THE PATTERNS

32 Type of trades Long = Profit when the price rises Sell : 0.36 Profit : 0.09 Buy : 0.27

33 Short = Profit when the price falls Sell : 0.30 Profit : 0.03 Buy : 0.27
34 Trading The Candlestick LONG VS SHORT TREND, SUPPORT & RESISTANCE USING THE PATTERNS

35 Trend : General Movement of price within a period of time Application Up-Trend Down-Trend : Go Long : Go Short
36 Support : Price which stock prices, historically, have difficulty falling through it. How to Draw Mark the lows Connect the lows Extrapolate the support line
37 Support : Price which stock prices, historically, have difficulty falling through it. How to Use Enter a trade at the support
38 Resistance : Price which stock prices, historically, have difficulty rises through it. How to Draw Mark the highs Connect the highs Extrapolate the resistance line
39 Resistance : Price which stock prices, historically, have difficulty rises through it. How to Use Exit a trade at the resistance
40 Trading The Candlestick LONG VS SHORT TREND, SUPPORT & RESISTANCE USING THE PATTERNS
41 TRUTH ABOUT CANDLESTICKS LIMITED UTILITY 1 Candlesticks alone are very limited Many failures Require a strategy to combat this problem STRATEGY 2 Reversal zone indication Principle of zonal confirmation Once the zone is confirmed, enter the trade S T R A T E G Y 3 Theory of ranges Principle of range confirmation Once the range is confirmed, enter the trade PRACTISE 4
42 TRUTH ABOUT CANDLESTICKS L I M I T E D U T I L I T Y 1 Candlesticks alone are very limited Many failures Require a strategy to combat this problem

43 Hammer Failure
44 Shooting Star Failure
45 Bearish and Bullish Engulfing Failure
46 TRUTH ABOUT CANDLESTICKS LIMITED UTILITY 1 Candlesticks alone are very limited Many failures Require a strategy to combat this problem STRATEGY 2 Reversal zone indication Principle of zonal confirmation Once the zone is confirmed, enter the trade S T R A T E G Y 3 Theory of ranges Principle of range confirmation Once the range is confirmed, enter the trade PRACTISE 4
47 TRUTH ABOUT CANDLESTICKS S T R A T E G Y 2 Reversal zone indication Principle of zonal confirmation Once the zone is confirmed, enter the trade
48 REVERSAL ZONE : The area where there is high chance of trend reversal Identify Wait & Confirm Enter the trade
49 IDENTIFY INDICATOR What does this indicate? Buyers overtake sellers or vice versa There is a change in market trend/momentum
50 IDENTIFY ZONE Creating a POSSIBLE zone of reversal Identify the candlestick indicator Hammer/Shooting star Mark the high and the lows Identify this area as possible zone of reversal
51 WAIT AND CONFIRM
52 ENTER A TRADE
53 TRUTH ABOUT CANDLESTICKS LIMITED UTILITY 1 Candlesticks alone are very limited Many failures Require a strategy to combat this problem STRATEGY 2 Reversal zone indication Principle of zonal confirmation Once the zone is confirmed, enter the trade S T R A T E G Y 3 Theory of ranges Principle of range confirmation Once the trend is confirmed, enter the trade PRACTISE 4
54 TRUTH ABOUT CANDLESTICKS S T R A T E G Y 3 Theory of ranges Principle of range confirmation Once the trend is confirmed, enter the trade
55 RANGING STRATEGY : The area where price moves aimlessly Identify an aimless market Wait & Confirm Enter the trade according to the trend
56 IDENTIFY INDICATOR What does this indicate? Market is uncertain No one is winning because nobody is fighting Everyone is waiting for a new momentum
57 IDENTIFY RANGING ZONE Creating a POSSIBLE ranging zone Identify the candlestick indicator Doji Mark the high and the lows Identify this area as possible ranging zone
58 WAIT AND CONFIRM
59 ENTER A TRADE
60 TRUTH ABOUT CANDLESTICKS LIMITED UTILITY 1 Candlesticks alone are very limited Many failures Require a strategy to combat this problem STRATEGY 2 Reversal zone indication Principle of zonal confirmation Once the zone is confirmed, enter the trade S T R A T E G Y 3 Theory of ranges Principle of range confirmation Once the trend is confirmed, enter the trade PRACTISE 4


61 TRUTH ABOUT CANDLESTICKS P R A C T I S E 4

62
63

64 Thank You
CANDLESTICK TRADING STRATEGIES
 TAFX CANDLESTICK TRADING STRATEGIES Disclaimer is in no way affiliated or representative of any other company, organisation, club or society, and the views presented are solely our own opinions. The author(s)
Use of Candlestick charts
 Use of Candlestick charts Candlestick chart was developed in 1700s in Japan by a man named Munehisa Homma, originally designed to trade rice futures in the 17th century, he invented a method to analyze
The Origins of Japanese Candlestick Charting
 The Origins of Japanese Candlestick Charting Munehisa Homma (1724-1803), also referred to as Sokyu Homma or Sokyu Honma, was a wealthy rice merchant and trader from Sakata, Japan who lived during during
The advantage of candlestick charts is the ability to highlight trend weakness and reversal signals that may not be apparent on a normal bar chart.
 CANDLESTICKS CHART Candlesticks contain the same data as a normal bar chart but highlight the relationship between opening and closing prices. The narrow stick represents the range of prices traded during
Candlestick Charting Quick Reference Guide
 Quickly and easily master the common Candlestick Charting patterns, with the Candlestick Charting Quick Reference Guide www.yourtradingcoach.com Because you d rather be trading for a living! Disclaimer
17 Money Making CandleStick Formations. you can use today in MarketClub
 17 Money Making CandleStick Formations you can use today in MarketClub Candlestick lines and charts Candlestick lines and charts -- traditional Japanese charts whose individual lines look like candles,
Equal open and close candles. ( known as doji candles ) Short body candles. Long body candles.
 Short body candles. Long body candles.") I have broken down the patterns into 3 categories: Equal open and close candles. ( known as doji candles ) Short body candles. Long body candles. Within these categories are both bullish reversal and bearish
I have broken down the patterns into 3 categories: Equal open and close candles. ( known as doji candles ) Short body candles. Long body candles. Within these categories are both bullish reversal and bearish
Japanese candlestick charts, discussed in Chapter 3, are an alternative
 The Visual Investor: How to Spot Market Trends, Second Edition By John J. Murphy Copyright by John J. Murphy. APPENDIX B Japanese Candlesticks Japanese candlestick charts, discussed in Chapter 3, are an
Frontline FX: Key Candlestick Strategies for Profitable FX Trades Candlestick Essentials and Beyond for FX
 Frontline FX: With Steve Nison, CMT President: Candlecharts.com Easy to Understand Early Reversals Safety First East + West All FX markets All Time Frames Accelerates Analysis Current volatility in FX
SPECIAL REPORT: CANDLESTICK PATTERN SUMMARY
 SPECIAL REPORT: CANDLESTICK PATTERN SUMMARY Louise Bedford This Special Report is an extract from the Candlestick Charting Home Study Course. It is a handy, quick reference guide that you can refer to
Candlestick Formations
 Presents Candlestick Formations By Russ Horn 1 RISK DISCLOSURE STATEMENT / DISCLAIMER AGREEMENT Trading any financial market involves risk. This report and all and any of its contents are neither a solicitation
Candlesticks by Louizos Alexander Louizos,
 CANDLESTICKS CHARTING As we mentioned before candlesticks behold some trend signals. In this chapter you will learn how to correctly evaluate trends using candlestick charts. Always remember: candlesticks
The Candlestick EXPRESS Class with Steve Nison
 With Steve Nison, CMT President: Candlecharts.com & the first to reveal candlesticks to the Western world Candlestick Charting Techniques Candles + Western Charting Tools Candles for Trade Management 1
BULLISH ENGULFING. Confirmation: Suggested. No. of Sticks: 2
 BULLISH ENGULFING Type: Reversal Medium Engulfing Pattern is a pattern characterized by a large white real body engulfing a preceding small black real body, which appears during a downtrend. The white
Steve Nison s Quick Start Guide to Correctly Using Candlesticks. WithSteve Nison, CMT President: Candlecharts.com
 WithSteve Nison, CMT President: Candlecharts.com 1 Benefits of Nison Candlesticks Any market Any time frame Simple to apply Safety first trading Early reversals for razor sharp entries and exits Profit
Basic Technical Analysis
 Basic Technical Analysis Disclaimer You may from time to time be provided with marketing material, investment & financial related information and reports, including but not limited to research reports
Prepared by Dave Forster April 9, 2016
 Candlesticks Prepared by Dave Forster April 9, 2016 Who is this guy? Methods of Technical Analysis Technical Analysis Inputs Price vs. Volume How I approach Charting How a Candlestick is Constructed Neutral
If I was to suggest that the charts you are looking at could be literally speaking to you, would you think I had gone slightly mad?
 Section Two Get to know your Charts Runtime 10min 37s So we now have covered off the basics, you ve got your platform open, charts at the ready & your raring to find out how all these traders make mega
The Stair Step Trade. Written By: Jason Ramus Copyright: 2017
 The Stair Step Trade Written By: Jason Ramus www.daytradingfearless.com Copyright: 2017 The Waterfall Introduction: Let me first say thank you for taking the time to read this amazing Book. I believe this
The secret meaning of Japanese Candlesticks
 The secret meaning of Japanese Candlesticks Part 2 By Vladimir Ribakov Creator of: www.vladimirforexsignals.com http://www.vladimirmarketsforecast.com/ www.forex-lst-syetem.com 2 nd edition, July 2013
Reversing candles. Three black crows. Exhibit 13.0 The three black crows pattern
 Three black crows Reversing candles Three black crows Exhibit 13.0 The three black crows pattern The pattern of upside gap two crows has two black candles gap upon the previous bullish real body. The three
An Investor's Guide to Candlestick Patterns
 An Investor's Guide to Candlestick Patterns By Gordon Kristopher Dec 12, 2014. 03:34 PM What Are Candlestick Patterns in Technical Analysis? Candlestick patterns In technical analysis, candlestick patterns
Chapter 3 THEORETICAL FRAMEWORK OF CANDLESTICK CHARTS. way about candlestick charts. The details of the same is shown as follows.
 Chapter 3 THEORETICAL FRAMEWORK OF CANDLESTICK CHARTS After the extensive review of literature, this chapter gives the conceptual and back ground of the technicalities of the study. The study covers about
Candles shed light on the market
 Candles shed light on the market By KIRA MCCAFFREY BRECHT When Steve Nison provided trade recommendations to brokers at Shearson Lehman Hutton, where he worked in the futures research department more than
The secrets of Candlestick Charts Unveiled
 NeW york ChICAgO LONDON DUBAI* TOkyO singapore sydney ADA The secrets of Candlestick Charts Unveiled By GFT Above all, Integrity. FUTURES FOREX CFDs Worldwide Leaders in Online Trading CD04U.041.102808
THE MAJOR CANDLESTICKS SIGNALS
 THE MAJOR CANDLESTICKS SIGNALS Profit BIG with Candlesticks Master these Major Candlestick Signals it you want to Master the Market. Copyright @ Stephen W. Bigalow May not be duplicated or distributed
by Ashwani Gujral Getting the best of East and West.
 by Ashwani Gujral Getting the best of East and West. Candlestick charting signals can be used in conjunction with Western indicators and the results achieved might be better than using them individually.
Candlesticks for Intraday and Swing Trading. Day 1 with Steve Nison, CMT President: Candlecharts.com
 Candlesticks for Intraday and Swing Trading Day 1 with Steve Nison, CMT President: Candlecharts.com Slide 2 Media Comments Japan's Candlesticks Light Traders' Path - Wall Street Journal Whether you day
FOLLOW THE SMART MONEY: LET CANDLES & VOLUME GUIDE THE WAY
 FOLLOW THE SMART MONEY: LET CANDLES & VOLUME GUIDE THE WAY January 2009 By Todd Krueger Compared to the common bar chart, candlestick charts are visually more capable of revealing the psychology and sentiment
Rick Saddler s Introduction to Trading with. Japanese Candlesticks
 Rick Saddler s with Japanese Candlesticks him Learning to Read Stock Charts With Japanese Candlesticks Rick Saddler Hit and Run Candlesticks Trading for Profits, LLC Phone: (417) - 848-3519 www.hitandruncandlesticks.com
THE POWER OF JAPANESE CANDLESTICK CHARTS
 THE POWER OF JAPANESE CANDLESTICK CHARTS Founded in 1807, John Wiley & Sons is the oldest independent publishing company in the United States. With offi ces in North America, Europe, Australia and Asia,
COPYRIGHTED MATERIAL. Candlesticks = Signals INTRODUCTION
 1 Candlesticks = Signals INTRODUCTION Traders and investors have been looking at charts for well over 85 years as Edwin Lefèvre wrote (1994, p. 61), I should say that a chart helps those who can read it
Candlestick Patterns (Every trader should know)
") Candlestick Patterns (Every trader should know) A doji represents an equilibrium between supply and demand, a tug of war that neither the bulls nor bears are winning. In the case of an uptrend, the bulls
Candlestick Patterns (Every trader should know) A doji represents an equilibrium between supply and demand, a tug of war that neither the bulls nor bears are winning. In the case of an uptrend, the bulls
Blips By David Duty CTA Price $99.00 Includes 60 Minutes of Video on Blips
 Blips By David Duty CTA www.commonsensecommodities.com Price $99.00 Includes 60 Minutes of Video on Blips Page 1 My name is David Duty and I m a CTA or Commodity Trading Advisor and I started trading commodities
Steve Nison s Candlecharts.com Secrets of Intraday Candlesticks for Day and Swing Traders
 With Steve Nison, CMT President: Candlecharts.com Legal Notice: This webcast and recording is Candlecharts.com and may not be copied, retransmitted, nor distributed in any manner whatsoever, including,
candelsticks 101 notes for web.notebook Candlesticks 101
 Candlesticks 101 1 The most basic skill needed for investing is... the ability to read a stock chart and then understand how that data can aid your investing success. One of the biggest mistakes of today's
Teodosi s Simple Oscillator-based System ( Forex Strategies Revealed - Simple System #8)
") ( Forex Strategies Revealed - Simple System #8) http://forex-strategies-revealed.com -DISCLAIMER- Virtually all of the information in this paper was sourced from the Forex Strategies Revealed website.
( Forex Strategies Revealed - Simple System #8) http://forex-strategies-revealed.com -DISCLAIMER- Virtually all of the information in this paper was sourced from the Forex Strategies Revealed website.
With Steve Nison, CMT President: Candlecharts.com
 With Steve Nison, CMT President: Candlecharts.com Legal Notice: This recording is Candlecharts.com and may not be copied, retransmitted, nor distributed in any manner whatsoever, including, but not limited
Findings. A Number of Candles Do Not Work as Expected
 1 Findings Arguably, you are reading the most important chapter because it discusses the discoveries I made about candles while researching this book. You may already know some of them, but the others
A study on one-day candlestick patterns in the Chinese stock market
 A study on one-day candlestick patterns in the Chinese stock market Abstract This study addresses the absence of research dealing with the profitability of one-day candlestick patterns in the Chinese stock
PCF s for TC2000 and TCNet Users 3 MAJOR SIGNALS. Volume II: The Hammer. The Shooting Star. The Harami
 PCF s for TC2000 and TCNet Users 3 MAJOR SIGNALS Volume II: The Hammer The Shooting Star The Harami A Candlestick Forum publication Years of Candlestick Analysis made available in concise formats. Information
Continued on the Next Page
 The Candlestick X-Ray Indicator Package: State-of-the-Art Pattern Detection Page 3 An Overview of the Candlestick X-Ray Features Page 5 The Complete List of Candlestick Patterns: 92 Fibonacci-Based Patterns
Candlestick Patterns And Trading Strategies
 We have made it easy for you to find a PDF Ebooks without any digging. And by having access to our ebooks online or by storing it on your computer, you have convenient answers with candlestick patterns
Telemet Orion v5.0x New Features
 Telemet Orion v5.0x New Features What are: Trendlines Point and Figure Charts Candlesticks Trendlines Eight new trendline studies are offered in Telemet Orion v5.0x. Access these with the pull down menu
A Statistical Analysis of the Predictive Power of Japanese Candlesticks
 Journal of International & Interdisciplinary Business Research Volume 5 Article 5 June 2018 A Statistical Analysis of the Predictive Power of Japanese Candlesticks Mohamed Jamaloodeen Georgia Gwinnett
Design and Implementation of Candlestick Chart Retrieval Algorithm for Predicting Stock Price Trend
 Design and Implementation of Candlestick Chart Retrieval Algorithm for Predicting Stock Price Trend Yoshihisa Udagawa Computer Science Department, Faculty of Engineering, Tokyo Polytechnic University Atsugi-city,
For next week support for the index is lies in the zone of and levels. The index can face its resistance at the level of &
 27 AUG 2018 GOLD: The bullion metal shows some strength and sustaining on major support level, after making the weekly low in previous trading week this week gold made big bullish candle on weekly chart.
Sentiment: The emotions, plans, or thought processes that lead up to the buying or selling of a security. I personally define sentiment this way.
 Hi Traders! I trust this article finds you well! I am sure many of you know my affinity for candlesticks and their importance as it relates to trading. A good saying to remember is, The stock market rewards
Chifbaw Oscillator User guide
 Chifbaw Oscillator User guide www.chifbaw.com Indicator and document revision: 1.2 Known bugs: -The alert function system gives sometimes a fake alert when the indicator is initiated on a given currency
Candlestick Charts: Your Complete Beginner's Guide To Reading Candlestick Charts Free Ebooks PDF
 Candlestick Charts: Your Complete Beginner's Guide To Reading Candlestick Charts Free Ebooks PDF Here's Exactly How To Read And Use Candlestick ChartsIf You're A Complete Beginner When It Comes To Candlestick
The Application of Japanese Candlestick Trading Strategies in Taiwan
 The Application of Japanese Candlestick Trading Strategies in Taiwan AUTHORS ARTICLE INFO JOURNAL FOUNDER YeongJia Goo DarHsin Chen YiWei Chang YeongJia Goo, DarHsin Chen and YiWei Chang (2007). The Application
This page intentionally left blank
 This page intentionally left blank Bloomberg Visual Guide to Candlestick Charting How to Use This Book The Bloomberg Visual series is meant to serve as the all-encompassing, yet easy-to-follow, guide on
Neural pattern recognition with self-organizing maps for efficient processing of forex market data streams
 Neural pattern recognition with self-organizing maps for efficient processing of forex market data streams Piotr Ciskowski, Marek Zaton Institute of Computer Engineering, Control and Robotics Wroclaw University
DOWNLOAD PDF ENCYCLOPEDIA OF CHART PATTERNS BULKOWSKI
 Chapter 1 : Encyclopedia of Candlestick Charts (ebook, PDF) von Thomas N. Bulkowski - Portofrei bei the In this revised and expanded second edition of the bestselling Encyclopedia of Chart Patterns, Thomas
Candlesticks. The Basics. Anatomy Of A Candlestick
 Candlesticks The Basics Japanese Candlesticks provide an excellent piece of the Technical Analysis puzzle. Each candle gives you the opening price, the low of the period, the high of the period and the
Candlestick Secrets for Profiting in Options Seminar Bonus module- Using NCS to set up option trades + Bouncing Ball strategy
 Bonus Module: Option trade setups using NCS+ The bouncing ball trade setup 1 For the FREE Ninja Trader (and other) platforms 2 Let NCS do the work for you! Save hours of research time Automatically find
High Profit Candlestick Patterns Stephen Bigalow
 We have made it easy for you to find a PDF Ebooks without any digging. And by having access to our ebooks online or by storing it on your computer, you have convenient answers with high profit candlestick
Copyright UCRP
 www.candlestickreversalpattern.com Copyright UCRP Introduction I don t want this book to have dozens of unnecessary pages of material that would do you no good in order to impress you. That s why I m going
Master Heikin-Ashi with this Trading Strategy
 Master Heikin-Ashi with this Trading Strategy Roman Sadowski - Humbletraders.com What is it? Heikin-Ashi chart looks like the candlestick chart but the method of calculation and plotting of the candles
Encyclopedia of Candlestick Charts
 Encyclopedia of Candlestick Charts Founded in 1807, John Wiley & Sons is the oldest independent publishing company in the United States. With offices in North America, Europe, Australia, and Asia, Wiley
TEB Candle Patterns. Here is a trade I took. when I see one as clear as this one I will take it and say thanks!
 TEB Candle Patterns 1st Candle Formation: 3 Candle Reversal with Pin Candle One of my favourite candle formations is the 3 candle reversal.. variation with a big pin candle (nose or tail)the Pin is the
This strategy will identify a break of a trend and take advantage of the movement to the opposite direction.
 Thanks for checking out the RSI 80-20 Trading Strategy, You are going to benefit from this strategy by learning to trade divergence, and finding a low risk way to sell near the top or buy near the bottom
Price Headley could be your personal trading coach!
 PRICE HEADLEY Price Headley could be your personal trading coach! Would you like to regularly talk with Price about the markets, stocks, options, superior indicators and most profitable methods? Would
The Candlestick Course
 A MARKETPLACE BOOK The Candlestick Course STEVE NISON John Wiley & Sons, Inc. The Candlestick Course John Wiley & Sons Founded in 1807, John Wiley & Sons is the oldest independent publishing company in
Applying Fuzzy Candlestick Pattern Ontology to Investment Knowledge Management
 Applying Fuzzy Candlestick Pattern Ontology to Investment Knowledge Management 307 Applying Fuzzy Candlestick Pattern Ontology to Investment Knowledge Management Chiung-Hon Leon Lee,*, Alan Liu 2 * Department
THE SECRET 01. Candlestick Charting. Strategies for Trading the Australian Markets. Louise Bedford. bjrlghtboolls
 THE SECRET 01 Candlestick Charting Strategies for Trading the Australian Markets Louise Bedford bjrlghtboolls First published in 2000 by Wrightbooks an imprint of John Wiley & Sons Australia, Ltd 42 McDougall
How to Read the Stock Chart
 How to Read the Stock Chart Stock charts There are several different kinds of charts: line chart OHLC chart candlestick Line charts The line chart is a single line with starting and ending points. The
21 CANDLESTICKS EVERY TRADER SHOULD KNOW. Dr. Melvin Pasternak
 21 CANDLESTICKS EVERY TRADER SHOULD KNOW Dr. Melvin Pasternak Working Title: 21 Candlesticks Every Trader Should Know Author: Dr. Melvin Pasternak Publisher: Marketplace Books Release Date: January 2006
Includes full colour charts throughout. CandLestICk. Clive Lambert. Charts. An introduction to using candlestick charts
 Includes full colour charts throughout CandLestICk Charts An introduction to using candlestick charts Clive Lambert Hh Contents Preface Foreword Introduction v vii ix 1 What Are Candlesticks? 1 A potted
To accomplish great things, we must not only act, but also dream; not only plan, but also believe! ~ A. France
 Fluidity Trader Chat Room w/cynthia E. - Wednesday, January 02, 2019: Page Begin Page End Chat Roll Time Wednesday 1.02.19 1 11 CENTRAL Time Zone 6:30 *** Hello Fluidity Team Traders Welcome! *** 6:30
FIBO-ABCD Strategy by John Tsai Version 1.0
 FIBO-ABCD Strategy by John Tsai 05.23.07 Version 1.0 The purpose of writing this ebook is to share the strategy I use to trade the Forex market. In this ebook, I will focus on EUR/USD pair all time, and
Candlestick Charts: Your Complete Beginner's Guide To Reading Candlestick Charts By Christopher Daniels
 Candlestick Charts: Your Complete Beginner's Guide To Reading Candlestick Charts By Christopher Daniels For seasoned traders, candlesticks hold no secrets. However, for beginners they can seem intimidating
Candlestick Charting
 Candlestick Charting FOR DUMmIES by Russell Rhoads Candlestick Charting FOR DUMmIES by Russell Rhoads Candlestick Charting For Dummies Published by Wiley Publishing, Inc. 111 River St. Hoboken, NJ 07030-5774
CANDLESTICK FORMATION PREDICTION
 CANDLESTICK FORMATION PREDICTION CharanSurya.M 1, SureshKumar.M 2, Gohulnath.M 3, Rathyin.V.R 4, Chaitanya.P 5, Ms.Sahaya Sakila.V 6 1 2 3 4 5 6 Assistant Professor, Department of Computer Science and
THE 4 PILLARS OF INVESTING Technicals: Module 2 TRANSCRIPTION
 THE 4 PILLARS OF INVESTING Technicals: Module 2 TRANSCRIPTION 2 The 4 Pillars of Investing A transcription of TECHNICALS MODULE 1 2 3 4 This is about change in trend, and if we want to follow the trend,
X-Man s Super Simple System
 X-Man s Super Simple System The 1H E/U method. 1. Timeframe 1 hour timeframe 2. Pair EUR/USD Once this pair is mastered then you can add another pair etc. 3. Main Indicators Synergy bars, Traders Dynamic
EURAUD, EURUSD, GBPUSD, GBPCHF
 30 pip method This is an amazing strategy which can net you 20 30 pips every day. Once you hit 20 pips for the day stop. Trade this strategy either 1 hour after the London Open or if you are in USA, trade
SRDC Level II. By Orange Roshan. Compiled and Edited by Henry S. (Hensch)
") SRDC Level II By Orange Roshan Compiled and Edited by Henry S. (Hensch) No part of this document may be reproduced, without written permission of the author. Copyright 2006 SRDC Level II Orange Roshan
SRDC Level II By Orange Roshan Compiled and Edited by Henry S. (Hensch) No part of this document may be reproduced, without written permission of the author. Copyright 2006 SRDC Level II Orange Roshan
Flavio Graziano & Aken Stienka: AKENDICATOR indicator tutorial AKENDICATOR TUTORIAL. Revolutionary indicator for Binary Options on Metatrader
 AKENDICATOR TUTORIAL Revolutionary indicator for Binary Options on Metatrader NOT REPAINT INDICATOR First of all, sorry for our not perfect English. However Akendicator is so easy and we hope you understand
Encyclopedia Of Candlestick Charts Wiley Trading
 ENCYCLOPEDIA OF CANDLESTICK CHARTS WILEY TRADING PDF - Are you looking for encyclopedia of candlestick charts wiley trading Books? Now, you will be happy that at this time encyclopedia of candlestick charts
FRESCO WHITEPAPER
 FRESCO WHITEPAPER 01.21.2018 CONTENTS I. Disclaimer II. About III. Art market today IV. Art market with Fresco V. TOKEN (FRES) distribution VI. Roadmap Disclaimer IMPORTANT NOTICE PLEASE READ THIS ENTIRE
Japanese Candlestick Trading Strategies: A Review of Literature
 Volume-03 Issue-07 July-2018 ISSN: 2455-3085 (Online) www.rrjournals.com [UGC Listed Journal] Japanese Candlestick Trading Strategies: A Review of Literature *1 Prasad Kulkarni & 2 Dr. Murugaiah V *1 Assistant
Encyclopedia Of Chart Patterns
 We have made it easy for you to find a PDF Ebooks without any digging. And by having access to our ebooks online or by storing it on your computer, you have convenient answers with encyclopedia of chart
Strategies for Profiting With Japanese Candlestick Charts (Wiley Trading)
") Strategies for Profiting With Japanese Candlestick Charts (Wiley Trading) Steve Nison Click here if your download doesn"t start automatically Strategies for Profiting With Japanese Candlestick Charts (Wiley
Strategies for Profiting With Japanese Candlestick Charts (Wiley Trading) Steve Nison Click here if your download doesn"t start automatically Strategies for Profiting With Japanese Candlestick Charts (Wiley
Global Equity Strategy
 Global 23 January 23 Equity Strategy Global Equity Strategy The Gamblers Fallacy Perhaps the most bizarre argument for being bullish is the belief that markets can t go down for four years in a row. This
DOWNLOAD OR READ : TWO CROWS ON THE SPIRIT HOUSE PDF EBOOK EPUB MOBI
 DOWNLOAD OR READ : TWO CROWS ON THE SPIRIT HOUSE PDF EBOOK EPUB MOBI Page 1 Page 2 two crows on the spirit house two crows on the pdf two crows on the spirit house The patterns data mining finds for those
Hilbert Sine Wave Don't Trade Cycles Without It!
 Hilbert Sine Wave Don't Trade Cycles Without It! Summary of what you'll learn in the feature article below: The Hilbert Sine Wave is a unique indicator it combines the best characteristics of an oscillator
Class 1: Introduction
 Japanese Trading Systems Class 1 Class 1: Introduction In This Lesson: History of Japanese Trading Candlesticks meet Clouds Introduction to Cloud Charts How to Build a Cloud PAGE 1 The Rich History of
The Secret to High Performance Trading. Discover Where your strength and weaknesses lie
 The Secret to High Performance Trading Discover Where your strength and weaknesses lie 1 Being able to perform as a winning trader requires action without a lot of theory and discussion start right now!
Copyright Page 1
 Copyright 2008 www.forex4noobs.com Page 1 ALL RIGHTS RESERVED. No part of this publication may be reproduced, stored in a retrieval system, or transmitted in any form or by any means, electronic, mechanical,
CORONA CHARTS EXPLAINED Copyright by eminiz.com Permission granted for free distribution
 CORONA CHARTS EXPLAINED Copyright 2007-08 by eminiz.com Permission granted for free distribution Corona Charts are the next generation of super indicators that present a multidimensional view of market
On the effectiveness of candlestick chart analysis for the Brazilian stock market
 Available online at www.sciencedirect.com ScienceDirect Procedia Computer Science 22 (2013 ) 1136 1145 17 th International Conference in Knowledge Based and Intelligent Inrmation and Engineering Systems
The Candlestick Course
 We have made it easy for you to find a PDF Ebooks without any digging. And by having access to our ebooks online or by storing it on your computer, you have convenient answers with the candlestick course.
I find my greatest pleasure, and so my reward, in the work that precedes what the world calls success. ~Thomas Edison
 Fluidity Trader Chat Room w/cynthia E. - Friday, January 18, 2019: Page Begin Page End Chat Roll Time Friday 1.18.19 1 11 CENTRAL Time Zone 6:30 *** Hello Fluidity Team Traders Welcome! *** 6:30 *** DAILY
Industry Insights Drilling Rigs Market HEADLINES. The number of stacked rigs has increased by 33% in the last year.
 ISSUE NO 1 January 217 Industry 217 Drilling Rigs Market HEADLINES The number of stacked rigs has increased by 33% in the last year. 4% Of the global fleet is now stacked with utilisation falling to 51%.
Overview of Venture Equity
 Overview of Venture Equity SVB Analytics Report 2017 Written by SVB Analytics: Steve Liu Managing Director sliu@svb.com Sean Lawson Senior Manager slawson2@svb.com Steven Pipp Senior Associate spipp@svb.com
Worldwide Market Forecasts for the Video Game and Interactive Entertainment Industry:
 DFC Intelligence DFC Intelligence Phone 858 780-9680 9320 Carmel Mountain Rd Fax 858-780-9671 Suite C www.dfcint.com San Diego, CA 92129 Worldwide Market Forecasts for the Video Game and Interactive Entertainment
Market Briefing: S&P 500 Bull & Bear Markets & Corrections
 Market Briefing: S&P 0 Bull & Bear Markets & Corrections August 21, 2015 Dr. Edward Yardeni 516-972-7683 eyardeni@ Joe Abbott 732-497-5306 jabbott@ Mali Quintana 4-664-1333 aquintana@ Please visit our
ifundtraders, LLC. * 2576 Broadway, #158, NY, NY, 10025
 The Elephant Walk: How to Spot and Profit from Big Institutional Buying and Selling ifundtraders, LLC. 2576 Broadway, #158, NY, NY, 10025 Biography 1984 began trading the markets at the tender age of 18
Wood Group Investor Briefing Q1 2016
 Wood Group Investor Briefing Q1 2016 Our business Wood Group is an international projects, production and specialist technical solutions provider with around $6bn sales and 36,000 employees. We are focused