The Stair Step Trade. Written By: Jason Ramus Copyright: 2017
|
|
|
- Elizabeth Shelton
- 6 years ago
- Views:
Transcription

1 The Stair Step Trade Written By: Jason Ramus Copyright: 2017
2 The Waterfall Introduction: Let me first say thank you for taking the time to read this amazing Book. I believe this Book will change the way you trade Stocks, Options, Futures and Forex markets. I have been a trader and teacher of the markets for over 15 years and run the website In my first few years, I was really struggling to understand how to make money in the stock market and devised a system. I have created 2 names for this trading strategy which are The Stair Step Trade but in this book we will call it the The Waterfall Trade which you will see later on why it was named as such. I am a chart trader technician and I use candlesticks for my trading. By using candlesticks, I feel I have an edge with the Waterfall system. You probably have seen other trader's screens with Bollinger bands, 20, 50, 200 moving day averages, pivot points, MACD, stochastic, volume, etc, and while you stand there looking at the screen I bet you are getting cross eyed because there is so much going on with the chart. This Book will show you a system where you have only candlesticks and volume, a very clean & simple chart. In those other charts you see with all the indicators, there is just way too much going on and I believe in one thing and that is Price Action. Price Action is where price has been and where the price is right now. All those other indicators are lagging and yes they look great at the end of the day on the chart and you think to yourself See, that was the perfect entry because it touched the lower Bollinger band and bounced off it, etc. Well, I am here to tell you that you must to be true to yourself and say while the price was touching the lower Bollinger band, did you really know that price would bounce higher there and be a perfect trade. I don't think you did, because in real time the bollinger bands were more than likely pointing lower and you thought there would be more downside. Now with price action all we really care about is price, so I don t need all of these pretty indicators. The main indicators I use for this trade is the candlesticks and sometimes volume bars.
3 The Waterfall / Stair Step Trade System: Okay, so let's get right down to the Waterfall trade system. First thing is you must know and understand what candlesticks are and how they function. Below is an example of how a candlestick works. The upper and lower shadows represent the high and low of that time period and the full bodies are where price opened and closed. If the candle is white or green, that is telling you that price opened lower and closed higher, and if it s a black or red candle the price opened higher and closed lower. That is Price action, telling you where price has been and where it currently is.
 is that price was not able to make a higher high above the previous candle.")
4 The way we use this in the Waterfall trade system is we look for a series of lower highs on each candle to its previous candle. What this is telling us is that during that time period (and we will use 5 min candles for all of the illustrations) is that price was not able to make a higher high above the previous candle. (Just a side note, the Waterfall trade system can be used on all timeframes) Think about this for a second, you have a flight of stairs going down and the top of each stair is lower than the previous stair then you are moving lower. We use this same method just with the highs of the candlesticks. See the chart below for an example. Waterfall - Every candlesticks high price is the same or lower than the previous candlestick high.
5 We will want to look for a trend on a minimum of 3 candlesticks that are making lower highs. When we find this trend we will want to start watching the current stocks candlestick to now make a new higher high over the previous candlestick's high, also know as a trend reversal. Now just a note that you may go 30 minutes to over an hour or two watching a stock's candlestick make lower highs but the longer it goes the better your chances of success are. The entry for this trade is when the current candle makes a higher high by just 1 penny above its previous candlestick's high. Here is an example, let's say there is a trend of 5 candles with a lower high from its previous candle and the last candles high was $48.93 but closed that time period at $48.85 we will want to place a buy stop market order at $48.94 because that will be 1 penny above the previous high and will signal a possible trend reversal to the upside. Let's break this down a little more, we will say the first candle makes a high of $50.20 then the 2nd candle makes a high of $ Then the 3rd candle makes a high of $49.35 and the 4th candle makes a high of $49.05 and the 5th candle makes a high of $ Below is a charts with this exact scenario and look at how price & candle react once the current candle breaks its previous high.

6 Waterfall Reversal: What is happening here behind the scenes is that traders are short the stock and have caught a trend to the downside, their thinking is that they will ride the price lower until the trend reverses. With a candle making a new higher high then its previous candle it is telling the shorts that the trend may be over and they will need to cover their short positions which means they need to buy back the stock and create a short cover rally. Now there are a few things to know about this trading system that will increase your odds of success and tricks that you will want to look for. You will want to look for hammers, doji s or bullish engulfing candlestick patterns during the sell off. I have found that the hammer candlestick is the most reliable and high probability of success to trade this system with. The hammer can potentially give about a 90% win rate. Below is a chart of each different candle trade reversal type.


7 Hammer Pattern: Bullish Engulfing Pattern:


8 Doji Long Pattern: Doji Short Pattern:
9 With these candlestick patterns you will want to look for small range candlestick bars for a better risk vs reward entry but it is not mandatory. The reason for this is because we want to limit our risk as much as we possibly can. In the next section we will discuss how to manage our risk and where to place our stop loss. Risk Management: I am a firm believer in risk management because being in this business for 10 plus years and seeing all I have seen the main reason most people fail is they have no risk management and no trade plan. What is risk management? It is being able to take a loss and protect your capital. I am not going to lie to you and say you will never have losing trades because you will, there is no perfect system out there. But the Waterfall trade system could produce about a 80% to 90% win rate if it is traded correctly. You must have a good risk management system in place to keep your profits and I often tell my clients It s ok to be wrong, just don t stay wrong. The beauty of this system is that price action tells you where to place your stop loss and you will always know how much you are risking on every trade and here is how. You are watching a nice waterfall and the candles are making lower highs, now the current candle has broke above its previous candles high by 1 penny and you have entered into the trade to the long side. The next step is to place your stop loss order 1-2 pennies below the previous candlestick's low.
10 Here is a candlestick pattern of a doji long entry where price broke above its previous candles high and the stop loss is placed below the previous candles low. (The entry is when the long green candle breaks above the green doji candle and the stop loss is 1-2 pennies below the green doji candle ). Doji Long Pattern: The main reason we go 1-2 pennies below the low is because stocks tend to do 3 things on pullbacks. The stock will either make a higher low, a double bottom where price will retest the low of the previous candle or thirdly will break down and make new lows and can keep going lower. All three of these are part of the cat and mouse game of the stock markets. Below is an example a waterfall trade where you had a low risk entry then the stock rallied and pulled back but never made a new low, as you can see if you stuck with the trade you would have made a nice profit.

11 The Entry Then Pull Back Trade: By placing your stop loss order this will protect your trading capital and make you a more disciplined trader. There are many techniques you can use when figuring out how many shares to trade and your profit targets, But the Stop Loss will always be the same below the previous candles low. Risk vs Reward Techniques: One technique that I use is to buy 1000 shares and will look for at least a one-to-one risk vs reward. Once you have a one-to-one reward you can take half the position off and move your stop loss to breakeven. By doing this you now have done two things, first is you have made this a guaranteed winning trade and second is you can let the remaining 500 shares run for a potential home run. Another technique is you can always look for a one-to-two risk vs reward which means that you can win only 50% of your trades and still be a profitable trader.

12 There are many other techniques you can use with exiting the trade with profits. Below is a chart of a short trade and how both of the techniques I mentioned above would have made you money. You could have done a plain one-to-two risk vs reward trade, or take half of the position off to lock in profits, move your stop to breakeven and then let your winning trade run. 1-To-2 Risk/Reward & Let The Trade Run Trade: How To Use Volume With the Waterfall Trade: Lets now look at how we can use volume to help us on our entry of the Waterfall trade system. Volume can be the key to knowing that our entry point is very near. Below are 2 examples of the Waterfall trade with volume as our guide.


13 Reversal Candlestick With Volume Spike: Low Risk Entry With Volume Spike:
14 Here is how we use volume to help us enter the trade, As the stock is selling off there is increasing volume but then there is a large volume spike that over shadows all the other volume bars. When we see a candle with large volume we will want to be watching closely for our entry on the stock. In the charts above you can see the stock had a nice hammer candle and a large volume spike at the same time. What the volume spike is telling you is that the stock is capitulating and that all the sellers may have sold and this is when the buyers may step in to buy the stock. Most people have been taught that when they see a stock is moving lower and also has large volume there will be more downside to the stock, but the professional trader looks at it as this is the time to be a buyer. The Reverse Waterfall A Short Trade: Let's take a look at another type of Waterfall Trade that you can trade, but this is going to be a trade to the downside. This trade is called shorting a stock, a lot of traders either do not know they can take a trade for the stock to go lower or are scared to short a stock. Let's look at this type of trade. The reverse waterfall trade is when a stock is in an uptrend and you want to short the stock and looking for the price of the stock to move lower. The rules are the same as for the entry and stop loss but instead of looking for lower highs and the reversal to the upside you will want to look at the lows of the candlesticks and look for the reversal at the highs of the uptrend. As the candlesticks are making higher lows from its previous candlestick you will want to take a short position when the current candle breaks below the previous candlestick's low. You will want to look for shooting stars (upside down hammer), bearish engulfing and doji candlestick patterns. You also will want to still watch the volume bars for the spike to the upside.

15 Below are 3 chart examples of the reverse Waterfall Trade. A Doji Reversal Candlestick Pattern: A Shooting Star Reversal Candlestick Pattern:

16 Reverse Waterfall Short Trade W/ Volume Spike: The Failed Waterfall Trade: I saved this one for last, As I have show you the waterfall trades all have worked out perfect and we're all winning trades. Now I also said at the beginning of this book you will have some losing trades and to protect our trading capital we MUST always use stop losses. This type of Waterfall trade has a lot higher probability of success then all of the other Waterfall trades I have shown you. What is it you ask, well let's look at it. The failed Waterfall trade is when there is a Waterfall, let's say to the downside, and the current candle breaks the previous candles high but then the stock has no follow through to the upside and then fails and make new lows. There are 2 things that can be done here.

17 You can reverse the trade a go short the stock or you can wait and look for a secondary waterfall and look for an entry to the long side again using the same rules as with the original Waterfall trade. The secondary long waterfall trigger has a much better success record. Below is a chart of how a secondary Waterfall trade works, also see how once you have a secondary Waterfall trigger to the long side the stock starts to make higher swing highs and higher swing lows. Failed Waterfall Trade:

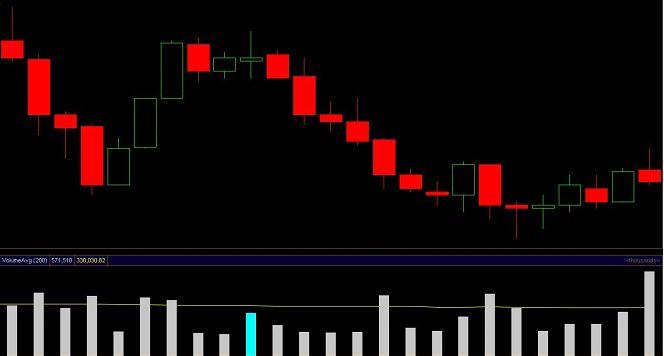
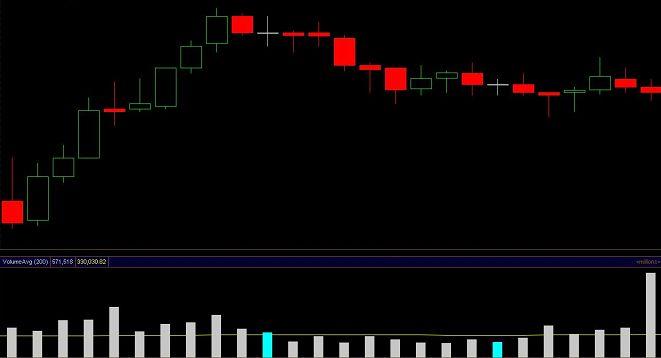
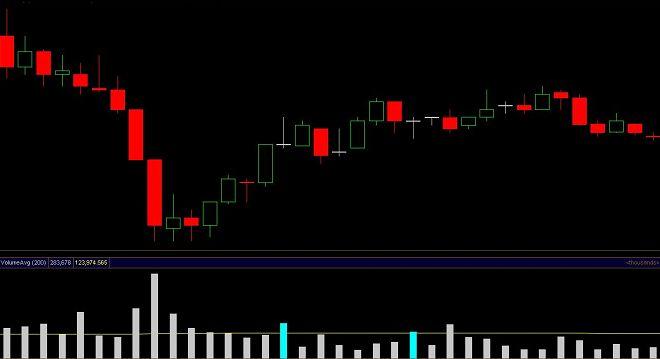
18 Chart Time to Train Your Eyes: Below are a few charts of waterfalls, reverse waterfalls and failed waterfalls all with volume. You will see how volume may give a signal and may not give a signal. The main point of this is to get your eyes trained of what to look for when looking at charts by focusing on how the candles will create a waterfall and how volume may work with the trade. I have purposely not shown you the entry s on the charts. This section is also to show how this trade works over and over to be a profitable trading system. I also recommend to look at past charts of your own.

19

20

21
22 Did you find the Waterfall & Reverse Waterfall Trades? I know some were hard to find but that is the way it works in live trading. Not all waterfalls will be clean and easy to see, but I am pretty sure you found the waterfalls because if you read and studied this book then you now have the tools to start trading and making money with low risk trades in the stock market. I want you to now turn on your trading platform, pull up your charts and create a watch list. Select the 15 minute time frame and start going through the charts looking for Waterfalls. The more you look at the charts for the Waterfalls the easier they get to spot. Don't forget to also look at volume and look for swing highs and low to spot trends to keep you in the trade longer. I hope this book opens a new style of trading to you and you become a very profitable trader from this system and as you can see all we care about is Price Action and Volume and not getting confused by 10 different indicators that are telling us 10 different things, also look at how clean the charts look and by the end of the day you will not be crossed eyed. One last thing is I think the 15 minute time frame is the best time frame to trade for Intra-day trading. Thank you and please visit my website for more trading information. I wish you the best success to your trading! - Jason Ramus
23 Disclaimer: DayTradingFearless.com makes no consideration toward your financial circumstances. All material presented within is not to be regarded as investment advice, but for general informational purposes only. Trading stocks, futures, forex, and options does involve risk, so caution must always be utilized. We cannot guarantee profits or freedom from loss. You assume the entire cost and risk of any trading you choose to undertake. You are solely responsible for making your own investment decisions. Hypothetical or simulated performance results have certain limitations. Past performance is not necessarily indicative of future results. No stock, futures, forex, or options method can guarantee profits. The risk of loss exists in stock, futures, forex, and options trading. DayTradingFearless.com, its owners, or its representatives are not registered as securities broker-dealers or investment advisors either with the U.S. Securities and Exchange Commission or with any state securities regulatory authority. We recommend consulting with a registered investment advisor, broker-dealer, and/or financial advisor. If you choose to invest with or without seeking advice from such an advisor or entity, then any consequences resulting from your investments are your sole responsibility.
Frontline FX: Key Candlestick Strategies for Profitable FX Trades Candlestick Essentials and Beyond for FX
 Frontline FX: With Steve Nison, CMT President: Candlecharts.com Easy to Understand Early Reversals Safety First East + West All FX markets All Time Frames Accelerates Analysis Current volatility in FX
Prepared by Dave Forster April 9, 2016
 Candlesticks Prepared by Dave Forster April 9, 2016 Who is this guy? Methods of Technical Analysis Technical Analysis Inputs Price vs. Volume How I approach Charting How a Candlestick is Constructed Neutral
Blips By David Duty CTA Price $99.00 Includes 60 Minutes of Video on Blips
 Blips By David Duty CTA www.commonsensecommodities.com Price $99.00 Includes 60 Minutes of Video on Blips Page 1 My name is David Duty and I m a CTA or Commodity Trading Advisor and I started trading commodities
If I was to suggest that the charts you are looking at could be literally speaking to you, would you think I had gone slightly mad?
 Section Two Get to know your Charts Runtime 10min 37s So we now have covered off the basics, you ve got your platform open, charts at the ready & your raring to find out how all these traders make mega
Steve Nison s Quick Start Guide to Correctly Using Candlesticks. WithSteve Nison, CMT President: Candlecharts.com
 WithSteve Nison, CMT President: Candlecharts.com 1 Benefits of Nison Candlesticks Any market Any time frame Simple to apply Safety first trading Early reversals for razor sharp entries and exits Profit
Candlestick Charting Quick Reference Guide
 Quickly and easily master the common Candlestick Charting patterns, with the Candlestick Charting Quick Reference Guide www.yourtradingcoach.com Because you d rather be trading for a living! Disclaimer
The secret meaning of Japanese Candlesticks
 The secret meaning of Japanese Candlesticks Part 2 By Vladimir Ribakov Creator of: www.vladimirforexsignals.com http://www.vladimirmarketsforecast.com/ www.forex-lst-syetem.com 2 nd edition, July 2013
Candlesticks by Louizos Alexander Louizos,
 CANDLESTICKS CHARTING As we mentioned before candlesticks behold some trend signals. In this chapter you will learn how to correctly evaluate trends using candlestick charts. Always remember: candlesticks
Candlesticks for Intraday and Swing Trading. Day 1 with Steve Nison, CMT President: Candlecharts.com
 Candlesticks for Intraday and Swing Trading Day 1 with Steve Nison, CMT President: Candlecharts.com Slide 2 Media Comments Japan's Candlesticks Light Traders' Path - Wall Street Journal Whether you day
CANDLESTICK TRADING STRATEGIES
 TAFX CANDLESTICK TRADING STRATEGIES Disclaimer is in no way affiliated or representative of any other company, organisation, club or society, and the views presented are solely our own opinions. The author(s)
Basic Technical Analysis
 Basic Technical Analysis Disclaimer You may from time to time be provided with marketing material, investment & financial related information and reports, including but not limited to research reports
Candlesticks: What they are and how to use them? NUS Investment Society Global Macro Department Gideon Wong & Devin Nathanael GM Research Analyst
 Candlesticks: What they are and how to use them? NUS Investment Society Global Macro Department Gideon Wong & Devin Nathanael GM Research Analyst Disclaimer NUS Invest is in no way affiliated or representative
Teodosi s Simple Oscillator-based System ( Forex Strategies Revealed - Simple System #8)
") ( Forex Strategies Revealed - Simple System #8) http://forex-strategies-revealed.com -DISCLAIMER- Virtually all of the information in this paper was sourced from the Forex Strategies Revealed website.
( Forex Strategies Revealed - Simple System #8) http://forex-strategies-revealed.com -DISCLAIMER- Virtually all of the information in this paper was sourced from the Forex Strategies Revealed website.
Candles shed light on the market
 Candles shed light on the market By KIRA MCCAFFREY BRECHT When Steve Nison provided trade recommendations to brokers at Shearson Lehman Hutton, where he worked in the futures research department more than
The Candlestick EXPRESS Class with Steve Nison
 With Steve Nison, CMT President: Candlecharts.com & the first to reveal candlesticks to the Western world Candlestick Charting Techniques Candles + Western Charting Tools Candles for Trade Management 1
Chifbaw Oscillator User guide
 Chifbaw Oscillator User guide www.chifbaw.com Indicator and document revision: 1.2 Known bugs: -The alert function system gives sometimes a fake alert when the indicator is initiated on a given currency
BULLISH ENGULFING. Confirmation: Suggested. No. of Sticks: 2
 BULLISH ENGULFING Type: Reversal Medium Engulfing Pattern is a pattern characterized by a large white real body engulfing a preceding small black real body, which appears during a downtrend. The white
Equal open and close candles. ( known as doji candles ) Short body candles. Long body candles.
 Short body candles. Long body candles.") I have broken down the patterns into 3 categories: Equal open and close candles. ( known as doji candles ) Short body candles. Long body candles. Within these categories are both bullish reversal and bearish
I have broken down the patterns into 3 categories: Equal open and close candles. ( known as doji candles ) Short body candles. Long body candles. Within these categories are both bullish reversal and bearish
Copyright UCRP
 www.candlestickreversalpattern.com Copyright UCRP Introduction I don t want this book to have dozens of unnecessary pages of material that would do you no good in order to impress you. That s why I m going
This strategy will identify a break of a trend and take advantage of the movement to the opposite direction.
 Thanks for checking out the RSI 80-20 Trading Strategy, You are going to benefit from this strategy by learning to trade divergence, and finding a low risk way to sell near the top or buy near the bottom
THE POWER OF JAPANESE CANDLESTICK CHARTS
 THE POWER OF JAPANESE CANDLESTICK CHARTS Founded in 1807, John Wiley & Sons is the oldest independent publishing company in the United States. With offi ces in North America, Europe, Australia and Asia,
Sentiment: The emotions, plans, or thought processes that lead up to the buying or selling of a security. I personally define sentiment this way.
 Hi Traders! I trust this article finds you well! I am sure many of you know my affinity for candlesticks and their importance as it relates to trading. A good saying to remember is, The stock market rewards
by Ashwani Gujral Getting the best of East and West.
 by Ashwani Gujral Getting the best of East and West. Candlestick charting signals can be used in conjunction with Western indicators and the results achieved might be better than using them individually.
X-Man s Super Simple System
 X-Man s Super Simple System The 1H E/U method. 1. Timeframe 1 hour timeframe 2. Pair EUR/USD Once this pair is mastered then you can add another pair etc. 3. Main Indicators Synergy bars, Traders Dynamic
Japanese candlestick charts, discussed in Chapter 3, are an alternative
 The Visual Investor: How to Spot Market Trends, Second Edition By John J. Murphy Copyright by John J. Murphy. APPENDIX B Japanese Candlesticks Japanese candlestick charts, discussed in Chapter 3, are an
Steve Nison s Candlecharts.com Secrets of Intraday Candlesticks for Day and Swing Traders
 With Steve Nison, CMT President: Candlecharts.com Legal Notice: This webcast and recording is Candlecharts.com and may not be copied, retransmitted, nor distributed in any manner whatsoever, including,
Use of Candlestick charts
 Use of Candlestick charts Candlestick chart was developed in 1700s in Japan by a man named Munehisa Homma, originally designed to trade rice futures in the 17th century, he invented a method to analyze
With Steve Nison, CMT President: Candlecharts.com
 With Steve Nison, CMT President: Candlecharts.com Legal Notice: This recording is Candlecharts.com and may not be copied, retransmitted, nor distributed in any manner whatsoever, including, but not limited
SPECIAL REPORT: CANDLESTICK PATTERN SUMMARY
 SPECIAL REPORT: CANDLESTICK PATTERN SUMMARY Louise Bedford This Special Report is an extract from the Candlestick Charting Home Study Course. It is a handy, quick reference guide that you can refer to
Chapter 3 THEORETICAL FRAMEWORK OF CANDLESTICK CHARTS. way about candlestick charts. The details of the same is shown as follows.
 Chapter 3 THEORETICAL FRAMEWORK OF CANDLESTICK CHARTS After the extensive review of literature, this chapter gives the conceptual and back ground of the technicalities of the study. The study covers about
Rick Saddler s Introduction to Trading with. Japanese Candlesticks
 Rick Saddler s with Japanese Candlesticks him Learning to Read Stock Charts With Japanese Candlesticks Rick Saddler Hit and Run Candlesticks Trading for Profits, LLC Phone: (417) - 848-3519 www.hitandruncandlesticks.com
I find my greatest pleasure, and so my reward, in the work that precedes what the world calls success. ~Thomas Edison
 Fluidity Trader Chat Room w/cynthia E. - Friday, January 18, 2019: Page Begin Page End Chat Roll Time Friday 1.18.19 1 11 CENTRAL Time Zone 6:30 *** Hello Fluidity Team Traders Welcome! *** 6:30 *** DAILY
Findings. A Number of Candles Do Not Work as Expected
 1 Findings Arguably, you are reading the most important chapter because it discusses the discoveries I made about candles while researching this book. You may already know some of them, but the others
The advantage of candlestick charts is the ability to highlight trend weakness and reversal signals that may not be apparent on a normal bar chart.
 CANDLESTICKS CHART Candlesticks contain the same data as a normal bar chart but highlight the relationship between opening and closing prices. The narrow stick represents the range of prices traded during
The Origins of Japanese Candlestick Charting
 The Origins of Japanese Candlestick Charting Munehisa Homma (1724-1803), also referred to as Sokyu Homma or Sokyu Honma, was a wealthy rice merchant and trader from Sakata, Japan who lived during during
THE MAJOR CANDLESTICKS SIGNALS
 THE MAJOR CANDLESTICKS SIGNALS Profit BIG with Candlesticks Master these Major Candlestick Signals it you want to Master the Market. Copyright @ Stephen W. Bigalow May not be duplicated or distributed
17 Money Making CandleStick Formations. you can use today in MarketClub
 17 Money Making CandleStick Formations you can use today in MarketClub Candlestick lines and charts Candlestick lines and charts -- traditional Japanese charts whose individual lines look like candles,
COPYRIGHTED MATERIAL. Candlesticks = Signals INTRODUCTION
 1 Candlesticks = Signals INTRODUCTION Traders and investors have been looking at charts for well over 85 years as Edwin Lefèvre wrote (1994, p. 61), I should say that a chart helps those who can read it
BunnyGirl s FAQ Rev 1.0
 BunnyGirl s FAQ Rev 1.0 Basic Entry & Exit Conditions Pairs traded EUR-USD, GBP-USD & USD-CHF. EUR-JPY traded sometimes. Other pairs have been tested for this strategy but were deemed not suitable. 5 WMA
Candlestick Secrets for Profiting in Options Seminar Bonus module- Using NCS to set up option trades + Bouncing Ball strategy
 Bonus Module: Option trade setups using NCS+ The bouncing ball trade setup 1 For the FREE Ninja Trader (and other) platforms 2 Let NCS do the work for you! Save hours of research time Automatically find
EURAUD, EURUSD, GBPUSD, GBPCHF
 30 pip method This is an amazing strategy which can net you 20 30 pips every day. Once you hit 20 pips for the day stop. Trade this strategy either 1 hour after the London Open or if you are in USA, trade
Reversing candles. Three black crows. Exhibit 13.0 The three black crows pattern
 Three black crows Reversing candles Three black crows Exhibit 13.0 The three black crows pattern The pattern of upside gap two crows has two black candles gap upon the previous bullish real body. The three
Copyright Page 1
 Copyright 2008 www.forex4noobs.com Page 1 ALL RIGHTS RESERVED. No part of this publication may be reproduced, stored in a retrieval system, or transmitted in any form or by any means, electronic, mechanical,
Okay Jason, for the first question, can you please tell me what your background is and how you began your career as a trader?
 Jason Fielder is a 10 year trading veteran, and though you ve never seen him on CNBC, he s become a widely followed and respected trading guru because he s helped thousands of traders with the systems
For next week support for the index is lies in the zone of and levels. The index can face its resistance at the level of &
 27 AUG 2018 GOLD: The bullion metal shows some strength and sustaining on major support level, after making the weekly low in previous trading week this week gold made big bullish candle on weekly chart.
The secrets of Candlestick Charts Unveiled
 NeW york ChICAgO LONDON DUBAI* TOkyO singapore sydney ADA The secrets of Candlestick Charts Unveiled By GFT Above all, Integrity. FUTURES FOREX CFDs Worldwide Leaders in Online Trading CD04U.041.102808
 Risk Disclosure Trading foreign exchange on margin carries a high level of risk, and may not be suitable for all investors. The high degree of leverage can work against you as well as for you. Before deciding
Tradeciety.com. My Trading Strategy. Name: Date:
 My Trading Strategy Name: Date: I am serious about my trading. I have enough and I want to see better results. I am committed to making a change and start treat trading like a profession. I am committed
The thing always happens that you really believe in; and the belief in a thing makes it happen. ~ Frank Lloyd Wright
 Fluidity Trader Chat Room w/cynthia E. - Monday, November 26, 2018: Page Begin Page End Chat Roll Time Monday 11.26.18 1 10 CENTRAL Time Zone 6:30 *** Hello Fluidity Team Traders Welcome! *** 6:30 ***
THE 4 PILLARS OF INVESTING Technicals: Module 2 TRANSCRIPTION
 THE 4 PILLARS OF INVESTING Technicals: Module 2 TRANSCRIPTION 2 The 4 Pillars of Investing A transcription of TECHNICALS MODULE 1 2 3 4 This is about change in trend, and if we want to follow the trend,
To accomplish great things, we must not only act, but also dream; not only plan, but also believe! ~ A. France
 Fluidity Trader Chat Room w/cynthia E. - Wednesday, January 02, 2019: Page Begin Page End Chat Roll Time Wednesday 1.02.19 1 11 CENTRAL Time Zone 6:30 *** Hello Fluidity Team Traders Welcome! *** 6:30
Candlestick Formations
 Presents Candlestick Formations By Russ Horn 1 RISK DISCLOSURE STATEMENT / DISCLAIMER AGREEMENT Trading any financial market involves risk. This report and all and any of its contents are neither a solicitation
Hilbert Sine Wave Don't Trade Cycles Without It!
 Hilbert Sine Wave Don't Trade Cycles Without It! Summary of what you'll learn in the feature article below: The Hilbert Sine Wave is a unique indicator it combines the best characteristics of an oscillator
FOLLOW THE SMART MONEY: LET CANDLES & VOLUME GUIDE THE WAY
 FOLLOW THE SMART MONEY: LET CANDLES & VOLUME GUIDE THE WAY January 2009 By Todd Krueger Compared to the common bar chart, candlestick charts are visually more capable of revealing the psychology and sentiment
The Secret to High Performance Trading. Discover Where your strength and weaknesses lie
 The Secret to High Performance Trading Discover Where your strength and weaknesses lie 1 Being able to perform as a winning trader requires action without a lot of theory and discussion start right now!
High Profit Candlestick Patterns Stephen Bigalow
 We have made it easy for you to find a PDF Ebooks without any digging. And by having access to our ebooks online or by storing it on your computer, you have convenient answers with high profit candlestick
TEB Candle Patterns. Here is a trade I took. when I see one as clear as this one I will take it and say thanks!
 TEB Candle Patterns 1st Candle Formation: 3 Candle Reversal with Pin Candle One of my favourite candle formations is the 3 candle reversal.. variation with a big pin candle (nose or tail)the Pin is the
S&P-PRO FXSUNDAYS GAME CHANGER
 S&P-PRO FXSUNDAYS GAME CHANGER Introduction We have called this course Game Changer because thats exactly what it is, for any level of Trader this will change the way you trade, will help you make the
Candlestick Patterns (Every trader should know)
") Candlestick Patterns (Every trader should know) A doji represents an equilibrium between supply and demand, a tug of war that neither the bulls nor bears are winning. In the case of an uptrend, the bulls
Candlestick Patterns (Every trader should know) A doji represents an equilibrium between supply and demand, a tug of war that neither the bulls nor bears are winning. In the case of an uptrend, the bulls
My Top Strategies with LT Pulse and LT Gamma Confirmation. LIVE Class with Alessio Rastani
 My Top Strategies with LT Pulse and LT Gamma Confirmation LIVE Class with Alessio Rastani I did this trade during the filming of documentary The Agenda For Today 1. Introduction To LT Pulse 2. My Favourite
Candlestick Charts: Your Complete Beginner's Guide To Reading Candlestick Charts By Christopher Daniels
 Candlestick Charts: Your Complete Beginner's Guide To Reading Candlestick Charts By Christopher Daniels For seasoned traders, candlesticks hold no secrets. However, for beginners they can seem intimidating
SRDC Level II. By Orange Roshan. Compiled and Edited by Henry S. (Hensch)
") SRDC Level II By Orange Roshan Compiled and Edited by Henry S. (Hensch) No part of this document may be reproduced, without written permission of the author. Copyright 2006 SRDC Level II Orange Roshan
SRDC Level II By Orange Roshan Compiled and Edited by Henry S. (Hensch) No part of this document may be reproduced, without written permission of the author. Copyright 2006 SRDC Level II Orange Roshan
PCF s for TC2000 and TCNet Users 3 MAJOR SIGNALS. Volume II: The Hammer. The Shooting Star. The Harami
 PCF s for TC2000 and TCNet Users 3 MAJOR SIGNALS Volume II: The Hammer The Shooting Star The Harami A Candlestick Forum publication Years of Candlestick Analysis made available in concise formats. Information
Continued on the Next Page
 The Candlestick X-Ray Indicator Package: State-of-the-Art Pattern Detection Page 3 An Overview of the Candlestick X-Ray Features Page 5 The Complete List of Candlestick Patterns: 92 Fibonacci-Based Patterns
An Investor's Guide to Candlestick Patterns
 An Investor's Guide to Candlestick Patterns By Gordon Kristopher Dec 12, 2014. 03:34 PM What Are Candlestick Patterns in Technical Analysis? Candlestick patterns In technical analysis, candlestick patterns
Tommy s Revenge Trading Method 2.0 (Module 2 Part 1)
") 1 Welcome to Tommy s Revenge Module 2 Part 1. I m not sure how many parts will be in this section. I think if we participate together we can make a module that s beneficial to all of us Be aware that anything
1 Welcome to Tommy s Revenge Module 2 Part 1. I m not sure how many parts will be in this section. I think if we participate together we can make a module that s beneficial to all of us Be aware that anything
Why trot when you can gallop? 8 questions to ask broker-dealers when considering independence.
 Why trot when you can gallop? 8 questions to ask broker-dealers when considering independence. Increasingly, advisors are contemplating becoming independent business owners to experience the freedom and
C. Henning Thank you, Jane. I m happy to say that Susan is a Wi$e Up
 Wi$e Up Teleconference Call June 30, 2005 Buying and Selling a Home Speaker #1 remarks Susan Garcia C. Henning Thank you, Jane. I m happy to say that Susan is a Wi$e Up mentor with our program in Charleston,
candelsticks 101 notes for web.notebook Candlesticks 101
 Candlesticks 101 1 The most basic skill needed for investing is... the ability to read a stock chart and then understand how that data can aid your investing success. One of the biggest mistakes of today's
Neural pattern recognition with self-organizing maps for efficient processing of forex market data streams
 Neural pattern recognition with self-organizing maps for efficient processing of forex market data streams Piotr Ciskowski, Marek Zaton Institute of Computer Engineering, Control and Robotics Wroclaw University
Candlestick Charts: Your Complete Beginner's Guide To Reading Candlestick Charts Free Ebooks PDF
 Candlestick Charts: Your Complete Beginner's Guide To Reading Candlestick Charts Free Ebooks PDF Here's Exactly How To Read And Use Candlestick ChartsIf You're A Complete Beginner When It Comes To Candlestick
EP72: Market Trends.
 EP72: Market Trends Announcer: We love to hold on to this belief that discretion is really important and I think a lot of the times we like to hold on to that is because it gives us that easy out. It gives
Chapter 14. The Top 10 Trading Mistakes
 Chapter 14 The Top 10 Trading Mistakes I want to talk about the top ten common mistakes that most Forex traders make and more importantly how you can overcome them. So let s start right at the very beginning.
Candlestick Patterns And Trading Strategies
 We have made it easy for you to find a PDF Ebooks without any digging. And by having access to our ebooks online or by storing it on your computer, you have convenient answers with candlestick patterns
Flavio Graziano & Aken Stienka: AKENDICATOR indicator tutorial AKENDICATOR TUTORIAL. Revolutionary indicator for Binary Options on Metatrader
 AKENDICATOR TUTORIAL Revolutionary indicator for Binary Options on Metatrader NOT REPAINT INDICATOR First of all, sorry for our not perfect English. However Akendicator is so easy and we hope you understand
The MoneyShow Las Vegas, May 14-17, 2012
 The MoneyShow Las Vegas, May 14-17, 2012 Thursday, May 17, 2012 Fibonacci Time and Price Analysis on Stocks and ETFs Carolyn Boroden, Commodity Trading Advisor and Technical Analyst Synchronicity Market
FIBO-ABCD Strategy by John Tsai Version 1.0
 FIBO-ABCD Strategy by John Tsai 05.23.07 Version 1.0 The purpose of writing this ebook is to share the strategy I use to trade the Forex market. In this ebook, I will focus on EUR/USD pair all time, and
DOWNLOAD PDF ENCYCLOPEDIA OF CHART PATTERNS BULKOWSKI
 Chapter 1 : Encyclopedia of Candlestick Charts (ebook, PDF) von Thomas N. Bulkowski - Portofrei bei the In this revised and expanded second edition of the bestselling Encyclopedia of Chart Patterns, Thomas
9 Financially Devastating Mistakes Most Option Traders Make
 9 Financially Devastating Mistakes Most Option Traders Make Fortunes have been made and lost in the world of option trading. And those fortunes that were lost may very well have been lost due to making
Telemet Orion v5.0x New Features
 Telemet Orion v5.0x New Features What are: Trendlines Point and Figure Charts Candlesticks Trendlines Eight new trendline studies are offered in Telemet Orion v5.0x. Access these with the pull down menu
We're excited to announce that the next JAFX Trading Competition will soon be live!
 COMPETITION Competition Swipe - Version #1 Title: Know Your Way Around a Forex Platform? Here s Your Chance to Prove It! We're excited to announce that the next JAFX Trading Competition will soon be live!
Master Heikin-Ashi with this Trading Strategy
 Master Heikin-Ashi with this Trading Strategy Roman Sadowski - Humbletraders.com What is it? Heikin-Ashi chart looks like the candlestick chart but the method of calculation and plotting of the candles
Stay connected to out investing posts and videos - visit and Like Facebook.com/MakeExtraMoney
 FREE Tool - Type in Zip Code - Find CASH Home Buyers Get free access to it plus free training on how to profit bringing them Foreclosure deals by going here... CashFlowInstitute.com Stay connected to out
A study on one-day candlestick patterns in the Chinese stock market
 A study on one-day candlestick patterns in the Chinese stock market Abstract This study addresses the absence of research dealing with the profitability of one-day candlestick patterns in the Chinese stock
Encyclopedia of Candlestick Charts
 Encyclopedia of Candlestick Charts Founded in 1807, John Wiley & Sons is the oldest independent publishing company in the United States. With offices in North America, Europe, Australia, and Asia, Wiley
ifundtraders, LLC. * 2576 Broadway, #158, NY, NY, 10025
 The Elephant Walk: How to Spot and Profit from Big Institutional Buying and Selling ifundtraders, LLC. 2576 Broadway, #158, NY, NY, 10025 Biography 1984 began trading the markets at the tender age of 18
Appointment Setter Training
 Appointment Setter Training Setting appointments on the phone is a numbers game. Numbers never lie and as long you follow our script and personalize it to you, you will have success. Consistency is the
The Application of Japanese Candlestick Trading Strategies in Taiwan
 The Application of Japanese Candlestick Trading Strategies in Taiwan AUTHORS ARTICLE INFO JOURNAL FOUNDER YeongJia Goo DarHsin Chen YiWei Chang YeongJia Goo, DarHsin Chen and YiWei Chang (2007). The Application
COLD CALLING SCRIPTS
 COLD CALLING SCRIPTS Portlandrocks Hello and welcome to this portion of the WSO where we look at a few cold calling scripts to use. If you want to learn more about the entire process of cold calling then
Would You Like To Earn $1000 s With The Click Of A Button?
 Would You Like To Earn $1000 s With The Click Of A Button? (Follow these easy step by step instructions and you will) This e-book is for the USA and AU (it works in many other countries as well) To get
Candlesticks. The Basics. Anatomy Of A Candlestick
 Candlesticks The Basics Japanese Candlesticks provide an excellent piece of the Technical Analysis puzzle. Each candle gives you the opening price, the low of the period, the high of the period and the
Chapter 1 DISGRUNTLED. The following situation happens quite often to many traders. Look it over and see if it has been happening to you:
 PART I 14 15 Chapter 1 DISGRUNTLED The following situation happens quite often to many traders. Look it over and see if it has been happening to you: You have been faithfully following your trading plan
The 7 Habits of Highly Successful Investors
 The 7 Habits of Highly Successful Investors Over the years I ve got to hear the investment insights, secrets and tips from some of South Africa s best investors. Simply put: They do things differently
Would You Like To Earn $1000 s With The Click Of A Button?
 Would You Like To Earn $1000 s With The Click Of A Button? (Follow these easy step by step instructions and you will) This e-book is for the USA and AU (it works in many other countries as well) To get
21 CANDLESTICKS EVERY TRADER SHOULD KNOW. Dr. Melvin Pasternak
 21 CANDLESTICKS EVERY TRADER SHOULD KNOW Dr. Melvin Pasternak Working Title: 21 Candlesticks Every Trader Should Know Author: Dr. Melvin Pasternak Publisher: Marketplace Books Release Date: January 2006
THE 4 PILLARS OF INVESTING Risk Management: Module 2 TRANSCRIPTION
 THE 4 PILLARS OF INVESTING Risk Management: Module 2 TRANSCRIPTION 2 The 4 Pillars of Investing A transcription of RISK MANAGEMENT MODULE 1 2 3 4 This is the basic risk management toolbox. When you get
THE ROSEN MARKET TIMING LETTER
 THE ROSEN MARKET TIMING LETTER PRECIOUS METALS - FOREX - STOCK INDICES - COMMODITIES Time is more important than price; when time is up price will reverse. W.D.Gann RONALD L. ROSEN January, 2013 rrosen5@tampabay.rr.com
How You Can Save Hundreds Of Dollars, Make Better Use Of Your Time, And Remain Goal Oriented When Buying And Using The Right Mindmap Software Tool
 How You Can Save Hundreds Of Dollars, Make Better Use Of Your Time, And Remain Goal Oriented When Buying And Using The Right Mindmap Software Tool By Arjen ter Hoeve www.mindmapsunleashed.com MINDMAP SOFTWARE
Would You Like To Earn $1000 s With The Click Of A Button?
 Would You Like To Earn $1000 s With The Click Of A Button? (Follow these easy step by step instructions and you will) - 100% Support and all questions answered! - Make financial stress a thing of the past!
FRESCO WHITEPAPER
 FRESCO WHITEPAPER 01.21.2018 CONTENTS I. Disclaimer II. About III. Art market today IV. Art market with Fresco V. TOKEN (FRES) distribution VI. Roadmap Disclaimer IMPORTANT NOTICE PLEASE READ THIS ENTIRE