Remote Sensing. The following figure is grey scale display of SPOT Panchromatic without stretching.
|
|
|
- Johnathan Tucker
- 5 years ago
- Views:
Transcription
1 Remote Sensing Objectives This unit will briefly explain display of remote sensing image, geometric correction, spatial enhancement, spectral enhancement and classification of remote sensing image. At the end of the unit, the student will understand the basic steps to process the remotely sensed images and will be prepared to learn theoretical and practical digital image processing steps in the intermediated level. 1. Image Display Each pixel is characterised by a DN (digital number) value, one for each multispectral channel. Pixels of single channel can be displayed on the screen as greyscale display. The lowest DN values are displayed as black, increasing DN values are displayed as shades of grey between black and white, and the highest DN values as white. The following figure is grey scale display of SPOT Panchromatic without stretching. If the DN value range is more than the full dynamic range of the output display, the apparent spatial and radiometric resolution of data in display is reduced. If the DN value range of image is less than the dynamic range of output display, contrast stretching improves image contrast by expanding the range of DNs to utilize the full dynamic range of the display. If the data have a normal distribution, a linear stretch from the data set's minimum to its maximum DN value is sufficient. The following figure is grey scale display of SPOT Panchromatic with stretching. Remotesensing.doc
.")
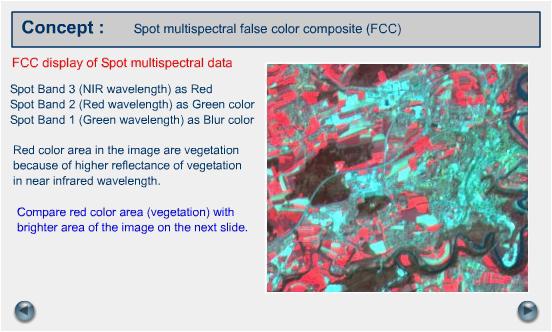
2 A non-linear stretch is required if the data are skewed or have a multi-modal distribution. Three data channels from multispectral data can be simultaneously displayed as composite by displaying one channel in each of the display monitor's three-color guns (red, green, blue). The resulting RGB composite will appear as a color image in which colors are in direct proportional to the grey scale ranges of each channel. If the visible red wavelength (channel) is assigned as red color, visible green wavelength (channel) is assigned as green color and visible blue wavelength (channel) is assigned as blue color, the composite is essentially natural color image. For example Landsat TM bands 3,2,1 as R, G, B). All other compositions are called false color composite (FCC). The following figure illustrates the False Color Composite of a SPOT Image. Remotesensing.doc
3 2. Registration and Rectification Remotely sensed data contained both systematic and non-systematic geometric errors. Systematic errors are caused due to the sensor platform ephemeris and internal sensor distortion. The systematic errors can be corrected using the data from platform ephemeris and knowledge of internal sensor distortion and are corrected by the satellite-operating agency. Non-systematic errors are caused due to the scale changes, which result from sensor platform departments from its normal altitude especially in aircraft platform. Moreover, one sensor axis is usually maintained normal to the earth's surface and the other parallel to the sensor platform's direction of travel. If the sensor surface departs from this attitude (roll, pitch and yaw), nonsystematic geometric error occurred. Non-systematic errors can only be corrected to a certain level of acceptable accuracy with a sufficient number of ground control points (GCP). GCP is a point on the earth surface where both image coordinate (row and column) and map coordinates (feet or meter or degrees in latitude and longitude) can be identified. Most often used geometric corrections are rectification and registration. Without geometric correction, the images can't be used in GIS as they are not georeferenced. Rectification is a process of transforming the image coordinates (measured in rows and columns) to a planimetric coordinate system or map coordinates (measured in degree of latitude and longitude, feet or meter) using an nth order polynomial. Therefore, each pixel in an image is at its correct location. Rectification process involves spatial interpolation, correlating a number of pixel coordinates on an image to corresponding ground control points (GCP) on the map. Rectification is often referred to as an image-to-map registration. Moreover, rectification process involves intensity interpolation or resampling, determining the bright value to be assigned to the new rectified pixel at the new location and at the new grid system. Rectification involves calculation of the root mean square error (RMS) for each of the ground control points. Normally RMS error less than or equal to 0.5 pixel or 0.5 of spatial resolution is acceptable. Remotesensing.doc

4 The following figure illustrates the result of geometric correction. 3. Contextual Enhancement Remotesensing.doc
 as the number of changes in brightness value per unit distance of any particular part of the image.")
5 Contextual enhancements through filtering, modify pixel values based on the values of surrounding pixels in order to reduce the noise or enhance desire characteristics of an image by emphasizing or de-emphasising data of various spatial frequency. Spatial frequency is defined by Jensen (1986) as the number of changes in brightness value per unit distance of any particular part of the image. The following image illustrates the edge detected SPOT Panchromatic Image. The following image illustrates the edge enhanced SPOT Panchromatic image. Compare with SPOT Image grey scale display with stretch, especially edge of land cover facets. Remotesensing.doc

6 The following image illustrates the Average Filtered SPOT Panchromatic. The image becomes blur and smoother. The noise strip at the bottom of the image becomes less significant. 4. Multi-band transformation Multi-band transformation techniques are used to create the new band for enhancing a feature of interest, reducing data size and redundancy. Multi-band transformation techniques require more Remotesensing.doc
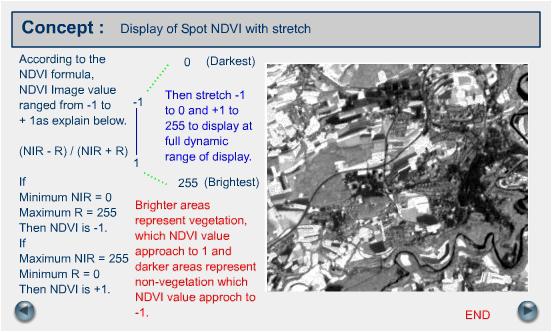
7 than one band of data and used the spectral information found in the multiple databands. Indices and principle component analyses are Multi-band transformation techniques. Indices Indices are simple algebraic operations applied to digital numbers or values of pixels in more than one band. The following indices are commonly used. Indices Equation Vegetation Difference Index IR-R (infrared - red) Vegetation Index IR/R (infrared/red) Normalized Difference Vegetation Index (NDVI) (IR-R)/(IR+R) Iron Oxide Ratio R/B (red/blue) Clay Mineral Mid-infrared ( micron) / Mid-infrared ( micron) Ferrous Mineral Mid-infrared ( micron) /Near Infrared Mineral composite Mid-infrared ( micron) / Mid-infrared ( micron) Mid-infrared ( micron) /Near Infrared Red / Blue Hydrothermal composite Mid-infrared ( micron) / Mid-infrared ( micron) Red / Blue Near Infrared / Red The following SPOT images illustrate the False Colour Composite and NDVI. The brighter values represent the vegetation, agriculture and forest area and the darker values represent the no vegetation area, road, harvested agriculture field, river and urban area. Remotesensing.doc
8 Remotesensing.doc

9 Principal Component Analyses Principal Component Analyses (PCA) is a multivariate statistical method that transforms multivariate data from different spectral channels into a series of statistically uncorrelated component. It allows redundant data to be compacted into fewer bands. Therefore the dimensionality of data is reduced. The bands of PCA are often more interpretable than the source data. The number of input bands and the number of output PCA bands are the same. For Example, the Landsat TM has 7 Bands. Therefore, the output of PCA of TM data will be 7 PCA bands. The following images are output of Principal Component Analyses (PCA), PCA1, PCA2 and PCA3 of Landsat TM over Fribourg. PCA1 and PCA2 are complementary. PCA3 has lesser information. RGB composite of PCA1, 2,3 is very informative. Principal Component - 1 Principal Component - 2 Remotesensing.doc


10 Principal Component -3 Remotesensing.doc

11 Principal Component 123 RGB Composite The first principal component measures the highest variation within the dataset. The second principal component describes the largest amount of variance in the data that is not already described by the first principal component. The first 3 PCA bands account for a high proportion of the variance in the data, almost 100%. Therefore PCA is useful to compress the data into fewer bands and reduce the data redundancy. PCA bands with least variance (6th and 7th Principal components in TM example) may show the regular noise in the data and may also show some useful information. The RGB composite of the first, second and third principal component is very effective to interpret different land covers especially in the field, because it allows to view almost 100% of the information with a single composite image. Conveniency to the limited display capacity. 5. Classification The classification process of an image is to group into a finite number of useful classes or categories of information based on the spectral values of pixels. If a pixel satisfies certain set of criteria or decision rule, this pixel is assigned to the information class that corresponds to that criteria. An example of classified image is land cover map, showing forest, agriculture, pasture, urban etc. Remotesensing.doc

12 Human eyes performed pattern recognition by viewing natural color or false color composite image, grey scale image, spatially and spectrally enhanced image. Then human brain automatically sorts certain colors and textures into categories. However, computer system or image processing system must be trained to recognize these patterns in the image. Training can be performed by unsupervised or supervised methods. Unsupervised method or Clustering Unsupervised clustering is an automated method to group pixels with similar spectral characteristics into clusters based on the statistical patterns that are inherent in the data. Then the analyst or interpreter assigns these clusters to a categorical name. A standard clustering technique is iterative self-organizing data analysis (ISODATA). Unsupervised clustering requires no prior knowledge of the area. However, interpretation of output classes or clusters may be difficult. Some clusters may be merged or split, as number of unique groups in an image is unknown. The following figure illustrates the result of unsupervised clustering of Landsat TM (Band 1 to 5). The area is near Fribourg. There are 10 clusters in the image. Clusters are illustrated in different colors. The analyst will assign meaningful information class to these clusters. The analyst may merge or split and recode some clusters in order to assign meaningful information class. Moreover, the analyst may repeat the isodata clustering process with different number of output classes depending on his field experience and ground truth knowledge. Remotesensing.doc
13 Supervised Training The analyst selects the pixels (group of pixels) that represent patterns or land cover features recognized by the analyst or identified from other sources such as maps, ground truth data and aerial photos, by drawing the polygon around these groups of pixels. These selected groups of pixels are called training samples. It is very important to select the groups of pixels as training samples that represent a particular pattern or land cover feature. Impure training samples result misclassification. However, the variability of the samples should express the hue spectral variability of each category. Knowledge of the study area, knowledge of the data and the categories desired, is required before selecting the training samples and classification. Signatures The result of unsupervised and supervised training sampling is signatures. The parametric signature is based on the statistical parameters (e.g. mean, standard deviation) of the pixels of a cluster or a training sample (in the image) that corresponds to a class or a category of land cover (on the ground). The parametric signatures are used with statistically based classifiers or decision rules that assign the pixels in an image file to a class or category of land cover. Decision Rules After the signature are created for each pattern or land cover class, the pixels in the image are sorted into classes based on the signature by using a classification decision rule. The decision rule is mathematical and statistical algorithms to sort out the pixels into different classes or categories. The most frequently used decision rules are parallelepiped, minimum distance, Mahalanobis distance and maximum likelihood. Remotesensing.doc

14 Remotesensing.doc
GE 113 REMOTE SENSING
 GE 113 REMOTE SENSING Topic 8. Image Classification and Accuracy Assessment Lecturer: Engr. Jojene R. Santillan jrsantillan@carsu.edu.ph Division of Geodetic Engineering College of Engineering and Information
The techniques with ERDAS IMAGINE include:
 The techniques with ERDAS IMAGINE include: 1. Data correction - radiometric and geometric correction 2. Radiometric enhancement - enhancing images based on the values of individual pixels 3. Spatial enhancement
Introduction to Remote Sensing Part 1
 Introduction to Remote Sensing Part 1 A Primer on Electromagnetic Radiation Digital, Multi-Spectral Imagery The 4 Resolutions Displaying Images Corrections and Enhancements Passive vs. Active Sensors Radar
Satellite image classification
 Satellite image classification EG2234 Earth Observation Image Classification Exercise 29 November & 6 December 2007 Introduction to the practical This practical, which runs over two weeks, is concerned
CanImage. (Landsat 7 Orthoimages at the 1: Scale) Standards and Specifications Edition 1.0
 Standards and Specifications Edition 1.0") CanImage (Landsat 7 Orthoimages at the 1:50 000 Scale) Standards and Specifications Edition 1.0 Centre for Topographic Information Customer Support Group 2144 King Street West, Suite 010 Sherbrooke, QC
CanImage (Landsat 7 Orthoimages at the 1:50 000 Scale) Standards and Specifications Edition 1.0 Centre for Topographic Information Customer Support Group 2144 King Street West, Suite 010 Sherbrooke, QC
Land Cover Analysis to Determine Areas of Clear-cut and Forest Cover in Olney, Montana. Geob 373 Remote Sensing. Dr Andreas Varhola, Kathry De Rego
 1 Land Cover Analysis to Determine Areas of Clear-cut and Forest Cover in Olney, Montana Geob 373 Remote Sensing Dr Andreas Varhola, Kathry De Rego Zhu an Lim (14292149) L2B 17 Apr 2016 2 Abstract Montana
Image interpretation and analysis
 Image interpretation and analysis Grundlagen Fernerkundung, Geo 123.1, FS 2014 Lecture 7a Rogier de Jong Michael Schaepman Why are snow, foam, and clouds white? Why are snow, foam, and clouds white? Today
An Approach To Correct The Raw FCC Satellite Image
 An Approach To Correct The Raw FCC Satellite Image Satyanarayana Chanagala 1, Yedukondalu Kamatham 2, Appala Raju Uppala 3 And Najeemulla Baig 4 Dept. of ECE, ACE Engineering College, Ankushapur, Ghatkesar
Module 11 Digital image processing
 Introduction Geo-Information Science Practical Manual Module 11 Digital image processing 11. INTRODUCTION 11-1 START THE PROGRAM ERDAS IMAGINE 11-2 PART 1: DISPLAYING AN IMAGE DATA FILE 11-3 Display of
Image interpretation I and II
 Image interpretation I and II Looking at satellite image, identifying different objects, according to scale and associated information and to communicate this information to others is what we call as IMAGE
Remote Sensing. Odyssey 7 Jun 2012 Benjamin Post
 Remote Sensing Odyssey 7 Jun 2012 Benjamin Post Definitions Applications Physics Image Processing Classifiers Ancillary Data Data Sources Related Concepts Outline Big Picture Definitions Remote Sensing
Remote sensing image correction
 Remote sensing image correction Introductory readings remote sensing http://www.microimages.com/documentation/tutorials/introrse.pdf 1 Preprocessing Digital Image Processing of satellite images can be
RGB colours: Display onscreen = RGB
 RGB colours: http://www.colorspire.com/rgb-color-wheel/ Display onscreen = RGB DIGITAL DATA and DISPLAY Myth: Most satellite images are not photos Photographs are also 'images', but digital images are
Application of GIS to Fast Track Planning and Monitoring of Development Agenda
 Application of GIS to Fast Track Planning and Monitoring of Development Agenda Radiometric, Atmospheric & Geometric Preprocessing of Optical Remote Sensing 13 17 June 2018 Outline 1. Why pre-process remotely
F2 - Fire 2 module: Remote Sensing Data Classification
 F2 - Fire 2 module: Remote Sensing Data Classification F2.1 Task_1: Supervised and Unsupervised classification examples of a Landsat 5 TM image from the Center of Portugal, year 2005 F2.1 Task_2: Burnt
Digital Image Processing
 Digital Image Processing 1 Patrick Olomoshola, 2 Taiwo Samuel Afolayan 1,2 Surveying & Geoinformatic Department, Faculty of Environmental Sciences, Rufus Giwa Polytechnic, Owo. Nigeria Abstract: This paper
Enhancement of Multispectral Images and Vegetation Indices
 Enhancement of Multispectral Images and Vegetation Indices ERDAS Imagine 2016 Description: We will use ERDAS Imagine with multispectral images to learn how an image can be enhanced for better interpretation.
Present and future of marine production in Boka Kotorska
 Present and future of marine production in Boka Kotorska First results from satellite remote sensing for the breeding areas of filter feeders in the Bay of Kotor INTRODUCTION Environmental monitoring is
Important Missions. weather forecasting and monitoring communication navigation military earth resource observation LANDSAT SEASAT SPOT IRS
 Fundamentals of Remote Sensing Pranjit Kr. Sarma, Ph.D. Assistant Professor Department of Geography Mangaldai College Email: prangis@gmail.com Ph. No +91 94357 04398 Remote Sensing Remote sensing is defined
GEOG432: Remote sensing Lab 3 Unsupervised classification
 GEOG432: Remote sensing Lab 3 Unsupervised classification Goal: This lab involves identifying land cover types by using agorithms to identify pixels with similar Digital Numbers (DN) and spectral signatures
GEOG432: Remote sensing Lab 3 Unsupervised classification
 GEOG432: Remote sensing Lab 3 Unsupervised classification Goal: This lab involves identifying land cover types by using agorithms to identify pixels with similar Digital Numbers (DN) and spectral signatures
Urban Classification of Metro Manila for Seismic Risk Assessment using Satellite Images
 Urban Classification of Metro Manila for Seismic Risk Assessment using Satellite Images Fumio YAMAZAKI/ yamazaki@edm.bosai.go.jp Hajime MITOMI/ mitomi@edm.bosai.go.jp Yalkun YUSUF/ yalkun@edm.bosai.go.jp
Image Fusion. Pan Sharpening. Pan Sharpening. Pan Sharpening: ENVI. Multi-spectral and PAN. Magsud Mehdiyev Geoinfomatics Center, AIT
 1 Image Fusion Sensor Merging Magsud Mehdiyev Geoinfomatics Center, AIT Image Fusion is a combination of two or more different images to form a new image by using certain algorithms. ( Pohl et al 1998)
Remote Sensing Instruction Laboratory
 Laboratory Session 217513 Geographic Information System and Remote Sensing - 1 - Remote Sensing Instruction Laboratory Assist.Prof.Dr. Weerakaset Suanpaga Department of Civil Engineering, Faculty of Engineering
CHARACTERISTICS OF REMOTELY SENSED IMAGERY. Spatial Resolution
 CHARACTERISTICS OF REMOTELY SENSED IMAGERY Spatial Resolution There are a number of ways in which images can differ. One set of important differences relate to the various resolutions that images express.
Remote sensing in archaeology from optical to lidar. Krištof Oštir ModeLTER Scientific Research Centre of the Slovenian Academy of Sciences and Arts
 Remote sensing in archaeology from optical to lidar Krištof Oštir ModeLTER Scientific Research Centre of the Slovenian Academy of Sciences and Arts Introduction Optical remote sensing Systems Search for
Unsupervised Classification
 Unsupervised Classification Using SAGA Tutorial ID: IGET_RS_007 This tutorial has been developed by BVIEER as part of the IGET web portal intended to provide easy access to geospatial education. This tutorial
REMOTE SENSING. Topic 10 Fundamentals of Digital Multispectral Remote Sensing MULTISPECTRAL SCANNERS MULTISPECTRAL SCANNERS
 REMOTE SENSING Topic 10 Fundamentals of Digital Multispectral Remote Sensing Chapter 5: Lillesand and Keifer Chapter 6: Avery and Berlin MULTISPECTRAL SCANNERS Record EMR in a number of discrete portions
Basic Digital Image Processing. The Structure of Digital Images. An Overview of Image Processing. Image Restoration: Line Drop-outs
 Basic Digital Image Processing A Basic Introduction to Digital Image Processing ~~~~~~~~~~ Rev. Ronald J. Wasowski, C.S.C. Associate Professor of Environmental Science University of Portland Portland,
GE 113 REMOTE SENSING. Topic 7. Image Enhancement
 GE 113 REMOTE SENSING Topic 7. Image Enhancement Lecturer: Engr. Jojene R. Santillan jrsantillan@carsu.edu.ph Division of Geodetic Engineering College of Engineering and Information Technology Caraga State
Remote Sensing Platforms
 Types of Platforms Lighter-than-air Remote Sensing Platforms Free floating balloons Restricted by atmospheric conditions Used to acquire meteorological/atmospheric data Blimps/dirigibles Major role - news
TEMPORAL ANALYSIS OF MULTI EPOCH LANDSAT GEOCOVER IMAGES IN ZONGULDAK TESTFIELD
 TEMPORAL ANALYSIS OF MULTI EPOCH LANDSAT GEOCOVER IMAGES IN ZONGULDAK TESTFIELD Şahin, H. a*, Oruç, M. a, Büyüksalih, G. a a Zonguldak Karaelmas University, Zonguldak, Turkey - (sahin@karaelmas.edu.tr,
Mod. 2 p. 1. Prof. Dr. Christoph Kleinn Institut für Waldinventur und Waldwachstum Arbeitsbereich Fernerkundung und Waldinventur
 Histograms of gray values for TM bands 1-7 for the example image - Band 4 and 5 show more differentiation than the others (contrast=the ratio of brightest to darkest areas of a landscape). - Judging from
Spatial Analyst is an extension in ArcGIS specially designed for working with raster data.
 Spatial Analyst is an extension in ArcGIS specially designed for working with raster data. 1 Do you remember the difference between vector and raster data in GIS? 2 In Lesson 2 you learned about the difference
Preparing Remote Sensing Data for Natural Resources Mapping (image enhancement, rectifications )
") Preparing Remote Sensing Data for Natural Resources Mapping (image enhancement, rectifications ) Why is this important What are the major approaches Examples of digital image enhancement Follow up exercises
Preparing Remote Sensing Data for Natural Resources Mapping (image enhancement, rectifications ) Why is this important What are the major approaches Examples of digital image enhancement Follow up exercises
Environmental Remote Sensing GEOG 2021
 Environmental Remote Sensing GEOG 2021 Lecture 2 Image display and enhancement 2 Image Display and Enhancement Purpose visual enhancement to aid interpretation enhancement for improvement of information
Image Band Transformations
 Image Band Transformations Content Band math Band ratios Vegetation Index Tasseled Cap Transform Principal Component Analysis (PCA) Decorrelation Stretch Image Band Transformation Purposes Image band transforms
Spectral Signatures. Vegetation. 40 Soil. Water WAVELENGTH (microns)
") Spectral Signatures % REFLECTANCE VISIBLE NEAR INFRARED Vegetation Soil Water.5. WAVELENGTH (microns). Spectral Reflectance of Urban Materials 5 Parking Lot 5 (5=5%) Reflectance 5 5 5 5 5 Wavelength (nm)
Spectral Signatures % REFLECTANCE VISIBLE NEAR INFRARED Vegetation Soil Water.5. WAVELENGTH (microns). Spectral Reflectance of Urban Materials 5 Parking Lot 5 (5=5%) Reflectance 5 5 5 5 5 Wavelength (nm)
Augment the Spatial Resolution of Multispectral Image Using PCA Fusion Method and Classified It s Region Using Different Techniques.
 Augment the Spatial Resolution of Multispectral Image Using PCA Fusion Method and Classified It s Region Using Different Techniques. Israa Jameel Muhsin 1, Khalid Hassan Salih 2, Ebtesam Fadhel 3 1,2 Department
OPTICAL RS IMAGE INTERPRETATION
 1 OPTICAL RS IMAGE INTERPRETATION Lecture 8 Visible Middle Infrared Image Bands 2 Data Processing Information data in a useable form Interpretation Visual AI (Machine learning) Recognition, Classification,
INTEGRATED DEM AND PAN-SHARPENED SPOT-4 IMAGE IN URBAN STUDIES
 INTEGRATED DEM AND PAN-SHARPENED SPOT-4 IMAGE IN URBAN STUDIES G. Doxani, A. Stamou Dept. Cadastre, Photogrammetry and Cartography, Aristotle University of Thessaloniki, GREECE gdoxani@hotmail.com, katerinoudi@hotmail.com
* Tokai University Research and Information Center
 Effects of tial Resolution to Accuracies for t HRV and Classification ta Haruhisa SH Kiyonari i KASA+, uji, and Toshibumi * Tokai University Research and nformation Center 2-28-4 Tomigaya, Shi, T 151,
8. EDITING AND VIEWING COORDINATES, CREATING SCATTERGRAMS AND PRINCIPAL COMPONENTS ANALYSIS
 Editing and viewing coordinates, scattergrams and PCA 8. EDITING AND VIEWING COORDINATES, CREATING SCATTERGRAMS AND PRINCIPAL COMPONENTS ANALYSIS Aim: To introduce you to (i) how you can apply a geographical
Saturation And Value Modulation (SVM): A New Method For Integrating Color And Grayscale Imagery
: A New Method For Integrating Color And Grayscale Imagery") 87 Saturation And Value Modulation (SVM): A New Method For Integrating Color And Grayscale Imagery By David W. Viljoen 1 and Jeff R. Harris 2 Geological Survey of Canada 615 Booth St. Ottawa, ON, K1A 0E9
87 Saturation And Value Modulation (SVM): A New Method For Integrating Color And Grayscale Imagery By David W. Viljoen 1 and Jeff R. Harris 2 Geological Survey of Canada 615 Booth St. Ottawa, ON, K1A 0E9
An Introduction to Geomatics. Prepared by: Dr. Maher A. El-Hallaq خاص بطلبة مساق مقدمة في علم. Associate Professor of Surveying IUG
 An Introduction to Geomatics خاص بطلبة مساق مقدمة في علم الجيوماتكس Prepared by: Dr. Maher A. El-Hallaq Associate Professor of Surveying IUG 1 Airborne Imagery Dr. Maher A. El-Hallaq Associate Professor
LANDSAT-SPOT DIGITAL IMAGES INTEGRATION USING GEOSTATISTICAL COSIMULATION TECHNIQUES
 LANDSAT-SPOT DIGITAL IMAGES INTEGRATION USING GEOSTATISTICAL COSIMULATION TECHNIQUES J. Delgado a,*, A. Soares b, J. Carvalho b a Cartographical, Geodetical and Photogrammetric Engineering Dept., University
Sommersemester Prof. Dr. Christoph Kleinn Institut für Waldinventur und Waldwachstum Arbeitsbereich Fernerkundung und Waldinventur.
 Basics of Remote Sensing Some literature references Franklin, SE 2001 Remote Sensing for Sustainable Forest Management Lewis Publishers 407p Lillesand, Kiefer 2000 Remote Sensing and Image Interpretation
CHANGE DETECTION BY THE IR-MAD AND KERNEL MAF METHODS IN LANDSAT TM DATA COVERING A SWEDISH FOREST REGION
 CHANGE DETECTION BY THE IR-MAD AND KERNEL MAF METHODS IN LANDSAT TM DATA COVERING A SWEDISH FOREST REGION Allan A. NIELSEN a, Håkan OLSSON b a Technical University of Denmark, National Space Institute
How to Access Imagery and Carry Out Remote Sensing Analysis Using Landsat Data in a Browser
 How to Access Imagery and Carry Out Remote Sensing Analysis Using Landsat Data in a Browser Including Introduction to Remote Sensing Concepts Based on: igett Remote Sensing Concept Modules and GeoTech
Evaluating the Effects of Shadow Detection on QuickBird Image Classification and Spectroradiometric Restoration
 Remote Sens. 2013, 5, 4450-4469; doi:10.3390/rs5094450 Article OPEN ACCESS Remote Sensing ISSN 2072-4292 www.mdpi.com/journal/remotesensing Evaluating the Effects of Shadow Detection on QuickBird Image
APCAS/10/21 April 2010 ASIA AND PACIFIC COMMISSION ON AGRICULTURAL STATISTICS TWENTY-THIRD SESSION. Siem Reap, Cambodia, April 2010
 APCAS/10/21 April 2010 Agenda Item 8 ASIA AND PACIFIC COMMISSION ON AGRICULTURAL STATISTICS TWENTY-THIRD SESSION Siem Reap, Cambodia, 26-30 April 2010 The Use of Remote Sensing for Area Estimation by Robert
University of Technology Building & Construction Department / Remote Sensing & GIS lecture
 8. Image Enhancement 8.1 Image Reduction and Magnification. 8.2 Transects (Spatial Profile) 8.3 Spectral Profile 8.4 Contrast Enhancement 8.4.1 Linear Contrast Enhancement 8.4.2 Non-Linear Contrast Enhancement
USING LANDSAT MULTISPECTRAL IMAGES IN ANALYSING FOREST VEGETATION
 Technical Sciences 243 USING LANDSAT MULTISPECTRAL IMAGES IN ANALYSING FOREST VEGETATION Teodor TODERA teotoderas@yahoo.com Traian CR CEA traiancracea@yahoo.com Alina NEGOESCU alina.negoescu@yahoo.com
A (very) brief introduction to Remote Sensing: From satellites to maps!
 brief introduction to Remote Sensing: From satellites to maps!") Spatial Data Analysis and Modeling for Agricultural Development, with R - Workshop A (very) brief introduction to Remote Sensing: From satellites to maps! Earthlights DMSP 1994-1995 https://wikimedia.org/
Spatial Data Analysis and Modeling for Agricultural Development, with R - Workshop A (very) brief introduction to Remote Sensing: From satellites to maps! Earthlights DMSP 1994-1995 https://wikimedia.org/
Student Name: Maitha Aylan Almuhairi. ID number: Instructor: Dr. M. M. Yagoub
 United Arab Emirates University Humanities & Social Science Collage Geography Department GIS Program Student Name: Maitha Aylan Almuhairi ID number: 200503003 Instructor: Dr. M. M. Yagoub Fall 2008 Content
Introduction to Remote Sensing
 Introduction to Remote Sensing Spatial, spectral, temporal resolutions Image display alternatives Vegetation Indices Image classifications Image change detections Accuracy assessment Satellites & Air-Photos
GEOI 313: Digital Image Processing - I
 GEOI 33: Digital Image Processing - I Module I: Image Representation Image Display For remote sensing computing, the image display is especially important because the analyst must be able to examine images
GIS Data Collection. Remote Sensing
 GIS Data Collection Remote Sensing Data Collection Remote sensing Introduction Concepts Spectral signatures Resolutions: spectral, spatial, temporal Digital image processing (classification) Other systems
Keywords: Agriculture, Olive Trees, Supervised Classification, Landsat TM, QuickBird, Remote Sensing.
 Classification of agricultural fields by using Landsat TM and QuickBird sensors. The case study of olive trees in Lesvos island. Christos Vasilakos, University of the Aegean, Department of Environmental
Remote Sensing Platforms
 Remote Sensing Platforms Remote Sensing Platforms - Introduction Allow observer and/or sensor to be above the target/phenomena of interest Two primary categories Aircraft Spacecraft Each type offers different
Hyperspectral image processing and analysis
 Hyperspectral image processing and analysis Lecture 12 www.utsa.edu/lrsg/teaching/ees5083/l12-hyper.ppt Multi- vs. Hyper- Hyper-: Narrow bands ( 20 nm in resolution or FWHM) and continuous measurements.
Interpreting land surface features. SWAC module 3
 Interpreting land surface features SWAC module 3 Interpreting land surface features SWAC module 3 Different kinds of image Panchromatic image True-color image False-color image EMR : NASA Echo the bat
Classification in Image processing: A Survey
 Classification in Image processing: A Survey Rashmi R V, Sheela Sridhar Department of computer science and Engineering, B.N.M.I.T, Bangalore-560070 Department of computer science and Engineering, B.N.M.I.T,
Lecture 13: Remotely Sensed Geospatial Data
 Lecture 13: Remotely Sensed Geospatial Data A. The Electromagnetic Spectrum: The electromagnetic spectrum (Figure 1) indicates the different forms of radiation (or simply stated light) emitted by nature.
Exercise 4-1 Image Exploration
 Exercise 4-1 Image Exploration With this exercise, we begin an extensive exploration of remotely sensed imagery and image processing techniques. Because remotely sensed imagery is a common source of data
In late April of 1986 a nuclear accident damaged a reactor at the Chernobyl nuclear
 CHERNOBYL NUCLEAR POWER PLANT ACCIDENT Long Term Effects on Land Use Patterns Project Introduction: In late April of 1986 a nuclear accident damaged a reactor at the Chernobyl nuclear power plant in Ukraine.
GE 113 REMOTE SENSING
 GE 113 REMOTE SENSING Topic 5. Introduction to Digital Image Interpretation and Analysis Lecturer: Engr. Jojene R. Santillan jrsantillan@carsu.edu.ph Division of Geodetic Engineering College of Engineering
366 Glossary. Popular method for scale drawings in a computer similar to GIS but without the necessity for spatial referencing CEP
 366 Glossary GISci Glossary ASCII ASTER American Standard Code for Information Interchange Advanced Spaceborne Thermal Emission and Reflection Radiometer Computer Aided Design Circular Error Probability
IMPROVEMENT IN THE DETECTION OF LAND COVER CLASSES USING THE WORLDVIEW-2 IMAGERY
 IMPROVEMENT IN THE DETECTION OF LAND COVER CLASSES USING THE WORLDVIEW-2 IMAGERY Ahmed Elsharkawy 1,2, Mohamed Elhabiby 1,3 & Naser El-Sheimy 1,4 1 Dept. of Geomatics Engineering, University of Calgary
AUTOMATIC DETECTION OF HEDGES AND ORCHARDS USING VERY HIGH SPATIAL RESOLUTION IMAGERY
 AUTOMATIC DETECTION OF HEDGES AND ORCHARDS USING VERY HIGH SPATIAL RESOLUTION IMAGERY Selim Aksoy Department of Computer Engineering, Bilkent University, Bilkent, 06800, Ankara, Turkey saksoy@cs.bilkent.edu.tr
INTRODUCTION TO REMOTE SENSING AND ITS APPLICATIONS
 INTRODUCTION TO REMOTE SENSING AND ITS APPLICATIONS Prof. Dr. Abudeif A. Bakheit Geology Department. Faculty of Science Assiut University This representation was prepared from different power point representations
CLASSIFICATION OF VEGETATION AREA FROM SATELLITE IMAGES USING IMAGE PROCESSING TECHNIQUES ABSTRACT
 CLASSIFICATION OF VEGETATION AREA FROM SATELLITE IMAGES USING IMAGE PROCESSING TECHNIQUES Arpita Pandya Research Scholar, Computer Science, Rai University, Ahmedabad Dr. Priya R. Swaminarayan Professor
Remote Sensing And Gis Application in Image Classification And Identification Analysis.
 Quest Journals Journal of Research in Environmental and Earth Science Volume 3~ Issue 5 (2017) pp: 55-66 ISSN(Online) : 2348-2532 www.questjournals.org Research Paper Remote Sensing And Gis Application
Module 3 Introduction to GIS. Lecture 8 GIS data acquisition
 Module 3 Introduction to GIS Lecture 8 GIS data acquisition GIS workflow Data acquisition (geospatial data input) GPS Remote sensing (satellites, UAV s) LiDAR Digitized maps Attribute Data Management Data
DIFFERENTIAL APPROACH FOR MAP REVISION FROM NEW MULTI-RESOLUTION SATELLITE IMAGERY AND EXISTING TOPOGRAPHIC DATA
 DIFFERENTIAL APPROACH FOR MAP REVISION FROM NEW MULTI-RESOLUTION SATELLITE IMAGERY AND EXISTING TOPOGRAPHIC DATA Costas ARMENAKIS Centre for Topographic Information - Geomatics Canada 615 Booth Str., Ottawa,
Introduction to Remote Sensing
 Introduction to Remote Sensing Outline Remote Sensing Defined Resolution Electromagnetic Energy (EMR) Types Interpretation Applications Remote Sensing Defined Remote Sensing is: The art and science of
An Introduction to Remote Sensing & GIS. Introduction
 An Introduction to Remote Sensing & GIS Introduction Remote sensing is the measurement of object properties on Earth s surface using data acquired from aircraft and satellites. It attempts to measure something
MULTIRESOLUTION SPOT-5 DATA FOR BOREAL FOREST MONITORING
 MULTIRESOLUTION SPOT-5 DATA FOR BOREAL FOREST MONITORING M. G. Rosengren, E. Willén Metria Miljöanalys, P.O. Box 24154, SE-104 51 Stockholm, Sweden - (mats.rosengren, erik.willen)@lm.se KEY WORDS: Remote
MULTISPECTRAL IMAGE PROCESSING I
 TM1 TM2 337 TM3 TM4 TM5 TM6 Dr. Robert A. Schowengerdt TM7 Landsat Thematic Mapper (TM) multispectral images of desert and agriculture near Yuma, Arizona MULTISPECTRAL IMAGE PROCESSING I SENSORS Multispectral
A. Dalrin Ampritta 1 and Dr. S.S. Ramakrishnan 2 1,2 INTRODUCTION
 Improving the Thematic Accuracy of Land Use and Land Cover Classification by Image Fusion Using Remote Sensing and Image Processing for Adapting to Climate Change A. Dalrin Ampritta 1 and Dr. S.S. Ramakrishnan
Image Extraction using Image Mining Technique
 IOSR Journal of Engineering (IOSRJEN) e-issn: 2250-3021, p-issn: 2278-8719 Vol. 3, Issue 9 (September. 2013), V2 PP 36-42 Image Extraction using Image Mining Technique Prof. Samir Kumar Bandyopadhyay,
Land cover change methods. Ned Horning
 Land cover change methods Ned Horning Version: 1.0 Creation Date: 2004-01-01 Revision Date: 2004-01-01 License: This document is licensed under a Creative Commons Attribution-Share Alike 3.0 Unported License.
Apply Colour Sequences to Enhance Filter Results. Operations. What Do I Need? Filter
 Apply Colour Sequences to Enhance Filter Results Operations What Do I Need? Filter Single band images from the SPOT and Landsat platforms can sometimes appear flat (i.e., they are low contrast images).
Abstract Urbanization and human activities cause higher air temperature in urban areas than its
 Observe Urban Heat Island in Lucas County Using Remote Sensing by Lu Zhao Table of Contents Abstract Introduction Image Processing Proprocessing Temperature Calculation Land Use/Cover Detection Results
Digital Image Processing - A Remote Sensing Perspective
 ISSN 2278 0211 (Online) Digital Image Processing - A Remote Sensing Perspective D.Sarala Department of Physics & Electronics St. Ann s College for Women, Mehdipatnam, Hyderabad, India Sunita Jacob Head,
REMOTE SENSING INTERPRETATION
 REMOTE SENSING INTERPRETATION Jan Clevers Centre for Geo-Information - WU Remote Sensing --> RS Sensor at a distance EARTH OBSERVATION EM energy Earth RS is a tool; one of the sources of information! 1
EXERCISE 1 - REMOTE SENSING: SENSORS WITH DIFFERENT RESOLUTION
 EXERCISE 1 - REMOTE SENSING: SENSORS WITH DIFFERENT RESOLUTION Program: ArcView 3.x 1. Copy the folder FYS_FA with its whole contents from: Kursdata: L:\FA\FYS_FA to C:\Tempdata 2. Open the folder and
Abstract Quickbird Vs Aerial photos in identifying man-made objects
 Abstract Quickbird Vs Aerial s in identifying man-made objects Abdullah Mah abdullah.mah@aramco.com Remote Sensing Group, emap Division Integrated Solutions Services Department (ISSD) Saudi Aramco, Dhahran
Ordination of multispectral imagery for multitemporal change analysis using Principal Components Analysis
 62 Prairie Perspectives Ordination of multispectral imagery for multitemporal change analysis using Principal Components Analysis Joseph M. Piwowar, University of Regina Andrew A. Millward, University
Introduction to image processing for remote sensing: Practical examples
 Università degli studi di Roma Tor Vergata Corso di Telerilevamento e Diagnostica Elettromagnetica Anno accademico 2010/2011 Introduction to image processing for remote sensing: Practical examples Dr.
Image transformations
 Image transformations Digital Numbers may be composed of three elements: Atmospheric interference (e.g. haze) ATCOR Illumination (angle of reflection) - transforms Albedo (surface cover) Image transformations
Introduction to Remote Sensing Fundamentals of Satellite Remote Sensing. Mads Olander Rasmussen
 Introduction to Remote Sensing Fundamentals of Satellite Remote Sensing Mads Olander Rasmussen (mora@dhi-gras.com) 01. Introduction to Remote Sensing DHI What is remote sensing? the art, science, and technology
Blacksburg, VA July 24 th 30 th, 2010 Remote Sensing Page 1. A condensed overview. For our purposes
 A condensed overview George McLeod Prepared by: With support from: NSF DUE-0903270 in partnership with: Geospatial Technician Education Through Virginia s Community Colleges (GTEVCC) The art and science
GeoBase Raw Imagery Data Product Specifications. Edition
 GeoBase Raw Imagery 2005-2010 Data Product Specifications Edition 1.0 2009-10-01 Government of Canada Natural Resources Canada Centre for Topographic Information 2144 King Street West, suite 010 Sherbrooke,
Chapter 1. Introduction
 Chapter 1 Introduction One of the major achievements of mankind is to record the data of what we observe in the form of photography which is dated to 1826. Man has always tried to reach greater heights
NRS 415 Remote Sensing of Environment
 NRS 415 Remote Sensing of Environment 1 High Oblique Perspective (Side) Low Oblique Perspective (Relief) 2 Aerial Perspective (See What s Hidden) An example of high spatial resolution true color remote
Satellite data processing and analysis: Examples and practical considerations
 Satellite data processing and analysis: Examples and practical considerations Dániel Kristóf Ottó Petrik, Róbert Pataki, András Kolesár International LCLUC Regional Science Meeting in Central Europe Sopron,
SURFACE WATER SECTION FILE COPY
 SURFACE WATER SECTION FILE COPY Illinois State Water Survey Division SURFACE WATER SECTION SWS Contract Report 458 LAND USE/COVER CLASSIFICATION FOR THE PROPOSED SUPERCONDUCTING SUPER COLLIDER STUDY AREA,
MODULE 4 LECTURE NOTES 1 CONCEPTS OF COLOR
 MODULE 4 LECTURE NOTES 1 CONCEPTS OF COLOR 1. Introduction The field of digital image processing relies on mathematical and probabilistic formulations accompanied by human intuition and analysis based
GEOMETRIC RECTIFICATION OF EUROPEAN HISTORICAL ARCHIVES OF LANDSAT 1-3 MSS IMAGERY
 GEOMETRIC RECTIFICATION OF EUROPEAN HISTORICAL ARCHIVES OF LANDSAT -3 MSS IMAGERY Torbjörn Westin Satellus AB P.O.Box 427, SE-74 Solna, Sweden tw@ssc.se KEYWORDS: Landsat, MSS, rectification, orbital model