Image interpretation and analysis
|
|
|
- Myra Patrick
- 5 years ago
- Views:
Transcription


1 Image interpretation and analysis Grundlagen Fernerkundung, Geo 123.1, FS 2014 Lecture 7a Rogier de Jong Michael Schaepman Why are snow, foam, and clouds white?


2 Why are snow, foam, and clouds white? Today s topics Book: Chapter 7, p Visualization and contrast Spectral analysis Band combinations and indices Image transformation Temporal analysis Change detection Spatial analysis Filtering (high-pass and low-pass) Pixels and objects
 DR display (0-255) DR sensor (60-158) DR display (0-255) Lillesand Fig.")
3 Visualization and contrast manipulation A sensor measures energy and has a certain dynamic range (DR) The lowest amount of energy that can be detected is recorded as 0 The highest amount of energy that can be detected is recorded as 255 Histogram stretching DR sensor (0-255) DR display (0-255) DR sensor (60-158) DR display (0-255) Lillesand Fig. 7.13

4 Histogram stretching Lillesand Fig Contrast

 Simplest")


5 Level slicing Discontinuous color mapping Subdividing the continuous range of values into discontinuous but sequential groups (called bins or classes) Simplest way of making classes based on spectral values 0 10 aquamarine sienna dark green color scale light green to white Continuous color mapping = 256 values 256 values = 2 8 = 8 bit Example: =>

, green (G) and blue (B)")

6 Band combinations Each spectral band represents a grey-scale image. Three of these bands can be assigned to the display colors red (R), green (G) and blue (B) to obtain a full-color image. 3 bands, each = 24 bit color depth (16.7 million colors) blue green red True-color image B G R
 Blue = Green (band 2)")


7 Color-infrared image R B G Red = Near IR (band 4) Green = Red (band 3) Blue = Green (band 2) False-color images using 7 Landsat bands Landsat bands µm Blue µm Green µm Red µm Near IR µm Mid-IR µm Thermal IR µm Mid-IR

8 Spectral analysis R,G,B = R,G,B R,G,B = NIR,R,G Lillesand Plate 3 Spectral analysis R,G,B = R,G,B R,G,B = SWIR,NIR,G

9 Band operations Per-pixel mathematical operations and transformations, where equation variables are represented by various spectral bands Simple band ratios HOTSPOT" DARKSPOT" Minimize topographic effects on spectral information." The DN ratio for a sunlit pixel is nearly identical to the DN ratio for a shadowed pixel." " Lillesand Fig. 7.25

 images")

 Why?")

10 Maximizing spectral contrast Color-infrared (CIR) images provide the best contrast for vegetation (lecture 2) Why? R = Near IR G = Red B = Green Vegetation in visible versus near infrared
\" The ratio NIR / RED gives therefore the highest contrast and the best way to quantify changes\" \" Spectral index A mathematical combination of spectral regions (or")
 Many other spectral indices exist, for example for soils/geology (texture, iron")
11 Maximizing spectral contrast Green, dense For vegetation:" Brown or sparse Reflectance is highest in NIR Red Infrared Red Infrared and lowest in RED" Both change if vegetation changes (senescence animation in previous lecture)" The ratio NIR / RED gives therefore the highest contrast and the best way to quantify changes" " Spectral index A mathematical combination of spectral regions (or bands) is known as a spectral index. For vegetation, these indices represent greenness in terms of photosynthetic activity (not greenness in terms of color) Many other spectral indices exist, for example for soils/geology (texture, iron content, soil organic carbon), for snow and ice (grain size, contamination), for water (chlorophyll content, dissolved organic matter) and for the atmosphere (NO 2 concentration, aerosols, ozone)
 0 Data transformations")

 Compress the information content in fewer bands")
12 Spectral index RED Color-mapped INDEX NIR 1 Southern France (Cabrieres, Languedoc) 0 Data transformations Aim at reducing the spectral redundancy (i.e. correlation between spectral bands) Compress the information content in fewer bands with decreasing variance Common example: Principal Component Analysis (PCA) Lillesand Fig. 7.27


13 Data transformations The resulting bands can be used for visual interpretation or as input for classification Apex, true color PC1 PC2 PC3 PC25 PC50 Temporal analysis Detecting changes is the first step towards assigning causes

 2002")

14 Change detection Example: Mapping of forest / plantation disturbances (red = disturbed) Google Earth, Temporal change: Aral Sea


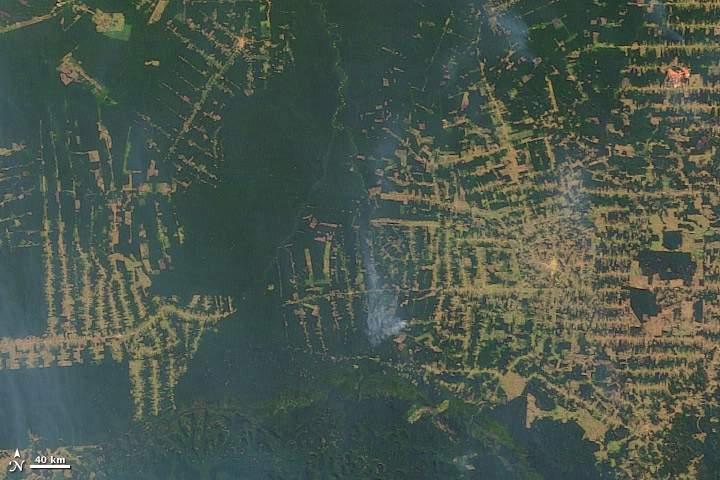
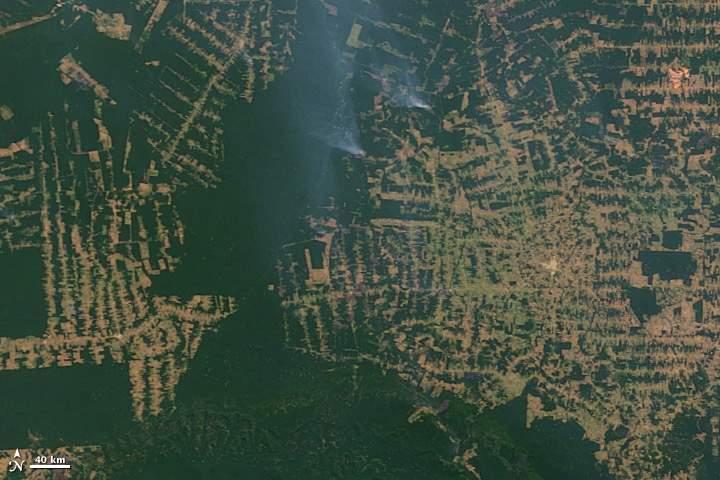
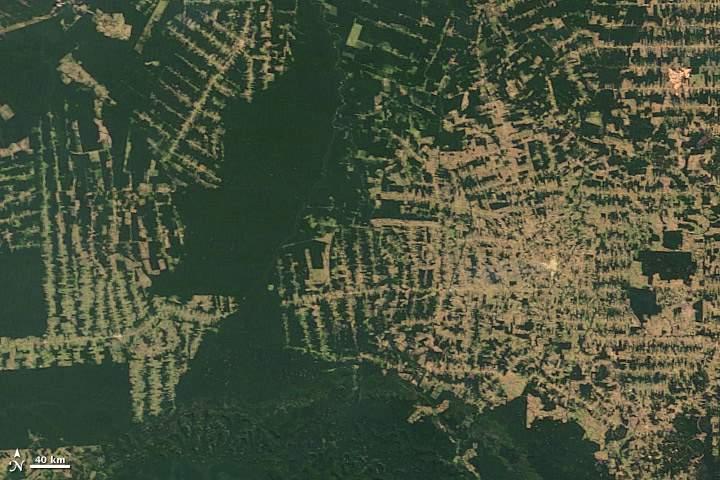
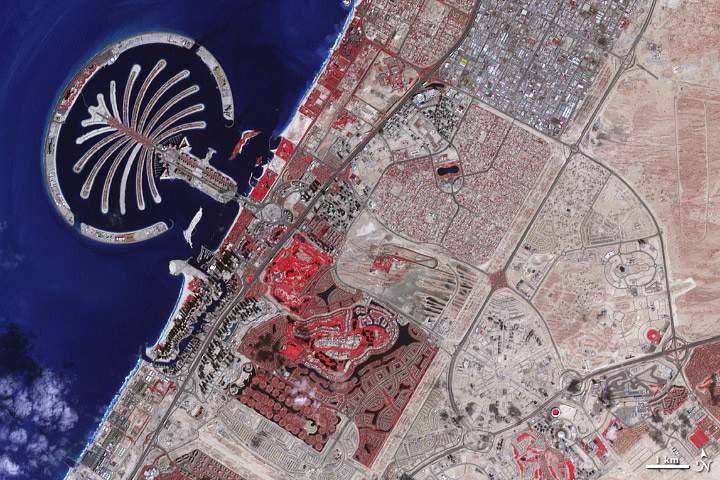
15 Temporal change: Rondonia, Brazil Temporal change: Dubai


16 Types of change Short-term change e.g. weather events Cyclic change e.g. seasonality Sustained change e.g. urban expansion (Dubai) Multidirectional change e.g. drought stress and recovery Change detection techniques Image differencing Calculate the difference or the ratio of two remotely sensed images. Regions that differ from 0 (difference) or 1 (ratio) have changed. Post-classification comparison Use same classification algorithm for two or more dates and detect pixels that are assigned to a different class

17 Change detection techniques Changed Vector Analysis Calculate the vector between the spectral response of a pixel at the initial date versus following date(s). Long vectors indicate large change. Composite image analysis Apply a classification algorithm or a transformation on an image stack of multiple dates. Pixels with similar changes show up in the same class. Lillesand Fig Change detection techniques Image regression Regress spectral bands or indices at date 1 versus date 2. Pixels that deviate from the 1:1 line have changed. Temporal regression For time series, changes occurred if the regression coefficient of observations against time is unequal to zero Lillesand Fig. 7.61
 288 bands (Modis VI) spectral index")
18 Image cube: spectral profiles for one pixel reflectance ~ wavelength 284 bands (Apex) 288 bands (Modis VI) spectral index value ~ time


19 Trend breaks Temporal regression: sustained and multidirectional Observation (one pixel) Seasonality Changes β = p = Y = ax + b gradual increase β = p = m = fast decrease stable β = p = Mapping the change Y = ax + b Green increase (a > 0) Red decrease (a < 0)
20 Spatial analysis Spatial Image Filtering Filtering manipulates the image elements Filters are applied using kernels composed of size and weights Most common in image analysis: high-pass and low-pass filters
21 High-pass filter (sharpening) Used to enhance high-frequency variations Disadvantage: enhances noise as well Kernel typically has high central value surrounded by (partially) negative weights; sum is 0 or higher Special case: Laplacian (2 nd derivative) filter High-pass filter x3 kernel (0*14) + (-1*28) + (0*13) + (-1*9) + (5*12) + (-1*12) + (0*8) + (-1*7) + (0*8) = 4
 Low-pass filter (smoothing) Used to suppress")

 determines degree of smoothing Special")
22 Influence of kernel size (High-pass filter) Radius 1, 10, 50 pixel(s) Low-pass filter (smoothing) Used to suppress high-frequency variation and noise Kernel with small positive values. Simplest case: all values (1 / kernel size) and thus sum equals 1 Kernel size (3x3, 5x5, ) determines degree of smoothing Special case: Gaussian filter (or Gaussian blur ) 1/9 1/9 1/9 1/9 1/9 1/9 1/9 1/9 1/9

 + (1/9*7) + (1/9*8) = 12.")
23 Low-pass filter x3 kernel 1/9 1/9 1/9 1/9 1/9 1/9 1/9 1/9 1/ (1/9*14) + (1/9*28) + (1/9*13) + (1/9*9) + (1/9*12) + (1/9*12) + (1/9*8) + (1/9*7) + (1/9*8) = OR 1/9 * ( ) = Low-pass example: de-noise noise 5% low-pass 30% 50%


24 Low-pass example: extract large objects original image 15 x 15 low-pass thresholding High-pass and low-pass filters, overview High-pass Low-pass 1/9 1/9 1/9 1/9 1/9 1/9 1/9 1/9 1/9


25 Pixels versus objects Statistical approaches can be used to group pixels based on spectral similarity and on neighborhood criteria These segmentation techniques transform per-pixel images into discrete pixel groups Lillesand Fig Pixels versus objects Advantage: Close to the human ability to distinguish spatial relationships Disadvantage: Models require scale and shape parameters and therefore strongly depend on user choices The segmented image can be used for classification (lecture 12) Lillesand Fig. 7.57

26 To take home from this lecture Understand that the choice of analysis technique depends on spectral, spatial and temporal resolution Know which flavors of image-analysis techniques exist without understanding technical details Be able to select an approach given a problem and to provide example problems given an approach Thank you! Next week: image classification Grundlagen Fernerkundung, Geo 123.1, FS 2014 Lecture 7a Rogier de Jong Michael Schaepman
The techniques with ERDAS IMAGINE include:
 The techniques with ERDAS IMAGINE include: 1. Data correction - radiometric and geometric correction 2. Radiometric enhancement - enhancing images based on the values of individual pixels 3. Spatial enhancement
Mod. 2 p. 1. Prof. Dr. Christoph Kleinn Institut für Waldinventur und Waldwachstum Arbeitsbereich Fernerkundung und Waldinventur
 Histograms of gray values for TM bands 1-7 for the example image - Band 4 and 5 show more differentiation than the others (contrast=the ratio of brightest to darkest areas of a landscape). - Judging from
Interpreting land surface features. SWAC module 3
 Interpreting land surface features SWAC module 3 Interpreting land surface features SWAC module 3 Different kinds of image Panchromatic image True-color image False-color image EMR : NASA Echo the bat
Remote Sensing. The following figure is grey scale display of SPOT Panchromatic without stretching.
 Remote Sensing Objectives This unit will briefly explain display of remote sensing image, geometric correction, spatial enhancement, spectral enhancement and classification of remote sensing image. At
Image Band Transformations
 Image Band Transformations Content Band math Band ratios Vegetation Index Tasseled Cap Transform Principal Component Analysis (PCA) Decorrelation Stretch Image Band Transformation Purposes Image band transforms
Present and future of marine production in Boka Kotorska
 Present and future of marine production in Boka Kotorska First results from satellite remote sensing for the breeding areas of filter feeders in the Bay of Kotor INTRODUCTION Environmental monitoring is
Environmental Remote Sensing GEOG 2021
 Environmental Remote Sensing GEOG 2021 Lecture 2 Image display and enhancement 2 Image Display and Enhancement Purpose visual enhancement to aid interpretation enhancement for improvement of information
Preparing Remote Sensing Data for Natural Resources Mapping (image enhancement, rectifications )
") Preparing Remote Sensing Data for Natural Resources Mapping (image enhancement, rectifications ) Why is this important What are the major approaches Examples of digital image enhancement Follow up exercises
Preparing Remote Sensing Data for Natural Resources Mapping (image enhancement, rectifications ) Why is this important What are the major approaches Examples of digital image enhancement Follow up exercises
GE 113 REMOTE SENSING. Topic 7. Image Enhancement
 GE 113 REMOTE SENSING Topic 7. Image Enhancement Lecturer: Engr. Jojene R. Santillan jrsantillan@carsu.edu.ph Division of Geodetic Engineering College of Engineering and Information Technology Caraga State
REMOTE SENSING INTERPRETATION
 REMOTE SENSING INTERPRETATION Jan Clevers Centre for Geo-Information - WU Remote Sensing --> RS Sensor at a distance EARTH OBSERVATION EM energy Earth RS is a tool; one of the sources of information! 1
Image interpretation I and II
 Image interpretation I and II Looking at satellite image, identifying different objects, according to scale and associated information and to communicate this information to others is what we call as IMAGE
Enhancement of Multispectral Images and Vegetation Indices
 Enhancement of Multispectral Images and Vegetation Indices ERDAS Imagine 2016 Description: We will use ERDAS Imagine with multispectral images to learn how an image can be enhanced for better interpretation.
MODULE 4 LECTURE NOTES 4 DENSITY SLICING, THRESHOLDING, IHS, TIME COMPOSITE AND SYNERGIC IMAGES
 MODULE 4 LECTURE NOTES 4 DENSITY SLICING, THRESHOLDING, IHS, TIME COMPOSITE AND SYNERGIC IMAGES 1. Introduction Digital image processing involves manipulation and interpretation of the digital images so
Sommersemester Prof. Dr. Christoph Kleinn Institut für Waldinventur und Waldwachstum Arbeitsbereich Fernerkundung und Waldinventur.
 Basics of Remote Sensing Some literature references Franklin, SE 2001 Remote Sensing for Sustainable Forest Management Lewis Publishers 407p Lillesand, Kiefer 2000 Remote Sensing and Image Interpretation
IKONOS High Resolution Multispectral Scanner Sensor Characteristics
 High Spatial Resolution and Hyperspectral Scanners IKONOS High Resolution Multispectral Scanner Sensor Characteristics Launch Date View Angle Orbit 24 September 1999 Vandenberg Air Force Base, California,
MULTISPECTRAL IMAGE PROCESSING I
 TM1 TM2 337 TM3 TM4 TM5 TM6 Dr. Robert A. Schowengerdt TM7 Landsat Thematic Mapper (TM) multispectral images of desert and agriculture near Yuma, Arizona MULTISPECTRAL IMAGE PROCESSING I SENSORS Multispectral
An Introduction to Remote Sensing & GIS. Introduction
 An Introduction to Remote Sensing & GIS Introduction Remote sensing is the measurement of object properties on Earth s surface using data acquired from aircraft and satellites. It attempts to measure something
Remote sensing in archaeology from optical to lidar. Krištof Oštir ModeLTER Scientific Research Centre of the Slovenian Academy of Sciences and Arts
 Remote sensing in archaeology from optical to lidar Krištof Oštir ModeLTER Scientific Research Centre of the Slovenian Academy of Sciences and Arts Introduction Optical remote sensing Systems Search for
Land Cover Analysis to Determine Areas of Clear-cut and Forest Cover in Olney, Montana. Geob 373 Remote Sensing. Dr Andreas Varhola, Kathry De Rego
 1 Land Cover Analysis to Determine Areas of Clear-cut and Forest Cover in Olney, Montana Geob 373 Remote Sensing Dr Andreas Varhola, Kathry De Rego Zhu an Lim (14292149) L2B 17 Apr 2016 2 Abstract Montana
REMOTE SENSING. Topic 10 Fundamentals of Digital Multispectral Remote Sensing MULTISPECTRAL SCANNERS MULTISPECTRAL SCANNERS
 REMOTE SENSING Topic 10 Fundamentals of Digital Multispectral Remote Sensing Chapter 5: Lillesand and Keifer Chapter 6: Avery and Berlin MULTISPECTRAL SCANNERS Record EMR in a number of discrete portions
746A27 Remote Sensing and GIS. Multi spectral, thermal and hyper spectral sensing and usage
 746A27 Remote Sensing and GIS Lecture 3 Multi spectral, thermal and hyper spectral sensing and usage Chandan Roy Guest Lecturer Department of Computer and Information Science Linköping University Multi
Remote Sensing Instruction Laboratory
 Laboratory Session 217513 Geographic Information System and Remote Sensing - 1 - Remote Sensing Instruction Laboratory Assist.Prof.Dr. Weerakaset Suanpaga Department of Civil Engineering, Faculty of Engineering
Satellite Imagery and Remote Sensing. DeeDee Whitaker SW Guilford High EES & Chemistry
 Satellite Imagery and Remote Sensing DeeDee Whitaker SW Guilford High EES & Chemistry whitakd@gcsnc.com Outline What is remote sensing? How does remote sensing work? What role does the electromagnetic
Remote Sensing Phenology. Bradley Reed Principal Scientist USGS National Center for Earth Resources Observation and Science Sioux Falls, SD
 Remote Sensing Phenology Bradley Reed Principal Scientist USGS National Center for Earth Resources Observation and Science Sioux Falls, SD Remote Sensing Phenology Potential to provide wall-to-wall phenology
Apply Colour Sequences to Enhance Filter Results. Operations. What Do I Need? Filter
 Apply Colour Sequences to Enhance Filter Results Operations What Do I Need? Filter Single band images from the SPOT and Landsat platforms can sometimes appear flat (i.e., they are low contrast images).
Course overview; Remote sensing introduction; Basics of image processing & Color theory
 GEOL 1460 /2461 Ramsey Introduction to Remote Sensing Fall, 2018 Course overview; Remote sensing introduction; Basics of image processing & Color theory Week #1: 29 August 2018 I. Syllabus Review we will
RGB colours: Display onscreen = RGB
 RGB colours: http://www.colorspire.com/rgb-color-wheel/ Display onscreen = RGB DIGITAL DATA and DISPLAY Myth: Most satellite images are not photos Photographs are also 'images', but digital images are
Table of contents. Vision industrielle 2002/2003. Local and semi-local smoothing. Linear noise filtering: example. Convolution: introduction
 Table of contents Vision industrielle 2002/2003 Session - Image Processing Département Génie Productique INSA de Lyon Christian Wolf wolf@rfv.insa-lyon.fr Introduction Motivation, human vision, history,
2017 REMOTE SENSING EVENT TRAINING STRATEGIES 2016 SCIENCE OLYMPIAD COACHING ACADEMY CENTERVILLE, OH
 2017 REMOTE SENSING EVENT TRAINING STRATEGIES 2016 SCIENCE OLYMPIAD COACHING ACADEMY CENTERVILLE, OH This presentation was prepared using draft rules. There may be some changes in the final copy of the
Image transformations
 Image transformations Digital Numbers may be composed of three elements: Atmospheric interference (e.g. haze) ATCOR Illumination (angle of reflection) - transforms Albedo (surface cover) Image transformations
Evaluation of FLAASH atmospheric correction. Note. Note no SAMBA/10/12. Authors. Øystein Rudjord and Øivind Due Trier
 Evaluation of FLAASH atmospheric correction Note Note no Authors SAMBA/10/12 Øystein Rudjord and Øivind Due Trier Date 16 February 2012 Norsk Regnesentral Norsk Regnesentral (Norwegian Computing Center,
Figure 1: Percent reflectance for various features, including the five spectra from Table 1, at different wavelengths from 0.4µm to 1.4µm.
 Section 1: The Electromagnetic Spectrum 1. The wavelength range that has the highest reflectance for broadleaf vegetation and needle leaf vegetation is 0.75µm to 1.05µm. 2. Dry soil can be distinguished
Dirty REMOTE SENSING Lecture 3: First Steps in classifying Stuart Green Earthobservation.wordpress.com
 Dirty REMOTE SENSING Lecture 3: First Steps in classifying Stuart Green Earthobservation.wordpress.com Stuart.Green@Teagasc.ie You have your image, but is it any good? Is it full of cloud? Is it the right
Digital Image Processing
 Digital Image Processing Part 2: Image Enhancement Digital Image Processing Course Introduction in the Spatial Domain Lecture AASS Learning Systems Lab, Teknik Room T26 achim.lilienthal@tech.oru.se Course
Detecting Greenery in Near Infrared Images of Ground-level Scenes
 Detecting Greenery in Near Infrared Images of Ground-level Scenes Piotr Łabędź Agnieszka Ozimek Institute of Computer Science Cracow University of Technology Digital Landscape Architecture, Dessau Bernburg
CanImage. (Landsat 7 Orthoimages at the 1: Scale) Standards and Specifications Edition 1.0
 Standards and Specifications Edition 1.0") CanImage (Landsat 7 Orthoimages at the 1:50 000 Scale) Standards and Specifications Edition 1.0 Centre for Topographic Information Customer Support Group 2144 King Street West, Suite 010 Sherbrooke, QC
CanImage (Landsat 7 Orthoimages at the 1:50 000 Scale) Standards and Specifications Edition 1.0 Centre for Topographic Information Customer Support Group 2144 King Street West, Suite 010 Sherbrooke, QC
Remote Sensing (Test) Topic: Climate Change Processes*
 Topic: Climate Change Processes*") Scioly Summer Study Session 2017 Remote Sensing (Test) Topic: Climate Change Processes* By user whythelongface (merge) Name(s): Test format: This test is worth 150 points. There are four sections: 1. Remote
Scioly Summer Study Session 2017 Remote Sensing (Test) Topic: Climate Change Processes* By user whythelongface (merge) Name(s): Test format: This test is worth 150 points. There are four sections: 1. Remote
Basic Digital Image Processing. The Structure of Digital Images. An Overview of Image Processing. Image Restoration: Line Drop-outs
 Basic Digital Image Processing A Basic Introduction to Digital Image Processing ~~~~~~~~~~ Rev. Ronald J. Wasowski, C.S.C. Associate Professor of Environmental Science University of Portland Portland,
CoE4TN4 Image Processing. Chapter 3: Intensity Transformation and Spatial Filtering
 CoE4TN4 Image Processing Chapter 3: Intensity Transformation and Spatial Filtering Image Enhancement Enhancement techniques: to process an image so that the result is more suitable than the original image
NORMALIZING ASTER DATA USING MODIS PRODUCTS FOR LAND COVER CLASSIFICATION
 NORMALIZING ASTER DATA USING MODIS PRODUCTS FOR LAND COVER CLASSIFICATION F. Gao a, b, *, J. G. Masek a a Biospheric Sciences Branch, NASA Goddard Space Flight Center, Greenbelt, MD 20771, USA b Earth
Computing for Engineers in Python
 Computing for Engineers in Python Lecture 10: Signal (Image) Processing Autumn 2011-12 Some slides incorporated from Benny Chor s course 1 Lecture 9: Highlights Sorting, searching and time complexity Preprocessing
Introduction to Remote Sensing Fundamentals of Satellite Remote Sensing. Mads Olander Rasmussen
 Introduction to Remote Sensing Fundamentals of Satellite Remote Sensing Mads Olander Rasmussen (mora@dhi-gras.com) 01. Introduction to Remote Sensing DHI What is remote sensing? the art, science, and technology
GEOI 313: Digital Image Processing - I
 GEOI 33: Digital Image Processing - I Module I: Image Representation Image Display For remote sensing computing, the image display is especially important because the analyst must be able to examine images
An investigation of the Eye of Quebec. by means of PCA, NDVI and Tasseled Cap Transformations
 An investigation of the Eye of Quebec by means of PCA, NDVI and Tasseled Cap Transformations Advanced Digital Image Processing Prepared For: Trevor Milne Prepared By: Philipp Schnetzer March 28, 2008 Index
NON-PHOTOGRAPHIC SYSTEMS: Multispectral Scanners Medium and coarse resolution sensor comparisons: Landsat, SPOT, AVHRR and MODIS
 NON-PHOTOGRAPHIC SYSTEMS: Multispectral Scanners Medium and coarse resolution sensor comparisons: Landsat, SPOT, AVHRR and MODIS CLASSIFICATION OF NONPHOTOGRAPHIC REMOTE SENSORS PASSIVE ACTIVE DIGITAL
On the use of water color missions for lakes in 2021
 Lakes and Climate: The Role of Remote Sensing June 01-02, 2017 On the use of water color missions for lakes in 2021 Cédric G. Fichot Department of Earth and Environment 1 Overview 1. Past and still-ongoing
COMPARISON OF INFORMATION CONTENTS OF HIGH RESOLUTION SPACE IMAGES
 COMPARISON OF INFORMATION CONTENTS OF HIGH RESOLUTION SPACE IMAGES H. Topan*, G. Büyüksalih*, K. Jacobsen ** * Karaelmas University Zonguldak, Turkey ** University of Hannover, Germany htopan@karaelmas.edu.tr,
Using QuickBird Imagery in ESRI Software Products
 Using QuickBird Imagery in ESRI Software Products TABLE OF CONTENTS 1. Introduction...2 Purpose Scope Image Stretching Color Guns 2. Imagery Usage Instructions...4 ArcView 3.x...4 ArcGIS...7 i Using QuickBird
Application of GIS to Fast Track Planning and Monitoring of Development Agenda
 Application of GIS to Fast Track Planning and Monitoring of Development Agenda Radiometric, Atmospheric & Geometric Preprocessing of Optical Remote Sensing 13 17 June 2018 Outline 1. Why pre-process remotely
What is Remote Sensing? Contents. Image Fusion in Remote Sensing. 1. Optical imagery in remote sensing. Electromagnetic Spectrum
 Contents Image Fusion in Remote Sensing Optical imagery in remote sensing Image fusion in remote sensing New development on image fusion Linhai Jing Applications Feb. 17, 2011 2 1. Optical imagery in remote
Image Enhancement using Histogram Equalization and Spatial Filtering
 Image Enhancement using Histogram Equalization and Spatial Filtering Fari Muhammad Abubakar 1 1 Department of Electronics Engineering Tianjin University of Technology and Education (TUTE) Tianjin, P.R.
Image Processing for feature extraction
 Image Processing for feature extraction 1 Outline Rationale for image pre-processing Gray-scale transformations Geometric transformations Local preprocessing Reading: Sonka et al 5.1, 5.2, 5.3 2 Image
IceTrendr - Polygon. 1 contact: Peder Nelson Anne Nolin Polygon Attribution Instructions
 INTRODUCTION We want to describe the process that caused a change on the landscape (in the entire area of the polygon outlined in red in the KML on Google Earth), and we want to record as much as possible
University of Texas at San Antonio EES 5053 Term Project CORRELATION BETWEEN NDVI AND SURFACE TEMPERATURES USING LANDSAT ETM + IMAGERY NEWFEL MAZARI
 University of Texas at San Antonio EES 5053 Term Project CORRELATION BETWEEN NDVI AND SURFACE TEMPERATURES USING LANDSAT ETM + IMAGERY NEWFEL MAZARI Introduction and Objectives The present study is a correlation
Module 11 Digital image processing
 Introduction Geo-Information Science Practical Manual Module 11 Digital image processing 11. INTRODUCTION 11-1 START THE PROGRAM ERDAS IMAGINE 11-2 PART 1: DISPLAYING AN IMAGE DATA FILE 11-3 Display of
Urban Classification of Metro Manila for Seismic Risk Assessment using Satellite Images
 Urban Classification of Metro Manila for Seismic Risk Assessment using Satellite Images Fumio YAMAZAKI/ yamazaki@edm.bosai.go.jp Hajime MITOMI/ mitomi@edm.bosai.go.jp Yalkun YUSUF/ yalkun@edm.bosai.go.jp
8. EDITING AND VIEWING COORDINATES, CREATING SCATTERGRAMS AND PRINCIPAL COMPONENTS ANALYSIS
 Editing and viewing coordinates, scattergrams and PCA 8. EDITING AND VIEWING COORDINATES, CREATING SCATTERGRAMS AND PRINCIPAL COMPONENTS ANALYSIS Aim: To introduce you to (i) how you can apply a geographical
Lecture 13: Remotely Sensed Geospatial Data
 Lecture 13: Remotely Sensed Geospatial Data A. The Electromagnetic Spectrum: The electromagnetic spectrum (Figure 1) indicates the different forms of radiation (or simply stated light) emitted by nature.
Remote Sensing 4113 Lab 08: Filtering and Principal Components Mar. 28, 2018
 Remote Sensing 4113 Lab 08: Filtering and Principal Components Mar. 28, 2018 In this lab we will explore Filtering and Principal Components analysis. We will again use the Aster data of the Como Bluffs
Comparing of Landsat 8 and Sentinel 2A using Water Extraction Indexes over Volta River
 Journal of Geography and Geology; Vol. 10, No. 1; 2018 ISSN 1916-9779 E-ISSN 1916-9787 Published by Canadian Center of Science and Education Comparing of Landsat 8 and Sentinel 2A using Water Extraction
Midterm Review. Image Processing CSE 166 Lecture 10
 Midterm Review Image Processing CSE 166 Lecture 10 Topics covered Image acquisition, geometric transformations, and image interpolation Intensity transformations Spatial filtering Fourier transform and
DodgeCmd Image Dodging Algorithm A Technical White Paper
 DodgeCmd Image Dodging Algorithm A Technical White Paper July 2008 Intergraph ZI Imaging 170 Graphics Drive Madison, AL 35758 USA www.intergraph.com Table of Contents ABSTRACT...1 1. INTRODUCTION...2 2.
Digital Image Processing
 Digital Image Processing 1 Patrick Olomoshola, 2 Taiwo Samuel Afolayan 1,2 Surveying & Geoinformatic Department, Faculty of Environmental Sciences, Rufus Giwa Polytechnic, Owo. Nigeria Abstract: This paper
Assessment of Spatiotemporal Changes in Vegetation Cover using NDVI in The Dangs District, Gujarat
 Assessment of Spatiotemporal Changes in Vegetation Cover using NDVI in The Dangs District, Gujarat Using SAGA GIS and Quantum GIS Tutorial ID: IGET_CT_003 This tutorial has been developed by BVIEER as
Image acquisition. Midterm Review. Digitization, line of image. Digitization, whole image. Geometric transformations. Interpolation 10/26/2016
 Image acquisition Midterm Review Image Processing CSE 166 Lecture 10 2 Digitization, line of image Digitization, whole image 3 4 Geometric transformations Interpolation CSE 166 Transpose these matrices
Solution for Image & Video Processing
 Solution for Image & Video Processing December-2015 Index Q.1) a). 2-3 b). 4 (N.A.) c). 4 (N.A.) d). 4 (N.A.) e). 4-5 Q.2) a). 5 to 7 b). 7 (N.A.) Q.3) a). 8-9 b). 9 to 12 Q.4) a). 12-13 b). 13 to 16 Q.5)
Image and video processing
 Image and video processing Processing Colour Images Dr. Yi-Zhe Song The agenda Introduction to colour image processing Pseudo colour image processing Full-colour image processing basics Transforming colours
Prof. Vidya Manian Dept. of Electrical and Comptuer Engineering
 Image Processing Intensity Transformations Chapter 3 Prof. Vidya Manian Dept. of Electrical and Comptuer Engineering INEL 5327 ECE, UPRM Intensity Transformations 1 Overview Background Basic intensity
Remote Sensing Exam 2 Study Guide
 Remote Sensing Exam 2 Study Guide Resolution Analog to digital Instantaneous field of view (IFOV) f ( cone angle of optical system ) Everything in that area contributes to spectral response mixels Sampling
Introduction to Remote Sensing Part 1
 Introduction to Remote Sensing Part 1 A Primer on Electromagnetic Radiation Digital, Multi-Spectral Imagery The 4 Resolutions Displaying Images Corrections and Enhancements Passive vs. Active Sensors Radar
Geo/SAT 2 INTRODUCTION TO REMOTE SENSING
 Geo/SAT 2 INTRODUCTION TO REMOTE SENSING Paul R. Baumann, Professor Emeritus State University of New York College at Oneonta Oneonta, New York 13820 USA COPYRIGHT 2008 Paul R. Baumann Introduction Remote
remote sensing? What are the remote sensing principles behind these Definition
 Introduction to remote sensing: Content (1/2) Definition: photogrammetry and remote sensing (PRS) Radiation sources: solar radiation (passive optical RS) earth emission (passive microwave or thermal infrared
CHARACTERISTICS OF REMOTELY SENSED IMAGERY. Radiometric Resolution
 CHARACTERISTICS OF REMOTELY SENSED IMAGERY Radiometric Resolution There are a number of ways in which images can differ. One set of important differences relate to the various resolutions that images express.
GE 113 REMOTE SENSING
 GE 113 REMOTE SENSING Topic 5. Introduction to Digital Image Interpretation and Analysis Lecturer: Engr. Jojene R. Santillan jrsantillan@carsu.edu.ph Division of Geodetic Engineering College of Engineering
Remote Sensing. Odyssey 7 Jun 2012 Benjamin Post
 Remote Sensing Odyssey 7 Jun 2012 Benjamin Post Definitions Applications Physics Image Processing Classifiers Ancillary Data Data Sources Related Concepts Outline Big Picture Definitions Remote Sensing
CHARACTERISTICS OF REMOTELY SENSED IMAGERY. Spatial Resolution
 CHARACTERISTICS OF REMOTELY SENSED IMAGERY Spatial Resolution There are a number of ways in which images can differ. One set of important differences relate to the various resolutions that images express.
Image Extraction using Image Mining Technique
 IOSR Journal of Engineering (IOSRJEN) e-issn: 2250-3021, p-issn: 2278-8719 Vol. 3, Issue 9 (September. 2013), V2 PP 36-42 Image Extraction using Image Mining Technique Prof. Samir Kumar Bandyopadhyay,
Image Fusion. Pan Sharpening. Pan Sharpening. Pan Sharpening: ENVI. Multi-spectral and PAN. Magsud Mehdiyev Geoinfomatics Center, AIT
 1 Image Fusion Sensor Merging Magsud Mehdiyev Geoinfomatics Center, AIT Image Fusion is a combination of two or more different images to form a new image by using certain algorithms. ( Pohl et al 1998)
typical spectral signatures of photosynthetically active and non-photosynthetically active vegetation (Beeri et al., 2007)
") typical spectral signatures of photosynthetically active and non-photosynthetically active vegetation (Beeri et al., 2007) Xie, Y. et al. J Plant Ecol 2008 1:9-23; doi:10.1093/jpe/rtm005 Copyright restrictions
typical spectral signatures of photosynthetically active and non-photosynthetically active vegetation (Beeri et al., 2007) Xie, Y. et al. J Plant Ecol 2008 1:9-23; doi:10.1093/jpe/rtm005 Copyright restrictions
Sensors and Data Interpretation II. Michael Horswell
 Sensors and Data Interpretation II Michael Horswell Defining remote sensing 1. When was the last time you did any remote sensing? acquiring information about something without direct contact 2. What are
APCAS/10/21 April 2010 ASIA AND PACIFIC COMMISSION ON AGRICULTURAL STATISTICS TWENTY-THIRD SESSION. Siem Reap, Cambodia, April 2010
 APCAS/10/21 April 2010 Agenda Item 8 ASIA AND PACIFIC COMMISSION ON AGRICULTURAL STATISTICS TWENTY-THIRD SESSION Siem Reap, Cambodia, 26-30 April 2010 The Use of Remote Sensing for Area Estimation by Robert
University of Technology Building & Construction Department / Remote Sensing & GIS lecture
 8. Image Enhancement 8.1 Image Reduction and Magnification. 8.2 Transects (Spatial Profile) 8.3 Spectral Profile 8.4 Contrast Enhancement 8.4.1 Linear Contrast Enhancement 8.4.2 Non-Linear Contrast Enhancement
Overview. Introduction. Elements of Image Interpretation. LA502 Special Studies Remote Sensing
 LA502 Special Studies Remote Sensing Elements of Image Interpretation Dr. Ragab Khalil Department of Landscape Architecture Faculty of Environmental Design King AbdulAziz University Room 103 Overview Introduction
Non Linear Image Enhancement
 Non Linear Image Enhancement SAIYAM TAKKAR Jaypee University of information technology, 2013 SIMANDEEP SINGH Jaypee University of information technology, 2013 Abstract An image enhancement algorithm based
Monitoring agricultural plantations with remote sensing imagery
 MPRA Munich Personal RePEc Archive Monitoring agricultural plantations with remote sensing imagery Camelia Slave and Anca Rotman University of Agronomic Sciences and Veterinary Medicine - Bucharest Romania,
CSE 564: Scientific Visualization
 CSE 564: Scientific Visualization Lecture 5: Image Processing Klaus Mueller Stony Brook University Computer Science Department Klaus Mueller, Stony Brook 2003 Image Processing Definitions Purpose: - enhance
GIS Data Collection. Remote Sensing
 GIS Data Collection Remote Sensing Data Collection Remote sensing Introduction Concepts Spectral signatures Resolutions: spectral, spatial, temporal Digital image processing (classification) Other systems
GE 113 REMOTE SENSING
 GE 113 REMOTE SENSING Topic 8. Image Classification and Accuracy Assessment Lecturer: Engr. Jojene R. Santillan jrsantillan@carsu.edu.ph Division of Geodetic Engineering College of Engineering and Information
Image enhancement. Introduction to Photogrammetry and Remote Sensing (SGHG 1473) Dr. Muhammad Zulkarnain Abdul Rahman
 Dr. Muhammad Zulkarnain Abdul Rahman") Image enhancement Introduction to Photogrammetry and Remote Sensing (SGHG 1473) Dr. Muhammad Zulkarnain Abdul Rahman Image enhancement Enhancements are used to make it easier for visual interpretation
Image enhancement Introduction to Photogrammetry and Remote Sensing (SGHG 1473) Dr. Muhammad Zulkarnain Abdul Rahman Image enhancement Enhancements are used to make it easier for visual interpretation
Lab 1: Introduction to MODIS data and the Hydra visualization tool 21 September 2011
 WMO RA Regional Training Course on Satellite Applications for Meteorology Cieko, Bogor Indonesia 19-27 September 2011 Kathleen Strabala University of Wisconsin-Madison, USA kathy.strabala@ssec.wisc.edu
Remote Sensing And Gis Application in Image Classification And Identification Analysis.
 Quest Journals Journal of Research in Environmental and Earth Science Volume 3~ Issue 5 (2017) pp: 55-66 ISSN(Online) : 2348-2532 www.questjournals.org Research Paper Remote Sensing And Gis Application
Using Color-Infrared Imagery for Impervious Surface Analysis. Chris Behee City of Bellingham Planning & Community Development
 Using Color-Infrared Imagery for Impervious Surface Analysis. Chris Behee City of Bellingham Planning & Community Development NW GIS Users Group - March 18, 2005 Outline What is Color Infrared Imagery?
An NDVI image provides critical crop information that is not visible in an RGB or NIR image of the same scene. For example, plants may appear green
 Normalized Difference Vegetation Index (NDVI) Spectral Band calculation that uses the visible (RGB) and near-infrared (NIR) bands of the electromagnetic spectrum NDVI= + An NDVI image provides critical
Detecting Land Cover Changes by extracting features and using SVM supervised classification
 Detecting Land Cover Changes by extracting features and using SVM supervised classification ABSTRACT Mohammad Mahdi Mohebali MSc (RS & GIS) Shahid Beheshti Student mo.mohebali@gmail.com Ali Akbar Matkan,
An Efficient Color Image Segmentation using Edge Detection and Thresholding Methods
 19 An Efficient Color Image Segmentation using Edge Detection and Thresholding Methods T.Arunachalam* Post Graduate Student, P.G. Dept. of Computer Science, Govt Arts College, Melur - 625 106 Email-Arunac682@gmail.com
Lab 3: Image Enhancements I 65 pts Due > Canvas by 10pm
 Geo 448/548 Spring 2016 Lab 3: Image Enhancements I 65 pts Due > Canvas by 3/11 @ 10pm For this lab, you will learn different ways to calculate spectral vegetation indices (SVIs). These are one category
LAB MANUAL SUBJECT: IMAGE PROCESSING BE (COMPUTER) SEM VII
 SEM VII") LAB MANUAL SUBJECT: IMAGE PROCESSING BE (COMPUTER) SEM VII IMAGE PROCESSING INDEX CLASS: B.E(COMPUTER) SR. NO SEMESTER:VII TITLE OF THE EXPERIMENT. 1 Point processing in spatial domain a. Negation of an
LAB MANUAL SUBJECT: IMAGE PROCESSING BE (COMPUTER) SEM VII IMAGE PROCESSING INDEX CLASS: B.E(COMPUTER) SR. NO SEMESTER:VII TITLE OF THE EXPERIMENT. 1 Point processing in spatial domain a. Negation of an
Monitoring of mine tailings using satellite and lidar data
 Surveying Monitoring of mine tailings using satellite and lidar data by Prevlan Chetty, Southern Mapping Geospatial This study looks into the use of high resolution satellite imagery from RapidEye and
F2 - Fire 2 module: Remote Sensing Data Classification
 F2 - Fire 2 module: Remote Sensing Data Classification F2.1 Task_1: Supervised and Unsupervised classification examples of a Landsat 5 TM image from the Center of Portugal, year 2005 F2.1 Task_2: Burnt
Introduction. Introduction. Introduction. Introduction. Introduction
 Identifying habitat change and conservation threats with satellite imagery Extinction crisis Volker Radeloff Department of Forest Ecology and Management Extinction crisis Extinction crisis Conservationists