Keywords: Agriculture, Olive Trees, Supervised Classification, Landsat TM, QuickBird, Remote Sensing.
|
|
|
- Randell Knight
- 5 years ago
- Views:
Transcription
1 Classification of agricultural fields by using Landsat TM and QuickBird sensors. The case study of olive trees in Lesvos island. Christos Vasilakos, University of the Aegean, Department of Environmental Studies, University Hill, 81100, Mytilene, Greece, John Hatzopoulos, University of the Aegean, Department of Environmental Studies, University Hill, 81100, Mytilene, Greece, Kostas Kalabokidis, University of the Aegean, Department of Geography, University Hill, 81100, Mytilene, Greece, Kostas Koutsovilis, Extended University Program Environmental Cartography, University of the Aegean, University Hill, 81100, Mytilene, Greece, Argiroula Thomaidou, Extended University Program Environmental Cartography, University of the Aegean, University Hill, 81100, Mytilene, Greece, Remote sensing techniques are the main methods used during the last two decades for information extraction and digital mapping of spatial features. Traditional methods include supervised classification of data with 30-m spatial resolution (i.e. Landsat TM) by collecting Ground Truth Data with Global Positioning Systems (GPS) in the field. These methods encounter some problems especially in complex landscapes like agricultural fields in the Mediterranean region. Spatial and spectral uncertainties lower the accuracy of the classification results. Nowadays, however, high-resolution sensors with spatial resolution of 2.5-m can be used for direct mapping by visual interpretation or automatic object recognition algorithms. The main disadvantages of these methods are the specialized technological know-how that is required, and the whole coverage of the study area with expensive high-resolution data. The purpose of this study is to evaluate the improvement of Landsat TM data supervised classification by using QuickBird high-resolution sensor for Ground Truth Data collection, in order to retrieve the spatial distribution of agricultural fields of olive tree orchards in Lesvos island. The resulted classification scheme includes different qualitative classes of the fields as well as an effort to estimate the tree densities. Keywords: Agriculture, Olive Trees, Supervised Classification, Landsat TM, QuickBird, Remote Sensing. 1. Introduction Olive fields are the major cultivation type in Mediterranean region. The importance of olive tree in Greece appears in ancient years, while at nowadays, its farming consists the major or complementary income activity for the population of Lesvos island. European Commission s Regulation (EC) No 2366/98 of 30 October 1998 laid down detailed rules for the application of the system of production aid for olive oil. According to the latter, farmers receive production aid only if they submit a registration of their fields and locate them on the appropriate cartographic background. The area of these orchards is estimated, traditional, only by farmer s
2 registration, thus, various research projects were carried out the last two decades aiming to map, sufficiently, agricultural fields by using satellite remote sensing data. The processing of these data in order to retrieve land-use and land-cover types is quite difficult to Mediterranean region due to complex landscape. Steep slopes and unclear field boundaries among with medium-resolution sensors leads supervised classification to considerable errors regarding this kind of application. This research attempts to study the usefulness of QuickBird data in retrieving ground truth data for Landsat TM classification. Opposed to previous methods where the sample data were collected in field by using low resolution GPS measurements, the user can identify objects and patterns by taking advantage the 2.5 m pixel resolution. 2. Description of Study Area The island of Lesvos covers an area of 1672 Km 2 with a variety of geological formations, climatic conditions and vegetation types (i.e., forests, shrublands, grasslands and agricultural lands). The climate in these areas is typically Mediterranean, with warm and dry summers and mild and moderately rainy winters. Annual precipitation averages around 670 mm, but there is a rainfall gradient of more than 45% from East (subhumid) to West (semiarid). The average annual air temperature is 18 o C with high oscillations between maximum and minimum daily temperatures. The terrain in the study areas is rather hilly and rough, with its highest peak at 800 m ASL. Slopes greater than 20% are dominant covering almost 2/3 s of the area. Narrow alluvial plains are present in the lower parts along the coast, having a shallow groundwater table. Prominent arid lands are mainly found in the western part of the island, in which acid volcanic rocks dominate. 3. Data and Methodology Satellite images of medium-high (Landsat TM) and very high resolution (QuickBird) were used as original data. The Landsat TM image has been acquired in 28/5/1999. It is presumed that the last 3 years, there are no major modifications in land cover types able to be mapped in 30 by 30 m. Geometric corrections for Landsat TM were applied by using high-accuracy GPS (3-5 m) measurements and geo-referenced into the Hellenic Geodetic Reference System 87. Selected sceneries of QuickBird were rectified by using same Ground Control Points (GCPs) with Landsat TM. QuickBird is the world s highest resolution commercial satellite with ground pixel resolution 61cm for panchromatic band and 2.44 m for multispectral (Eurimage, 2003). Imagery is collected in 11-bit format (2048 grey levels) while four-band multi-spectral imagery consists of blue, green, red and near-infrared bands are available (Table 1). QuickBird images were acquired during of summer 2002 and the whole study area was covered by more than 15 sceneries. Disadvantages of acquiring new high-resolution data is the high price and the risk of having maximum 20% of area of interest covered by clouds without including haze and shadows. Table 1: Band s wavelength for Landsat TM and Quickbird multispectral sensors Band \ Sensor Landsat TM QuickBird Band nm nm
3 Band nm nm Band nm nm Band nm nm Band nm - Band nm - Band nm - In supervised training, user relies on its own pattern recognition skills and a priori knowledge of the data to help the system determine the statistical criteria (signatures) for data classification. Usually, this knowledge is acquired by field work in terms of interpreting landscape into classes and assigning the corresponded X and Y values acquired by GPS. This procedure has a lot of man-hours cost, travel cost and requires the ability of user to travel in the field. Within this research, field work replaced by QuickBird data, so the classifier interprets the different classes from images and collects the corresponding Areas of Interest (AOIs) that have been used for the supervised classification of Landsat TM. The classes that have been recognized in order to classify Landsat TM are: Salt mines, coastal areas, water Sea Urban area Barren soil Pine forest Olive tree orchards Oak forest Chestnut tree forest Evergreen shrubs Deciduous tree forest Agriculture land Grazing land Olive tree orchards separated into 5 different classes according to their type and trees density. Figure 2 shows AOIs for these classes overlaid on QuickBird images assigning the Near Infrared channel to Red, Blue channel to Blue and Green channel to Green. E1: trees per hectar E2: trees per hectar E3: trees per hectar E4F: trees per hectar at flat area E4M: trees per hectar at mountainous area After collecting AOIs, Landast TM classified into the above classes with supervised classification by using the feature space decision rule as a non-parametric rule and maximum likelihood as a parametric rule. The feature space decision rule determines whether or not a candidate pixel lies within the nonparametric signature in the feature space image. When a pixel s data file values are in the feature space signature, then the pixel is assigned to that signature s class. The maximum

 [ 0.5ln( Covc )] [ 0.")
4 likelihood decision rule is based on the probability that a pixel belongs to a particular class. The basic equation assumes that these probabilities are equal for all classes, and that the input bands have normal distributions. If there is a priori knowledge that the probabilities are not equal for all classes, weight factors can be specified for particular classes (Hord, 1982). The equation for the maximum likelihood/bayesian classifier is as follows where the pixel is assigned to the class, c, for which D is the lowest: ( ac) [ 0.5ln( Covc )] [ 0.5( X Mc) T ( Covc )( X Mc) ] D = ln 1 (1) Where: D = weighted distance (likelihood) c = a particular class X = the measurement vector of the candidate pixel Mc = the mean vector of the sample of class c ac = percent probability that any candidate pixel is a member of class c Covc = the covariance matrix of the pixels in the sample of class c Covc = determinant of Covc (matrix algebra) Covc-1 = inverse of Covc (matrix algebra) T= transposition function (matrix algebra) The accuracy assessment was evaluated with the contingency matrix of the classification. The contingency matrix is a quick classification, with the same rules, of the pixels in a set of training samples to see what percentage of the sample pixels are actually classified as expected. The pixels of each training sample are not always so homogeneous that every pixel in a sample is actually classified to its corresponding class. Each sample pixel only weights the statistics that determine the classes. However, if the signature statistics for each sample are distinct from those of the other samples, then a high percentage of each sample s pixels is classified as expected (ERDAS, 1994). E1 E1


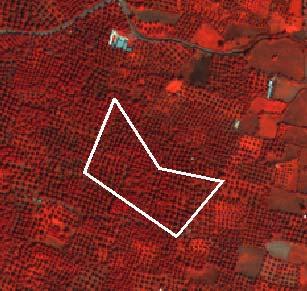
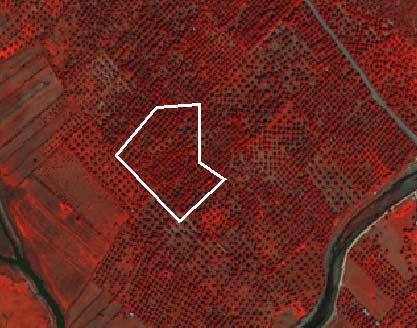
5 E2 E2 E3 E3 E4M E4M E4F Figure 2: Sample plots of olive tree orchards, over QuickBird images. E4F
6 4. Results and Discussion The accurate area calculation of olive trees orchards and the number of trees is quite difficult in the Greek insular environment due to complex landscape, the abandonment of land and the lack of statistical and historical data. Olive trees mapping by satellite data classification has promising results and new techniques are explored in order to improve them. By using high-resolution imagery as a tool of ground truth data collection, the total area coverage and the number of olive trees amplitude was estimated (Table 2). The total area was estimated 47561,5 hectares while within a previous research where the ground truth data were collected by using a 30-m accuracy GPS, the total area was estimated 43324,1 hectares (Hatzopoulos et al., 1992, Koukoulas, 1994). The overestimation is mainly explained by the time-difference between the two satellite datasets which is 9 years and the different approaches in ground truth data collection. Figure 3 shows the output maps of Landsat TM classification regarding land cover types and olive tree orchard types. Table2: Classification results of Landsat TM Olive Trees class Area (hectares*) Number of trees per area Number of trees (min) Number of trees (max) unit E E E , E4M 1648, E4F 447, Total 47561, * 1 hectare =10000 m 2 Table 3 shows the contingency matrix for the plot samples of the land cover types that has been selected as the final classification scheme. The overall accuracy is 99.38%, meaning that this percentage of the sample pixels is classified correct. Regarding olive trees, only 1.7% of the pixels that have been identified as olive trees by the user over QuickBird image, have been classified in 5 other classes. That is explained because of the larger training dataset selected for olive trees. Furthermore, there is an overestimation of 5.5% of the pixels that belong to other classes and they have been classified as olive trees. Comparing to former procedure of supervised classification (Hatzopoulos et al., 1992), where the user has to collect ground truth data with GPS, the classification results seems to be much better.
 maps from Landsat TM")
7 Figure 3: Land cover types (above) and Olive tree orchard types (below) maps from Landsat TM classification
8 Table 3: Contingency matrix of the classification (Numbers in percentage) Classification Data Pine Forest Salt-mine etc Pine Forest Saltmine etc Olive trees Urban area Deciduous trees Barren Soil Evergreen shrubs Agriculture land Grazing land Chestnut trees Oak forest Olive trees Urban area Deciduous trees Barren Soil 0.0 Evergreen shrubs Agriculture land Grazing land Chestnut trees Oak forest
9 5. References ERDAS Inc, (1994), ERDAS Field Guide, Atlanta, GA. Eurimage (2003), QuickBird products at Hatzopoulos I.N., Giourga C., Koukoulas S., Margaris N., (1992). Land Cover Classification of Olive trees in the Greek Islands Using Landsat TM Images. Symposium ASP&RS, USA. Hord, R. M., (1982). Digital Image Processing of Remotely Sensed Data. New York. Academic Press. Koukoulas S., (1994). Development of a methodology framework for mapping the productivity status of olive trees in Lesvos island by using Landsat TM satellite data. Bachelor Thesis. Mytilene. Greece. (In Greek)
APCAS/10/21 April 2010 ASIA AND PACIFIC COMMISSION ON AGRICULTURAL STATISTICS TWENTY-THIRD SESSION. Siem Reap, Cambodia, April 2010
 APCAS/10/21 April 2010 Agenda Item 8 ASIA AND PACIFIC COMMISSION ON AGRICULTURAL STATISTICS TWENTY-THIRD SESSION Siem Reap, Cambodia, 26-30 April 2010 The Use of Remote Sensing for Area Estimation by Robert
GE 113 REMOTE SENSING
 GE 113 REMOTE SENSING Topic 8. Image Classification and Accuracy Assessment Lecturer: Engr. Jojene R. Santillan jrsantillan@carsu.edu.ph Division of Geodetic Engineering College of Engineering and Information
Module 11 Digital image processing
 Introduction Geo-Information Science Practical Manual Module 11 Digital image processing 11. INTRODUCTION 11-1 START THE PROGRAM ERDAS IMAGINE 11-2 PART 1: DISPLAYING AN IMAGE DATA FILE 11-3 Display of
Land Cover Analysis to Determine Areas of Clear-cut and Forest Cover in Olney, Montana. Geob 373 Remote Sensing. Dr Andreas Varhola, Kathry De Rego
 1 Land Cover Analysis to Determine Areas of Clear-cut and Forest Cover in Olney, Montana Geob 373 Remote Sensing Dr Andreas Varhola, Kathry De Rego Zhu an Lim (14292149) L2B 17 Apr 2016 2 Abstract Montana
Remote Sensing. The following figure is grey scale display of SPOT Panchromatic without stretching.
 Remote Sensing Objectives This unit will briefly explain display of remote sensing image, geometric correction, spatial enhancement, spectral enhancement and classification of remote sensing image. At
REMOTE SENSING INTERPRETATION
 REMOTE SENSING INTERPRETATION Jan Clevers Centre for Geo-Information - WU Remote Sensing --> RS Sensor at a distance EARTH OBSERVATION EM energy Earth RS is a tool; one of the sources of information! 1
DISTINGUISHING URBAN BUILT-UP AND BARE SOIL FEATURES FROM LANDSAT 8 OLI IMAGERY USING DIFFERENT DEVELOPED BAND INDICES
 DISTINGUISHING URBAN BUILT-UP AND BARE SOIL FEATURES FROM LANDSAT 8 OLI IMAGERY USING DIFFERENT DEVELOPED BAND INDICES Mark Daryl C. Janiola (1), Jigg L. Pelayo (1), John Louis J. Gacad (1) (1) Central
LAND USE MAP PRODUCTION BY FUSION OF MULTISPECTRAL CLASSIFICATION OF LANDSAT IMAGES AND TEXTURE ANALYSIS OF HIGH RESOLUTION IMAGES
 LAND USE MAP PRODUCTION BY FUSION OF MULTISPECTRAL CLASSIFICATION OF LANDSAT IMAGES AND TEXTURE ANALYSIS OF HIGH RESOLUTION IMAGES Xavier OTAZU, Roman ARBIOL Institut Cartogràfic de Catalunya, Spain xotazu@icc.es,
TEMPORAL ANALYSIS OF MULTI EPOCH LANDSAT GEOCOVER IMAGES IN ZONGULDAK TESTFIELD
 TEMPORAL ANALYSIS OF MULTI EPOCH LANDSAT GEOCOVER IMAGES IN ZONGULDAK TESTFIELD Şahin, H. a*, Oruç, M. a, Büyüksalih, G. a a Zonguldak Karaelmas University, Zonguldak, Turkey - (sahin@karaelmas.edu.tr,
Land Cover Type Changes Related to. Oil and Natural Gas Drill Sites in a. Selected Area of Williams County, ND
 Land Cover Type Changes Related to Oil and Natural Gas Drill Sites in a Selected Area of Williams County, ND FR 3262/5262 Lab Section 2 By: Andrew Kernan Tyler Kaebisch Introduction: In recent years, there
large area By Juan Felipe Villegas E Scientific Colloquium Forest information technology
 A comparison of three different Land use classification methods based on high resolution satellite images to find an appropriate methodology to be applied on a large area By Juan Felipe Villegas E Scientific
Wetlands Investigation Utilizing GIS and Remote Sensing Technology for Lucas County, Ohio: a hybrid analysis.
 Wetlands Investigation Utilizing GIS and Remote Sensing Technology for Lucas County, Ohio: a hybrid analysis. Update on current wetlands research in GISAG Nathan Torbick Spring 2003 Component One Remote
Image interpretation I and II
 Image interpretation I and II Looking at satellite image, identifying different objects, according to scale and associated information and to communicate this information to others is what we call as IMAGE
SEMI-SUPERVISED CLASSIFICATION OF LAND COVER BASED ON SPECTRAL REFLECTANCE DATA EXTRACTED FROM LISS IV IMAGE
 SEMI-SUPERVISED CLASSIFICATION OF LAND COVER BASED ON SPECTRAL REFLECTANCE DATA EXTRACTED FROM LISS IV IMAGE B. RayChaudhuri a *, A. Sarkar b, S. Bhattacharyya (nee Bhaumik) c a Department of Physics,
INFORMATION CONTENT ANALYSIS FROM VERY HIGH RESOLUTION OPTICAL SPACE IMAGERY FOR UPDATING SPATIAL DATABASE
 INFORMATION CONTENT ANALYSIS FROM VERY HIGH RESOLUTION OPTICAL SPACE IMAGERY FOR UPDATING SPATIAL DATABASE M. Alkan a, * a Department of Geomatics, Faculty of Civil Engineering, Yıldız Technical University,
REMOTE SENSING. Topic 10 Fundamentals of Digital Multispectral Remote Sensing MULTISPECTRAL SCANNERS MULTISPECTRAL SCANNERS
 REMOTE SENSING Topic 10 Fundamentals of Digital Multispectral Remote Sensing Chapter 5: Lillesand and Keifer Chapter 6: Avery and Berlin MULTISPECTRAL SCANNERS Record EMR in a number of discrete portions
Statistical Analysis of SPOT HRV/PA Data
 Statistical Analysis of SPOT HRV/PA Data Masatoshi MORl and Keinosuke GOTOR t Department of Management Engineering, Kinki University, Iizuka 82, Japan t Department of Civil Engineering, Nagasaki University,
Abstract Quickbird Vs Aerial photos in identifying man-made objects
 Abstract Quickbird Vs Aerial s in identifying man-made objects Abdullah Mah abdullah.mah@aramco.com Remote Sensing Group, emap Division Integrated Solutions Services Department (ISSD) Saudi Aramco, Dhahran
MULTI-TEMPORAL SATELLITE IMAGES WITH BATHYMETRY CORRECTION FOR MAPPING AND ASSESSING SEAGRASS BED CHANGES IN DONGSHA ATOLL
 MULTI-TEMPORAL SATELLITE IMAGES WITH BATHYMETRY CORRECTION FOR MAPPING AND ASSESSING SEAGRASS BED CHANGES IN DONGSHA ATOLL Chih -Yuan Lin and Hsuan Ren Center for Space and Remote Sensing Research, National
Application of Soft Classification Algorithm In Increasing Per Class Classification Accuracy Of Coral Habitat. Aidy M Muslim
 Application of Soft Classification Algorithm In Increasing Per Class Classification Accuracy Of Coral Habitat Aidy M Muslim INTRODUCTION Coral reefs play an essential role to our ecosystem and offer the
CLASSIFICATION OF VEGETATION AREA FROM SATELLITE IMAGES USING IMAGE PROCESSING TECHNIQUES ABSTRACT
 CLASSIFICATION OF VEGETATION AREA FROM SATELLITE IMAGES USING IMAGE PROCESSING TECHNIQUES Arpita Pandya Research Scholar, Computer Science, Rai University, Ahmedabad Dr. Priya R. Swaminarayan Professor
USING LANDSAT MULTISPECTRAL IMAGES IN ANALYSING FOREST VEGETATION
 Technical Sciences 243 USING LANDSAT MULTISPECTRAL IMAGES IN ANALYSING FOREST VEGETATION Teodor TODERA teotoderas@yahoo.com Traian CR CEA traiancracea@yahoo.com Alina NEGOESCU alina.negoescu@yahoo.com
In late April of 1986 a nuclear accident damaged a reactor at the Chernobyl nuclear
 CHERNOBYL NUCLEAR POWER PLANT ACCIDENT Long Term Effects on Land Use Patterns Project Introduction: In late April of 1986 a nuclear accident damaged a reactor at the Chernobyl nuclear power plant in Ukraine.
Application of Satellite Image Processing to Earth Resistivity Map
 Application of Satellite Image Processing to Earth Resistivity Map KWANCHAI NORSANGSRI and THANATCHAI KULWORAWANICHPONG Power System Research Unit School of Electrical Engineering Suranaree University
San Diego State University Department of Geography, San Diego, CA. USA b. University of California, Department of Geography, Santa Barbara, CA.
 1 Plurimondi, VII, No 14: 1-9 Land Cover/Land Use Change analysis using multispatial resolution data and object-based image analysis Sory Toure a Douglas Stow a Lloyd Coulter a Avery Sandborn c David Lopez-Carr
FOREST MAPPING IN MONGOLIA USING OPTICAL AND SAR IMAGES
 FOREST MAPPING IN MONGOLIA USING OPTICAL AND SAR IMAGES D.Enkhjargal 1, D.Amarsaikhan 1, G.Bolor 1, N.Tsetsegjargal 1 and G.Tsogzol 1 1 Institute of Geography and Geoecology, Mongolian Academy of Sciences
AUTOMATIC DETECTION OF HEDGES AND ORCHARDS USING VERY HIGH SPATIAL RESOLUTION IMAGERY
 AUTOMATIC DETECTION OF HEDGES AND ORCHARDS USING VERY HIGH SPATIAL RESOLUTION IMAGERY Selim Aksoy Department of Computer Engineering, Bilkent University, Bilkent, 06800, Ankara, Turkey saksoy@cs.bilkent.edu.tr
COMPARISON OF INFORMATION CONTENTS OF HIGH RESOLUTION SPACE IMAGES
 COMPARISON OF INFORMATION CONTENTS OF HIGH RESOLUTION SPACE IMAGES H. Topan*, G. Büyüksalih*, K. Jacobsen ** * Karaelmas University Zonguldak, Turkey ** University of Hannover, Germany htopan@karaelmas.edu.tr,
* Tokai University Research and Information Center
 Effects of tial Resolution to Accuracies for t HRV and Classification ta Haruhisa SH Kiyonari i KASA+, uji, and Toshibumi * Tokai University Research and nformation Center 2-28-4 Tomigaya, Shi, T 151,
Remote sensing in archaeology from optical to lidar. Krištof Oštir ModeLTER Scientific Research Centre of the Slovenian Academy of Sciences and Arts
 Remote sensing in archaeology from optical to lidar Krištof Oštir ModeLTER Scientific Research Centre of the Slovenian Academy of Sciences and Arts Introduction Optical remote sensing Systems Search for
Interpreting land surface features. SWAC module 3
 Interpreting land surface features SWAC module 3 Interpreting land surface features SWAC module 3 Different kinds of image Panchromatic image True-color image False-color image EMR : NASA Echo the bat
Introduction to Remote Sensing
 Introduction to Remote Sensing Spatial, spectral, temporal resolutions Image display alternatives Vegetation Indices Image classifications Image change detections Accuracy assessment Satellites & Air-Photos
This week we will work with your Landsat images and classify them using supervised classification.
 GEPL 4500/5500 Lab 4: Supervised Classification: Part I: Selecting Training Sets Due: 4/6/04 This week we will work with your Landsat images and classify them using supervised classification. There are
DEVELOPMENT OF A NEW SOUTH AFRICAN LAND-COVER DATASET USING AUTOMATED MAPPING TECHINQUES. Mark Thompson 1
 DEVELOPMENT OF A NEW SOUTH AFRICAN LAND-COVER DATASET USING AUTOMATED MAPPING TECHINQUES. Mark Thompson 1 1 GeoTerraImage Pty Ltd, Pretoria, South Africa Abstract This talk will discuss the development
DEM GENERATION WITH WORLDVIEW-2 IMAGES
 DEM GENERATION WITH WORLDVIEW-2 IMAGES G. Büyüksalih a, I. Baz a, M. Alkan b, K. Jacobsen c a BIMTAS, Istanbul, Turkey - (gbuyuksalih, ibaz-imp)@yahoo.com b Zonguldak Karaelmas University, Zonguldak, Turkey
Present and future of marine production in Boka Kotorska
 Present and future of marine production in Boka Kotorska First results from satellite remote sensing for the breeding areas of filter feeders in the Bay of Kotor INTRODUCTION Environmental monitoring is
An Introduction to Remote Sensing & GIS. Introduction
 An Introduction to Remote Sensing & GIS Introduction Remote sensing is the measurement of object properties on Earth s surface using data acquired from aircraft and satellites. It attempts to measure something
GEOG432: Remote sensing Lab 3 Unsupervised classification
 GEOG432: Remote sensing Lab 3 Unsupervised classification Goal: This lab involves identifying land cover types by using agorithms to identify pixels with similar Digital Numbers (DN) and spectral signatures
IMPROVEMENT IN THE DETECTION OF LAND COVER CLASSES USING THE WORLDVIEW-2 IMAGERY
 IMPROVEMENT IN THE DETECTION OF LAND COVER CLASSES USING THE WORLDVIEW-2 IMAGERY Ahmed Elsharkawy 1,2, Mohamed Elhabiby 1,3 & Naser El-Sheimy 1,4 1 Dept. of Geomatics Engineering, University of Calgary
Spatial Analyst is an extension in ArcGIS specially designed for working with raster data.
 Spatial Analyst is an extension in ArcGIS specially designed for working with raster data. 1 Do you remember the difference between vector and raster data in GIS? 2 In Lesson 2 you learned about the difference
Caatinga - Appendix. Collection 3. Version 1. General coordinator Washington J. S. Franca Rocha (UEFS)
") Caatinga - Appendix Collection 3 Version 1 General coordinator Washington J. S. Franca Rocha (UEFS) Team Diego Pereira Costa (UEFS/GEODATIN) Frans Pareyn (APNE) José Luiz Vieira (APNE) Rodrigo N. Vasconcelos
Caatinga - Appendix Collection 3 Version 1 General coordinator Washington J. S. Franca Rocha (UEFS) Team Diego Pereira Costa (UEFS/GEODATIN) Frans Pareyn (APNE) José Luiz Vieira (APNE) Rodrigo N. Vasconcelos
of Stand Development Classes
 Wang, Silva Fennica Poso, Waite 32(3) and Holopainen research articles The Use of Digitized Aerial Photographs and Local Operation for Classification... The Use of Digitized Aerial Photographs and Local
F2 - Fire 2 module: Remote Sensing Data Classification
 F2 - Fire 2 module: Remote Sensing Data Classification F2.1 Task_1: Supervised and Unsupervised classification examples of a Landsat 5 TM image from the Center of Portugal, year 2005 F2.1 Task_2: Burnt
Remote Sensing And Gis Application in Image Classification And Identification Analysis.
 Quest Journals Journal of Research in Environmental and Earth Science Volume 3~ Issue 5 (2017) pp: 55-66 ISSN(Online) : 2348-2532 www.questjournals.org Research Paper Remote Sensing And Gis Application
Enhancement of Multispectral Images and Vegetation Indices
 Enhancement of Multispectral Images and Vegetation Indices ERDAS Imagine 2016 Description: We will use ERDAS Imagine with multispectral images to learn how an image can be enhanced for better interpretation.
Sommersemester Prof. Dr. Christoph Kleinn Institut für Waldinventur und Waldwachstum Arbeitsbereich Fernerkundung und Waldinventur.
 Basics of Remote Sensing Some literature references Franklin, SE 2001 Remote Sensing for Sustainable Forest Management Lewis Publishers 407p Lillesand, Kiefer 2000 Remote Sensing and Image Interpretation
EXPLORING THE POTENTIAL FOR A FUSED LANDSAT-MODIS SNOW COVERED AREA PRODUCT. David Selkowitz 1 ABSTRACT INTRODUCTION
 EXPLORING THE POTENTIAL FOR A FUSED LANDSAT-MODIS SNOW COVERED AREA PRODUCT David Selkowitz 1 ABSTRACT Results from nine 3 x 3 km study areas in the Rocky Mountains of Colorado, USA demonstrate there is
Image Analysis based on Spectral and Spatial Grouping
 Image Analysis based on Spectral and Spatial Grouping B. Naga Jyothi 1, K.S.R. Radhika 2 and Dr. I. V.Murali Krishna 3 1 Assoc. Prof., Dept. of ECE, DMS SVHCE, Machilipatnam, A.P., India 2 Assoc. Prof.,
PROGRESS REPORT MAPPING THE RIPARIAN VEGETATION USING MULTIPLE HYPERSPECTRAL AIRBORNE IMAGERY OVER THE REPUBLICAN RIVER, NEBRASKA
 PROGRESS REPORT MAPPING THE RIPARIAN VEGETATION USING MULTIPLE HYPERSPECTRAL AIRBORNE IMAGERY OVER THE REPUBLICAN RIVER, NEBRASKA PROJECT SUMMARY By Dr. Ayse Irmak and Dr. Sami Akasheh As the dependency
Introduction to Remote Sensing
 Introduction to Remote Sensing Daniel McInerney Urban Institute Ireland, University College Dublin, Richview Campus, Clonskeagh Drive, Dublin 14. 16th June 2009 Presentation Outline 1 2 Spaceborne Sensors
CanImage. (Landsat 7 Orthoimages at the 1: Scale) Standards and Specifications Edition 1.0
 Standards and Specifications Edition 1.0") CanImage (Landsat 7 Orthoimages at the 1:50 000 Scale) Standards and Specifications Edition 1.0 Centre for Topographic Information Customer Support Group 2144 King Street West, Suite 010 Sherbrooke, QC
CanImage (Landsat 7 Orthoimages at the 1:50 000 Scale) Standards and Specifications Edition 1.0 Centre for Topographic Information Customer Support Group 2144 King Street West, Suite 010 Sherbrooke, QC
What is Remote Sensing? Contents. Image Fusion in Remote Sensing. 1. Optical imagery in remote sensing. Electromagnetic Spectrum
 Contents Image Fusion in Remote Sensing Optical imagery in remote sensing Image fusion in remote sensing New development on image fusion Linhai Jing Applications Feb. 17, 2011 2 1. Optical imagery in remote
Geo/SAT 2 INTRODUCTION TO REMOTE SENSING
 Geo/SAT 2 INTRODUCTION TO REMOTE SENSING Paul R. Baumann, Professor Emeritus State University of New York College at Oneonta Oneonta, New York 13820 USA COPYRIGHT 2008 Paul R. Baumann Introduction Remote
NRS 415 Remote Sensing of Environment
 NRS 415 Remote Sensing of Environment 1 High Oblique Perspective (Side) Low Oblique Perspective (Relief) 2 Aerial Perspective (See What s Hidden) An example of high spatial resolution true color remote
MONITORING OF FOREST DAMAGE CAUSED BY GYPSY MOTH IN HUNGARY USING ENVISAT MERIS DATA ( )
") MONITORING OF FOREST DAMAGE CAUSED BY GYPSY MOTH IN HUNGARY USING ENVISAT DATA (2005-2006) G. Nádor, I. László, Zs. Suba, G. Csornai Remote Sensing Centre, Institute of Geodesy Cartography and Remote Sensing
MONITORING OF FOREST DAMAGE CAUSED BY GYPSY MOTH IN HUNGARY USING ENVISAT DATA (2005-2006) G. Nádor, I. László, Zs. Suba, G. Csornai Remote Sensing Centre, Institute of Geodesy Cartography and Remote Sensing
Land Cover Change in Saipan, CNMI from 1978 to 2009
 International Journal of Environment and Resource Volume 5, 2016 doi: 10.14355/ijer.2016.05.002 www.ij-er.org Land Cover Change in Saipan, CNMI from 1978 to 2009 Yuming Wen *1, Derek Chambers 2 1 Water
Preparing Remote Sensing Data for Natural Resources Mapping (image enhancement, rectifications )
") Preparing Remote Sensing Data for Natural Resources Mapping (image enhancement, rectifications ) Why is this important What are the major approaches Examples of digital image enhancement Follow up exercises
Preparing Remote Sensing Data for Natural Resources Mapping (image enhancement, rectifications ) Why is this important What are the major approaches Examples of digital image enhancement Follow up exercises
GEOG432: Remote sensing Lab 3 Unsupervised classification
 GEOG432: Remote sensing Lab 3 Unsupervised classification Goal: This lab involves identifying land cover types by using agorithms to identify pixels with similar Digital Numbers (DN) and spectral signatures
REMOTE SENSING OF RIVERINE WATER BODIES
 REMOTE SENSING OF RIVERINE WATER BODIES Bryony Livingston, Paul Frazier and John Louis Farrer Research Centre Charles Sturt University Wagga Wagga, NSW 2678 Ph 02 69332317, Fax 02 69332737 blivingston@csu.edu.au
VALIDATION OF THE CLOUD AND CLOUD SHADOW ASSESSMENT SYSTEM FOR LANDSAT IMAGERY (CASA-L VERSION 1.3)
") GDA Corp. VALIDATION OF THE CLOUD AND CLOUD SHADOW ASSESSMENT SYSTEM FOR LANDSAT IMAGERY (-L VERSION 1.3) GDA Corp. has developed an innovative system for Cloud And cloud Shadow Assessment () in Landsat
GDA Corp. VALIDATION OF THE CLOUD AND CLOUD SHADOW ASSESSMENT SYSTEM FOR LANDSAT IMAGERY (-L VERSION 1.3) GDA Corp. has developed an innovative system for Cloud And cloud Shadow Assessment () in Landsat
Remote Sensing Part 3 Examples & Applications
 Remote Sensing Part 3 Examples & Applications Review: Spectral Signatures Review: Spectral Resolution Review: Computer Display of Remote Sensing Images Individual bands of satellite data are mapped to
INTEGRATED DEM AND PAN-SHARPENED SPOT-4 IMAGE IN URBAN STUDIES
 INTEGRATED DEM AND PAN-SHARPENED SPOT-4 IMAGE IN URBAN STUDIES G. Doxani, A. Stamou Dept. Cadastre, Photogrammetry and Cartography, Aristotle University of Thessaloniki, GREECE gdoxani@hotmail.com, katerinoudi@hotmail.com
EVALUATION OF THE EXTENSION AND DEGRADATION OF MANGROVE AREAS IN SERGIPE STATE WITH REMOTE SENSING DATA
 EVALUATION OF THE EXTENSION AND DEGRADATION OF MANGROVE ABSTRACT AREAS IN SERGIPE STATE WITH REMOTE SENSING DATA Myrian M. Abdon Ernesto G.M.Vieira Carmem R.S. Espindola Alberto W. Setzer Instituto de
Building Damage Mapping of the 2006 Central Java, Indonesia Earthquake Using High-Resolution Satellite Images
 4th International Workshop on Remote Sensing for Post-Disaster Response, 25-26 Sep. 2006, Cambridge, UK Building Damage Mapping of the 2006 Central Java, Indonesia Earthquake Using High-Resolution Satellite
Lecture 13: Remotely Sensed Geospatial Data
 Lecture 13: Remotely Sensed Geospatial Data A. The Electromagnetic Spectrum: The electromagnetic spectrum (Figure 1) indicates the different forms of radiation (or simply stated light) emitted by nature.
Land Cover Change Analysis An Introduction to Land Cover Change Analysis using the Multispectral Image Data Analysis System (MultiSpec )
") Land Cover Change Analysis An Introduction to Land Cover Change Analysis using the Multispectral Image Data Analysis System (MultiSpec ) Level: Grades 9 to 12 Windows version With Teacher Notes Earth Observation
Land Cover Change Analysis An Introduction to Land Cover Change Analysis using the Multispectral Image Data Analysis System (MultiSpec ) Level: Grades 9 to 12 Windows version With Teacher Notes Earth Observation
Remote Sensing. Odyssey 7 Jun 2012 Benjamin Post
 Remote Sensing Odyssey 7 Jun 2012 Benjamin Post Definitions Applications Physics Image Processing Classifiers Ancillary Data Data Sources Related Concepts Outline Big Picture Definitions Remote Sensing
Classification in Image processing: A Survey
 Classification in Image processing: A Survey Rashmi R V, Sheela Sridhar Department of computer science and Engineering, B.N.M.I.T, Bangalore-560070 Department of computer science and Engineering, B.N.M.I.T,
Black Dot shows actual Point location
 207 Plate 1 Use of scanned archive aerial photographs, digital photogrammetry and GIS to plot river channel erosion along the Afon Trannon, Wales (part of the study by Mount et al 2000, 2003). Plate 2
Topographic mapping from space K. Jacobsen*, G. Büyüksalih**
 Topographic mapping from space K. Jacobsen*, G. Büyüksalih** * Institute of Photogrammetry and Geoinformation, Leibniz University Hannover ** BIMTAS, Altunizade-Istanbul, Turkey KEYWORDS: WorldView-1,
Evaluating the Effects of Shadow Detection on QuickBird Image Classification and Spectroradiometric Restoration
 Remote Sens. 2013, 5, 4450-4469; doi:10.3390/rs5094450 Article OPEN ACCESS Remote Sensing ISSN 2072-4292 www.mdpi.com/journal/remotesensing Evaluating the Effects of Shadow Detection on QuickBird Image
Abstract Urbanization and human activities cause higher air temperature in urban areas than its
 Observe Urban Heat Island in Lucas County Using Remote Sensing by Lu Zhao Table of Contents Abstract Introduction Image Processing Proprocessing Temperature Calculation Land Use/Cover Detection Results
Image Registration Issues for Change Detection Studies
 Image Registration Issues for Change Detection Studies Steven A. Israel Roger A. Carman University of Otago Department of Surveying PO Box 56 Dunedin New Zealand israel@spheroid.otago.ac.nz Michael R.
A map says to you, 'Read me carefully, follow me closely, doubt me not.' It says, 'I am the Earth in the palm of your hand. Without me, you are alone
 A map says to you, 'Read me carefully, follow me closely, doubt me not.' It says, 'I am the Earth in the palm of your hand. Without me, you are alone and lost. Beryl Markham (West With the Night, 1946
Augment the Spatial Resolution of Multispectral Image Using PCA Fusion Method and Classified It s Region Using Different Techniques.
 Augment the Spatial Resolution of Multispectral Image Using PCA Fusion Method and Classified It s Region Using Different Techniques. Israa Jameel Muhsin 1, Khalid Hassan Salih 2, Ebtesam Fadhel 3 1,2 Department
Comparing of Landsat 8 and Sentinel 2A using Water Extraction Indexes over Volta River
 Journal of Geography and Geology; Vol. 10, No. 1; 2018 ISSN 1916-9779 E-ISSN 1916-9787 Published by Canadian Center of Science and Education Comparing of Landsat 8 and Sentinel 2A using Water Extraction
How to Access Imagery and Carry Out Remote Sensing Analysis Using Landsat Data in a Browser
 How to Access Imagery and Carry Out Remote Sensing Analysis Using Landsat Data in a Browser Including Introduction to Remote Sensing Concepts Based on: igett Remote Sensing Concept Modules and GeoTech
The Investigation of Classification Methods of High-Resolution Imagery
 The Investigation of Classification Methods of High-Resolution Imagery Tracey S. Frescino 1, Gretchen G. Moisen 2, Larry DeBlander 3, and Michel Guerin 4 Abstract. As remote-sensing technology advances,
Remote Sensing for Rangeland Applications
 Remote Sensing for Rangeland Applications Jay Angerer Ecological Training June 16, 2012 Remote Sensing The term "remote sensing," first used in the United States in the 1950s by Ms. Evelyn Pruitt of the
Multi-Resolution Analysis of MODIS and ASTER Satellite Data for Water Classification
 Corina Alecu, Simona Oancea National Meteorological Administration 97 Soseaua Bucuresti-Ploiesti, 013686, Sector 1, Bucharest Romania corina.alecu@meteo.inmh.ro Emily Bryant Dartmouth Flood Observatory,
2007 Land-cover Classification and Accuracy Assessment of the Greater Puget Sound Region
 2007 Land-cover Classification and Accuracy Assessment of the Greater Puget Sound Region Urban Ecology Research Laboratory Department of Urban Design and Planning University of Washington May 2009 1 1.
PROCEEDINGS - AAG MIDDLE STATES DIVISION - VOL. 21, 1988
 PROCEEDINGS - AAG MIDDLE STATES DIVISION - VOL. 21, 1988 SPOTTING ONEONTA: A COMPARISON OF SPOT 1 AND landsat 1 IN DETECTING LAND COVER PATTERNS IN A SMALL URBAN AREA Paul R. Baumann Department of Geography
Textural analysis of coca plantations using 1-meter-resolution remotely-sensed data
 UNODC Workshop, 25-28 November, Bogota, Colombia 1 Textural analysis of coca plantations using 1-meter-resolution remotely-sensed data Workshop on Measurement of Cultivation and Production of Coca Leaves
OPTICAL RS IMAGE INTERPRETATION
 1 OPTICAL RS IMAGE INTERPRETATION Lecture 8 Visible Middle Infrared Image Bands 2 Data Processing Information data in a useable form Interpretation Visual AI (Machine learning) Recognition, Classification,
Sensors and Data Interpretation II. Michael Horswell
 Sensors and Data Interpretation II Michael Horswell Defining remote sensing 1. When was the last time you did any remote sensing? acquiring information about something without direct contact 2. What are
Lecture Series SGL 308: Introduction to Geological Mapping Lecture 8 LECTURE 8 REMOTE SENSING METHODS: THE USE AND INTERPRETATION OF SATELLITE IMAGES
 LECTURE 8 REMOTE SENSING METHODS: THE USE AND INTERPRETATION OF SATELLITE IMAGES LECTURE OUTLINE Page 8.0 Introduction 114 8.1 Objectives 115 115 8.2 Remote Sensing: Method of Operation 8.3 Importance
IKONOS High Resolution Multispectral Scanner Sensor Characteristics
 High Spatial Resolution and Hyperspectral Scanners IKONOS High Resolution Multispectral Scanner Sensor Characteristics Launch Date View Angle Orbit 24 September 1999 Vandenberg Air Force Base, California,
Introduction of Satellite Remote Sensing
 Introduction of Satellite Remote Sensing Spatial Resolution (Pixel size) Spectral Resolution (Bands) Resolutions of Remote Sensing 1. Spatial (what area and how detailed) 2. Spectral (what colors bands)
Satellite image classification
 Satellite image classification EG2234 Earth Observation Image Classification Exercise 29 November & 6 December 2007 Introduction to the practical This practical, which runs over two weeks, is concerned
Int n r t o r d o u d c u ti t on o n to t o Remote Sensing
 Introduction to Remote Sensing Definition of Remote Sensing Remote sensing refers to the activities of recording/observing/perceiving(sensing)objects or events at far away (remote) places. In remote sensing,
GE 113 REMOTE SENSING
 GE 113 REMOTE SENSING Topic 5. Introduction to Digital Image Interpretation and Analysis Lecturer: Engr. Jojene R. Santillan jrsantillan@carsu.edu.ph Division of Geodetic Engineering College of Engineering
Lecture 6: Multispectral Earth Resource Satellites. The University at Albany Fall 2018 Geography and Planning
 Lecture 6: Multispectral Earth Resource Satellites The University at Albany Fall 2018 Geography and Planning Outline SPOT program and other moderate resolution systems High resolution satellite systems
Automated GIS data collection and update
 Walter 267 Automated GIS data collection and update VOLKER WALTER, S tuttgart ABSTRACT This paper examines data from different sensors regarding their potential for an automatic change detection approach.
Satellite Remote Sensing: Earth System Observations
 Satellite Remote Sensing: Earth System Observations Land surface Water Atmosphere Climate Ecosystems 1 EOS (Earth Observing System) Develop an understanding of the total Earth system, and the effects of
LIFE ENVIRONMENT STRYMON
 LIFE ENVIRONMENT STRYMON Ecosystem Based Water Resources Management to Minimize Environmental Impacts from Agriculture Using State of the Art Modeling Tools in Strymonas Basin LIFE03 ENV/GR/000217 Task
SUGAR_GIS. From a user perspective. Provides spatial distribution of a wide range of sugarcane production data in an easy to use and sensitive way.
 SUGAR_GIS From a user perspective What is Sugar_GIS? A web-based, decision support tool. Provides spatial distribution of a wide range of sugarcane production data in an easy to use and sensitive way.
Managing and Monitoring Intertidal Oyster Reefs with Remote Sensing in Coastal South Carolina
 Managing and Monitoring Intertidal Oyster Reefs with Remote Sensing in Coastal South Carolina A cooperative effort between: Coastal Services Center South Carolina Department of Natural Resources City of
University of Texas at San Antonio EES 5053 Term Project CORRELATION BETWEEN NDVI AND SURFACE TEMPERATURES USING LANDSAT ETM + IMAGERY NEWFEL MAZARI
 University of Texas at San Antonio EES 5053 Term Project CORRELATION BETWEEN NDVI AND SURFACE TEMPERATURES USING LANDSAT ETM + IMAGERY NEWFEL MAZARI Introduction and Objectives The present study is a correlation
Introduction to Remote Sensing
 Introduction to Remote Sensing Outline Remote Sensing Defined Resolution Electromagnetic Energy (EMR) Types Interpretation Applications Remote Sensing Defined Remote Sensing is: The art and science of
Land cover change methods. Ned Horning
 Land cover change methods Ned Horning Version: 1.0 Creation Date: 2004-01-01 Revision Date: 2004-01-01 License: This document is licensed under a Creative Commons Attribution-Share Alike 3.0 Unported License.