Pulse Measurements. Application Note
|
|
|
- Elvin Gordon
- 5 years ago
- Views:
Transcription

1 Application Note Pulse Measurements The Anritsu VectorStar MS4640B series of Vector Network Analyzers are capable of generating and measuring pulsed signals when equipped with Option 035 IF Digitizer and Option 042 PulseView. Four internal signal generators are included enabling singlet, doublet, triplet, quadruplet, and/or burst signal generation. Pulse measurements include pulse profile, point-in-pulse, and pulse-to-pulse capability. Option 035 IF Digitizer Option 042 PulseView Pulse Modulator Test Sets are available to pulse the RF stimulus and/or provide receiver gating 1 (modulation). The Pulse Modulator Test Set frequency range is limited to that of the VNA with which it is used. SM6628, 70 khz to 40 GHz. Provides the MS4642B and MS4644B VNA with source modulation. SM6629, 70 khz to 40 GHz. Provides the MS4642B and MS4644B VNA with source and receiver modulation. SM6630, 70 khz to 70 GHz. Provides the MS4645B and MS4647B VNA with source modulation. SM6631, 70 khz to 70 GHz. Provides the MS4645B and MS4647B VNA with source and receiver modulation. Pulse Modulator Test Sets require direct access loops found in: Option 051 Direct Access Loops Options 061/062 Active Measurements Suite Providing: An innovative high-speed digitizer architecture The industry s highest resolution measurements The longest record lengths Independent receiver measurements An intuitive graphical configuration tool Instant results on measurement parameter changes 1 Receiver gating is generally only required for higher power antenna and related applications, where undesired pulses could saturate the VNA receiver.
2 I. Introduction II. Pulse Capability Overview A. Terms and synonyms B. Pulse measurement modes: Pulse profiling (PP), point-in-pulse (PIP), and pulse-to-pulse (P2P) C. Pulse generation: singlet, doublet, triplet, quadruplet, and burst D. RF stimulus modulation and receiver gating III. Pulse Measurement Applications A. 5 examples IV. Review of Pulse Measurement Methodologies A. Historic wideband method B. Narrowband method C. High-speed digitizer method (VectorStar s innovative architecture) V. Example Measurements A. Pulse profiling (PP) Highlights: Signal generation options on four built-in pulse generators Intuitive graphical configuration tool for greater confidence in measurement/setup Industry s highest resolution measurements Independent measurement receiver windows B. Point-in-pulse (PIP) frequency and power sweeps Highlights: Zoom capability in GUI for greater confidence in measurement/setup Instant results on measurement parameter changes C. Pulse-to-pulse (P2P) Highlights: Unique display only presenting the data of interest Long record lengths up to 500 ms at full resolution VI. Measurement Tips and Considerations A. Calibration B. Minimizing Uncertainties VII. Summary 2 VectorStar Pulse Measurements Anritsu
3 I. Introduction Pulsed S-parameter and related measurements are critical for many common applications: Tests of system and subsystems designed to operate in pulsed conditions. Pulsed system and subsystem measurements that may be needed examine phase and amplitude distortions at pulse onset or droop later in a pulse, as well as in cases where the subsystem was designed to operate pulsed. Measurement of devices and components that are designed to operate in pulsed conditions. Device characterization, where pulsed operation is required for thermal reasons (for example, un-mounted power devices). Device characterization, where pulsed operation is required to explore certain device characteristics. Trapping and thermal parameter characterization are two common tasks that benefit from pulsed measurement. When making pulsed measurements for the applications listed above, many aspects of the test system may be of interest. A VNA is typically used when there is a need for a measurement correction, phase data, or for a more integrated test suite. II. Pulse Capability Overview A. Terms and synonyms A number of other terms for pulse measurements are commonly used. This list will help to explain terms used elsewhere in this document. Duty cycle or duty factor Pulse width relative to the pulse period, often expressed as a percentage. Common values range from 0.01 % to 50 %. This may pertain to a stimulus RF pulse, a bias pulse, a receiver gating function, or a profiling pulse, so context matters. PRI and PRF Pulse repetition interval (= pulse period) and pulse repetition frequency (= pulse repetition rate). PRI=1/PRF. Pulse width and delay These two numbers together with the PRF uniquely define a pulse train; however, there are cases when there are multiple pulses per period (see below). Pulse patterns (singlet, doublet, quadruplet, and burst) - Defines what occurs once during each pulse period of the master clock. The default is a single pulse, hence the term singlet. Sometimes more than one pulse is required per master clock period, hence other settings are available. Burst is a user defined number of pulses within a period. All sub-pulse widths are the same and all intra-sub-pulse gaps are the same; see Figure 1. (Multiple pulses per period are particularly common in radar applications.) Record length The amount of time to be captured within a measurement. This is dependent on the PRI and duty cycle, the amount of averaging requested, and the measurement mode. Synch pulse (T 0 ) This pulse establishes global timing and can either be generated by the MS4640B Series instrument or by an external pulse generator (in which case, the MS4640B Series can accept that signal as an input). For example, when coherence is needed among pulse generators, a common synch pulse is often shared between them. Synchronization of 10 MHz timebases may be needed as well. T start and T stop These terms apply to pulse profiling setups and define the time range of interest relative to the synch pulse for profiling. Together with the number of time points, the measurement window width, and the requested averaging, these define the acquisition and processing behavior for pulse profiling. T start and T stop can also be used as parameters for plotting data in pulse-to-pulse measurements. Measurement width or Aperture This measure of time describes what portion of the pulse should be analyzed in a given measurement. For point-in-pulse and pulse-to-pulse measurements, it is the section of the pulse to be processed (with a delay parameter specifying where, relative to T 0, this window should be). For pulse profiling, this width is swept across the pulse with processing across the measurement width being performed at each time step requested between T start and T stop. B. Pulse measurement modes: Pulse profiling (PP), point-in-pulse (PIP), and pulse-to-pulse (P2P) Point-in-Pulse This measurement quantifies S-parameter data somewhere within a pulse. One may want to avoid edge effects or just measure the pulse as a whole, but the structure within the pulse is not of great interest nor is the variation from pulse to pulse. A point-in-pulse measurement is illustrated in Figure 2. Data is acquired over a requisite length of time; the user specifies the interval of interest relative to a synch pulse T 0. This interval is usually quantified in terms of a Delay and a desired Measurement Width or aperture. Anritsu VectorStar Pulse Measurements 3
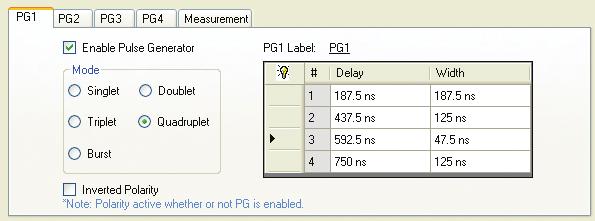
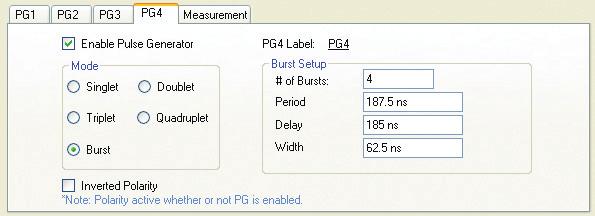
4 In addition, a level of averaging can be specified in which case this same interval is analyzed on multiple pulses and the results combined. Pulses are sampled with the same coherent clock and phase information is maintained. The diagram in Figure 2 illustrates an example where the width of interest is eight samples. Only a single sample is required for measurement; about four hundred million samples are possible, limited only by the record length of the instrument. Point-in-pulse measurements are often made with swept frequency or power and plotted as such. In these cases, the above process is simply repeated for multiple frequencies and power levels. Pulse Profile The pulse profile measurement focusses on the structure of data within the pulse. Characteristics like overshoot or undershoot, droop, and edge response are measured, while the frequency and power are kept constant (although they can be varied between acquisitions). This data is normally plotted vs. time to indicate position within the pulse (measurement normally is setup as constant frequency (CW) and constant power, but more complex measurements can be orchestrated using multiple channels or setups). Variation between pulses is often not observable in this measurement, which may represent an average over a number of pulses. One can structure the measurement, however, to look at behavior from an absolute start time with no averaging in order to look at the complete evolution over multiple pulses. A measurement example is diagrammed in Figure 2. A start time and a stop time (T start and T stop ) are specified along with a number of time points relative to the synch pulse (T 0 ) to describe the portion of the pulse to be profiled. The measurement may begin before the physical pulse is at the DUT and end after the pulse is no longer being applied to the DUT, but the data must be interpreted appropriately in all cases. A measurement width is also specified (eight samples in the diagram). Additional averaging can be imposed across multiple pulses, as discussed previously. As with point-in-pulse, the range of allowed widths is large. The measurement windows are allowed to overlap (and will if (T stop T start ) / (NumTimePoints 1) < Measurement Width), which performs a variety of time-based smoothing operations on the data. A common setup is 10 to 20 non-overlapping (or slightly overlapping) profiling time points within a pulse, but application requirements may dictate very different parameter choices. Pulse-to-Pulse Pulse-to-pulse measurements concentrate on variations between pulses that begin with an absolute start time. This type of measurement can be described as a hybrid of the first two methods. Normally one will pick a section of the pulse to measure, and then the progression over a number of pulses is plotted (versus time or index of the pulse number). This process is illustrated in Figure 2, where the first three pulses are shown. The delay from T 0 (Delay in this diagram) is the same for each measurement window of interest and the window in each pulse is processed separately. Pulses are treated in an absolute fashion, so averaging of multiple pulses is not useful and is not available. As with pulse profiling, this measurement is performed at constant frequency (CW) and constant power. One could orchestrate measurements that cycled through a variety of frequencies and power levels using multiple channels or setups. C. Pulse generation: singlet, doublet, triplet, quadruplet, and burst The combination of Option 035 IF Digitizer and Option 042 PulseView enable use of four pulse generators. As described earlier, the definition of the types of pulses that can be generated are based on what occurs once during each pulse period of the master clock. The default is a single pulse, hence the term singlet. Sometimes more than one pulse is required per master clock period, hence other settings are available. Burst is a user defined number of pulses within a period. All sub-pulse widths are the same and all intra-sub-pulse gaps are the same. Pulse generators can be configured as standard or inverted polarity. See Figure 1 for diagrams of the pulse generation modes and associated PulseView Configuration user interface. 4 VectorStar Pulse Measurements Anritsu


5 Figure 1. Pulse Generation Modes and Associated PulseView Configuration User Interface. Anritsu VectorStar Pulse Measurements 5


6 Figure 2. Pulse Measurement Modes and Associated PulseView Configuration User Interface. 6 VectorStar Pulse Measurements Anritsu
7 D. RF stimulus modulation and receiver gating To provide the DUT with a pulsed RF stimulus, a Pulse Modulator Test Set must be utilized. Pulse Modulator Test Sets also include reference coupling, which can be useful in many applications. The block diagram of a fully configured Pulse Modulator Test Set (four modulators) is shown in Figure 3. The base model has only the source path modulators and does not include the elements designated with dashed lines. Figure 3. Pulse Modulator Test Set Architecture. The receive side paths of the Pulse Modulator Test Sets (shown in dashed lines above) are typically only used in specific, very limited applications. For example, in certain antenna measurement applications, the transmit leakage pulse may be large enough to compress the receivers such that it cannot accurately measure the return pulse (which occurs later in time). An RF Modulator can be used to prevent this leakage pulse from being processed by the receiver so one can concentrate on the pulse from the target or some other object. This type of special receiverside modulation is applicable to all measurement methods and is more of a tool to prevent measurement distortion rather than a tool for acquisition in itself. Figure 4. Receiver-gated measurements. Anritsu VectorStar Pulse Measurements 7
8 III. Pulse Measurement Setup Configurations A. 5 examples The diagrams and descriptions below describe five common pulse measurement setup configurations for five common measurement applications. 1. RADAR system component test using 2-modulator test set. User is testing a component in which the normal use is with a uni-directional pulse for a typical component characterization. 2. and 1A. RADAR system component test using 2-modulator test set. User may either be testing a component in which the normal use is with a uni-directional pulse, but the user wants to include the response to a reverse direction pulse for a complete component characterization (1A) or a T/R module in which bi-directional RF pulsing is required (2). 3. On-wafer power amplifier device test with CW RF and a pulsed bias. User will utilize internal pulse generators to control the bias to the on-wafer device to compensate for the lack of availability of a heat sink and to minimize the thermal effects. 4. On-wafer power amplifier device test with pulsed RF and a pulsed bias using a 2- or 4-modulator test set. The amplifier intended end-use is a pulsed application (commonly for use in a RADAR system component), so the user will stimulate the device with a pulsed RF signal as well as utilize internal pulse generators to control the bias to the on-wafer device to compensate for the lack of availability of a heat sink and to minimize the thermal effects. Timing between pulses is important to ensure the RF is applied to the device while it is turned on. Normal use of the device is with a uni-directional pulse, but the user wants to include the response to a reverse direction pulse for a complete component characterization. 5. Bi-directional antenna test with pulsed signals. User may be concerned with leakage from a large pulsed transmit signal saturating their receiver and will use a 4-modulator test set to both pulse modulate the RF as well as gate (via pulsing) the received signal. 8 VectorStar Pulse Measurements Anritsu
9 IV. Review of Pulse Measurement Methodologies A. Historic Wideband Method The wideband pulse measurement method may be used when the majority of the RF pulse is within the bandwidth of the receiver (see below). For this section we are using the Historic reference because in the past most VNAs offered bandwidths only up to about 5 MHz. This has limited the wideband method to pulse widths of 200 nanoseconds or more. However, for these larger pulse widths, the wideband method has the advantage that there is no loss in dynamic range when the pulses have a low duty cycle (in contrast to the narrowband method discussed in section B). Receiver BW 1/PW f 1/PW f Pulse Width (PW) t PW t Figure 5. Historic wideband pulse measurement methods were limited by narrow IFBWs. Limitations of the Historic Wideband Method The major disadvantage of the wideband method has been the lower limit of measurable pulse widths. Basically, as the pulse width becomes narrower, the spectral energy spreads out. When too much of the pulse energy is outside the bandwidth of the receiver, the VNA can no longer detect the pulses properly. The minimum measurement window is determined by the following equation: T MW 1/IFBW In the past, the largest IFBW available was around 5 MHz, which translates to a minimum measurement window (T MW ) of 200 nanoseconds. For narrow pulses, test engineers had to use the narrowband method and take the dynamic range penalty for low duty cycles applications. A second challenges lies in data acquisition rate of many VNAs. Even with satisfactory bandwidth, limitations can exist if the sampling rate of the analog-to-digital converter (ADC) is not adequate (with measurement grade accuracy and resolution). Most contemporary VNAs have not incorporated sufficiently high-speed digitizers for today s radar-related measurement demands, leading to poor timing resolution and inadequate pulse profiling resolution/accuracy. Anritsu VectorStar Pulse Measurements 9
10 Noise Signal Signal Noise (a) f (b) f Pulse Width PRI Pulse Repitition Interval Duty cycle = PW/PRI = 33.3% (a) = 16.7% (b) t Dynamic range degradation = 20 * Log10 (Duty Cycle) = 9.5 db (a) = 15.5 db (b) t Figure 6. Narrowband pulse measurement method duty cycle dependence. B. Narrowband Measurement Method The band-limited, or narrowband measurement method is based on the spectrum of a pulsed RF signal and capitalizes on the fact that the central spectral line carries the magnitude and phase information of the underlying RF signal, f c (see Figure 6). After filtering out everything but this frequency, only a CW signal remains and standard VNA processing may be applied. The advantage of this technique is that narrow pulse widths can be measured. The lower limit is primarily limited by overall system IF bandwidth (and associated aliasing avoidance) while the profiling measurement resolution is limited by the receiver gating capability. In addition, from a processing point-of-view, the band-limited method is attractive because it only involves one frequency and is an asynchronous measurement (does not require synchronization with the incoming pulse). Limitations of the Narrowband Method The biggest limitation of the narrowband technique is that dynamic range becomes a function of the duty cycle. Since only the central spectral line is kept, a significant amount of energy in the remaining spectrum is discarded, particularly as the duty cycle shrinks. As the duty cycle becomes smaller, there is less power in the RF carrier signal which affects this method s available dynamic range the receiver becomes desensitized. The result is a dynamic range penalty of 20*log 10 (duty cycle). For a duty cycle of 0.1%, the available dynamic range is reduced by 60 db. C. High-speed digitizer method (VectorStar s innovative architecture) The high-speed digitizer measurement method represents a major technology advancement over prior test methods. While similar to the historic wideband method, this method is based on direct acquisition - but at a much higher data rate than was previously available. The Anritsu MS4640B VNA with options 035 and 042 (PulseView) offers a digital IF acquisition system with more than 200 MHz of bandwidth. As a result, resolutions are enhanced and time referencing becomes much more accurate. The exact acquisition method differs in that the acquisition itself is not controlled by the pulse system (except in the case of pulse-to-pulse measurements). Portions of the data can be recorded to be analyzed and correlated with the pulse pattern being used. Since no energy is being discarded in the high-speed digitizer pulse measurement method, there is no duty-cycle dependence. Full dynamic range (>100 db normally depending on IFBW, power levels and averaging for the MS4640B) is available. 10 VectorStar Pulse Measurements Anritsu
11 Figure 7. Block diagram Innovative High-speed digitizer architecture of Anritsu MS4640B VNA with options 035 and 042 (PulseView). V. Example Measurements A common goal of performing VNA-based pulse measurements is to characterize a device or component such that the design can be modified to get the behavior desired. As a result, most components on the market are well behaved and do not provide very interesting information for a measurement example. Therefore, the device-under-test (DUT) used in the measurement examples to follow has been specifically designed to exhibit behavior that will highlight aspects of the pulse measurements. Pulse modulation occurs in the DUT driven by Pulse Generator 4, but could also be achieved with one of the Anritsu Pulse Modulator Test Sets. DUT: Signals reflected from the short can combine constructively or destructively. Example DUT measurement at 10 GHz displaying the effect of incident and reflected signals combining. Anritsu VectorStar Pulse Measurements 11
![A. Pulse profiling (PP) 1. UTILITIES Preset; Select [OK] in Preset dialog box to preset the instrument 2.](/docs-images/86/94167081/images/12-0.jpg "APPLICATION; Application PulseView; [Continue] in the PulseView Application dialog box to enter the application 3. [FREQUENCY]; Frequency Start {5 GHz}; Stop {15 GHz}; # of Points {51} 4.")
![[POWER]; Power (Coupled) Port 1 Power {5 dbm} 5. CHANNEL Averaging; AVERAGING Averaging {toggle: ON}; Averaging Factor {10}; Averaging Type {toggle: Per Sweep}; IFBW {1 MHz} 6.](/docs-images/86/94167081/images/12-1.jpg "[TRACE]; Trace # of Traces {1}; Trace Layout; Trace Layout {Select single display, top entry} 7. [RESPONSE]; Response S21 8.")
12 A. Pulse profiling (PP) 1. UTILITIES Preset; Select [OK] in Preset dialog box to preset the instrument 2. APPLICATION; Application PulseView; [Continue] in the PulseView Application dialog box to enter the application 3. [FREQUENCY]; Frequency Start {5 GHz}; Stop {15 GHz}; # of Points {51} 4. [POWER]; Power (Coupled) Port 1 Power {5 dbm} 5. CHANNEL Averaging; AVERAGING Averaging {toggle: ON}; Averaging Factor {10}; Averaging Type {toggle: Per Sweep}; IFBW {1 MHz} 6. [TRACE]; Trace # of Traces {1}; Trace Layout; Trace Layout {Select single display, top entry} 7. [RESPONSE]; Response S21 8. [DISPLAY]; Display Trace Format; Trace Format Log Mag; drag Reference Position (circled arrow on measurement trace below) to position 9 (second from the top) 9. [Channel] Channel # of Channels {2}; Chan. Layout Chan. Layout {Select double vertical display, third from the top entry} 10. Click on the Ch2 (circled entry on the bottom of the screen) to activate Channel APPLICATION; Application PulseView; [Continue] in the PulseView Application dialog box to enter the application 12. [FREQUENCY]; Frequency Start {5 GHz}; Stop {15 GHz}; # of Points {51} 13. [POWER]; Power (Coupled) Port 1 Power {5 dbm} 14. CHANNEL Averaging; AVERAGING Averaging {toggle: ON}; Averaging Factor {10}; Averaging Type {toggle: Per Sweep}; IFBW {1 MHz} 15. [TRACE]; Trace # of Traces {1}; Trace Layout; Trace Layout {Select single display, top entry} 16. [RESPONSE]; Response S [DISPLAY]; Display Trace Format; Trace Format Log Mag; drag Reference Position (circled arrow on left of measurement trace) to position 9 (second from the top) 18. APPLICATION; Application PulseView Setup; PULSEVIEW SETUP PulseView Configuration 12 VectorStar Pulse Measurements Anritsu
![19. In the PulseView Configuration dialog box, perform the following: i. [PRI] {1 µs} ii.](/docs-images/86/94167081/images/13-0.jpg "[PG4] Select Enable Pulse Generator; Select PG4 Label {Enter PulseMod in the Edit Pulse Generator Name dialog box and [OK]}; Select Singlet Delay {50 ns}; Width {200 ns}; Select Inverted Polarity")
![(Note: Ensure PG1 is NOT enabled and Inverted Polarity is NOT selected.) iii. [Measurement] Select Pulse Profile (Profile); Select Couple Receiver Parameters; Measurement Width {12.](/docs-images/86/94167081/images/13-1.jpg "5 ns}; Start {0 ns}; Stop {400 ns}; # of point {33}; # of points = INT(400 ns/12.5 ns) + 1 to provide non-overlapping measurement windows iv. [DONE] 20.")
13 19. In the PulseView Configuration dialog box, perform the following: i. [PRI] {1 µs} ii. [PG4] Select Enable Pulse Generator; Select PG4 Label {Enter PulseMod in the Edit Pulse Generator Name dialog box and [OK]}; Select Singlet Delay {50 ns}; Width {200 ns}; Select Inverted Polarity (Note: Ensure PG1 is NOT enabled and Inverted Polarity is NOT selected.) iii. [Measurement] Select Pulse Profile (Profile); Select Couple Receiver Parameters; Measurement Width {12.5 ns}; Start {0 ns}; Stop {400 ns}; # of point {33}; # of points = INT(400 ns/12.5 ns) + 1 to provide non-overlapping measurement windows iv. [DONE] 20. [Frequency]; Frequency CW Frequency {10 GHz} 21. CHANNEL Averaging; AVERAGING Reset Avg Count These settings simulate the response that would be seen using other VNAs prior to the introduction of the pulse measurement capability of VectorStar (with PulseView). 22. Click on the Ch1 (entry on the bottom of the screen) to activate Channel APPLICATION; Application PulseView Setup; PULSEVIEW SETUP PulseView Configuration 24. In the PulseView Configuration dialog box, perform the following: i. [PRI] {1 µs} ii. [PG2] Select Enable Pulse Generator; Select Quadruplet 1. Delay {0 s}; Width {50 ns}; 2. Delay {100 ns}; Width {200 ns}; 3. Delay {325 ns}; Width {100 ns}; 4. Delay {525 ns}; Width {25 ns} iii. [PG3] Select Enable Pulse Generator; Select Burst # of Bursts {49}; Period {20 ns}; Delay {0 s}; Width {10 ns} iv. [PG4] Select Enable Pulse Generator; Select PG4 Label {Enter PulseMod in the Edit Pulse Generator Name dialog box and Select OK}; Select Singlet Delay {50 ns}; Width {200 ns}; Select Inverted Polarity (Note: Ensure PG1 is NOT enabled and Inverted Polarity is NOT selected.) With the PulseView graphical user interface, users get: Visual representation of signals and measurements Simple generator configuration Multiple pulse generation option Singlet Doublet Triplet Quadruplet Burst Ability to change labels for better test descriptors Anritsu VectorStar Pulse Measurements 13
![v. [Measurement] Select Pulse Profile (Profile); Select Couple Receiver Parameters; Measurement Width {2.5 ns}; Start {0 ns}; Stop {400 ns}; # of point {161}; # of points = INT(400 ns/2.](/docs-images/86/94167081/images/14-0.jpg "5 ns) + 1 to provide nonoverlapping measurement windows vi. [DONE] 25. [Frequency]; Frequency CW Frequency {10 GHz} 26.")
14 v. [Measurement] Select Pulse Profile (Profile); Select Couple Receiver Parameters; Measurement Width {2.5 ns}; Start {0 ns}; Stop {400 ns}; # of point {161}; # of points = INT(400 ns/2. 5 ns) + 1 to provide nonoverlapping measurement windows vi. [DONE] 25. [Frequency]; Frequency CW Frequency {10 GHz} 26. CHANNEL Averaging; AVERAGING Reset Avg Count VectorStar (with PulseView) enables industry-leading measurement 2.5 ns resolution. It enables users to get a true view of their device performance and see behavior they may have been missing. In the example above, the 12.5 ns resolution measurement does not capture the full magnitude of the signal overshoot. For applications with very sensitive receivers, the full magnitude of the overshoot could be the difference of whether or not a receiver enters saturation resulting in a number of unwanted effects. With the high resolution, designers may want to look at a variety of pulse characteristics, such as those described below. Figure 8. Common Pulse Characteristics of Interest 27. [Channel]; Channel # of Channels {1} 14 VectorStar Pulse Measurements Anritsu

15 Recall that in this example configuration, RF pulsing is occurring in the Pulse Demonstration Module. As a result, the reference signal is continuous wave (CW). In some applications, it may be preferable to use an Anritsu Pulse Modulator Test Set to modulate the RF stimulus either as an alternate to the DUT modulation or in addition to the DUT modulation; see Figure 9. When a Pulse Modulator Test Set is used to provide a pulsed RF stimulus, the pulsed stimulus can be the sampled and provided to the reference receivers. In that case, the user can capitalize on additional PulseView capability. See Figure 10 for an example configuration. Figure 9. An optional Anritsu Pulse Modulator Test Set enables RF stimulus modulation (and receiver gating [modulation] on some models. In many VNA-based pulsed measurement solutions, the receivers are coupled which means, for the most part, the receivers all measure the pulse with the same setup. Therefore, assuming there is no delay between reference and test receivers, when the pulse is off at one, it is also off in the other. Since S 21 is a ratio (b 2 /a 1 for VectorStar), in the off periods of the pulse, there is essentially a 0/0 ratio which may result in a noisy trace (see the plot on the left below) where it can be challenging to discern pulse edge behavior. PulseView enables measurement receivers to be configured independently. With the Anritsu Pulse Modulator Test Set, the modulated stimulus can be provided to the reference receivers (e.g., a 1 ); see Figure 10. Each receiver can then be independently controlled to achieve specific measurement results. In many cases, the user may want to avoid the transients in the reference signal. With independent measurement receivers, the user can select a more stable part of the pulsed signal as the reference measurement. To demonstrate this, the Pulse Modulator Test Set will now be used in this example measurement to modulate the RF signal rather than the Pulse Demonstration Module. Then, the reference receiver will be independently controlled to make a stationary measurement (i.e., the profile start and stop times will be the same) with a width that covers a significant portion of the essentially flat part of the pulse. Despite the measurement being stationary, the number of points must remain the same across all measurement receivers. Anritsu VectorStar Pulse Measurements 15
16 Pulse Modulator Test Set Pulse Demonstration Module VectorStar Block Diagram Figure 10. Example Test Configuration using a Pulse Modulator Test Set. 16 VectorStar Pulse Measurements Anritsu
17 28. APPLICATION; Application PulseView Setup; PULSEVIEW SETUP PulseView Configuration 29. In the PulseView Configuration dialog box, perform the following: i. [PG4] Deselect }; Deselect Inverted Polarity ii. [PG1] Select Enable Pulse Generator; Select PG4 Label {Enter TestSet in the Edit Pulse Generator Name dialog box and [OK]}; Select Singlet Delay {50 ns}; Width {200 ns}; Select Inverted Polarity iii. [Measurement] Deselect Couple Receiver Parameters; Select A1 from the Receiver pull down menu; Measurement Width {100 ns}; Start {160n s}; Stop {160 ns}; leave the # of point {161} iv. [DONE] The display should change from the left trace to the right trace. By doing this, the edge behavior of the DUT (Pulse Demonstration Module) is made visible. The value of independent receivers becomes more apparent when there are time delays in a measurement setup either due to the setup itself (e.g., long cable lengths to DUT) or the DUT (e.g. the DUT includes some filtering). To illustrate this concept, consider the delay between the pulse arriving at the a 1 and the pulse arriving at the b 2 receiver in the current test configuration. Given the time scale of this demonstration configuration (pulsewidth of 200 ns), the delay of the cables and DUT will be evident. In other cases, this delay may be insignificant. 30. APPLICATION; Application PulseView Setup; PULSEVIEW SETUP PulseView Configuration 31. In the PulseView Configuration dialog box, perform the following: i. [Measurement] Select B2 from the Receiver pull down menu; Select Couple Receiver Parameters to recouple the receivers ii. [DONE] Anritsu VectorStar Pulse Measurements 17
18 Since the DUT is essentially a transmission line, the expectation is that the S 21 would be reasonably well behaved perhaps with the exception of the pulse edges Returning to the display where receivers are coupled, there is some unusual behavior present. When a user encounters unexpected results in a ratio measurement, a common practice is to look at the elements of the ratio individually to see if any insight can be gained. 32. [RESPONSE]; Response User Defined; User Defined Numerator {B2}; Denominator {1} 33. [TRACE]; Trace # of Traces {2}; leave as Trace Layout {single display, top entry} 34. Select Trace 2 by clicking on the Tr2 identifier 35. [DISPLAY]; Display Trace Format; Trace Format {Log Mag}; drag Reference to position 9 (second from the top) (Note: it may be necessary to change the scale of Tr2 to match Tr1. If so, perform the following: [SCALE]; Scale Resolution {10} to change it to 10 db/div.) 36. [RESPONSE]; Response User Defined; User Defined Numerator {A1}; Denominator {1} From the display, it is obvious that there is a time delay between the a 1 and b 2 measurements such that when the values are ratioed for an S 21 value, the misalignment may lead to an unusual or unexpected plot. More importantly, the misalignment results in a S 21 response that may not be indicative of the DUT response especially at the pulse edges. Using independent receiver measurement windows (gates), the user can account for misalignment and delay the b 2 measurement by ~10 ns. Moreover, the user can adjust the delay to get the proper alignment while in the measurement window rather than having to go between multiple menus in competing products. 37. APPLICATION; Application PulseView Setup; PULSEVIEW SETUP PulseView Configuration 38. In the PulseView Configuration dialog box, perform the following: i. [Measurement] Select B2 from the Receiver pull down menu; Deselect Couple Receiver Parameters to uncouple the receivers ii. [DONE] 18 VectorStar Pulse Measurements Anritsu
 41.")
19 39. Select Trace 1 by clicking on the Tr2 identifier 40. PULSEVIEW SETUP Start {10 ns}; Stop {410 ns}; adjust as desired (Note: it is important to keep the time interval between start and stop at 400 ns to maintain the same scale as the a1/1 trace.) 41. [TRACE]; Trace # of Traces {1} 42. [RESPONSE]; Response S21 The result is an S21 measurement more representative of the DUT performance. At this point, the demonstration will be returned to the configuration where RF pulsing is occurring in the Pulse Demonstration Module, rather than the Pulse Modulator Test Set. As a result, the a1 reference signal will again will be continuous wave (CW). 43. APPLICATION; Application PulseView Setup; PULSEVIEW SETUP PulseView Configuration 44. In the PulseView Configuration dialog box, perform the following: i. [PG1] Deselect }; Deselect Inverted Polarity ii. [PG4] Select Enable Pulse Generator; Select Inverted Polarity iii. [Measurement] Select A1 from the Receiver pull down menu; Select Couple Receiver Parameters to recouple the receivers iv. [DONE] The display should change to the familiar trace on the right. Anritsu VectorStar Pulse Measurements 19
; Select B2 from the Receiver pull down list; Select Couple Receiver Parameters ii.")
20 *** The remainder of this application note will assume a Pulse Modulator Test Set is not being utilized. 45. APPLICATION; Application PulseView Setup; PULSEVIEW SETUP PulseView Configuration 46. In the PulseView Configuration dialog box, perform the following: i. [Measurement] Select Pulse Profile (Profile); Select B2 from the Receiver pull down list; Select Couple Receiver Parameters ii. [DONE] 47. APPLICATION; Application PulseView Setup PULSEVIEW SETUP PRI {1 µs}; PRI {10 µs}; PRI {100 µs}; return to PRI {10 µs} when finished Note: there is no reduction in dynamic range, unlike the VNAs which utilize a narrowband pulse measurement method. For this example measurement, the measurement width is 2.5 ns. The duty cycle for various PRIs would be: PRI Duty-Cycle Narrowband DR Reduction 1 µs 0.25% 52 db 10 µs 0.025% 72 db 100 µs % 92 db 20 VectorStar Pulse Measurements Anritsu
 The")
21 B. Point-in-pulse (PIP) frequency and power sweeps 48. [Marker]; Markers [1] Mkr 1 {toggle: ON}; Mkr 2 {toggle: ON}; drag markers to determine the good part of the pulse (where the good part is a stable part of the pulse avoiding edge transients) The pulse appears to be relatively flat beginning at ~160 ns for a duration of at least 100 ns (for convenient round numbers). Note: The modulation pulse has a delay of 50 ns, but the measured pulse edge doesn t occur until about 100 ns. The additional ~50 ns delay is due to latency in the modulator (specified at <55 ns typical) and some delay through the Pulse Demonstration Module. 49. [Marker]; Markers [1] Mkr 1 {toggle: OFF}; Mkr 2 {toggle: OFF} 50. CHANNEL Averaging; AVERAGING Averaging {toggle: OFF} 51. APPLICATION; Application PulseView Setup; PULSEVIEW SETUP PulseView Configuration 52. In the PulseView Configuration dialog box, perform the following: i. [ Measurement] Select Point-in-Pulse (PIP); Select Couple Receiver Parameters; Measurement Width {100 ns}; Delay {160 ns} ii. [Zoom Marker] iii. Drag vertical indices from right edge of display to set a zoom area and [Zoom In] iv. Drag vertical line to highlight timing of various pulse waveforms Anritsu VectorStar Pulse Measurements 21
 External accepts external T 0 and synchronizes within 55 ns (typical) v. [DONE] 53.")
22 Vertical indices provide visual confirmation of intended setup providing greater confidence in measurement results. Users might want to synchronize this measurement with other equipment (e.g., pulsed IV test instruments). [Synch]: Internal makes T 0 available on rear panel with <5ns delay (typical) External accepts external T 0 and synchronizes within 55 ns (typical) v. [DONE] 53. [FREQUENCY]; Frequency CW Mode {toggle: OFF}; # of Points {501} 54. [FREQUENCY]; Frequency Start {9.5 GHz}; Stop {10.5 GHz} The ringing of the measurement is due to the shorted transmission line in the Pulse Demonstration Module. The spacing between nulls is ~130 MHz, where f = ѵ/λ = (0.77*300,000,000 m/s) / (2*0.90 m). Users may want to investigate behavior using various portions of the pulse (i.e., different measurement widths) at different points within the pulse (i.e., different delays). 55. PULSEVIEW SETUP Measurement Width {10 ns}; Delay {100 ns}; to reproduce the trace below, the delay may need adjusted a few ns either way 22 VectorStar Pulse Measurements Anritsu
23 {It may be interesting to compare the measurement results under different settings. If so, use the following procedure: [DISPLAY]; Display View Trace; View Trace Store Data to Memory; Data & Memory]; Select Data when finished.} This trace shows the change in result when observing how the overshoot changes over frequency. It varies less than the remainder of the pulse because there is a delay before the effects of the shorted transmission line add constructively or destructively to the pulse. Users can make measurement adjustments and see the results instantly. No need to toggle back and forth between configuration windows. 56. PULSEVIEW SETUP Measurement Width {100 ns}; Delay {160 ns}; to reproduce the trace below, the delay may need adjusted a few ns either way Since frequency can be swept in PIP mode. It may be of interest to measure group delay of the DUT. 57. [DISPLAY]; Display Trace Format Trace Format Log Mag and Phase 58. [TRACE]; Trace # of Trace {2}; Trace Layout; Trace Layout {Select double vertical display, third from the top entry} 59. Select Trace 2 by clicking on the Tr2 identifier 60. [RESPONSE]; Response S [DISPLAY]; Display Trace Format; Trace Format Group Delay 62. [SCALE]; Scale Auto Scale Active Trace Anritsu VectorStar Pulse Measurements 23
24 Power can also be swept while in PIP mode which can be particularly useful for making gain compression measurements. 63. Select Trace 1 by clicking on the Tr1 identifier 64. [DISPLAY]; Display Trace Format; Trace Format Log Mag 65. [RESPONSE]; Response User Defined; User Defined Numerator {B2}; Denominator {1} 66. Select Trace 2 by clicking on the Tr2 identifier 67. [DISPLAY]; Display Trace Format; Trace Format {Log Mag}; drag Reference Position (circled arrow on left of measurement trace) to position 9 (second from the top) 68. [RESPONSE] Response User Defined; User Defined Numerator {A1}; Denominator {1} 69. [TRACE]; Trace # of Traces {2}; Trace Layout {Select single display, top entry} CHANNEL 3.Sweep; Sweep Setup Sweep Type; Sweep Type Power Sweep (CW Freq) 71. [FREQUENCY]; Frequency CW Frequency {10 GHz} 24 VectorStar Pulse Measurements Anritsu
25 C. PULSE-TO-PULSE DEMONSTRATION Historically, if a user wanted to measure the behavior of a DUT over multiple pulses to look for possible changes over time, the process would be to perform a pulse profile measurement over multiple pulse periods. The obvious disadvantage is that there is a great deal of useless data points (e.g. data from when the pulse is off) that is being displayed (limiting resolution of the useful data) and that is taking up data storage space (i.e. record length). 1. [TRACE]; Trace # of Traces {1} 2. [RESPONSE]; Response S21 3. APPLICATION PulseView Setup; PULSEVIEW SETUP PulseView Configuration 4. In the PulseView Configuration dialog box, perform the following: i. [PG4] Select Enable Pulse Generator; Select PG4 Label {PulseMod}; Select Singlet Delay {0 ns}; Width {200 ns} ii. [Measurement] Select Pulse Profile (Profile); Measurement Width {2.5 ns}; Start {0 ns}; Stop {350 ns}; # of point {141} iii. [DONE] 5. [Marker]; Markers[1] Mkr 1 {toggle: ON}; Mkr 2 {toggle: ON}; drag markers to determine the good part of the pulse (where the good part is a stable part of the pulse avoiding edge transients); a potential range could be 110 ns to 210 ns 6. [Marker]; Markers[1] Mkr 1 {toggle: OFF}; Mkr 2 {toggle: OFF} If the user wanted to observe DUT behavior over 9 pulses, the following procedure simulates the results that might be obtained using the historical method. 7. APPLICATION PulseView Setup; PULSEVIEW SETUP PulseView Configuration 8. In the PulseView Configuration dialog box, perform the following: i. [PRI] {10 µs}; to provide enough room to fit 9 pulses with a 1 µs period each ii. [PG4] Select Burst Burst Setup # of Bursts {9}; Period {1 µs}; Delay {0 ns}; Width {200 ns} iii. [Measurement] Stop {9.5 µs}; # of point {3801}; # of points = INT(9.5 µs/2.5 ns) + 1 to provide nonoverlapping measurement windows iv. [DONE] Anritsu VectorStar Pulse Measurements 25

26 Trying to get anything more than a qualitative assessment of DUT behavior during the good part of the pulses would be very challenging. 9. APPLICATION PulseView Setup; PULSEVIEW SETUP PulseView Configuration 10. In the PulseView Configuration dialog box, perform the following: i. [PRI] {1 µs}; to return to actual pulse period ii. [PG4] Select Enable Pulse Generator; Select PG4 Label {PulseMod}; Select Singlet Delay {0 ns}; Width {200 ns} iii. [Measurement] Select Pulse-to-Pulse(P2P); Measurement Width {100 ns}; Delay {110 ns}; # of pulses {9} iv. [DONE] The display starts after the measurement delay and the user utilize a marker to step to each pulse value. In Pulse-to-Pulse mode, only the requested data is displayed. 26 VectorStar Pulse Measurements Anritsu


27 If a user does require measurement over a long period of time, record lengths of up to 500 ms are possible at full resolution! Given the number of data points required, this is only accomplished by writing the data to a file for post-processing by the user. For a more practical example using the standard VectorStar mode capable of displaying up to 25,000 points, conduct the procedure below. A measurement with the following settings will take approximately 4 minutes to complete. Reducing the measurement width to 500 ns will reduce the update time to approximately 30 s (after the computations finish from the previous setting). (Note: To display between 25,000 and 100,000 points, the VectorStar 100K mode can be used. The measurement/ display time will change reflecting the change in number of points.) 11. APPLICATION PulseView Setup; PULSEVIEW SETUP PulseView Configuration 12. In the PulseView Configuration dialog box, perform the following: i. [PRI] {100 ms} ii. [PG4] Select Burst Burst Setup # of Bursts {90}; Period {1 ms}; Delay {0 s}; Width {300 µs} iii. [Measurement] Select Pulse Profile (Profile); Measurement Width {5 µs}; Start {0 s}; Stop {200 ms}; # of point {20,001}; # of points = INT(200 ms/10 µs) + 1 to provide non-overlapping measurement windows iv. [DONE] 200 ms is nearly 10x better than the closest competitor. VI. Meausrement Tips and Considerations A. Calibration At their root, the measurements discussed in this document are still S-parameter (or perhaps unratioed parameter) measurements. Even though they are conducted in a pulsed environment, for the most part, nothing has changed in terms of availability or execution of the calibrations available. There are, however, some subtleties to keep in mind. Power calibrations Power calibrations are made without stimulus pulsing, as the calibration routines are not set up for peak power analysis. If a power calibration is done while stimulus pulsing is enabled, the result will represent an average power in most cases (with some odd results possible for very low PRFs). Receiver calibrations These are done in pulse mode and can be done with stimulus pulsing disabled (typical) or enabled. If stimulus pulsing is used, it is important to ensure the measurement window placement does not occur during an off-period in that given path. Anritsu VectorStar Pulse Measurements 27
28 User RF calibrations (for example, S-parameter calibrations, such as SOLT, LRL, etc.) User RF calibrations are done while in pulsed mode. If stimulus pulsing will be used in the measurement, it should be used in calibration as well. This will allow for correction of any minor pulse distortions that may occur in the stimulus system. If using an Anritsu Pulse Modulator Test Set, reference couplers are included such that a pulsed reference can be provided to VectorStar. Applying this reference can help reduce trace noise and minimize any video contamination that may occur in a measurement. If the stimulus is not being pulsed (for example, only DUT or bias pulsing is being used), utilization of these additional reference signals is not needed. Note: If the reference couplers in an Anritsu Pulse Modulator Test Set are used, the ALC detection system will still detect the un-pulsed signal, but the extra loop port should be terminated to avoid minor power inaccuracies. The ALC detection circuitry is in the reference path of the VNA, but prior to the reference access loop where the pulsed version is injected. Reference couplers are discussed in the Uncertainties section below. All standard S-parameter calibration methods apply, the selection of which continues to be governed by the media and standards available refer to the VectorStar MS4640B Series Microwave Vector Network Analyzer Measurement and Calibration Guide, part number for additional information. Although not nearly as influenced by changes in pulse parameters as the narrowband pulse measurement method, the high-speed digitizer pulse measurement method still has some calibration dependence on the pulse parameters. If those parameters change, a new calibration may be needed, depending on the uncertainty tolerance. To understand the effect of changing pulse measurement parameters, consider the IF waveforms shown in Figure 12. They illustrate a simple 2-port transmission calibration step, where a thru line is connected and stimulus pulsing is being used. Figure 12. Example of a pulse parameter change affecting calibration. In this example, there is overshoot on the stimulus pulse. If the measurement window is toward the front end of the pulse (yellow samples), some of the overshoot may be being measured in calibration. In some cases (a long thru line, for example), the overshoot may not be entirely symmetric (occurring at the same time) between measurement channels (a 1 and b 2, for example). If the measurement window is moved later (green samples), then there is no overshoot present and the b 2 /a 1 ratio has changed. Depending on the pulse and window positions, this could cause a fractional db error in measurement unless recalibrated. Since there is partial ratioing, the maximum error is always less than the maximum overshoot, but it could be in the 10 % to 30 % of peak overshoot in a worst-case scenario. 28 VectorStar Pulse Measurements Anritsu
29 The decision whether to recalibrate can be affected by a number of parameters. These guidelines may help to determine whether to recalibrate the instrument: No stimulus pulsing is used (for example, using only bias or DUT control pulsing): With this configuration, calibrations are largely invariant to pulse parameters, and recalibration is normally not required. An exception may occur when performing an externally-triggered pulse measurement and the measurement window is close to the trigger event. In that case, experimentation with recalibration may be required to determine if there are any material effects from the measurement setup. Stimulus pulsing is used: As in the example of Figure 12, it may be desirable to recalibrate if it is believed that the measurements occur at a point for which there is some overshoot from the stimulus. If the test is made using an Anritsu Pulse Modulator Test Set, this overshoot is less than ~0.5 db and only covers about the first 5 ns. If not using that time zone, or if that zone is used but ~0.1 db impact is not significant, then one need not recalibrate. If using another stimulus modulator, one should consider its response pattern. Receive-side modulation is used (receiver-gating as shown in Figure 4): If one needs to operate near the edge of the modulator pulse, and if one is sensitive to small errors, then recalibration is recommended. If pulse parameters are changed after calibration, the CORR annunciator on screen (which indicates that a calibration is applied) may change to CORR(?) to indicate the possibility that the calibration has been disturbed. The measurements may still be entirely valid based on the exact pulse measurement configuration (see the recalibration guidelines above). B. Uncertainties Uncertainties in pulse measurements are not often covered in great detail. In an ideal situation, possible uncertainties would be dominated by basic S-parameter uncertainties controlled by calibration kits and methods, noise floor and trace noise, linearity, repeatability, drift, and similar factors. While it is not within the scope of this document to thoroughly analyze all of the pulse distortions possible, the most likely types of uncertainties are outlined below. Time When troubleshooting, address this variable first. Does the S-parameter reported at a particular time relative to T0 represent what was intended? This can be an issue due to latency in the pulse modulators, external bias systems, the DUT itself, and the VNA. A broad profiling measurement is sometimes a way of assessing the net latency and ensuring that a given time point is indeed the one of interest. Shaping Stimulus shape can affect the DUT output. This shaping may arise from the behavior of the RF modulators used or the behavior of any bias system pulsing that is employed. The former can normally be calibrated out, while the latter is an intrinsic part of the measurement. Calibration The calibration process itself may introduce some oddities as discussed earlier, particularly when stimulus RF modulation is in play. If the edges of the pulse response are of interest, then the calibration may be acting on reduced dynamic range on parts of the pulse edge resulting in elevated net trace noise. Minimizing Uncertainties To help reduce uncertainties, increases in averaging or reduction in IFBW in these measurements are advised along with not trying to measure deep into the noise floor unless necessary. Power level increases can sometime also help, if the DUT can support it and one avoids receiver compression. Nominally, 0.1 db compression is above +10 dbm, if the step attenuators of options 061/062 are engaged. If accessing the loop paths to the receivers, compression levels will be lower by the coupling factors of the couplers/bridges. Nominally this value is 13 db. Other artifacts can occur with RF stimulus modulation, particularly at low frequencies. These include video energy from the pulse drive itself that can appear on the frequencies of interest. The Anritsu Pulse Modulator Test Sets employ high pass filters for frequencies greater than 2.5 GHz. If at lower frequencies or using an external RF modulator, one may want to apply a high pass filter to the stimulus. Other approaches to reduce uncertainties may include pre-filtering the pulse drives to soften the edges somewhat and reduce video harmonic content. As has been discussed earlier, the use of a pulsed reference signal (available in the Anritsu Pulse Modulator Test Sets for routing to the reference loops on the VNA) can help reduce these video effects somewhat. Anritsu VectorStar Pulse Measurements 29

30 VII. Summary The Anritsu VectorStar MS4640B series of Vector Network Analyzers are capable of generating and measuring pulsed signals when equipped with Option 035 IF Digitizer and Option 042 PulseView. Four internal signal generators are included enabling singlet, doublet, triplet, quadruplet, and/or burst signal generation. Pulse measurements include pulse profile, point-in-pulse, and pulse-to-pulse capability. Option 035 IF Digitizer Option 042 PulseView Pulse Modulator Test Sets are available to pulse the RF stimulus and/or provide receiver gating (modulation). The Pulse Modulator Test Set frequency range is limited to that of the VNA with which it is used. SM6628, 70 khz to 40 GHz. Provides the MS4642B and MS4644B VNA with source modulation. SM6629, 70 khz to 40 GHz. Provides the MS4642B and MS4644B VNA with source and receiver modulation. SM6630, 70 khz to 70 GHz. Provides the MS4645B and MS4647B VNA with source modulation. SM6631, 70 khz to 70 GHz. Provides the MS4645B and MS4647B VNA with source and receiver modulation. Pulse Modulator Test Sets require direct access loops found in: Option 051 Direct Access Loops Options 061/062 Active Measurements Suite When these options are combined, VectorStar continues to provide users with CONFIDENCE ON THE CUTTING EDGE by delivering the following: 30 VectorStar Pulse Measurements Anritsu
Keysight Technologies PNA-X Series Microwave Network Analyzers
 Keysight Technologies PNA-X Series Microwave Network Analyzers Active-Device Characterization in Pulsed Operation Using the PNA-X Application Note Introduction Vector network analyzers (VNA) are the common
Pulsed VNA Measurements:
 Pulsed VNA Measurements: The Need to Null! January 21, 2004 presented by: Loren Betts Copyright 2004 Agilent Technologies, Inc. Agenda Pulsed RF Devices Pulsed Signal Domains VNA Spectral Nulling Measurement
Many devices, particularly
 From March 2003 High Frequency Electronics Copyright 2003, Summit Technical Media, LLC Techniques for Pulsed S-Parameter Measurements By David Vondran Anritsu Company Many devices, particularly power Pulsed
Pulsed S-Parameter Measurements using the ZVA network Analyzer
 Pulsed S-Parameter Measurements using the ZVA network Analyzer 1 Pulse Profile measurements ZVA Advanced Network Analyser 3 Motivation for Pulsed Measurements Typical Applications Avoid destruction of
Keysight Technologies Pulsed Antenna Measurements Using PNA Network Analyzers
 Keysight Technologies Pulsed Antenna Measurements Using PNA Network Analyzers White Paper Abstract This paper presents advances in the instrumentation techniques that can be used for the measurement and
Agilent PNA Microwave Network Analyzers
 Agilent PNA Microwave Network Analyzers Application Note 1408-12 Pulsed-RF S-Parameter Measurements Using Wideband and Narrowband Detection Table of Contents Introduction..................................................................3
MAKING TRANSIENT ANTENNA MEASUREMENTS
 MAKING TRANSIENT ANTENNA MEASUREMENTS Roger Dygert, Steven R. Nichols MI Technologies, 1125 Satellite Boulevard, Suite 100 Suwanee, GA 30024-4629 ABSTRACT In addition to steady state performance, antennas
Narrow Pulse Measurements on Vector Network Analyzers
 Narrow Pulse Measurements on Vector Network Analyzers Bert Schluper Nearfield Systems Inc. Torrance, CA, USA bschluper@nearfield.com Abstract - This paper investigates practical aspects of measuring antennas
Keysight Technologies Making Accurate Intermodulation Distortion Measurements with the PNA-X Network Analyzer, 10 MHz to 26.5 GHz
 Keysight Technologies Making Accurate Intermodulation Distortion Measurements with the PNA-X Network Analyzer, 10 MHz to 26.5 GHz Application Note Overview This application note describes accuracy considerations
Agilent Pulsed Measurements Using Narrowband Detection and a Standard PNA Series Network Analyzer
 Agilent Pulsed Measurements Using Narrowband Detection and a Standard PNA Series Network Analyzer White Paper Contents Introduction... 2 Pulsed Signals... 3 Pulsed Measurement Technique... 5 Narrowband
Configuration of PNA-X, NVNA and X parameters
 Configuration of PNA-X, NVNA and X parameters VNA 1. S-Parameter Measurements 2. Harmonic Measurements NVNA 3. X-Parameter Measurements Introducing the PNA-X 50 GHz 43.5 GHz 26.5 GHz 13.5 GHz PNA-X Agilent
Antenna Measurements using Modulated Signals
 Antenna Measurements using Modulated Signals Roger Dygert MI Technologies, 1125 Satellite Boulevard, Suite 100 Suwanee, GA 30024-4629 Abstract Antenna test engineers are faced with testing increasingly
External Source Control
 External Source Control X-Series Signal Analyzers Option ESC DEMO GUIDE Introduction External source control for X-Series signal analyzers (Option ESC) allows the Keysight PXA, MXA, EXA, and CXA to control
Signal Generators for Anritsu RF and Microwave Handheld Instruments
 Measurement Guide Signal Generators for Anritsu RF and Microwave Handheld Instruments BTS Master Spectrum Master Tracking Generator Option 20 Vector signal Generator Option 23 Anritsu Company 490 Jarvis
PERFORMANCE CONSIDERATIONS FOR PULSED ANTENNA MEASUREMENTS
 PERFORMANCE CONSIDERATIONS FOR PULSED ANTENNA MEASUREMENTS David S. Fooshe Nearfield Systems Inc., 19730 Magellan Drive Torrance, CA 90502 USA ABSTRACT Previous AMTA papers have discussed pulsed antenna
PN9000 PULSED CARRIER MEASUREMENTS
 The specialist of Phase noise Measurements PN9000 PULSED CARRIER MEASUREMENTS Carrier frequency: 2.7 GHz - PRF: 5 khz Duty cycle: 1% Page 1 / 12 Introduction When measuring a pulse modulated signal the
Pulsed Measurement Capability of Copper Mountain Technologies VNAs
 Introduction Pulsed S-parameter measurements are important when testing a DUT at a higher power than it can handle without damage in the steady state, or when the normal operating mode of the DUT involves
PXA Configuration. Frequency range
 Keysight Technologies Making Wideband Measurements Using the Keysight PXA Signal Analyzer as a Down Converter with Infiniium Oscilloscopes and 89600 VSA Software Application Note Introduction Many applications
Agilent PNA Microwave Network Analyzers
 Agilent PNA Microwave Network Analyzers Application Note 1408-11 Accurate Pulsed Measurements High Performance Pulsed S-parameter Measurements Vector network analyzers are traditionally used to measure
The Practical Limitations of S Parameter Measurements and the Impact on Time- Domain Simulations of High Speed Interconnects
 The Practical Limitations of S Parameter Measurements and the Impact on Time- Domain Simulations of High Speed Interconnects Dennis Poulin Anritsu Company Slide 1 Outline PSU Signal Integrity Symposium
P a g e 1 ST985. TDR Cable Analyzer Instruction Manual. Analog Arts Inc.
 P a g e 1 ST985 TDR Cable Analyzer Instruction Manual Analog Arts Inc. www.analogarts.com P a g e 2 Contents Software Installation... 4 Specifications... 4 Handling Precautions... 4 Operation Instruction...
PXIe Contents CALIBRATION PROCEDURE
 CALIBRATION PROCEDURE PXIe-5632 This document contains the verification and adjustment procedures for the PXIe-5632 Vector Network Analyzer. Refer to ni.com/calibration for more information about calibration
Keysight Technologies Network Analyzer Measurements: Filter and Amplifier Examples. Application Note
 Keysight Technologies Network Analyzer Measurements: Filter and Amplifier Examples Application Note Introduction Both the magnitude and phase behavior of a component are critical to the performance of
Pulse Timing and Latency Measurements Using Wideband Video Detectors
 Pulse Timing and Latency Measurements Using Wideband Video Detectors LadyBug Technologies 3317 Chanate Rd. Suite 2F Santa Rosa, CA 95404 ladybug-tech.com 1-866-789-7111 An efficient, accurate, and cost-effective
Hot S 22 and Hot K-factor Measurements
 Application Note Hot S 22 and Hot K-factor Measurements Scorpion db S Parameter Smith Chart.5 2 1 Normal S 22.2 Normal S 22 5 0 Hot S 22 Hot S 22 -.2-5 875 MHz 975 MHz -.5-2 To Receiver -.1 DUT Main Drive
Millimeter Signal Measurements: Techniques, Solutions and Best Practices
 New Network Analyzer platform Millimeter Signal Measurements: Techniques, Solutions and Best Practices Phase Noise measurements update 1 N522XA PNA Series Network Analyzer Introducing Highest Performance
Frequency and Time Domain Representation of Sinusoidal Signals
 Frequency and Time Domain Representation of Sinusoidal Signals By: Larry Dunleavy Wireless and Microwave Instruments University of South Florida Objectives 1. To review representations of sinusoidal signals
Improving Amplitude Accuracy with Next-Generation Signal Generators
 Improving Amplitude Accuracy with Next-Generation Signal Generators Generate True Performance Signal generators offer precise and highly stable test signals for a variety of components and systems test
Agilent PNA Microwave Network Analyzers
 Agilent PNA Microwave Network Analyzers Application Note 1408-3 Improving Measurement and Calibration Accuracy using the Frequency Converter Application Table of Contents Introduction................................................................2
Optoelectronic Components Testing with a VNA(Vector Network Analyzer) VNA Roadshow Budapest 17/05/2016
 VNA Roadshow Budapest 17/05/2016") Optoelectronic Components Testing with a VNA(Vector Network Analyzer) VNA Roadshow Budapest 17/05/2016 Content Introduction Photonics & Optoelectronics components Optical Measurements VNA (Vector Network
Optoelectronic Components Testing with a VNA(Vector Network Analyzer) VNA Roadshow Budapest 17/05/2016 Content Introduction Photonics & Optoelectronics components Optical Measurements VNA (Vector Network
Platform Migration 8510 to PNA. Graham Payne Application Engineer Agilent Technologies
 Platform Migration 8510 to PNA Graham Payne Application Engineer Agilent Technologies We set the standard... 8410 8510 When we introduced the 8510, we changed the way S-parameter measurements were made!
Vector Network Analyzer
 Vector Network Analyzer VNA Basics VNA Roadshow Budapest 17/05/2016 Content Why Users Need VNAs VNA Terminology System Architecture Key Components Basic Measurements Calibration Methods Accuracy and Uncertainty
Vector Network Analyzers (VERY) Basics. Tom Powers USPAS SRF Testing Course 19 Jan. 2014
 Basics. Tom Powers USPAS SRF Testing Course 19 Jan. 2014") Vector Network Analyzers (VERY) Basics Tom Powers USPAS SRF Testing Course 19 Jan. 2014 S-Parameters A scattering matrix relates the voltage waves incident on the ports of a network to those reflected
Vector Network Analyzers (VERY) Basics Tom Powers USPAS SRF Testing Course 19 Jan. 2014 S-Parameters A scattering matrix relates the voltage waves incident on the ports of a network to those reflected
Abstract: Stringent system specifications impose tough performance requirements on the RF and microwave cables used in aerospace and defense
 1 Abstract: Stringent system specifications impose tough performance requirements on the RF and microwave cables used in aerospace and defense communication systems. With typical tools, it can be very
Vector Network Analysis
 Portfolio Brochure Vector Network Analysis Product Portfolio Vector Network Analysis VNA Innovation Timeline In 1965, Anritsu filed the patent that defined the first modern Vector Network Analyzer (VNA).
RF and Microwave Test and Design Roadshow 5 Locations across Australia and New Zealand
 RF and Microwave Test and Design Roadshow 5 Locations across Australia and New Zealand Advanced VNA Measurements Agenda Overview of the PXIe-5632 Architecture SW Experience Overview of VNA Calibration
R&S NRP-Zxx Power Sensors Specifications
 R&S NRP-Zxx Power Sensors Specifications year Data Sheet Version 11.00 CONTENTS Definitions... 3 Overview of the R&S NRP-Zxx power sensors... 4 Specifications in brief of the R&S NRP-Zxx power sensors...
Measurements 2: Network Analysis
 Measurements 2: Network Analysis Fritz Caspers CAS, Aarhus, June 2010 Contents Scalar network analysis Vector network analysis Early concepts Modern instrumentation Calibration methods Time domain (synthetic
Keysight Technologies 8 Hints for Making Better Measurements Using RF Signal Generators. Application Note
 Keysight Technologies 8 Hints for Making Better Measurements Using RF Signal Generators Application Note 02 Keysight 8 Hints for Making Better Measurements Using RF Signal Generators - Application Note
Testing S-Parameters on Pulsed Radar Power Amplifier Modules
 Application Note Mahmud Naseef, Roland Minihold, Thilo Bednorz 3.2013-1MA126_2E Testing S-Parameters on Pulsed Radar Power Amplifier Modules Application Note Products: ı ı ı ı ı R&S ZVA8 R&S ZVAX24 R&S
Keysight 2-Port and 4-Port PNA-X Network Analyzer
 Keysight 2-Port and 4-Port PNA-X Network Analyzer N5249A - 0 MHz to 8.5 GHz N524A - 0 MHz to 3.5 GHz N5242A - 0 MHz to 26.5 GHz Data Sheet and Technical Specifications Documentation Warranty THE MATERIAL
Agilent Technologies Gli analizzatori di reti della serie-x
 Agilent Technologies Gli analizzatori di reti della serie-x Luigi Fratini 1 Introducing the PNA-X Performance Network Analyzer For Active Device Test 500 GHz & beyond! 325 GHz 110 GHz 67 GHz 50 GHz 43.5
Advanced Test Equipment Rentals ATEC (2832) MG3690B. RF/Microwave Signal Generators, 0.1 Hz to 70 GHz/325 GHz
 MG3690B. RF/Microwave Signal Generators, 0.1 Hz to 70 GHz/325 GHz") Established 1981 Advanced Test Equipment Rentals www.atecorp.com 800-404-ATEC (2832) MG3690B RF/Microwave Signal Generators, 0.1 Hz to 70 GHz/325 GHz MG3690B Family Signal Generators Easy to Read backlit
Established 1981 Advanced Test Equipment Rentals www.atecorp.com 800-404-ATEC (2832) MG3690B RF/Microwave Signal Generators, 0.1 Hz to 70 GHz/325 GHz MG3690B Family Signal Generators Easy to Read backlit
HP Archive. This vintage Hewlett Packard document was preserved and distributed by www. hparchive.com Please visit us on the web!
 HP Archive This vintage Hewlett Packard document was preserved and distributed by www. hparchive.com Please visit us on the web! On-line curator: Glenn Robb This document is for FREE distribution only!
Jitter Analysis Techniques Using an Agilent Infiniium Oscilloscope
 Jitter Analysis Techniques Using an Agilent Infiniium Oscilloscope Product Note Table of Contents Introduction........................ 1 Jitter Fundamentals................. 1 Jitter Measurement Techniques......
New Ultra-Fast Noise Parameter System... Opening A New Realm of Possibilities in Noise Characterization
 New Ultra-Fast Noise Parameter System... Opening A New Realm of Possibilities in Noise Characterization David Ballo Application Development Engineer Agilent Technologies Gary Simpson Chief Technology Officer
Vector Network Analyzer Application note
 Vector Network Analyzer Application note Version 1.0 Vector Network Analyzer Introduction A vector network analyzer is used to measure the performance of circuits or networks such as amplifiers, filters,
Analyze Agile or Elusive Signals Using Real-Time Measurement and Triggering Ben Zarlingo, Agilent Technologies Inc.
 Analyze Agile or Elusive Signals Using Real-Time Measurement and Triggering Ben Zarlingo, Agilent Technologies Inc. This Webcast Agile & Elusive Signals Discovering Signals vs. Troubleshooting, Optimizing
Network Analysis Basics
 Adolfo Del Solar Application Engineer adolfo_del-solar@agilent.com MD1010 Network B2B Agenda Overview What Measurements do we make? Network Analyzer Hardware Error Models and Calibration Example Measurements
Successful Modulation Analysis in 3 Steps. Ben Zarlingo Application Specialist Agilent Technologies Inc. January 22, 2014
 Successful Modulation Analysis in 3 Steps Ben Zarlingo Application Specialist Agilent Technologies Inc. January 22, 2014 Agilent Technologies, Inc. 2014 This Presentation Focus on Design, Validation, Troubleshooting
Advanced Lab LAB 6: Signal Acquisition & Spectrum Analysis Using VirtualBench DSA Equipment: Objectives:
 Advanced Lab LAB 6: Signal Acquisition & Spectrum Analysis Using VirtualBench DSA Equipment: Pentium PC with National Instruments PCI-MIO-16E-4 data-acquisition board (12-bit resolution; software-controlled
Model 855 RF / Microwave Signal Generator
 Features Very low phase noise Fast switching Phase coherent switching option 2 to 8 phase coherent outputs USB, LAN, GPIB interfaces Applications Radar simulation Quantum computing High volume automated
MODELLING AN EQUATION
 MODELLING AN EQUATION PREPARATION...1 an equation to model...1 the ADDER...2 conditions for a null...3 more insight into the null...4 TIMS experiment procedures...5 EXPERIMENT...6 signal-to-noise ratio...11
Time Matters How Power Meters Measure Fast Signals
 Time Matters How Power Meters Measure Fast Signals By Wolfgang Damm, Product Management Director, Wireless Telecom Group Power Measurements Modern wireless and cable transmission technologies, as well
PXIe Contents. Required Software CALIBRATION PROCEDURE
 CALIBRATION PROCEDURE PXIe-5160 This document contains the verification and adjustment procedures for the PXIe-5160. Refer to ni.com/calibration for more information about calibration solutions. Contents
781/ /
 781/329-47 781/461-3113 SPECIFICATIONS DC SPECIFICATIONS J Parameter Min Typ Max Units SAMPLING CHARACTERISTICS Acquisition Time 5 V Step to.1% 25 375 ns 5 V Step to.1% 2 35 ns Small Signal Bandwidth 15
Testing Upstream and Downstream DOCSIS 3.1 Devices
 Testing Upstream and Downstream DOCSIS 3.1 Devices April 2015 Steve Hall DOCSIS 3.1 Business Development Manager Agenda 1. Decoding and demodulating a real downstream DOCSIS 3.1 signal and reporting key
Keysight Technologies E8257D PSG Microwave Analog Signal Generator. Data Sheet
 Keysight Technologies E8257D PSG Microwave Analog Signal Generator Data Sheet 02 Keysight E8257D Microwave Analog Signal Generator - Data Sheet Table of Contents Specifications... 4 Frequency... 4 Step
MODELLING EQUATIONS. modules. preparation. an equation to model. basic: ADDER, AUDIO OSCILLATOR, PHASE SHIFTER optional basic: MULTIPLIER 1/10
 MODELLING EQUATIONS modules basic: ADDER, AUDIO OSCILLATOR, PHASE SHIFTER optional basic: MULTIPLIER preparation This experiment assumes no prior knowledge of telecommunications. It illustrates how TIMS
A NEW GENERATION PROGRAMMABLE PHASE/AMPLITUDE MEASUREMENT RECEIVER
 GENERAL A NEW GENERATION PROGRAMMABLE PHASE/AMPLITUDE MEASUREMENT RECEIVER by Charles H. Currie Scientific-Atlanta, Inc. 3845 Pleasantdale Road Atlanta, Georgia 30340 A new generation programmable, phase-amplitude
Limitations And Accuracies Of Time And Frequency Domain Analysis Of Physical Layer Devices
 Limitations And Accuracies Of Time And Frequency Domain Analysis Of Physical Layer Devices Outline Short Overview Fundamental Differences between TDR & Instruments Calibration & Normalization Measurement
How to Setup a Real-time Oscilloscope to Measure Jitter
 TECHNICAL NOTE How to Setup a Real-time Oscilloscope to Measure Jitter by Gary Giust, PhD NOTE-3, Version 1 (February 16, 2016) Table of Contents Table of Contents... 1 Introduction... 2 Step 1 - Initialize
Experiment 12 - Measuring X-Parameters Using Nonlinear Vector Netowrk Analyzer
 ECE 451 Automated Microwave Measurements Laboratory Experiment 12 - Measuring X-Parameters Using Nonlinear Vector Netowrk Analyzer 1 Introduction In this experiment, rstly, we will be measuring X-parameters
Keysight Technologies Accurate Pulsed Measurements with the PNA Microwave Network Analyzers. Application Note
 Keysight Technologies Accurate Pulsed Measurements with the PNA Microwave Network Analyzers Application Note Introduction Vector network analyzers are traditionally used to measure the continuous wave
Transient Current Measurement for Advance Materials & Devices
 & Devices 8 May 2017 Brian YEO Application Engineer Keysight Technologies Agenda 2 High speed data acquisition basics Challenges & solutions for transient current measurement. Considerations when making
Laboratory Experiment #1 Introduction to Spectral Analysis
 J.B.Francis College of Engineering Mechanical Engineering Department 22-403 Laboratory Experiment #1 Introduction to Spectral Analysis Introduction The quantification of electrical energy can be accomplished
UNIT 2. Q.1) Describe the functioning of standard signal generator. Ans. Electronic Measurements & Instrumentation
 Describe the functioning of standard signal generator. Ans. Electronic Measurements & Instrumentation") UNIT 2 Q.1) Describe the functioning of standard signal generator Ans. STANDARD SIGNAL GENERATOR A standard signal generator produces known and controllable voltages. It is used as power source for the
UNIT 2 Q.1) Describe the functioning of standard signal generator Ans. STANDARD SIGNAL GENERATOR A standard signal generator produces known and controllable voltages. It is used as power source for the
Power Measurement Basics
 Back to Basics - 2006 Objectives On completion of this module, you will be able to: Explain the importance of power measurements Define the three basic types of power measurements Describe the power meter/sensor
Spectrum Analyzer TEN MINUTE TUTORIAL
 Spectrum Analyzer TEN MINUTE TUTORIAL November 4, 2011 Summary The Spectrum Analyzer option allows users who are familiar with RF spectrum analyzers to start using the FFT with little or no concern about
Advanced Test Equipment Rentals ATEC (2832)
") Established 1981 Advanced Test Equipment Rentals www.atecorp.com 800-404-ATEC (2832) Agilent 2-Port and 4-Port PNA-X Network Analyzer N5249A - 10 MHz to 8.5 GHz N5241A - 10 MHz to 13.5 GHz N5242A - 10
Established 1981 Advanced Test Equipment Rentals www.atecorp.com 800-404-ATEC (2832) Agilent 2-Port and 4-Port PNA-X Network Analyzer N5249A - 10 MHz to 8.5 GHz N5241A - 10 MHz to 13.5 GHz N5242A - 10
Keysight Technologies Ampliier Linear and Gain Compression Measurements with the PNA Microwave Network Analyzers. Application Note
 Keysight Technologies Ampliier Linear and Gain Compression Measurements with the PNA Microwave Network Analyzers Application Note Introduction This application note covers testing of an ampliier s linear
Fourier Theory & Practice, Part II: Practice Operating the Agilent Series Scope with Measurement/Storage Module
 Fourier Theory & Practice, Part II: Practice Operating the Agilent 54600 Series Scope with Measurement/Storage Module By: Robert Witte Agilent Technologies Introduction: This product note provides a brief
Agilent 8360B/8360L Series Synthesized Swept Signal/CW Generators 10 MHz to 110 GHz
 Agilent 8360B/8360L Series Synthesized Swept Signal/CW Generators 10 MHz to 110 GHz ity. l i t a ers V. n isio c e r P. y t i l i ib Flex 2 Agilent 8360 Synthesized Swept Signal and CW Generator Family
Keysight Technologies Vector Network Analyzer Receiver Dynamic Accuracy
 Specifications and Uncertainties Keysight Technologies Vector Network Analyzer Receiver Dynamic Accuracy (Linearity Over Its Specified Dynamic Range) Notices Keysight Technologies, Inc. 2011-2016 No part
VVM measurement with E5061B for replacing 8508A vector voltmeter. May 2013 Agilent Technologies
 VVM measurement with E5061B for replacing 8508A vector voltmeter May 2013 Agilent Technologies Overview of VVM measurement with E5061B Application discussed here Measuring the phase difference (& magnitude
Cost-Effective Traceability for Oscilloscope Calibration. Author: Peter B. Crisp Head of Metrology Fluke Precision Instruments, Norwich, UK
 Cost-Effective Traceability for Oscilloscope Calibration Author: Peter B. Crisp Head of Metrology Fluke Precision Instruments, Norwich, UK Abstract The widespread adoption of ISO 9000 has brought an increased
2 Gain Variation from the Receiver Output through the IF Path
 EVLA Memo #185 Bandwidth- and Frequency-Dependent Effects in the T34 Total Power Detector Keith Morris September 17, 214 1 Introduction The EVLA Intermediate Frequency (IF) system employs a system of power
Federal Communications Commission Office of Engineering and Technology Laboratory Division
 April 9, 2013 Federal Communications Commission Office of Engineering and Technology Laboratory Division Guidance for Performing Compliance Measurements on Digital Transmission Systems (DTS) Operating
Quick Start Guide for the PULSE PROFILING APPLICATION
 Quick Start Guide for the PULSE PROFILING APPLICATION MODEL LB480A Revision: Preliminary 02/05/09 1 1. Introduction This document provides information to install and quickly start using your PowerSensor+.
Statistical Pulse Measurements using USB Power Sensors
 Statistical Pulse Measurements using USB Power Sensors Today s modern USB Power Sensors are capable of many advanced power measurements. These Power Sensors are capable of demodulating the signal and processing
What the LSA1000 Does and How
 2 About the LSA1000 What the LSA1000 Does and How The LSA1000 is an ideal instrument for capturing, digitizing and analyzing high-speed electronic signals. Moreover, it has been optimized for system-integration
332:223 Principles of Electrical Engineering I Laboratory Experiment #2 Title: Function Generators and Oscilloscopes Suggested Equipment:
 RUTGERS UNIVERSITY The State University of New Jersey School of Engineering Department Of Electrical and Computer Engineering 332:223 Principles of Electrical Engineering I Laboratory Experiment #2 Title:
Agilent 86030A 50 GHz Lightwave Component Analyzer Product Overview
 Agilent 86030A 50 GHz Lightwave Component Analyzer Product Overview 2 Characterize 40 Gb/s optical components Modern lightwave transmission systems require accurate and repeatable characterization of their
Fourier Theory & Practice, Part I: Theory (HP Product Note )
") Fourier Theory & Practice, Part I: Theory (HP Product Note 54600-4) By: Robert Witte Hewlett-Packard Co. Introduction: This product note provides a brief review of Fourier theory, especially the unique
Fourier Theory & Practice, Part I: Theory (HP Product Note 54600-4) By: Robert Witte Hewlett-Packard Co. Introduction: This product note provides a brief review of Fourier theory, especially the unique
Agilent Equalization Techniques and OFDM Troubleshooting for Wireless LANs
 Agilent Equalization Techniques and OFDM Troubleshooting for Wireless LANs Application Note 1455 Abstract OFDM (orthogonal frequency-division multiplexing) signals used in 802.11a and 802.11g wireless
Tips for making accurate rise / fall time measurements for radar signals
 Tips for making accurate rise / fall time measurements for radar signals Abstract: Output power measurement is one of the basic measurements for a radar system as it determines the performance, range and
PARAMETER CONDITIONS TYPICAL PERFORMANCE Operating Supply Voltage 3.1V to 3.5V Supply Current V CC = 3.3V, LO applied 152mA
 DESCRIPTION LT5578 Demonstration circuit 1545A-x is a high linearity upconverting mixer featuring the LT5578. The LT 5578 is a high performance upconverting mixer IC optimized for output frequencies in
Advances in Antenna Measurement Instrumentation and Systems
 Advances in Antenna Measurement Instrumentation and Systems Steven R. Nichols, Roger Dygert, David Wayne MI Technologies Suwanee, Georgia, USA Abstract Since the early days of antenna pattern recorders,
Combinational logic: Breadboard adders
 ! ENEE 245: Digital Circuits & Systems Lab Lab 1 Combinational logic: Breadboard adders ENEE 245: Digital Circuits and Systems Laboratory Lab 1 Objectives The objectives of this laboratory are the following:
Making Noise in RF Receivers Simulate Real-World Signals with Signal Generators
 Making Noise in RF Receivers Simulate Real-World Signals with Signal Generators Noise is an unwanted signal. In communication systems, noise affects both transmitter and receiver performance. It degrades
Understanding Probability of Intercept for Intermittent Signals
 2013 Understanding Probability of Intercept for Intermittent Signals Richard Overdorf & Rob Bordow Agilent Technologies Agenda Use Cases and Signals Time domain vs. Frequency Domain Probability of Intercept
Agilent PN Testing amplifiers and active devices with the Agilent 8510C Network Analyzer. Product Note
 Agilent PN 8510-18 Testing amplifiers and active devices with the Agilent 8510C Network Analyzer Product Note Table of Contents 3 Introduction 4 Amplifier parameters 5 Measurement setup 7 Linear measurements
Application Note 106 IP2 Measurements of Wideband Amplifiers v1.0
 Application Note 06 v.0 Description Application Note 06 describes the theory and method used by to characterize the second order intercept point (IP 2 ) of its wideband amplifiers. offers a large selection
Low voltage LNA, mixer and VCO 1GHz
 DESCRIPTION The is a combined RF amplifier, VCO with tracking bandpass filter and mixer designed for high-performance low-power communication systems from 800-1200MHz. The low-noise preamplifier has a
The Oscilloscope. Vision is the art of seeing things invisible. J. Swift ( ) OBJECTIVE To learn to operate a digital oscilloscope.
 OBJECTIVE To learn to operate a digital oscilloscope.") The Oscilloscope Vision is the art of seeing things invisible. J. Swift (1667-1745) OBJECTIVE To learn to operate a digital oscilloscope. THEORY The oscilloscope, or scope for short, is a device for drawing
The Oscilloscope Vision is the art of seeing things invisible. J. Swift (1667-1745) OBJECTIVE To learn to operate a digital oscilloscope. THEORY The oscilloscope, or scope for short, is a device for drawing
E/O and O/E Measurements with the 37300C Series VNA
 APPLICATION NOTE E/O and O/E Measurements with the 37300C Series VNA Lightning VNA Introduction As fiber communication bandwidths increase, the need for devices capable of very high speed optical modulation
SHF Communication Technologies AG. Wilhelm-von-Siemens-Str. 23D Berlin Germany. Phone Fax
 SHF Communication Technologies AG Wilhelm-von-Siemens-Str. 23D 12277 Berlin Germany Phone +49 30 772051-0 Fax ++49 30 7531078 E-Mail: sales@shf.de Web: http://www.shf.de Application Note Jitter Injection
Keysight Technologies
 Keysight Technologies Generating Signals Basic CW signal Block diagram Applications Analog Modulation Types of analog modulation Block diagram Applications Digital Modulation Overview of IQ modulation
Testing Sensors & Actors Using Digital Oscilloscopes
 Testing Sensors & Actors Using Digital Oscilloscopes APPLICATION BRIEF February 14, 2012 Dr. Michael Lauterbach & Arthur Pini Summary Sensors and actors are used in a wide variety of electronic products
Troubleshooting Common EMI Problems
 By William D. Kimmel, PE Kimmel Gerke Associates, Ltd. Learn best practices for troubleshooting common EMI problems in today's digital designs. Industry expert William Kimmel of Kimmel Gerke Associates