Power Supply Measurement and Analysis. Primer
|
|
|
- Dana Cannon
- 5 years ago
- Views:
Transcription

1 Power Supply Measurement and Analysis Primer
2 Primer Table of Contents Introduction...3 Power Supply Design Questions Point Toward Measurement Needs...3 Switch-Mode Power Supply Basics...4 Active Component Measurements: Switching Elements...4 Theory of Power Loss in Switch-Mode Devices...4 Turn-Off Loss...5 Turn-On Loss...5 Power Loss...6 Safe Operating Area...6 Dynamic On Resistance...7 Making Active Component Measurements...7 Choosing the Right Measurement Solution...8 Performance Considerations for the Oscilloscope...8 Rise Time...8 Sample Rate...8 Record Length...8 Power Measurement and Analysis Software...8 Eliminating Skew Between Voltage and Current Probes...10 Eliminating Probe Offset and Noise...12 Automated Offset Removal...12 Manual Offset Removal...12 Passive Component Measurements: Magnetics Inductance Basics...13 Making Inductance Measurements with an Oscilloscope..13 Magnetic Power Loss Basics...14 Core Loss...14 Copper Loss...14 Making Magnetic Power Loss Measurements with an Oscilloscope...15 Magnetic Properties Basics...15 B-H Plot...16 Magnetic Property Measurements...17 Measuring Magnetic Properties with an Oscilloscope...18 Power Line Measurements...19 Power Quality Measurement Basics...19 Making Power Quality Measurements with an Oscilloscope...20 Power Line Measurements with a Power Analyzer Accuracy...21 Connections...22 Connections for low power standby...22 Connections for high power...23 Power Measurements with a Power Analyzer...24 Making Standards Compliance Measurements...25 Power, standby power and efficiency...25 Harmonics Limits...25 Conclusion...26 Power Measurements...27 Which Tektronix oscilloscope is right for your power applications?...27 Power Measurement and Analysis Application Software...29 Choosing Your Next Power Analyzer
3 Power Supply Measurement and Analysis Introduction A power supply is a component, subsystem, or system that converts electrical power from one form to another; commonly from alternating current (AC) utility power to direct current (DC) power. The proper operation of electronic devices ranging from personal computers to military equipment and industrial machinery depends on the performance and reliability of power supplies. There are many different kinds and sizes of power supplies from traditional linear types to high-efficiency switch-mode power supplies. All face a complex, dynamic operating environment. Device loads and demands can change dramatically from one instant to the next. Even a commodity switch-mode power supply must be able to survive sudden peaks that far exceed its average operating levels. Engineers designing power supply's or the systems that use them need to understand their supplies behavior under conditions ranging from quiescent to worst-case. Historically, characterizing the behavior of a power supply has meant taking static current and voltage measurements with a digital multimeter and performing painstaking calculations on a calculator or PC. Today most engineers turn to oscilloscopes for characterization and troubleshooting during design, and purpose-built power analyzers for system-level validation and compliance testing. Modern oscilloscopes can be equipped with integrated power measurement and analysis software which simplifies setup and makes it easier to conduct measurements over time. Users can customize critical parameters, automate calculations, and see results, not just raw numbers, in seconds. This primer will focus on switch-mode power supply design measurements with an oscilloscope and application-specific software. It will also introduce power analyzers, in the context of power quality testing. Power Supply Design Questions Point Toward Measurement Needs Ideally every power supply would behave like the mathematical models used to design it. But in the real world, components are imperfect; loads vary; line power may be distorted; environmental changes alter performance. Moreover, changing performance and cost demands complicate power supply design. Consider these questions: How many watts beyond rated output capacity can the power supply sustain, and for how long? How much heat does the supply dissipate, what happens when it overheats, and how much cooling airflow does it require? What happens when the load current increases substantially? Can the device maintain its rated output voltage (load regulation)? How does the supply react to a dead short on its output? What happens when the supply s input voltage changes (line regulation)? The designer is asked to create a power supply that takes up less space, is more efficient, reduces heat, cuts manufacturing costs, and meets tougher EMI/EMC standards. Only a rigorous regime of measurements can guide the engineer toward these goals. 3
4 Primer VDC Turn-on Region t 0 t 1 Turn-off Region t 2 t 3 v(t) Gate Drain Source 0 off i(t) on off on Gate Drive Passive Components Active Components Magnetics Switch Voltage and Current p(t) = v(t) * i(t) Figure 1. Switch-mode power supply simplified schematic. Switch-Mode Power Supply Basics The prevailing DC power supply architecture in most modern systems is the Switch-Mode Power Supply (SMPS), which is known for its ability to handle changing loads efficiently. The power signal path of a typical SMPS includes passive, active, and magnetic components. The SMPS minimizes the use of lossy components such as resistors and linear-mode transistors, and emphasizes components that are (ideally) lossless: switch-mode transistors, capacitors, and magnetics. SMPS devices also include a control section containing elements such as pulse-width-modulated regulators, pulserate-modulated regulators, and feedback loops. 1 Control sections may have their own power supplies. Figure 1 illustrates a simplified SMPS schematic showing the power conversion section with active, passive, and magnetic elements. SMPS technology rests on power semiconductor switching devices such as Metal Oxide Semiconductor Field Effect Transistors (MOSFET) and Insulated Gate Bipolar Transistors (IGBT). These devices offer fast switching times and are able to withstand erratic voltage spikes. Equally important, they dissipate very little power in either the On or Off states, achieving high efficiency with low power dissipation. 0 Switch Power Loss Figure 2. Multiplying instantaneous voltage across and current through a switching device gives instantaneous power throughout the switching cycle. For the most part, the switching device determines the overall performance of an SMPS. Key measurements for switching devices include: switching loss, average power loss, safe operating area, and more. Active Component Measurements: Switching Elements Theory of Power Loss in Switch-Mode Devices Transistor switch circuits often dissipate the most energy during transitions because circuit parasitics prevent the devices from switching instantaneously. As shown in Figure 2, turn-off loss describes the loss when the device transitions from ON to OFF. Turn-on loss describes the energy lost when the switching device transitions from OFF to ON. 1 This primer deals with measurements that pertain to the power path, including tests on internal elements that contribute to the output. Control section measurements are more conventional waveform- and logic-based observations and will not be covered in this document. 4
5 Power Supply Measurement and Analysis Transistor Waveforms V (t) DS I (t) D V DC Transistor Waveforms I (t) D V DC t V (t) DS t Area V (t) DS I (t) D V DS(t) I D (t) Area on t 0 t 1 t 2 t t 0 t 1 t 2 t Figure 3. A simplified piecewise linear model for energy loss in a MOSFET during turn-off. Figure 4. Turn-on energy loss in a MOSFET. Turn-Off Loss Figure 3 shows a simplified approximation of turn-off loss. At t 0, V DS starts to increase as turn-off begins. After t 1, the switch current falls. The time (t 0 -t 1 ) depends on the how fast the driver can charge the gate-drain capacitance C GD of the MOSFET. Energy loss during the transition can be calculated by the following equation: Where: E off is the average energy loss in the switch during the turn-off transition. V DS (t) is the instantaneous voltage across the switch. I D (t) is the instantaneous current through the switch. t 2 is when the transition is complete. t 0 is when the transition begins. VDS(t) ID(t)dt In real-world devices, the parasitic capacitances C GD and C DS are highly non-linear, tending to vary with drain-source voltage. In case of an IGBT, the fall time of current would be higher due to the tail current phenomenon. These differences make it essential to capture the actual profile of the voltage variation. An oscilloscope with dedicated power measurement software can greatly simplify these measurements. Turn-On Loss Figure 4 shows the turn-on loss in a MOSFET switch. Energy loss during the turn-on transition is calculated by the following equation: Where: on E on is the energy loss in the switch during the turn-on transition. V DS (t) is the instantaneous voltage across the switch. I D (t) is the instantaneous current through the switch. t 2 is when the transition is complete. t 0 is when the transition begins. VDS(t) ID(t)dt 5

6 Primer I DMAX 10 PDMAX Current Figure 5. Turn-off power loss measurement on an oscilloscope, determined by multiplying voltage and current point by point and taking the mean. 1 Voltage 10 VDMAX Power Loss The total loss is the average power loss in the switch. This includes the switching losses and conduction losses. The total loss is given by the formula: Where: Ploss 1 Ts P loss is the average power loss in the switch. V DS (t) is the instantaneous voltage across the switch. I D (t) is the instantaneous current through the switch. T s is the switching period. T S 0 VDS(t) ID(t)dt Average power during any part of the switching cycle can be calculated using digitized voltage and current waveforms and waveform math to implement the equations above. Figure 5 shows how the current and voltage waveforms are multiplied point by point to generate the instantaneous power waveform. The average value of the instantaneous power is the mean power loss. The power waveform is also integrated to determine the energy loss. Figure 6. A safe operating area plot is found in a switching device datasheet. It is a log-log plot that sets limits for current, power, and voltage maximums. Safe Operating Area The Safe Operating Area (SOA) measurement on a switching device plots voltage vs. current to characterize the operating region of the device. It is often useful to create an SOA plot for the diverse operating conditions the power supply is expected to encounter. The switching device manufacturer s data sheet summarizes certain constraints on the switching device. At minimum the constraints include maximum current, maximum voltage, and maximum power as shown in Figure 6. In-circuit SOA testing may be performed to evaluate whether an actual switching device is performing within the safe operating area set forth in its datasheet, under various conditions. An oscilloscope equipped with a current probe and special power analysis software allows you to duplicate the datasheet limits. The instrument can plot voltage/current points on the display as power supply conditions are varied, and any excursions outside the limits are flagged. 6
 is not constant and may vary significantly with changes in switch voltage or current.")
7 Power Supply Measurement and Analysis Dynamic On Resistance The resistance of a MOSFET switching device in the on state can be approximated by using the RDS ON value found in the component s data sheet. However, the actual resistance (and therefore the switch conduction loss) is not constant and may vary significantly with changes in switch voltage or current. di/dt and dv/dt A di/dt measurement represents the rate at which the current changes during switching, while a dv/dt measurement represents the rate at which the voltage changes during switching. Figure 7. This example from Tektronix DPO4PWR illustrates an SOA plot for an SMPS. The plot can be compared with the data published by the switching device manufacturer. The object is to ensure that the switching device will tolerate the operational boundaries that the power supply must deal with in its end-user environment. SOA test variables may include various load scenarios, operating temperature variations, high and low line input voltages, and more. Figure 7 is an example of an SOA plot. Making Active Component Measurements To those accustomed to making high-bandwidth measurements with an oscilloscope, power measurements, with their relatively low frequencies, might appear simple. In reality, power measurements present a host of challenges that the high-speed circuit designer never has to confront. The voltage across a switching device can be very large, and is often floating, that is, not referenced to ground. There are variations in the pulse width, period, frequency, and duty cycle of the signal. Waveforms must be faithfully captured and analyzed for imperfections. 7
8 Primer Choosing the Right Measurement Solution For switch-mode power supply measurements, it is important to choose the tools that can do the job. To turn the SMPS switching device on and off during test, a pulse stimulus from a signal source may be required. To accurately simulate the gate drive signal under normal operating conditions, the stimulus must have adjustable duty cycle, edge transition times, and frequency. To drive IGBT devices, the stimulus must also be able to generate the required voltage of typically 12 V to 15 V. The oscilloscope must, of course, have the basic bandwidth and sample rate to handle the switching frequencies within an SMPS. And, it must have deep memory to provide the record length required for long, low-frequency acquisitions with high timing resolution. Power measurements also require at least two channels, one for voltage and one for current. Equally important are the probes to connect the device to the oscilloscope. Multiple probe types such as singleended, differential, and current are required simultaneously. Application software completes the toolset by making power measurements easier and more reliable. Performance Considerations for the Oscilloscope Key performance considerations when choosing an oscilloscope include rise time, sample rate, record length, and available power measurement analysis software. Rise Time Although the switching signal may be relatively low-speed, the rise time of the signal may be quite fast. For accurate measurements, the oscilloscope rise time should be at least five times as fast to capture the critical details of fast transitions. RiseTime oscilloscope RiseTime SwitchingSignal 5 For example, if the switching signal has a rise time of 5 ns, then the oscilloscope should have a rise time of at least 1 ns for accurate measurements. A rise time that fast is typically available on oscilloscopes with a bandwidth of at least 350 MHz. Sample Rate Sample rate specified in samples per second (S/s) refers to how frequently a digital oscilloscope takes a sample of the signal. A faster sample rate provides greater resolution and detail of the waveform, making it less likely that critical information or events will be lost. To characterize the ringing typical during switching in a SMPS, the oscilloscope s sample rate must be fast enough to capture several samples on the edges of the switching signal. Record Length An oscilloscope s ability to capture events over a period of time depends on the sample rate used and the depth (record length) of the memory that stores the acquired signal samples. The memory fills up in direct proportion to the sample rate. When the sample rate is set high enough to provide a detailed high-resolution view of the signal, the memory fills up quickly. For many SMPS power measurements, it is necessary to capture a quarter-cycle or half-cycle (90 or 180 degrees) of the line frequency signal; some even require a full cycle. A half-cycle of a 60 Hz line frequency is over 8 ms of time. At a sample rate of 1 GS/s, a record length of 8 million points is needed to capture that much time. Power Measurement and Analysis Software Application software can make power measurements and analysis on an oscilloscope much easier and repeatable by automating common measurements, providing detailed test reports and simplifying certain complex measurement situations like measuring both high and low voltage signals for switching and power loss measurements. 8

9 Power Supply Measurement and Analysis Magnetics ~ = 700 V Gate Drain TP1 Source TP2 ~ = 100 mv Gate Drive Figure 8. MOSFET switching device, showing measurement points. Figure 9. Typical voltage across a switching device. Measuring 100 Volts and 100 Millivolts in One Acquisition To measure switching loss and average power loss across the switching device, the oscilloscope must first determine the voltage across the switching device during the OFF and ON times, respectively. In an AC/DC converter, the voltage across the switching device has a very high dynamic range. The voltage across the switching device during the ON state depends upon the type of switching device. In the MOSFET illustrated in Figure 8, the ON voltage is the product of channel resistance and current. In Bipolar Junction Transistors (BJT) and IGBT devices, the voltage is primarily based on the saturation voltage drop (VCE sat ). The OFF state voltage depends on the operating input voltage and the topology of the switchmode converters. A typical DC power supply designed for computing equipment operates on universal utility voltage ranging from 80 V rms to 264 V rms. At maximum input voltage, the OFF state voltage across the switching device (between TP1 and TP2) can be as high as 750 V. During the ON state, the voltage across the same terminals can range from a few millivolts to about one volt. Figure 9 shows the typical signal characteristics on a switching device. These OFF and ON voltages must be measured first in order to make accurate power measurements on a switching device. However, a typical 8-bit digital oscilloscope lacks the dynamic range to accurately acquire (within the same acquisition cycle) the millivolt-range signals during the ON time as well as the high voltages that occur during the OFF time. Figure 10. The DPOPWR input page allows the user to enter data sheet values for RDS ON & VCE sat. To capture this signal, the oscilloscopes vertical range would be set at 100 volts per division. At this setting, the oscilloscope will accept voltages up to 1000 V; thus the 700 V signal can be acquired without overdriving the oscilloscope. The problem with using this setting is that the minimum signal amplitude a typical 8-bit digital oscilloscope can resolve is 1000/256, or about 4 V. The oscilloscope's vertical sensitivity can be improved by increasing the vertical resolution either by using a higherresolution digitizer or with digital signal processing. One technique, called HiRes, trades off horizontal resolution for increased vertical resolution using a boxcar averaging technique. With the power application software offered with modern oscilloscopes, the user can enter RDS ON or VCE sat values from the device data sheet into the measurement menu, as shown in Figure 10. Alternatively, if the measured voltage is within the oscilloscopes sensitivity, then the application software can use acquired data for its calculations rather than the manually-entered values. 9
10 Primer Figure 11. The effect of propagation delay on a power measurement. Eliminating Skew Between Voltage and Current Probes To make power measurements with a digital oscilloscope, it is necessary to measure the current through and the voltage across the drain-to-source of a MOSFET switching device or the current through and the voltage across the collector-toemitter of an IGBT. This task requires two separate probes: a high-voltage differential probe and an AC/DC current probe. The latter probe is usually a non-intrusive Hall Effect type. Each of these probes has its own characteristic propagation delay. The difference in these two delays, known as skew, causes inaccurate timing measurements and distorted instantaneous power waveforms. It is important to understand the impact of the probes propagation delays on maximum peak power and area measurements. After all, power is the product of voltage and current. If the two multiplied variables are not perfectly time-aligned, then the result will be incorrect. The accuracy of measurements such as switching loss suffer when the probes are not properly de-skewed. The test setup shown in Figure 11 compares the signals at the probe tip (lower trace display) and at the oscilloscope front panel after the propagation delay (upper display). 10
 after de-skew.")
 of a measurement taken without first de-skewing the two probes.")
11 Power Supply Measurement and Analysis Figure ns skew between voltage and current signals. Figure 13. With skew, the peak amplitude of the power waveform is 939 mw. Figure 14. Voltage and current signals aligned after de-skew process. Figure 15. Peak amplitude has risen to 1.00 W (6.5% higher) after de-skew. Figures 12 through 15 are actual oscilloscope screen views that demonstrate the effects of skew in probes. Figure 9 reveals the skew between the voltage and current probes, while Figure 13 displays the results (mean value of 939 mw) of a measurement taken without first de-skewing the two probes. Figure 14 shows the effect of de-skewing the probes. The two reference traces are overlapping, indicating that the delays have been equalized. The measurement results in Figure 15 illustrate the importance of proper de-skewing. As the example proves, skew introduced a measurement error of over 6%. Accurate de-skew reduces error in peak-to-peak power loss measurements. 11
12 Primer Some power measurement software will automatically de-skew the chosen probe combination. The software takes control of the oscilloscope and adjusts the delay between the voltage and current channels using live current and voltage signals to remove the difference in propagation delay between the voltage and current probes. Also available is a static de-skew function that relies on the fact that certain voltage and current probes have constant and repeatable propagation delays. The static de-skew function automatically adjusts the delay between selected voltage and current channels based on an embedded table of propagation times for selected probes. This technique offers a quick and easy method to minimize de-skew. Eliminating Probe Offset and Noise Differential and current probes may have a slight offset. This offset should be removed before taking measurements because it can affect accuracy. Some probes have a built-in, automated method for removing the offset while other probes require manual offset removal procedures. Automated Offset Removal A probe that is equipped with the Tektronix TekVPI Probe Interface works in conjunction with the oscilloscope to remove any DC offset errors in the signal path. Pushing the Menu button on a TekVPI probe brings up a Probe Controls box on the oscilloscope that displays the AutoZero feature. Selecting Figure 16. Signal conditioning option on the DPOPWR software menu. This selection sets the current to zero during the Off time of the switching device. the AutoZero option will automatically null out any DC offset error present in the measurement system. A TekVPI current probe also has a Degauss/AutoZero button on the probe body. Depressing the AutoZero button will remove any DC offset error present in the measurement system. Manual Offset Removal Other differential voltage probes have built-in DC offset trim controls, which makes manual offset removal a relatively simple procedure. Similarly, it is necessary to adjust the current probe before making measurements. Note that differential and current probes are active devices, and there will always be some low-level noise present, even in the quiescent state. This noise can affect measurements that rely on both voltage and current waveform data. Some power measurement software includes a signal-conditioning feature (Figure 16) that minimizes the effect of inherent probe noise. 12
 particularly")
13 Power Supply Measurement and Analysis Passive Component Measurements: Magnetics Passive components are those which do not amplify or switch signals. Power supplies employ the full range of passive components such as resistors and capacitors, but from a measurement standpoint, the main focus is on the magnetic components (magnetics) particularly inductors and transformers. Both inductors and transformers consist of ferrous cores wound with turns of copper wire. Inductors exhibit increasing impedance with frequency, impeding higher frequencies more than lower frequencies. This makes them useful for filtering current at the power supply input and the output. Transformers couple voltage and current from a primary winding to a secondary winding, increasing or decreasing signal levels (either voltage or current but not both). Thus a transformer might accept 120 volts at its primary and step this down to 12 volts on the secondary with a proportional increase in current on the secondary. Note that this is not considered amplification because the signal's net power does not increase. Because the transformer's primary and secondary are not electrically connected, they are also used to provide isolation between circuit elements. Some measurements that help to determine power supply performance include: Inductance Power Loss (Magnetic) Magnetic Properties Inductance Basics Power supplies use inductors as energy storage devices, filters, or transformers. There are several different solutions available for measuring inductance. The LCR meter, for example, excites the inductor under test using a built-in signal generator and then uses a bridge-balancing technique to measure the device impedance. The LCR meter uses a sinusoidal wave as the signal source. In a real-world power supply, however, the signal is a highvoltage, high-current square wave. Therefore, most power supply designers prefer to get a more accurate picture by observing the inductors behavior in the dynamically changing Figure 17. Inductance measurement results from DPOPWR application software. environment of a power supply. The magnetic properties of inductors vary with the current and voltage source, excitation signal, wave shape, and the frequency of operation. When voltage and current are measured, inductance may be determined by: Where: L L is the inductance (Henry). V(t)dt I(t) V is the voltage across the inductor. I is the current though the inductor. Making Inductance Measurements with an Oscilloscope The most expedient tool for inductor measurements in a live power supply is an oscilloscope. The inductance measurement itself is as simple as probing the voltage across and the current through the magnetic component, much like the switching device measurements described earlier. Figure 17 shows the result of such an inductance measurement. Here, the software has computed the inductance to be microhenries. 13
14 Primer Power Loss Density, Watts/cm MHz Ferrite Core Material 500 khz 200 khz B max Tesla 100 khz Magnetic Power Loss Basics 50 khz 20 khz Figure 18. Plot of core loss vs. flux density at various switching frequencies. Magnetic power loss affects the efficiency, reliability, and thermal performance of the power supply. Two types of power losses are associated with magnetic elements: core loss and copper loss. Core Loss The core loss is composed of hysteresis loss and eddy current loss. The hysteresis loss is a function of the frequency of operation and the AC flux swing. It is largely independent of DC flux. The hysteresis loss per unit volume is expressed by the following equation: Where: P Hyst is the hysteresis loss per unit volume. H is field strength. B is the flux density. It is possible to calculate the core loss using the core manufacturer s data sheet such as that shown in the Figure 18. Here the manufacturer has specified the loss for sinusoidal excitation in the I and the III quadrant operation. The manufacturer also specifies an empirical relationship to calculate the core loss at different AC flux densities and frequency. Copper Loss The copper loss is due to the resistance of the copper winding wire. The copper loss is given by: Where: P cu is the copper loss. I rms is the rms current through the magnetic component. R wdg is the winding resistance. This resistance depends on the DC resistance, skin effect, and proximity effect. 14
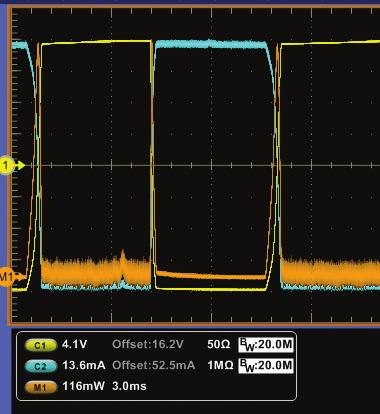
15 Power Supply Measurement and Analysis Making Magnetic Power Loss Measurements with an Oscilloscope The total power loss and the core loss can be quickly derived using information from the core vendor s data sheet and results from an oscilloscope running power measurement software. Use both values to calculate the copper loss. Knowing the different power loss components makes it possible to identify the cause for power loss at the magnetic component. The method for calculating the magnetic component power loss depends in part on the type of component being measured. The device under test may be a single-winding inductor, a multiple-winding inductor, or a transformer. Figure 19 shows the measurement result for a single winding inductor. Channel 1 (yellow trace) is the voltage across the inductor and Channel 2 (blue trace) is the current, measured with a non-intrusive current probe, through the inductor. The power measurement software automatically computes and displays the power loss figure, here shown as milliwatts. Multiple-winding inductors call for a slightly different approach. The total power loss is the sum of the losses from the individual windings: Computing power loss at a transformer further varies the formula: Figure 19. Power loss at single-winding inductor as measured by DPOPWR. The measured power loss at the primary winding will include the reflected power of the secondary winding. Therefore, it is necessary to measure power at the primary and secondary windings and compute the power loss using the transformer equation. Magnetic Properties Basics Switch-mode power supplies must be reliable over a wide range of operating conditions. For optimum performance, designers generally specify magnetic components, transformers and inductors, using B-H (hysteresis) curves supplied by the manufacturers. These curves define the performance envelope of the magnetic s core material. Factors including operating voltage, current, topology, and type of converter must be maintained within the linear region of the hysteresis curve. Obviously, with so many variables, this is not easy. Characterizing the operating region of the magnetic component while it is operating within the SMPS is essential to determining the power supply s stability. The measurement procedure includes plotting the hysteresis loop and looking at the magnetic properties of the inductor and transformer. 15
16 Primer Magnetic Flux Density (B) Bs Br υµα (maximum) These variables are used in the following definitions that pertain to Figure 20: Magnetic Field Strength (H) is the magnetic field used to induce magnetic flux in the material under test. Units are expressed in amperes per meter. υµι Magnetic Field Strength (H) Hc Saturation Flux Density (B s ) is the maximum magnetic flux density that can be induced in the material regardless of the magnitude of the externally applied field H. And: Figure 20. Typical B-H (hysteresis) plot of a magnetic component. B-H Plot The B-H plot characterizes the magnetic properties. Figure 20 shows a typical B-H plot for a sinusoidal excitation. To make B-H plot measurements, the following information is needed at the outset: Voltage across the magnetic component, Magnetizing current, Number of turns, Magnetic Length, Cross Sectional Area, Surface Area, S l I A V Remanence (B r ) is the induced magnetic flux density that remains in the material after the externally applied magnetic field (H) returns to zero while generating the hysteresis loop. Coercive Force (H c ) is the value of H found at the intercept of the H-axis and the hysteresis loop. This represents the external field required to cause the induced flux density (B) to reach zero during the measurement cycle of a hysteresis loop. Hc is symmetrical with the positive and negative axes. Initial Permeability (µ i ) is the ratio of induced magnetic flux densities (B) to apply field (H) as H approaches zero. It is the ratio of B to H at any point on the hysteresis loop. In addition, Maximum Amplitude Permeability is the maximum ratio of B to H on the first quadrant of the positive cycle of the hysteresis loop. It is the slope drawn from the origin. 16
17 Power Supply Measurement and Analysis Magnetic Property Measurements Inductors are used as filters at the input and the output of the power supply, and may have single or multiple windings. + i1(t) i (t) M i (t) 1 n 1 : n 2 i(t) 2 + To make magnetic property measurements, the following information is necessary: Voltage across the magnetic component, Magnetizing current, Number of turns, Magnetic Length, Cross Sectional Area, l I A V - v(t) 1 v(t) 2 L M i(t) The inductor voltage and current follow the following equation: v(t) 3 In a typical DC-to-DC converter, the flux in the winding is expressed by: Figure 21. Multi winding magnetic element. : n 3 Ideal Transformer - and and: Figure 21 shows a typical multi-winding magnetic element that might be used as a coupled inductor or transformer. The electrical equations governing the operation of this circuit are as follows: To calculate the net magnetizing current, it is necessary to measure i 1 (t), i 2 (t) and i 3 (t). Given the net magnetizing current, the B-H analysis procedure is similar to that used for a singlewinding inductor. The flux depends upon the net magnetizing current. The vector sum of the measured currents in all the windings produces the magnetizing current. and 17
18 Primer Figure 22. B-H plot for single winding inductor. Figure 23. Inductance and magnetic loss measurements. Measuring Magnetic Properties with an Oscilloscope Dedicated power measurement software can greatly simplify magnetic properties measurements with an oscilloscope. In many instances, it is necessary only to measure the voltage and magnetizing current. The software performs the magnetic property measurement calculations for you. Figure 22 depicts the results of a magnetic property measurement on a singlewinding inductor. The measurement can also be performed on a transformer with a primary and secondary current source. In Figure 23, Channel 1 (yellow trace) is the voltage across the inductor and Channel 2 (blue trace) is the current through the inductor. After running the inductance and magnetic loss measurements 100 times, the minimum, maximum, and mean measurement values are displayed. Some power measurement software can also create an exact B-H plot for the magnetic component and characterize its performance. The number of turns, the magnetic length and the cross-sectional area of the core must first be entered before the software can compute a B-H plot. 18
19 Power Supply Measurement and Analysis Current Test Point (Non-intrusive AC/DC probe) I AC V AC Line Filter PFC control PWM control Voltage Test Points Figure 24. Simplified view of an SMPS power supply (primary side only) and its power quality measurement test points. Simultaneous input V AC and I AC readings are necessary for power quality measurements. Power Line Measurements Power line measurements characterize the interaction of the supply and its service environment. It is good to remember that power supplies can be of any size, from the small fanfeed boxes inside a personal computer, to the sizeable devices supplying factory motors, to the massive supplies supporting phone banks and server farms. Each of these has some effect on the incoming power source (typically utility power) that feeds it. To determine the effect of the insertion of the power supply, power voltage and current parameters must be measured directly on the input power line. Power Quality Measurement Basics Power quality does not depend on the electricity producer alone. It also depends on the design and manufacture of the power supply and on the end-user s load. The power quality characteristics at the power supply define the health of the power supply. Real-world electrical power lines never supply ideal sine waves. There is always some distortion and impurity on the line. A switching power supply presents a non-linear load to the source. Because of this, the voltage and current waveforms are not identical. Current is drawn for some portion of the input cycle, causing the generation of harmonics on the input current waveform. Determining the effects of these distortions is an important part of power engineering. To determine the power consumption and distortion on the power line, power quality measurements are made at the input stage, as shown by the voltage and current test points in Figure 24. Power quality measurements include: True Power Apparent Power or Reactive Power Power Factor Crest Factor Current Harmonics Measurements to EN Standards Total Harmonic Distortion (THD) 19

20 Primer Making Power Quality Measurements with an Oscilloscope Digital oscilloscopes running power measurement application software are a powerful alternative to the power meters and harmonic analyzers traditionally used for power quality measurements. The benefits of using an oscilloscope rather than the older toolset are compelling. The instrument must be able to capture harmonic components up to at least the 50th harmonic of the fundamental. Power line frequency is usually 50 Hz or 60 Hz, according to applicable local standards. In some military and avionics applications, the line frequency may be 400 Hz. And of course, signal aberrations may contain frequencies that are higher yet. With the high sampling rate of modern oscilloscopes, fast-changing events are captured with great detail (resolution). In contrast, conventional power meters can overlook signal details due to their relatively slow response time. And, the oscilloscope s record length is sufficient to acquire an integral number of cycles, even at very high sampling resolution. Software tools speed measurement procedures and minimize setup time. Most power quality measurements can be automated by full-featured power measurement software running on the oscilloscope itself, performing lengthy procedures in seconds. By reducing the number of manual calculations, the oscilloscope acts as a very versatile and efficient power meter. Figure 25 shows an example of robust power measurement software. The oscilloscope probes, too, assist in safe, reliable power measurements. High-voltage differential probes designed for power applications are the preferred tools for observing floating voltage signals. Figure 25. Power quality results using DPOPWR Measurement and Analysis Software. Measurements include True Power, Apparent Power, Crest Factor, Total Harmonic Distortion and Power Factor. Current probing is a special consideration. There are several implementations of current probing architecture: The AC current probe may be based on current transformer (CT) technology or Rogowski coil technology. These AC current probes are minimally-intrusive but cannot sense the DC component in the signal, which can result in inaccurate measurements. The current shunt. This design requires interrupting the circuit and can cause a voltage drop within the circuit itself, potentially compromising power measurement accuracy. The AC/DC current probe is typically based on Hall-Effect sensor technology. This device senses AC and DC currents with minimal intrusiveness and is able to read the both the AC and the DC signal components with one connection. The AC/DC current probe has become the tool of choice for challenging power quality measurements in switch-mode power supplies. 20
21 Power Supply Measurement and Analysis Power Line Measurements with a Power Analyzer A precision power analyzer is the ideal tool to use when measuring the power drawn from the AC line by a power supply. Accurate power and related measurements are used to confirm the power supply s overall electrical ratings and its compliance to international requirements for power, efficiency and current wave shape. Measurements include: Power (watts) Low power standby (mw) Apparent power (VA) True RMA V and A Power Factor Inrush Current Crest Factors and Peak Values Harmonics (V, A and W) THD (V, A) Accuracy A power analyzer connects directly to the AC line and uses precision input circuits (a voltage divider and a current shunt) to provide power measurements with a basic accuracy of 0.05% or better. This class of accuracy is required to confirm high levels of accuracy as well as for conformance to power and harmonics standards. For example, a typical oscilloscope and probe combination may provide 3% of amplitude accuracy for voltage and current. The total power uncertainty will be even greater, resulting in 3% uncertainty for overall power and efficiency measurements. This can be very important when designing to achieve a high efficiency. For example, a nominal 90% efficiency may be as high as 93% or as low as 87% when measured with an oscilloscope. This uncertainty could then result in either a non-conforming design (measuring above 90% but actual efficiency less than 90%) or unnecessary extra design optimization (measuring below 90% but actual efficiency already greater than 90%). An oscilloscope is the right tool for confirming and optimizing high-speed switching and other component losses inside the power supply but a precision power analyzer is the best tool for measuring overall power, efficiency and harmonic distortion. 21
22 Primer Hi L AC Source V LOAD N Lo A Hi Lo Figure 26. Connecting directly to a power analyzer. Figure 27. Using a break-out box for safe and simple product testing. Connections The standard current inputs of a power analyzer will measure a large range of current, from milli-amps to 20 or 30 amps RMS. This is suitable for most power supplies up to 3kW. A single power analyzer wattmeter input channel consists of a voltage input pair (V HI and V LO ) and a current input pair (A HI and A LO ). These connections are simplified by use of a break-out box that makes the analyzer connections with 4mm safety connectors and provides a standard AC outlet for connection to the power supply. Connections for low power standby. The standard current inputs of a power analyzer will measure a large range of current, from milli-amps to 20 or 30 amps RMS. To measure low power standby (milli-watts) use the low current input on the power analyzer. This is labelled A 1A to signify a maximum 1A RMS input that whose range runs from micro-amps up to 1 Amp RMS. To avoid errors, special care should also be taken with the voltage connection such that it is made on the source side of the current shunt. An extra terminal (V LO Source) on the breakout box makes this convenient. Details of these connections and the measurement methods can be found in another Tektronix primer, Standby Power Primer available from
, current transducers are used.")
23 Power Supply Measurement and Analysis Figure 28. Tektronix CT-xxxx-S precision current transducers. Connections for high power To extend the measurement range of a power analyzer above its rated direct input (typically 20 or 30A RMS), current transducers are used. The transducer may be a simple current transformer, a high performance active current transducer or a device (a resistive shunt or Rogowski coil) that produces a voltage output that is proportional to the current being measured. Power Transducer Power Analyzer Input 0 to 100W None Low current (1A) input 0.5W 3kW None Normal (20A) input 1kW + Simple current Transformer 1A or 20A input to match the transformer output Precision current transducer Transducer with a voltage Output (Shunt or Rogowski coil) 1A or 20A input to match the transformer output EXT A HI Voltage input Table 1. Current measurement technique for different power supply input power. In each case the power analyzer provides a suitable, matched current input and that input may be selected and scaled such that the correct actual current is displayed and recorded by the power analyzer. 23


24 Primer Figure 29. Default PA1000 measurements. Figure measurement display. Figure 31. Power supply waveform. Figure 32. Power supply harmonic content. Power Measurements with a Power Analyzer For basic power supply measurements, no set up of the analyzer is required. The power analyzers menu system may then be used to select and display further measurements. 24

 power is regulated by: US Energy Independence and Security Act EC Ecodesign Directive EC IPP Mobile Device Charger Rating For the domestic and")
25 Power Supply Measurement and Analysis Figure 33. Tektronix PWRVIEW standby power measurement. Figure 34. PWRVIEW PC software charts harmonics and compares to limits. Making Standards Compliance Measurements Power, standby power and efficiency Many international agencies lay down limits for different aspects of power supply and end-product power and energy performance. For power supplies, efficiency and no-load (or standby) power is regulated by: US Energy Independence and Security Act EC Ecodesign Directive EC IPP Mobile Device Charger Rating For the domestic and office devices and appliances that are powered by power supplies then further programs limit the energy efficiency and standby power of the complete end product: ENERGY STAR California Energy Commision EU Eco-Label Nordic EcoLabel Blue Angel (Germany) Top Runner (Japan) Energy Saving (Korea) Power is measured using a power analyzer as described above and compliance is checked by comparison with the limits described by the relevant program above. Efficiency is calculated from a measurement of input power (P IN ) and output power (P OUT ). Power analyzers measure a wide range of both AC and DC signals and so can convenient and accurate efficiency measurements can be provided by using multiple power analyzers simultaneously. Measurements of standby power to the above programs require special techniques that are described by the European standard IEC62301 Ed.2. To measure standby power in this way, PC software is used to calculate and verify the measurement stability and uncertainty that is required. Harmonics Limits Using PC software coupled to the power analyzer, harmonics measurements may be quickly and conveniently recorded and compared to the limits of IEC and others. Software features such as PDF report export provide complete reporting functions for power supply conformance measurements. 25
26 Primer Conclusion The power supply is integral to virtually every type of linepowered electronic product, and the switch-mode power supply (SMPS) has become the dominant architecture in digital computing, networking, and communications systems. A single switch-mode power supply s performance or its failure can affect the fate of a large, costly system. Measurements are the only way to ensure the reliability, stability, compliance, and safety of an emerging SMPS design. SMPS measurements fall into three principal categories: active device measurements; passive device measurements (mostly magnetics); and power quality tests. Some measurements may deal with floating voltages and high currents; others require math-intensive analysis to deliver meaningful results. Power supply measurements can be complex. The modern digital oscilloscope has become the tool of choice for characterization and troubleshooting measurements. When equipped with appropriate probing tools and automated measurement software, the oscilloscope simplifies challenging SMPS measurements while providing fast, accurate answers. For system-level validation and compliance testing, power analyzers deliver measurements with specified accuracy and traceability. 26
27 Power Supply Measurement and Analysis Power Measurements Which Tektronix oscilloscope is right for your power applications? Automatic Manual TPS2000B Series with TPS2PWR1 Module MDO4000 and MDO3000 Series with DPO4PWR or MDO3PWR App. Module MSO/DPO5000B Series with DPOPWR Option DPO7000C Series with DPOPWR Option Bandwidth 100 MHz to 200 MHz 100 MHz to 1 GHz 350 MHz to 2 GHz 500 MHz to 3.5 GHz Specifications Special Features Record Length 2.5 k Up to 20 M Up to 250 M Up to 500 M Sample Rate Up to 2 GS/s Up to 5 GS/s Up to 10 GS/s *1 Up to 40 GS/s *1 Maximum Input Voltage (see Voltage Probes, page 22) 300 V RMS CAT II 300 V RMS CAT II 300 V RMS CAT II 150 V RMS Automated De-skew X X X Isolated and Floating Channels X Windows Operating System and Desktop X X Battery Powered Operation X FFT Plots X X X X V RMS I RMS True (Real) Power Line Power Quality Measurements Reactive Power Apparent Power Power Factor Crest Factor Phase Angle Harmonics Total Harmonic Distortion I/O Analysis Measurements Line Ripple Switching Noise Emission Compliance Tests Pre-Compliance Testing to EN MIL Standard 1399 Switching Loss Measurements Active Component Measurements Passive Component Measurements Safe Operating Area Dynamic Resistance (dv/dt, di/dt) Modulation Analysis Inductance Magnetic Power Loss Flux Density B-H Plots *1 On One Channel 27
 Probes TPS2000 Series oscilloscopes achieve the best power")
.")

 connectivity and ease-of-use.")
28 Primer Power Applications TPS2000B Series with TPS2PWR1 Module Industrial Power Automotive MDO4000 and MDO3000 Series with DPO4PWR or MDO3PWR Application Module Power Supply Troubleshooting SMPS Design & Development MSO/DPO5000B and DPO7000C Series with DPOPWR Option SMPS Design & Development Pre-Compliance (Military and Industrial) Probes TPS2000 Series oscilloscopes achieve the best power measurement performance when combined with the following probes. The MDO3000, MDO4000, MSO/DPO5000, and DPO7000 Series digital phosphor oscilloscopes are equipped with the Tektronix Versatile Probe Interface (TekVPI). TekVPI probes are versatile, feature-rich, and easy-to-use. High Voltage Differential Probes Features Safely make measurements of floating or elevated circuits with the oscilloscope grounded. Wide dynamic voltage range from milli-volts to kilo-volts. Model Numbers - P P5122 TekVPI High Voltage Differential Probes Features Model Numbers - TDP1000 *2*3 Offers GHz performance to analyze Switch Mode Power Supply (SMPS) designs. Versatile device under test (DUT) connectivity and ease-of-use. - TDP0500 *2*3 - THDP0200 *2*3 (measures up to ± 1500 V) - THDP0100 *2*3 (measures up to ± 6000 V) Current Probes Features Transformer and Hall effect technology enhance AC/DC measurement capabilities. Wide dynamic current range from milli- Amps to kilo-amps. Model Numbers - TCP TCPA300 with TCP303,TCP305A, and/or TCP312A *1 TPS2000 Series requires 1103 power supply. *2 MSO/DPO5000B Series requires TekVPI external power supply XX when total oscilloscope probe power usage exceeds 15W. *3 MDO3000 Series supplies up to a total of 25W of oscilloscope probe power. TekVPI Current Probes Features Exceptional bandwidth (DC to 120 MHz) and broad dynamic range (milli-amps tp hundreds of Amps.) Split core construction makes it easier and quicker to connect to the device under test (DUT). Model Numbers - TCP0020 *2*3 - TCP0030A *2*3 - TCP0150 *2*3 28


29 Power Supply Measurement and Analysis Power Measurement and Analysis Application Software DPOPWR for the MSO/DPO5000, DPO7000, and MSO/DSA/DPO70000 Series Oscilloscopes Multi-vendor probe support with auto-deskew capability Quickly measure and analyze power dissipation in power supply switching devices and magnetic components Generate detailed test reports in customizable formats DPO4PWR for the MDO4000 Series and MDO3PWR for the MDO3000 Series Oscilloscopes TekVPI probe support with auto-deskew capability Quickly measure and analyze power quality, switching loss, harmonics, SOA, modulation, ripple and slew rate in power supply switching devices TPS2PWR1 for the TPS2000 Series Oscilloscope Quickly measure and analyze instantaneous power, harmonics, switching loss, phase angles, dv/dt and di/dt 29


30 Primer Choosing Your Next Power Analyzer Measuring Power and Energy. The PA1000 power analyzers combine accuracy with ease of use to provide design and test engineers with high-value measurement solutions. They feature patent-pending SpiralShuntTM technology to guarantee robust performance over a 1-year calibration interval and during changes of current and temperature. PA1000 Single-Phase Power Analyzer Best in class accuracy and connectivity. Easy to use yet packed with features to speed the design and test of power supplies and any product connected to the AC line. Product Highlights 0.05% reading % range basic accuracy Dual shunts maximize accuracy for low and high current measurements USB, Ethernet and GPIB interfaces PWRVIEW PC software for measurement and control. Includes IEC62301 Ed.2 standby power Harmonics, Inrush and Energy (W-h) measurements Color display of 4 or 14 measurements and waveform, harmonics and energy trend graphics. AFG3000 Series Arbitrary/Function Generator Save cost and set-up time by creating high amplitude signals to stimulate your device without using an external power amplifier. The AFG3011 offers up to 20 Vp-p amplitude (into a 50 Ω load) at frequencies up to 10 MHz. Other models of the AFG3000 Series offer frequencies up to 240 MHz with one or two channels to create up to two synchronized or completely independent signals. 30
Power Supply Measurement and Analysis Primer
 Power Supply Measurement and Analysis Primer Our thanks to Tektronix for allowing us to reprint the following article. Introduction A power supply is a component, subsystem, or system that converts electrical
Power Measurements for Switch-Mode Power Supplies SAVE Verona 2011
 Power Measurements for Switch-Mode Power Supplies SAVE Verona 2011 Agenda Power measurements tools Switch-mode power supplies Automated power measurements Summary Reference information 2 Switch-Mode Power
Power Supply Measurement and Analysis with the MSO/DPO Series Oscilloscopes
 Power Supply Measurement and Analysis with the MSO/DPO Series Oscilloscopes Introduction Power supplies can be found in many different electronic devices, from children s toys to computers and office equipment
Measuring Power Supply Switching Loss with an Oscilloscope
 Measuring Power Supply Switching Loss with an Oscilloscope Our thanks to Tektronix for allowing us to reprint the following. Ideally, the switching device is either on or off like a light switch, and instantaneously
Today most of engineers use oscilloscope as the preferred measurement tool of choice when it comes to debugging and analyzing switching power
 Today most of engineers use oscilloscope as the preferred measurement tool of choice when it comes to debugging and analyzing switching power supplies. In this session we will learn about some basics of
Measuring Power Supply Switching Loss with an Oscilloscope
 Measuring Power Supply Switching Loss with an Oscilloscope Application Note Introduction With the demand for improving power efficiency and extending the operating time of battery-powered devices, the
Measurement and Analysis for Switchmode Power Design
 Measurement and Analysis for Switchmode Power Design Switched Mode Power Supply Measurements AC Input Power measurements Safe operating area Harmonics and compliance Efficiency Switching Transistor Losses
Power Measurements and Analysis: Challenges and Solutions
 Power Measurements and Analysis: Challenges and Solutions Selu Gupta HW Design Engineer Tektronix, Inc. Beaverton, Oregon USA ABSTRACT: The job of a switch mode power supply and power electronics engineer
Switched Mode Power Supply Measurements
 Power Analysis 1 Switched Mode Power Supply Measurements AC Input Power measurements Safe operating area Harmonics and compliance Efficiency Switching Transistor Losses Measurement challenges Transformer
Active Power Factor Correction Verification Measurements with an Oscilloscope APPLICATION NOTE
 Active Power Factor Correction Verification Measurements with an Oscilloscope AC-DC power supplies, especially those designed to comply with IEC61000-3-2 or ENERGY STAR standards, often include some form
DPO3PWR, MDO3PWR and DPO4PWR Power Analysis Modules ZZZ User Manual
 x DPO3PWR, MDO3PWR and DPO4PWR Power Analysis Modules ZZZ User Manual *P071263101* 071-2631-01 xx DPO3PWR, MDO3PWR and DPO4PWR Power Analysis Modules ZZZ User Manual www.tektronix.com 071-2631-01 Copyright
In-circuit Measurements of Inductors and Transformers in Switch Mode Power Supplies APPLICATION NOTE
 In-circuit Measurements of Inductors and Transformers in Switch Mode Power Supplies FIGURE 1. Inductors and transformers serve key roles in switch mode power supplies, including filters, step-up/step-down,
Performing Safe Operating Area Analysis on MOSFETs and Other Switching Devices with an Oscilloscope APPLICATION NOTE
 Performing Safe Operating Area Analysis on MOSFETs and Other Switching Devices with an Oscilloscope Line Gate Drain Neutral Ground Source Gate Drive FIGURE 1. Simplified switch mode power supply switching
Probe Considerations for Low Voltage Measurements such as Ripple
 Probe Considerations for Low Voltage Measurements such as Ripple Our thanks to Tektronix for allowing us to reprint the following article. Figure 1. 2X Probe (CH1) and 10X Probe (CH2) Lowest System Vertical
Sophisticated Power Loss Analysis Using A Digital Phosphor Oscilloscope
 Sophisticated Power Loss Analysis Using A Digital Phosphor Oscilloscope Quickly Locate Power Dissipation in Switching Power Supplies With demand for power driving architectural changes to switching power
Power Analysis Application Module DPO4PWR MDO3PWR Datasheet
 Power Analysis Application Module DPO4PWR MDO3PWR Datasheet Applications Power loss measurement at switching device Characterization of power semiconductor devices Optimal drive characterization of synchronous
Single Switch Forward Converter
 Single Switch Forward Converter This application note discusses the capabilities of PSpice A/D using an example of 48V/300W, 150 KHz offline forward converter voltage regulator module (VRM), design and
Minimizing Input Filter Requirements In Military Power Supply Designs
 Keywords Venable, frequency response analyzer, MIL-STD-461, input filter design, open loop gain, voltage feedback loop, AC-DC, transfer function, feedback control loop, maximize attenuation output, impedance,
Probes and Accessories
 99 Washington Street Melrose, MA 02176 Phone 781-665-1400 Toll Free 1-800-517-8431 Visit us at www.testequipmentdepot.com Probes and Accessories Your Guide to Selecting the Right Probe Measurement Accuracy
Standby Power. Primer
 Standby Power Primer Primer Table of Contents What is Standby Power?...3 Why is Standby Power Important?...3 How to Measure Standby Power...4 Requirements for a Measurement...4 Standby Measurement Challenges...4
Testing and Stabilizing Feedback Loops in Today s Power Supplies
 Keywords Venable, frequency response analyzer, impedance, injection transformer, oscillator, feedback loop, Bode Plot, power supply design, open loop transfer function, voltage loop gain, error amplifier,
How to Select the Right Current Probe APPLICATION NOTE
 How to Select the Right Current Probe APPLICATION NOTE Overview Oscilloscope current probes enable oscilloscopes to measure current, extending their use beyond just measuring voltage. Basically, current
Testing Power Sources for Stability
 Keywords Venable, frequency response analyzer, oscillator, power source, stability testing, feedback loop, error amplifier compensation, impedance, output voltage, transfer function, gain crossover, bode
INVESTIGATION AND DESIGN OF HIGH CURRENT SOURCES FOR B-H LOOP MEASUREMENTS
 INVESTIGATION AND DESIGN OF HIGH CURRENT SOURCES FOR B-H LOOP MEASUREMENTS Boyanka Marinova Nikolova, Georgi Todorov Nikolov Faculty of Electronics and Technologies, Technical University of Sofia, Studenstki
Conventional Single-Switch Forward Converter Design
 Maxim > Design Support > Technical Documents > Application Notes > Amplifier and Comparator Circuits > APP 3983 Maxim > Design Support > Technical Documents > Application Notes > Power-Supply Circuits
LM78S40 Switching Voltage Regulator Applications
 LM78S40 Switching Voltage Regulator Applications Contents Introduction Principle of Operation Architecture Analysis Design Inductor Design Transistor and Diode Selection Capacitor Selection EMI Design
Making sense of electrical signals
 Making sense of electrical signals Our thanks to Fluke for allowing us to reprint the following. vertical (Y) access represents the voltage measurement and the horizontal (X) axis represents time. Most
Making Accurate Current Measurements on Power Supplies with Oscilloscopes APPLICATION NOTE
 Making Accurate Current Measurements on Power Supplies with Oscilloscopes APPLICATION NOTE Application Note fractions of a percent can be meaningful. But to accurately evaluate and measure such small performance
Generator Advanced Concepts
 Generator Advanced Concepts Common Topics, The Practical Side Machine Output Voltage Equation Pitch Harmonics Circulating Currents when Paralleling Reactances and Time Constants Three Generator Curves
TAKE THE MYSTERY OUT OF PROBING. 7 Common Oscilloscope Probing Pitfalls to Avoid
 TAKE THE MYSTERY OUT OF PROBING 7 Common Oscilloscope Probing Pitfalls to Avoid Introduction Understanding common probing pitfalls and how to avoid them is crucial in making better measurements. In an
Introduction to Oscilloscopes Instructor s Guide
 Introduction to Oscilloscopes A collection of lab exercises to introduce you to the basic controls of a digital oscilloscope in order to make common electronic measurements. Revision 1.0 Page 1 of 25 Copyright
Lecture 6 ECEN 4517/5517
 Lecture 6 ECEN 4517/5517 Experiment 4: inverter system Battery 12 VDC HVDC: 120-200 VDC DC-DC converter Isolated flyback DC-AC inverter H-bridge v ac AC load 120 Vrms 60 Hz d d Feedback controller V ref
Keysight Technologies DSOX3PWR/DSOX4PWR/DSOX6PWR Power Measurement Options
 Keysight Technologies DSOX3PWR/DSOX4PWR/DSOX6PWR Power Measurement Options Data Sheet For InfiniiVision 3000, 4000 and 6000 X-Series Oscilloscopes Achieve cost-effective analysis of your switching mode
Getting the Most From Your Portable DC/DC Converter: How To Maximize Output Current For Buck And Boost Circuits
 Getting the Most From Your Portable DC/DC Converter: How To Maximize Output Current For Buck And Boost Circuits Upal Sengupta, Texas nstruments ABSTRACT Portable product design requires that power supply
MIC4421/4422. Bipolar/CMOS/DMOS Process. General Description. Features. Applications. Functional Diagram. 9A-Peak Low-Side MOSFET Driver
 9A-Peak Low-Side MOSFET Driver Micrel Bipolar/CMOS/DMOS Process General Description MIC4421 and MIC4422 MOSFET drivers are rugged, efficient, and easy to use. The MIC4421 is an inverting driver, while
As delivered power levels approach 200W, sometimes before then, heatsinking issues become a royal pain. PWM is a way to ease this pain.
 1 As delivered power levels approach 200W, sometimes before then, heatsinking issues become a royal pain. PWM is a way to ease this pain. 2 As power levels increase the task of designing variable drives
Power Factor and Power Factor Correction
 Power Factor and Power Factor Correction Long gone are the days when only engineers that worked with large electric motors and high power electric loads need worry about power factor. The introduction
U1881A and U1882A Power Measurement Application for InfiniiVision and Infiniium Oscilloscopes
 U1881A and U1882A Power Measurement Application for InfiniiVision and Infiniium Oscilloscopes Data Sheet Fast, automatic and reliable characterization of switching mode power devices Today s power supply
AN Analog Power USA Applications Department
 Using MOSFETs for Synchronous Rectification The use of MOSFETs to replace diodes to reduce the voltage drop and hence increase efficiency in DC DC conversion circuits is a concept that is widely used due
Introduction. Inductors in AC Circuits.
 Module 3 AC Theory What you ll learn in Module 3. Section 3.1 Electromagnetic Induction. Magnetic Fields around Conductors. The Solenoid. Section 3.2 Inductance & Back e.m.f. The Unit of Inductance. Factors
Agilent U1881A and U1882A Power Measurement Application for Agilent InfiniiVision and Infiniium Oscilloscopes
 Agilent U1881A and U1882A Power Measurement Application for Agilent InfiniiVision and Infiniium Oscilloscopes Data Sheet Fast, automatic and reliable characterization of switching mode power devices Today
University of North Carolina-Charlotte Department of Electrical and Computer Engineering ECGR 3157 Electrical Engineering Design II Fall 2013
 Exercise 1: PWM Modulator University of North Carolina-Charlotte Department of Electrical and Computer Engineering ECGR 3157 Electrical Engineering Design II Fall 2013 Lab 3: Power-System Components and
Tips and Tricks for Optimizing Low Power Measurements
 Tips and Tricks for Optimizing Low Power Measurements Technical Brief Low-power measurements are becoming increasingly important in many line-powered and battery-powered applications, yet many engineers
Making sense of electrical signals
 APPLICATION NOTE Making sense of electrical signals Devices that convert electrical power to mechanical power run the industrial world, including pumps, compressors, motors, conveyors, robots and more.
APPLICATION NOTE - 018
 APPLICATION NOTE - 018 Power Transformers Background Power Transformers are used within an AC power distribution systems to increase or decrease the operating voltage to achieve the optimum transmission
LFR: flexible, clip-around current probe for use in power measurements
 LFR: flexible, clip-around current probe for use in power measurements These technical notes should be read in conjunction with the LFR short-form datasheet. Power Electronic Measurements Ltd Nottingham
Vishay Siliconix AN724 Designing A High-Frequency, Self-Resonant Reset Forward DC/DC For Telecom Using Si9118/9 PWM/PSM Controller.
 AN724 Designing A High-Frequency, Self-Resonant Reset Forward DC/DC For Telecom Using Si9118/9 PWM/PSM Controller by Thong Huynh FEATURES Fixed Telecom Input Voltage Range: 30 V to 80 V 5-V Output Voltage,
CHAPTER 1 INTRODUCTION
 1 CHAPTER 1 INTRODUCTION 1.1 GENERAL Induction motor drives with squirrel cage type machines have been the workhorse in industry for variable-speed applications in wide power range that covers from fractional
Single-Phase Grid-Tied Inverter (PWM Rectifier/Inverter)
") Exercise 2 Single-Phase Grid-Tied Inverter (PWM Rectifier/Inverter) EXERCISE OBJECTIVE When you have completed this exercise, you will be familiar with the singlephase grid-tied inverter. DISCUSSION OUTLINE
Exercise 2 Single-Phase Grid-Tied Inverter (PWM Rectifier/Inverter) EXERCISE OBJECTIVE When you have completed this exercise, you will be familiar with the singlephase grid-tied inverter. DISCUSSION OUTLINE
Testing Power Factor Correction Circuits For Stability
 Keywords Venable, frequency response analyzer, impedance, injection transformer, oscillator, feedback loop, Bode Plot, power supply design, switching power supply, PFC, boost converter, flyback converter,
CONTENTS. Chapter 1. Introduction to Power Conversion 1. Basso_FM.qxd 11/20/07 8:39 PM Page v. Foreword xiii Preface xv Nomenclature
 Basso_FM.qxd 11/20/07 8:39 PM Page v Foreword xiii Preface xv Nomenclature xvii Chapter 1. Introduction to Power Conversion 1 1.1. Do You Really Need to Simulate? / 1 1.2. What You Will Find in the Following
Switch Mode Power Supplies and their Magnetics
 Switch Mode Power Supplies and their Magnetics Many factors must be considered by designers when choosing the magnetic components required in today s electronic power supplies In today s day and age the
Experiment (1) Principles of Switching
 Principles of Switching") Experiment (1) Principles of Switching Introduction When you use microcontrollers, sometimes you need to control devices that requires more electrical current than a microcontroller can supply; for this,
Experiment (1) Principles of Switching Introduction When you use microcontrollers, sometimes you need to control devices that requires more electrical current than a microcontroller can supply; for this,
Online Help. DPOPWR Power Measurement and Analysis Software Adapted from DPOPWR Power Measurement and Analysis Online Help
 Online Help DPOPWR Power Measurement and Analysis Software 077-0018-03 Adapted from DPOPWR Power Measurement and Analysis Online Help www.tektronix.com Copyright Tektronix. All rights reserved. Licensed
RCTrms Technical Notes
 RCTrms Technical Notes All measuring instruments are subject to limitations. The purpose of these technical notes is to explain some of those limitations and to help the engineer maximise the many advantages
U1881A and U1882A Power Measurement Application for InfiniiVision and Infiniium Oscilloscopes
 U1881A and U1882A Power Measurement Application for InfiniiVision and Infiniium Oscilloscopes Data Sheet Fast, automatic and reliable characterization of switching mode power devices Today s power supply
Lecture 19 - Single-phase square-wave inverter
 Lecture 19 - Single-phase square-wave inverter 1. Introduction Inverter circuits supply AC voltage or current to a load from a DC supply. A DC source, often obtained from an AC-DC rectifier, is converted
ME 365 EXPERIMENT 1 FAMILIARIZATION WITH COMMONLY USED INSTRUMENTATION
 Objectives: ME 365 EXPERIMENT 1 FAMILIARIZATION WITH COMMONLY USED INSTRUMENTATION The primary goal of this laboratory is to study the operation and limitations of several commonly used pieces of instrumentation:
Advanced Power Measurement and Analysis 5 Series MSO Option 5-PWR Datasheet
 Advanced Power Measurement and Analysis 5 Series MSO Option 5-PWR Datasheet www.tek.com 1 Datasheet Get more visibility into your power systems with Advanced Power Measurement and Analysis on the 5 Series
Laboratory 6. Lab 6. Operational Amplifier Circuits. Required Components: op amp 2 1k resistor 4 10k resistors 1 100k resistor 1 0.
 Laboratory 6 Operational Amplifier Circuits Required Components: 1 741 op amp 2 1k resistor 4 10k resistors 1 100k resistor 1 0.1 F capacitor 6.1 Objectives The operational amplifier is one of the most
Chapter 1: DC circuit basics
 Chapter 1: DC circuit basics Overview Electrical circuit design depends first and foremost on understanding the basic quantities used for describing electricity: Voltage, current, and power. In the simplest
Electrical Fundamentals and Basic Components Chapters T2, T3, G4
 Electrical Fundamentals and Basic Components Chapters T2, T3, G4 Some Basic Math, Electrical Fundamentals, AC Power, The Basics of Basic Components, A Little More Component Detail, Reactance and Impedance
Keysight Technologies DSOX3PWR/DSOX4PWR/DSOX6PWR Power Measurement Options
 Keysight Technologies DSOX3PWR/DSOX4PWR/DSOX6PWR Power Measurement Options Data Sheet For InfiniiVision 3000, 4000 and 6000 X-Series Oscilloscopes 02 Keysight DSOX3PWR/DSOX4PWR/DSOX6PWR Power Measurement
UNIVERSITY OF BRITISH COLUMBIA
 UNIVERSITY OF BRITISH COLUMBIA DEPARTMENT OF ELECTRICAL AND COMPUTER ENGINEERING POWER ELECTRONICS LAB HANDBOOK Dr P.R. Palmer Dr P.R. Palmer 1 2004 1 AIM The aim of the project is to design, construct
PowerAmp Design. PowerAmp Design PAD20 COMPACT HIGH VOLTAGE OP AMP
 PowerAmp Design Rev C KEY FEATURES LOW COST HIGH VOLTAGE 150 VOLTS HIGH OUTPUT CURRENT 5A 40 WATT DISSIPATION CAPABILITY 80 WATT OUTPUT CAPABILITY INTEGRATED HEAT SINK AND FAN SMALL SIZE 40mm SQUARE RoHS
Practical Testing Techniques For Modern Control Loops
 VENABLE TECHNICAL PAPER # 16 Practical Testing Techniques For Modern Control Loops Abstract: New power supply designs are becoming harder to measure for gain margin and phase margin. This measurement is
Power. Power is the rate of using energy in joules per second 1 joule per second Is 1 Watt
 3 phase Power All we need electricity for is as a source of transport for energy. We can connect to a battery, which is a source of stored energy. Or we can plug into and electric socket at home or in
Designers Series XII. Switching Power Magazine. Copyright 2005
 Designers Series XII n this issue, and previous issues of SPM, we cover the latest technologies in exotic high-density power. Most power supplies in the commercial world, however, are built with the bread-and-butter
Practical Measurements considerations for GaN and SiC technologies ANDREA VINCI EMEA MARKET DEVELOPMENT MANAGER POWER ELECTRONICS
 Practical Measurements considerations for GaN and SiC technologies ANDREA VINCI EMEA MARKET DEVELOPMENT MANAGER POWER ELECTRONICS PLEASED TO MEET YOU 2 Evolving Test Solutions with Semiconductors WAFER
CHAPTER 2 A SERIES PARALLEL RESONANT CONVERTER WITH OPEN LOOP CONTROL
 14 CHAPTER 2 A SERIES PARALLEL RESONANT CONVERTER WITH OPEN LOOP CONTROL 2.1 INTRODUCTION Power electronics devices have many advantages over the traditional power devices in many aspects such as converting
Field Effect Transistors
 Field Effect Transistors Purpose In this experiment we introduce field effect transistors (FETs). We will measure the output characteristics of a FET, and then construct a common-source amplifier stage,
DLVP A OPERATOR S MANUAL
 DLVP-50-300-3000A OPERATOR S MANUAL DYNALOAD DIVISION 36 NEWBURGH RD. HACKETTSTOWN, NJ 07840 PHONE (908) 850-5088 FAX (908) 908-0679 TABLE OF CONTENTS INTRODUCTION...3 SPECIFICATIONS...5 MODE SELECTOR
CHAPTER-III MODELING AND IMPLEMENTATION OF PMBLDC MOTOR DRIVE
 CHAPTER-III MODELING AND IMPLEMENTATION OF PMBLDC MOTOR DRIVE 3.1 GENERAL The PMBLDC motors used in low power applications (up to 5kW) are fed from a single-phase AC source through a diode bridge rectifier
Transformer Waveforms
 OBJECTIVE EXPERIMENT Transformer Waveforms Steady-State Testing and Performance of Single-Phase Transformers Waveforms The voltage regulation and efficiency of a distribution system are affected by the
High Side MOSFET Gate Drive: The Power of Well. Implemented Pulse Transformers
 High Side MOSFET Gate Drive: The Power of Well Author: Fritz Schlunder SHEF Systems AN-1 Implemented Pulse Transformers Many different techniques and circuits are available for providing high side N-Channel
Filters And Waveform Shaping
 Physics 3330 Experiment #3 Fall 2001 Purpose Filters And Waveform Shaping The aim of this experiment is to study the frequency filtering properties of passive (R, C, and L) circuits for sine waves, and
ARE HARMONICS STILL A PROBLEM IN DATA CENTERS? by Mohammad Al Rawashdeh, Lead Consultant, Data Center Engineering Services
 ARE HARMONICS STILL A PROBLEM IN DATA CENTERS? by Mohammad Al Rawashdeh, Lead Consultant, Data Center Engineering Services edarat group INTRODUCTION Harmonics are a mathematical way of describing distortion
New Techniques for Testing Power Factor Correction Circuits
 Keywords Venable, frequency response analyzer, impedance, injection transformer, oscillator, feedback loop, Bode Plot, power supply design, power factor correction circuits, current mode control, gain
What is an Inductor? Token Electronics Industry Co., Ltd. Version: January 16, Web:
 Version: January 16, 2017 What is an Inductor? Web: www.token.com.tw Email: rfq@token.com.tw Token Electronics Industry Co., Ltd. Taiwan: No.137, Sec. 1, Zhongxing Rd., Wugu District, New Taipei City,
High Speed Digital Systems Require Advanced Probing Techniques for Logic Analyzer Debug
 JEDEX 2003 Memory Futures (Track 2) High Speed Digital Systems Require Advanced Probing Techniques for Logic Analyzer Debug Brock J. LaMeres Agilent Technologies Abstract Digital systems are turning out
University of Pittsburgh
 University of Pittsburgh Experiment #1 Lab Report Frequency Response of Operational Amplifiers Submission Date: 05/29/2018 Instructors: Dr. Ahmed Dallal Shangqian Gao Submitted By: Nick Haver & Alex Williams
Wireless Communication
 Equipment and Instruments Wireless Communication An oscilloscope, a signal generator, an LCR-meter, electronic components (see the table below), a container for components, and a Scotch tape. Component
2.0 AC CIRCUITS 2.1 AC VOLTAGE AND CURRENT CALCULATIONS. ECE 4501 Power Systems Laboratory Manual Rev OBJECTIVE
 2.0 AC CIRCUITS 2.1 AC VOLTAGE AND CURRENT CALCULATIONS 2.1.1 OBJECTIVE To study sinusoidal voltages and currents in order to understand frequency, period, effective value, instantaneous power and average
Calhoon MEBA Engineering School. Study Guide for Proficiency Testing Industrial Electronics
 Calhoon MEBA Engineering School Study Guide for Proficiency Testing Industrial Electronics January 0. Which factors affect the end-to-end resistance of a metallic conductor?. A waveform shows three complete
Keysight Technologies How to Make the Best Switch Mode Power Supply Measurements. Application Note
 Keysight Technologies How to Make the Best Switch Mode Power Supply Measurements Application Note Introduction Characterizing the operation of switch mode power supplies requires a broad range of measurements.
ECE 201 LAB 8 TRANSFORMERS & SINUSOIDAL STEADY STATE ANALYSIS
 Version 1.1 1 of 8 ECE 201 LAB 8 TRANSFORMERS & SINUSOIDAL STEADY STATE ANALYSIS BEFORE YOU BEGIN PREREQUISITE LABS Introduction to MATLAB Introduction to Lab Equipment Introduction to Oscilloscope Capacitors,
PIEZOELECTRIC TRANSFORMER FOR INTEGRATED MOSFET AND IGBT GATE DRIVER
 1 PIEZOELECTRIC TRANSFORMER FOR INTEGRATED MOSFET AND IGBT GATE DRIVER Prasanna kumar N. & Dileep sagar N. prasukumar@gmail.com & dileepsagar.n@gmail.com RGMCET, NANDYAL CONTENTS I. ABSTRACT -03- II. INTRODUCTION
PowerAmp Design. PowerAmp Design PAD117A RAIL TO RAIL OPERATIONAL AMPLIFIER
 PowerAmp Design RAIL TO RAIL OPERATIONAL AMPLIFIER Rev J KEY FEATURES LOW COST RAIL TO RAIL INPUT & OUTPUT SINGLE SUPPLY OPERATION HIGH VOLTAGE 100 VOLTS HIGH OUTPUT CURRENT 15A 250 WATT OUTPUT CAPABILITY
Power Amplifiers. Class A Amplifier
 Power Amplifiers The Power amplifiers amplify the power level of the signal. This amplification is done in the last stage in audio applications. The applications related to radio frequencies employ radio
Transformer Basics AN05-10ST. Application Note. innovation in wire wound magnetic technology. January 09 Rev 1
 innovation in wire wound magnetic technology Transformer Basics January 09 Rev 1 AN05-10ST Isolation Transformers Increase Safety of Electronic Systems Application Note Isolation Transformers Increase
Getting Started. MSO/DPO Series Oscilloscopes. Basic Concepts
 Getting Started MSO/DPO Series Oscilloscopes Basic Concepts 001-1523-00 Getting Started 1.1 Getting Started What is an oscilloscope? An oscilloscope is a device that draws a graph of an electrical signal.
Gate Drive Optimisation
 Gate Drive Optimisation 1. Background Driving of gates of MOSFET, IGBT and SiC/GaN switching devices is a fundamental requirement in power conversion. In the case of ground-referenced drives this is relatively
Operational Amplifiers
 Operational Amplifiers Table of contents 1. Design 1.1. The Differential Amplifier 1.2. Level Shifter 1.3. Power Amplifier 2. Characteristics 3. The Opamp without NFB 4. Linear Amplifiers 4.1. The Non-Inverting
total j = BA, [1] = j [2] total
![total j = BA, [1] = j [2] total](/thumbs/85/91692343.jpg "total j = BA, [1] = j [2] total") Name: S.N.: Experiment 2 INDUCTANCE AND LR CIRCUITS SECTION: PARTNER: DATE: Objectives Estimate the inductance of the solenoid used for this experiment from the formula for a very long, thin, tightly wound
Name: S.N.: Experiment 2 INDUCTANCE AND LR CIRCUITS SECTION: PARTNER: DATE: Objectives Estimate the inductance of the solenoid used for this experiment from the formula for a very long, thin, tightly wound
Op Amp Booster Designs
 Op Amp Booster Designs Although modern integrated circuit operational amplifiers ease linear circuit design, IC processing limits amplifier output power. Many applications, however, require substantially
Introduction to High-Speed Power Switching
 Exercise 3 Introduction to High-Speed Power Switching EXERCISE OBJECTIVE When you have completed this exercise, you will be familiar with the concept of voltage-type and current-type circuits. You will
High Performance ZVS Buck Regulator Removes Barriers To Increased Power Throughput In Wide Input Range Point-Of-Load Applications
 WHITE PAPER High Performance ZVS Buck Regulator Removes Barriers To Increased Power Throughput In Wide Input Range Point-Of-Load Applications Written by: C. R. Swartz Principal Engineer, Picor Semiconductor
Core Technology Group Application Note 1 AN-1
 Measuring the Impedance of Inductors and Transformers. John F. Iannuzzi Introduction In many cases it is necessary to characterize the impedance of inductors and transformers. For instance, power supply
DEPARTMENT OF ELECTRICAL ENGINEERING AND COMPUTER SCIENCE MASSACHUSETTS INSTITUTE OF TECHNOLOGY CAMBRIDGE, MASSACHUSETTS 02139
 DEPARTMENT OF ELECTRICAL ENGINEERING AND COMPUTER SCIENCE MASSACHUSETTS INSTITUTE OF TECHNOLOGY CAMBRIDGE, MASSACHUSETTS 019 Spring Term 00.101 Introductory Analog Electronics Laboratory Laboratory No.
PowerAmp Design. PowerAmp Design PAD112 HIGH VOLTAGE OPERATIONAL AMPLIFIER
 PowerAmp Design Rev C KEY FEATURES LOW COST HIGH VOLTAGE 150 VOLTS HIGH OUTPUT CURRENT 5 AMPS 50 WATT DISSIPATION CAPABILITY 100 WATT OUTPUT CAPABILITY INTEGRATED HEAT SINK AND FAN COMPATIBLE WITH PAD123