Time-Frequency analysis of biophysical time series. Courtesy of Arnaud Delorme
|
|
|
- Lucy Gordon
- 6 years ago
- Views:
Transcription
1 Time-Frequency analysis of biophysical time series Courtesy of Arnaud Delorme 1
2 2
3 Why Frequency-domain Analysis For many signals, the signal's frequency content is of great importance. Beta Alpha Theta Delta Low Delta 3
4 EEG Bands (Hz) Distribution Subjective feeling Associated tasks & behaviors Physiologi cal correlates Delta Distribution: generally broad or diffused deep, dreamless sleep, non-rem sleep, unconscious lethargic, not moving, not attentive not moving, low-level of arousal Theta 4-8 usually regional, may involve many lobes intuitive, creative, recall, fantasy, imagery, creative, dreamlike, drowsy creative, intuitive; distracted, unfocused healing, integration of mind/body Alpha 8-12 regional, usually involves entire lobe relaxed, not agitated, but not drowsy meditation, no action relaxed, healing Beta localized alertness, agitation mental activity, e.g. math alert, active Gamma >30 very localized Focused arousal high-level information processing, "binding" information -rich task processing 4

5 Frequency-domain Analysis of the EEG Joseph Fourier ( ) Any complex time series can be broken down into a series of superimposed sinusoids with different frequencies. Summation of the signals 5
6 6 Fourier Analysis Discrete Fourier-Transformation 傅利葉轉換 (O(N²)): ( ) 1 0,1,.., ) ( ] [ 1 0,1,.., ] [ 1 ) ( 1 0 ) / (2 1 0 / 2 = = = = = = N n e k X n x N k e n x N k X N k n N ik N n n N ik π π Fast Fourier Transform (FFT, O(Nlog 2 N), Cooley and Tukey (1965) = = ift ift e f H t h dt e t h f H 2π 2π ) ( ) ( ; ) ( ) ( Fourier-Transformation:
7 function [a,b] = dft (y) % DFT - The Discrete Fourier Transform % [a, b] = DFT (y) % a, b are the cosine and sine components n = length (y); t = 2*pi*(0:n-1)/n; f = 2.0 / n; for j = 0:n2 cs = cos (j * t); ss = sin (j * t); a(j+1) = f * (cs * y); b(j+1) = f * (ss * y); end % boundaries n2 = floor (n / 2); a(1) = 0.5 * a(1); a(n2+1) = 0.5 * a(n2+1); b(1) = 0.0; b(n2+1) = 0.0; Loop on frequency Cosine component Sine component Multiply with signal 7
8 Spectral phase and amplitude Imaginary Real + - Imag. Real F k (f,t) 8
9 Spectral phase and amplitude Imaginary Real Imag. Real F k (f,t) 9
10 Pwelch method for computing spectrum Squared amplitude Average 10
11 Spectral power 0 Hz 10 Hz 20 Hz 30 Hz 40 Hz 50 Hz Squared vector length Power log(μv 2 /Hz) Frequency (Hz) 11
12 Overlap 50% Squared amplitude Average 12
13 Zero padding 0 13

 (change window")
14 Plot data spectrum using EEGLAB winsize, 256 nfft, 256 overlap, 128 (change FFT window length) (change FFT padding) (change window overlap) 14
15 Disadvantage of Fourier Transform In transforming to the frequency domain, time information is lost. 15
16 Frequency-domain Analysis of the EEG We often apply a window to the data. This simply means taking the amount we want from the data stream The window is moved along the data; we perform the FFT on this windowed data 16
17 Spectrogram or ERSP 5 Hz 0 ms 10 ms 20 ms 30 ms 40 ms 50 ms 60 ms 10 Hz 20 Hz 30 Hz 17
18 Spectrogram or ERSP 5 Hz 0 ms 10 ms 20 ms 30 ms 40 ms 50 ms 60 ms 10 Hz 20 Hz squared vector length 30 Hz 5 Hz 2-D matrix average 10 Hz 20 Hz 30 Hz 0 ms 10 ms 20 ms 30 ms 40 ms 50 ms 60 ms 18
19 Power spectrum and event-related spectral perturbation 1 ntrials ERSP( f, t) = F ( f, t) k n k = 1 2 Complex number Scaled to db 10Log 10 (ERS) F k (f,t) 19


20 Absolute versus relative power Absolute = ERS Relative = ERSP (db or %) 20
21 Time-locked ERSP Time- & phase-locked ERP 40 Hz 10 Hz (time-locked but not phase-lock) 1 Hz (phaselocked) 21

22 ERSP vs ERP ERSP 10 Hz 1 Hz ERP? 22
23 Difference between FFT and wavelets FFT Wavelet Frequency 24
24 Wavelets factor Wavelet (0)= FFT Wavelet (1) 1Hz 2Hz 4Hz 6Hz 8Hz 10Hz 25


25 FFT In between Pure wavelet 26

 5) 2) 27")
26 Modified wavelets Wavelet (0.8) Wavelet (0.5) Wavelet (0.2) 27
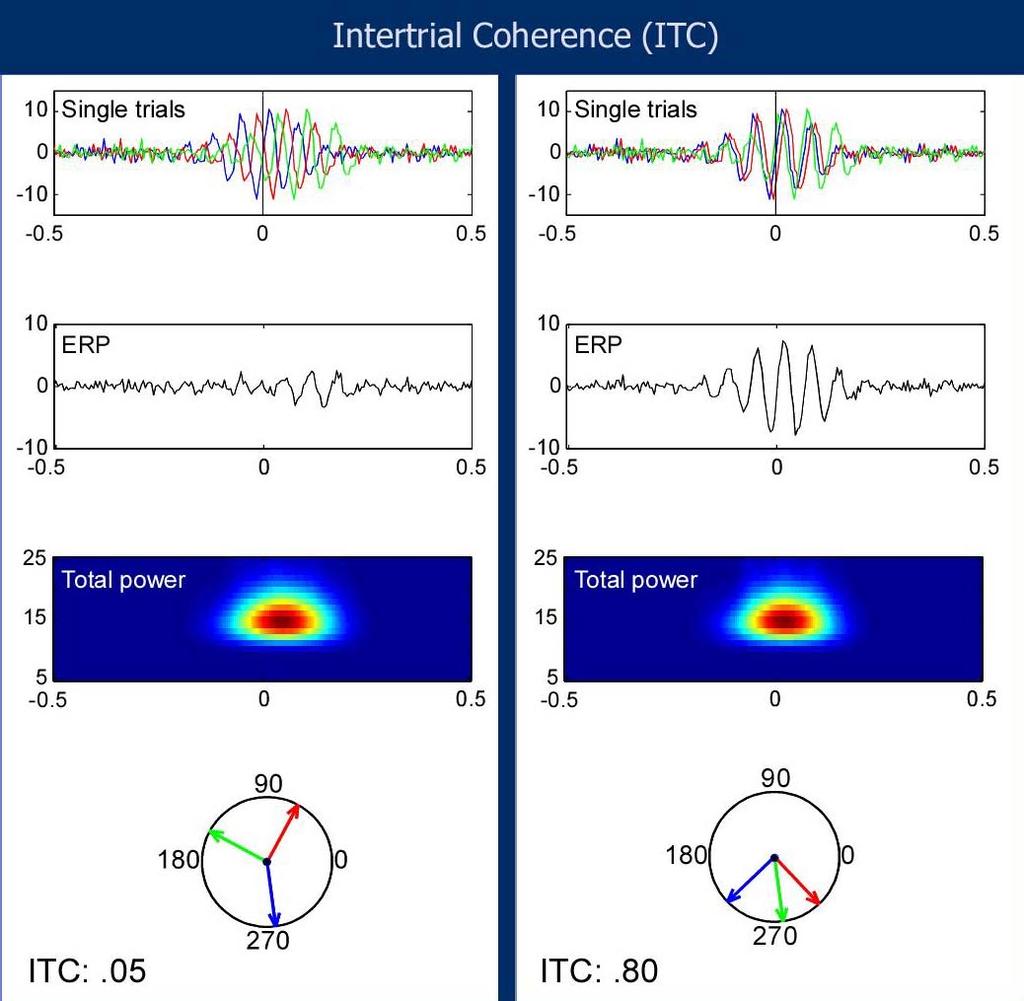
27 Inter trial coherence same time, different trials Trial 1 Trial 2 Trial 3 amplitude 0.5 phase 0 amplitude 1 phase 90 amplitude 0.25 phase 180 POWER = mean(amplitudes 2 ) 0.44 or 8.3 db COHERENCE = mean(phase vector) Norm
28 29
29 Phase ITC ITPC( f, t) = 1 n F k ( f, t) n k= F ( f, t) 1 k Normalized (no amplitude information) 30


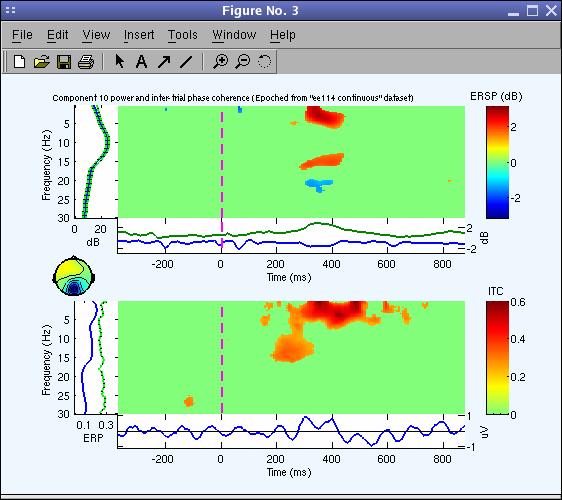
30 Power and inter-trial coherence 5 Time-frequency power Condition 1 Condition 2 db ITC: trials synchronization 31
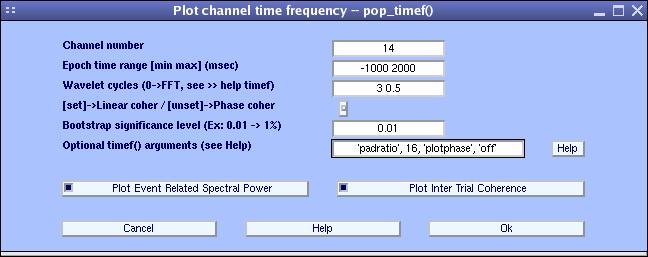
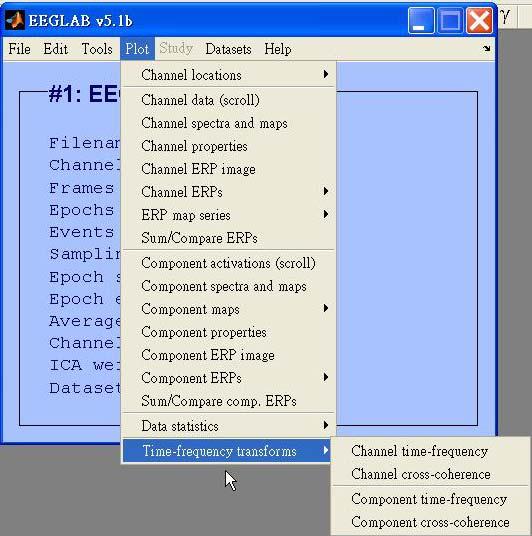
31 Channel time-frequency 32
32 Component time-frequency 33
 and condition 2 (right) Number of data points >>")

33 Compare between conditions condition 1 condition 2 difference ERSPs ITCs Component 10 for condition 1 (left) and condition 2 (right) Number of data points >> newtimef({ ALLEEG(2).icaact(10,:) EEG.icaact(10,:) }, EEG.pnts, [EEG.xmin EEG.xmax]*1000, EEG.srate, 0, 'padratio', 1); Number of data points Sampling rate Cycles (0=FFT) padding 34
34 Do the activities of maximally independent EEG domains interact? 35
35 Cross-coherence amplitude and phase 2 components, comparison on the same trials Trial 1 Coherence amplitude 1 Phase coherence 0 Trial 2 Coherence amplitude 1 Phase coherence 90 Trial 3 Coherence amplitude 1 Phase coherence 180 COHERENCE = mean(phase vector) Norm 0.33 Phase 90 degree 36
36 37 = = n k b k a k b k a k b a t f F t f F t f F t f F n t f ERPCOH 1 *, ), ( ), ( ), ( ), ( 1 ), ( Only phase information component a Only phase information component b Phase coherence (default)


")
37 Cross-coherence amplitude and phase 5 6 Condition 1 Condition 2 38 Phase (degree) Amplitude (0-1)

38 Component phase coherence 39
39 Summary 40
Time-Frequency analysis of biophysical time series. Arnaud Delorme CERCO, CNRS, France & SCCN, UCSD, La Jolla, USA
 Time-Frequency analysis of biophysical time series Arnaud Delorme CERCO, CNRS, France & SCCN, UCSD, La Jolla, USA Frequency analysis synchronicity of cell excitation determines amplitude and rhythm of
Time-Frequency analysis of biophysical time series
 Time-Frequency analysis of biophysical time series Sept 9 th 2010, NCTU, Taiwan Arnaud Delorme Frequency analysis synchronicity of cell excitation determines amplitude and rhythm of the EEG signal 30-60
(Time )Frequency Analysis of EEG Waveforms
Frequency Analysis of EEG Waveforms") (Time )Frequency Analysis of EEG Waveforms Niko Busch Charité University Medicine Berlin; Berlin School of Mind and Brain niko.busch@charite.de niko.busch@charite.de 1 / 23 From ERP waveforms to waves
(Time )Frequency Analysis of EEG Waveforms Niko Busch Charité University Medicine Berlin; Berlin School of Mind and Brain niko.busch@charite.de niko.busch@charite.de 1 / 23 From ERP waveforms to waves
Discrete Fourier Transform (DFT)
") Amplitude Amplitude Discrete Fourier Transform (DFT) DFT transforms the time domain signal samples to the frequency domain components. DFT Signal Spectrum Time Frequency DFT is often used to do frequency
Amplitude Amplitude Discrete Fourier Transform (DFT) DFT transforms the time domain signal samples to the frequency domain components. DFT Signal Spectrum Time Frequency DFT is often used to do frequency
Signal segmentation and waveform characterization. Biosignal processing, S Autumn 2012
 Signal segmentation and waveform characterization Biosignal processing, 5173S Autumn 01 Short-time analysis of signals Signal statistics may vary in time: nonstationary how to compute signal characterizations?
BCI for Comparing Eyes Activities Measured from Temporal and Occipital Lobes
 BCI for Comparing Eyes Activities Measured from Temporal and Occipital Lobes Sachin Kumar Agrawal, Annushree Bablani and Prakriti Trivedi Abstract Brain computer interface (BCI) is a system which communicates
Biomedical Signals. Signals and Images in Medicine Dr Nabeel Anwar
 Biomedical Signals Signals and Images in Medicine Dr Nabeel Anwar Noise Removal: Time Domain Techniques 1. Synchronized Averaging (covered in lecture 1) 2. Moving Average Filters (today s topic) 3. Derivative
Beyond Blind Averaging Analyzing Event-Related Brain Dynamics
 Beyond Blind Averaging Analyzing Event-Related Brain Dynamics Scott Makeig Swartz Center for Computational Neuroscience Institute for Neural Computation University of California San Diego La Jolla, CA
Topic 2. Signal Processing Review. (Some slides are adapted from Bryan Pardo s course slides on Machine Perception of Music)
") Topic 2 Signal Processing Review (Some slides are adapted from Bryan Pardo s course slides on Machine Perception of Music) Recording Sound Mechanical Vibration Pressure Waves Motion->Voltage Transducer
Topic 2 Signal Processing Review (Some slides are adapted from Bryan Pardo s course slides on Machine Perception of Music) Recording Sound Mechanical Vibration Pressure Waves Motion->Voltage Transducer
Integrating Human and Computer Vision with EEG Toward the Control of a Prosthetic Arm Eugene Lavely, Geoffrey Meltzner, Rick Thompson
 Integrating Human and Computer Vision with EEG Toward the Control of a Prosthetic Arm Eugene Lavely, Geoffrey Meltzner, Rick Thompson & Brain-Computer interface for hci and games Brain Interface EEG: In
DCSP-10: DFT and PSD. Jianfeng Feng. Department of Computer Science Warwick Univ., UK
 DCSP-10: DFT and PSD Jianfeng Feng Department of Computer Science Warwick Univ., UK Jianfeng.feng@warwick.ac.uk http://www.dcs.warwick.ac.uk/~feng/dcsp.html DFT Definition: The discrete Fourier transform
Fourier Signal Analysis
 Part 1B Experimental Engineering Integrated Coursework Location: Baker Building South Wing Mechanics Lab Experiment A4 Signal Processing Fourier Signal Analysis Please bring the lab sheet from 1A experiment
SAMPLING THEORY. Representing continuous signals with discrete numbers
 SAMPLING THEORY Representing continuous signals with discrete numbers Roger B. Dannenberg Professor of Computer Science, Art, and Music Carnegie Mellon University ICM Week 3 Copyright 2002-2013 by Roger
Orthogonal frequency division multiplexing (OFDM)
") Orthogonal frequency division multiplexing (OFDM) OFDM was introduced in 1950 but was only completed in 1960 s Originally grew from Multi-Carrier Modulation used in High Frequency military radio. Patent
Orthogonal frequency division multiplexing (OFDM) OFDM was introduced in 1950 but was only completed in 1960 s Originally grew from Multi-Carrier Modulation used in High Frequency military radio. Patent
Time Series/Data Processing and Analysis (MATH 587/GEOP 505)
") Time Series/Data Processing and Analysis (MATH 587/GEOP 55) Rick Aster and Brian Borchers October 7, 28 Plotting Spectra Using the FFT Plotting the spectrum of a signal from its FFT is a very common activity.
Time Series/Data Processing and Analysis (MATH 587/GEOP 55) Rick Aster and Brian Borchers October 7, 28 Plotting Spectra Using the FFT Plotting the spectrum of a signal from its FFT is a very common activity.
Chapter 5 Window Functions. periodic with a period of N (number of samples). This is observed in table (3.1).
. This is observed in table (3.1).") Chapter 5 Window Functions 5.1 Introduction As discussed in section (3.7.5), the DTFS assumes that the input waveform is periodic with a period of N (number of samples). This is observed in table (3.1).
Chapter 5 Window Functions 5.1 Introduction As discussed in section (3.7.5), the DTFS assumes that the input waveform is periodic with a period of N (number of samples). This is observed in table (3.1).
Fourier Methods of Spectral Estimation
 Department of Electrical Engineering IIT Madras Outline Definition of Power Spectrum Deterministic signal example Power Spectrum of a Random Process The Periodogram Estimator The Averaged Periodogram Blackman-Tukey
Outline. Introduction to Biosignal Processing. Overview of Signals. Measurement Systems. -Filtering -Acquisition Systems (Quantisation and Sampling)
") Outline Overview of Signals Measurement Systems -Filtering -Acquisition Systems (Quantisation and Sampling) Digital Filtering Design Frequency Domain Characterisations - Fourier Analysis - Power Spectral
Outline Overview of Signals Measurement Systems -Filtering -Acquisition Systems (Quantisation and Sampling) Digital Filtering Design Frequency Domain Characterisations - Fourier Analysis - Power Spectral
Notes on Fourier transforms
 Fourier Transforms 1 Notes on Fourier transforms The Fourier transform is something we all toss around like we understand it, but it is often discussed in an offhand way that leads to confusion for those
EE 464 Short-Time Fourier Transform Fall and Spectrogram. Many signals of importance have spectral content that
 EE 464 Short-Time Fourier Transform Fall 2018 Read Text, Chapter 4.9. and Spectrogram Many signals of importance have spectral content that changes with time. Let xx(nn), nn = 0, 1,, NN 1 1 be a discrete-time
Linguistic Phonetics. Spectral Analysis
 24.963 Linguistic Phonetics Spectral Analysis 4 4 Frequency (Hz) 1 Reading for next week: Liljencrants & Lindblom 1972. Assignment: Lip-rounding assignment, due 1/15. 2 Spectral analysis techniques There
Wavelets and wavelet convolution and brain music. Dr. Frederike Petzschner Translational Neuromodeling Unit
 Wavelets and wavelet convolution and brain music Dr. Frederike Petzschner Translational Neuromodeling Unit 06.03.2015 Recap Why are we doing this? We know that EEG data contain oscillations. Or goal is
Post-processing using Matlab (Advanced)!
!") OvGU! Vorlesung «Messtechnik»! Post-processing using Matlab (Advanced)! Dominique Thévenin! Lehrstuhl für Strömungsmechanik und Strömungstechnik (LSS)! thevenin@ovgu.de! 1 Noise filtering (1/2)! We have
OvGU! Vorlesung «Messtechnik»! Post-processing using Matlab (Advanced)! Dominique Thévenin! Lehrstuhl für Strömungsmechanik und Strömungstechnik (LSS)! thevenin@ovgu.de! 1 Noise filtering (1/2)! We have
Topic 6. The Digital Fourier Transform. (Based, in part, on The Scientist and Engineer's Guide to Digital Signal Processing by Steven Smith)
") Topic 6 The Digital Fourier Transform (Based, in part, on The Scientist and Engineer's Guide to Digital Signal Processing by Steven Smith) 10 20 30 40 50 60 70 80 90 100 0-1 -0.8-0.6-0.4-0.2 0 0.2 0.4
Topic 6 The Digital Fourier Transform (Based, in part, on The Scientist and Engineer's Guide to Digital Signal Processing by Steven Smith) 10 20 30 40 50 60 70 80 90 100 0-1 -0.8-0.6-0.4-0.2 0 0.2 0.4
Chapter 3 Data Transmission COSC 3213 Summer 2003
 Chapter 3 Data Transmission COSC 3213 Summer 2003 Courtesy of Prof. Amir Asif Definitions 1. Recall that the lowest layer in OSI is the physical layer. The physical layer deals with the transfer of raw
DISCRETE FOURIER TRANSFORM AND FILTER DESIGN
 DISCRETE FOURIER TRANSFORM AND FILTER DESIGN N. C. State University CSC557 Multimedia Computing and Networking Fall 2001 Lecture # 03 Spectrum of a Square Wave 2 Results of Some Filters 3 Notation 4 x[n]
Practical issue: Group definition. TSTE17 System Design, CDIO. Quadrature Amplitude Modulation (QAM) Components of a digital communication system
 Components of a digital communication system") 1 2 TSTE17 System Design, CDIO Introduction telecommunication OFDM principle How to combat ISI How to reduce out of band signaling Practical issue: Group definition Project group sign up list will be put
1 2 TSTE17 System Design, CDIO Introduction telecommunication OFDM principle How to combat ISI How to reduce out of band signaling Practical issue: Group definition Project group sign up list will be put
Data Acquisition Systems. Signal DAQ System The Answer?
 Outline Analysis of Waveforms and Transforms How many Samples to Take Aliasing Negative Spectrum Frequency Resolution Synchronizing Sampling Non-repetitive Waveforms Picket Fencing A Sampled Data System
Lecture notes on Waves/Spectra Noise, Correlations and.
 Lecture notes on Waves/Spectra Noise, Correlations and. W. Gekelman Lecture 4, February 28, 2004 Our digital data is a function of time x(t) and can be represented as: () = a + ( a n t+ b n t) x t cos
6.02 Practice Problems: Modulation & Demodulation
 1 of 12 6.02 Practice Problems: Modulation & Demodulation Problem 1. Here's our "standard" modulation-demodulation system diagram: at the transmitter, signal x[n] is modulated by signal mod[n] and the
Basic 2-channel EEG Training Protocols
 Basic 2-channel EEG Training Protocols Approaches, Methods, and Functional Block Diagrams T. F. Collura, Ph.D., P.E. 2004-2007 Rationale for 2-channel training Address L & R Brain, A & P Brain, or Whole
Emotiv EPOC 3D Brain Activity Map Premium Version User Manual V1.0
 Emotiv EPOC 3D Brain Activity Map Premium Version User Manual V1.0 TABLE OF CONTENTS 1. Introduction... 3 2. Getting started... 3 2.1 Hardware Requirements... 3 Figure 1 Emotiv EPOC Setup... 3 2.2 Installation...
ECEn 487 Digital Signal Processing Laboratory. Lab 3 FFT-based Spectrum Analyzer
 ECEn 487 Digital Signal Processing Laboratory Lab 3 FFT-based Spectrum Analyzer Due Dates This is a three week lab. All TA check off must be completed by Friday, March 14, at 3 PM or the lab will be marked
Fourier and Wavelets
 Fourier and Wavelets Why do we need a Transform? Fourier Transform and the short term Fourier (STFT) Heisenberg Uncertainty Principle The continues Wavelet Transform Discrete Wavelet Transform Wavelets
Discrete Fourier Transform, DFT Input: N time samples
 EE445M/EE38L.6 Lecture. Lecture objectives are to: The Discrete Fourier Transform Windowing Use DFT to design a FIR digital filter Discrete Fourier Transform, DFT Input: time samples {a n = {a,a,a 2,,a
Differential Signal and Common Mode Signal in Time Domain
 Differential Signal and Common Mode Signal in Time Domain Most of multi-gbps IO technologies use differential signaling, and their typical signal path impedance is ohm differential. Two 5ohm cables, however,
2015 HBM ncode Products User Group Meeting
 Looking at Measured Data in the Frequency Domain Kurt Munson HBM-nCode Do Engineers Need Tools? 3 What is Vibration? http://dictionary.reference.com/browse/vibration 4 Some Statistics Amplitude PDF y Measure
Neurophysiology. The action potential. Why should we care? AP is the elemental until of nervous system communication
 Neurophysiology Why should we care? AP is the elemental until of nervous system communication The action potential Time course, propagation velocity, and patterns all constrain hypotheses on how the brain
21/01/2014. Fundamentals of the analysis of neuronal oscillations. Separating sources
 21/1/214 Separating sources Fundamentals of the analysis of neuronal oscillations Robert Oostenveld Donders Institute for Brain, Cognition and Behaviour Radboud University Nijmegen, The Netherlands Use
Design of FIR Filters
 Design of FIR Filters Elena Punskaya www-sigproc.eng.cam.ac.uk/~op205 Some material adapted from courses by Prof. Simon Godsill, Dr. Arnaud Doucet, Dr. Malcolm Macleod and Prof. Peter Rayner 1 FIR as a
Wireless Communication Systems Laboratory Lab#1: An introduction to basic digital baseband communication through MATLAB simulation Objective
 Wireless Communication Systems Laboratory Lab#1: An introduction to basic digital baseband communication through MATLAB simulation Objective The objective is to teach students a basic digital communication
EE 215 Semester Project SPECTRAL ANALYSIS USING FOURIER TRANSFORM
 EE 215 Semester Project SPECTRAL ANALYSIS USING FOURIER TRANSFORM Department of Electrical and Computer Engineering Missouri University of Science and Technology Page 1 Table of Contents Introduction...Page
Lab 3 FFT based Spectrum Analyzer
 ECEn 487 Digital Signal Processing Laboratory Lab 3 FFT based Spectrum Analyzer Due Dates This is a three week lab. All TA check off must be completed prior to the beginning of class on the lab book submission
The Periodogram. Use identity sin(θ) = (e iθ e iθ )/(2i) and formulas for geometric sums to compute mean.
 = (e iθ e iθ )/(2i) and formulas for geometric sums to compute mean.") The Periodogram Sample covariance between X and sin(2πωt + φ) is 1 T T 1 X t sin(2πωt + φ) X 1 T T 1 sin(2πωt + φ) Use identity sin(θ) = (e iθ e iθ )/(2i) and formulas for geometric sums to compute mean.
The Periodogram Sample covariance between X and sin(2πωt + φ) is 1 T T 1 X t sin(2πωt + φ) X 1 T T 1 sin(2πωt + φ) Use identity sin(θ) = (e iθ e iθ )/(2i) and formulas for geometric sums to compute mean.
DFT: Discrete Fourier Transform & Linear Signal Processing
 DFT: Discrete Fourier Transform & Linear Signal Processing 2 nd Year Electronics Lab IMPERIAL COLLEGE LONDON Table of Contents Equipment... 2 Aims... 2 Objectives... 2 Recommended Textbooks... 3 Recommended
DCSP-3: Minimal Length Coding. Jianfeng Feng
 DCSP-3: Minimal Length Coding Jianfeng Feng Department of Computer Science Warwick Univ., UK Jianfeng.feng@warwick.ac.uk http://www.dcs.warwick.ac.uk/~feng/dcsp.html Automatic Image Caption (better than
DSP First. Laboratory Exercise #11. Extracting Frequencies of Musical Tones
 DSP First Laboratory Exercise #11 Extracting Frequencies of Musical Tones This lab is built around a single project that involves the implementation of a system for automatically writing a musical score
Spectrum Analysis: The FFT Display
 Spectrum Analysis: The FFT Display Equipment: Capstone, voltage sensor 1 Introduction It is often useful to represent a function by a series expansion, such as a Taylor series. There are other series representations
SINUSOIDAL MODELING. EE6641 Analysis and Synthesis of Audio Signals. Yi-Wen Liu Nov 3, 2015
 1 SINUSOIDAL MODELING EE6641 Analysis and Synthesis of Audio Signals Yi-Wen Liu Nov 3, 2015 2 Last time: Spectral Estimation Resolution Scenario: multiple peaks in the spectrum Choice of window type and
Experiment 1 Introduction to MATLAB and Simulink
 Experiment 1 Introduction to MATLAB and Simulink INTRODUCTION MATLAB s Simulink is a powerful modeling tool capable of simulating complex digital communications systems under realistic conditions. It includes
Laboratory Assignment 4. Fourier Sound Synthesis
 Laboratory Assignment 4 Fourier Sound Synthesis PURPOSE This lab investigates how to use a computer to evaluate the Fourier series for periodic signals and to synthesize audio signals from Fourier series
Frequency Domain Analysis
 1 Frequency Domain Analysis Concerned with analysing the frequency (wavelength) content of a process Application example: Electromagnetic Radiation: Represented by a Frequency Spectrum: plot of intensity
Removal of Line Noise Component from EEG Signal
 1 Removal of Line Noise Component from EEG Signal Removal of Line Noise Component from EEG Signal When carrying out time-frequency analysis, if one is interested in analysing frequencies above 30Hz (i.e.
The Fundamentals of FFT-Based Signal Analysis and Measurement Michael Cerna and Audrey F. Harvey
 Application ote 041 The Fundamentals of FFT-Based Signal Analysis and Measurement Michael Cerna and Audrey F. Harvey Introduction The Fast Fourier Transform (FFT) and the power spectrum are powerful tools
Introduction to Wavelet Transform. Chapter 7 Instructor: Hossein Pourghassem
 Introduction to Wavelet Transform Chapter 7 Instructor: Hossein Pourghassem Introduction Most of the signals in practice, are TIME-DOMAIN signals in their raw format. It means that measured signal is a
JOURNAL OF OBJECT TECHNOLOGY
 JOURNAL OF OBJECT TECHNOLOGY Online at http://www.jot.fm. Published by ETH Zurich, Chair of Software Engineering JOT, 2009 Vol. 9, No. 1, January-February 2010 The Discrete Fourier Transform, Part 5: Spectrogram
Reading: Johnson Ch , Ch.5.5 (today); Liljencrants & Lindblom; Stevens (Tues) reminder: no class on Thursday.
; Liljencrants & Lindblom; Stevens (Tues) reminder: no class on Thursday.") L105/205 Phonetics Scarborough Handout 7 10/18/05 Reading: Johnson Ch.2.3.3-2.3.6, Ch.5.5 (today); Liljencrants & Lindblom; Stevens (Tues) reminder: no class on Thursday Spectral Analysis 1. There are
L105/205 Phonetics Scarborough Handout 7 10/18/05 Reading: Johnson Ch.2.3.3-2.3.6, Ch.5.5 (today); Liljencrants & Lindblom; Stevens (Tues) reminder: no class on Thursday Spectral Analysis 1. There are
FFT Analyzer. Gianfranco Miele, Ph.D
 FFT Analyzer Gianfranco Miele, Ph.D www.eng.docente.unicas.it/gianfranco_miele g.miele@unicas.it Introduction It is a measurement instrument that evaluates the spectrum of a time domain signal applying
ECEGR Lab #8: Introduction to Simulink
 Page 1 ECEGR 317 - Lab #8: Introduction to Simulink Objective: By: Joe McMichael This lab is an introduction to Simulink. The student will become familiar with the Help menu, go through a short example,
6 Sampling. Sampling. The principles of sampling, especially the benefits of coherent sampling
 Note: Printed Manuals 6 are not in Color Objectives This chapter explains the following: The principles of sampling, especially the benefits of coherent sampling How to apply sampling principles in a test
ESE 150 Lab 04: The Discrete Fourier Transform (DFT)
") LAB 04 In this lab we will do the following: 1. Use Matlab to perform the Fourier Transform on sampled data in the time domain, converting it to the frequency domain 2. Add two sinewaves together of differing
LAB 04 In this lab we will do the following: 1. Use Matlab to perform the Fourier Transform on sampled data in the time domain, converting it to the frequency domain 2. Add two sinewaves together of differing
CS 591 S1 Midterm Exam Solution
 Name: CS 591 S1 Midterm Exam Solution Spring 2016 You must complete 3 of problems 1 4, and then problem 5 is mandatory. Each problem is worth 25 points. Please leave blank, or draw an X through, or write
FFT 1 /n octave analysis wavelet
 06/16 For most acoustic examinations, a simple sound level analysis is insufficient, as not only the overall sound pressure level, but also the frequency-dependent distribution of the level has a significant
ME scope Application Note 01 The FFT, Leakage, and Windowing
 INTRODUCTION ME scope Application Note 01 The FFT, Leakage, and Windowing NOTE: The steps in this Application Note can be duplicated using any Package that includes the VES-3600 Advanced Signal Processing
Basic Signals and Systems
 Chapter 2 Basic Signals and Systems A large part of this chapter is taken from: C.S. Burrus, J.H. McClellan, A.V. Oppenheim, T.W. Parks, R.W. Schafer, and H. W. Schüssler: Computer-based exercises for
System Identification & Parameter Estimation
 System Identification & Parameter Estimation Wb2301: SIPE lecture 4 Perturbation signal design Alfred C. Schouten, Dept. of Biomechanical Engineering (BMechE), Fac. 3mE 3/9/2010 Delft University of Technology
MASSACHUSETTS INSTITUTE OF TECHNOLOGY /6.071 Introduction to Electronics, Signals and Measurement Spring 2006
 MASSACHUSETTS INSTITUTE OF TECHNOLOGY.071/6.071 Introduction to Electronics, Signals and Measurement Spring 006 Lab. Introduction to signals. Goals for this Lab: Further explore the lab hardware. The oscilloscope
Frequency Division Multiplexing Spring 2011 Lecture #14. Sinusoids and LTI Systems. Periodic Sequences. x[n] = x[n + N]
![Frequency Division Multiplexing Spring 2011 Lecture #14. Sinusoids and LTI Systems. Periodic Sequences. x[n] = x[n + N]](/thumbs/88/116022205.jpg "Frequency Division Multiplexing Spring 2011 Lecture #14. Sinusoids and LTI Systems. Periodic Sequences. x[n] = x[n + N]") Frequency Division Multiplexing 6.02 Spring 20 Lecture #4 complex exponentials discrete-time Fourier series spectral coefficients band-limited signals To engineer the sharing of a channel through frequency
Frequency Division Multiplexing 6.02 Spring 20 Lecture #4 complex exponentials discrete-time Fourier series spectral coefficients band-limited signals To engineer the sharing of a channel through frequency
1. In the command window, type "help conv" and press [enter]. Read the information displayed.
![1. In the command window, type help conv and press [enter]. Read the information displayed.](/thumbs/82/86785923.jpg "1. In the command window, type help conv and press [enter]. Read the information displayed.") ECE 317 Experiment 0 The purpose of this experiment is to understand how to represent signals in MATLAB, perform the convolution of signals, and study some simple LTI systems. Please answer all questions
ECE 317 Experiment 0 The purpose of this experiment is to understand how to represent signals in MATLAB, perform the convolution of signals, and study some simple LTI systems. Please answer all questions
X Space X Time X Condition
 Uri Lifshin X Space X Time X Condition Adopted from Jirsa & Müller, 2013 From: McCraty, 2003 Apriori CFC Specify both frequency bands (power and phase) Mixed Apriori Exploratory CFC Specify one frequency
Problem Set 1 (Solutions are due Mon )
") ECEN 242 Wireless Electronics for Communication Spring 212 1-23-12 P. Mathys Problem Set 1 (Solutions are due Mon. 1-3-12) 1 Introduction The goals of this problem set are to use Matlab to generate and
ECEN 242 Wireless Electronics for Communication Spring 212 1-23-12 P. Mathys Problem Set 1 (Solutions are due Mon. 1-3-12) 1 Introduction The goals of this problem set are to use Matlab to generate and
G(f ) = g(t) dt. e i2πft. = cos(2πf t) + i sin(2πf t)
 = g(t) dt. e i2πft. = cos(2πf t) + i sin(2πf t)") Fourier Transforms Fourier s idea that periodic functions can be represented by an infinite series of sines and cosines with discrete frequencies which are integer multiples of a fundamental frequency
Fourier Transforms Fourier s idea that periodic functions can be represented by an infinite series of sines and cosines with discrete frequencies which are integer multiples of a fundamental frequency
Digital Video and Audio Processing. Winter term 2002/ 2003 Computer-based exercises
 Digital Video and Audio Processing Winter term 2002/ 2003 Computer-based exercises Rudolf Mester Institut für Angewandte Physik Johann Wolfgang Goethe-Universität Frankfurt am Main 6th November 2002 Chapter
PYKC 13 Feb 2017 EA2.3 Electronics 2 Lecture 8-1
 In this lecture, I will cover amplitude and phase responses of a system in some details. What I will attempt to do is to explain how would one be able to obtain the frequency response from the transfer
Short Time Fourier Transform *
 OpenStax-CNX module: m10570 1 Short Time Fourier Transform * Ivan Selesnick This work is produced by OpenStax-CNX and licensed under the Creative Commons Attribution License 1.0 1 Short Time Fourier Transform
ESE 150 Lab 04: The Discrete Fourier Transform (DFT)
") LAB 04 In this lab we will do the following: 1. Use Matlab to perform the Fourier Transform on sampled data in the time domain, converting it to the frequency domain 2. Add two sinewaves together of differing
LAB 04 In this lab we will do the following: 1. Use Matlab to perform the Fourier Transform on sampled data in the time domain, converting it to the frequency domain 2. Add two sinewaves together of differing
Lab 1B LabVIEW Filter Signal
 Lab 1B LabVIEW Filter Signal Due Thursday, September 12, 2013 Submit Responses to Questions (Hardcopy) Equipment: LabVIEW Setup: Open LabVIEW Skills learned: Create a low- pass filter using LabVIEW and
THE CITADEL THE MILITARY COLLEGE OF SOUTH CAROLINA. Department of Electrical and Computer Engineering. ELEC 423 Digital Signal Processing
 THE CITADEL THE MILITARY COLLEGE OF SOUTH CAROLINA Department of Electrical and Computer Engineering ELEC 423 Digital Signal Processing Project 2 Due date: November 12 th, 2013 I) Introduction In ELEC
OFDM TX Shaping for 802.3bn Leo Montreuil
 OFDM TX Shaping for 802.3bn Leo Montreuil Jan 2013 Recommendations TX window is specified as N t samples in taper region No need for different set of Alpha for 4K and 8K FFT. Avoid confusion for calculation
Machine Learning for Signal Processing. Sounds. Class Sep Instructor: Bhiksha Raj. 13 Sep /
 -755 Machine earning for Signal Processing Representing Images and Sounds Class 5 3 Sep 20 Instructor: Bhiksha Raj Administrivia Basics of probability: ill not be covered Very nice lecture by Aarthi Singh
PART II Practical problems in the spectral analysis of speech signals
 PART II Practical problems in the spectral analysis of speech signals We have now seen how the Fourier analysis recovers the amplitude and phase of an input signal consisting of a superposition of multiple
Introduction to Computational Neuroscience
 Introduction to Computational Neuroscience Lecture 4: Data analysis I Lesson Title 1 Introduction 2 Structure and Function of the NS 3 Windows to the Brain 4 Data analysis 5 Data analysis II 6 Single neuron
The Discrete Fourier Transform. Claudia Feregrino-Uribe, Alicia Morales-Reyes Original material: Dr. René Cumplido
 The Discrete Fourier Transform Claudia Feregrino-Uribe, Alicia Morales-Reyes Original material: Dr. René Cumplido CCC-INAOE Autumn 2015 The Discrete Fourier Transform Fourier analysis is a family of mathematical
Principles of Communications ECS 332
 Principles of Communications ECS 332 Asst. Prof. Dr. Prapun Suksompong prapun@siit.tu.ac.th 5. Angle Modulation Office Hours: BKD, 6th floor of Sirindhralai building Wednesday 4:3-5:3 Friday 4:3-5:3 Example
THE HONG KONG POLYTECHNIC UNIVERSITY Department of Electronic and Information Engineering. EIE2106 Signal and System Analysis Lab 2 Fourier series
 THE HONG KONG POLYTECHNIC UNIVERSITY Department of Electronic and Information Engineering EIE2106 Signal and System Analysis Lab 2 Fourier series 1. Objective The goal of this laboratory exercise is to
Trigonometric functions and sound
 Trigonometric functions and sound The sounds we hear are caused by vibrations that send pressure waves through the air. Our ears respond to these pressure waves and signal the brain about their amplitude
Acoustics, signals & systems for audiology. Week 4. Signals through Systems
 Acoustics, signals & systems for audiology Week 4 Signals through Systems Crucial ideas Any signal can be constructed as a sum of sine waves In a linear time-invariant (LTI) system, the response to a sinusoid
Digital Signal Processing +
 Digital Signal Processing + Nikil Dutt UC Irvine ICS 212 Winter 2005 + Material adapted from Tony Givargis & Rajesh Gupta Templates from Prabhat Mishra ICS212 WQ05 (Dutt) DSP 1 Introduction Any interesting
Computing TIE Crest Factors for Telecom Applications
 TECHNICAL NOTE Computing TIE Crest Factors for Telecom Applications A discussion on computing crest factors to estimate the contribution of random jitter to total jitter in a specified time interval. by
Use Matlab Function pwelch to Find Power Spectral Density or Do It Yourself
 Use Matlab Function pwelch to Find Power Spectral Density or Do It Yourself In my last post, we saw that finding the spectrum of a signal requires several steps beyond computing the discrete Fourier transform
ELT COMMUNICATION THEORY
 ELT 41307 COMMUNICATION THEORY Matlab Exercise #1 Sampling, Fourier transform, Spectral illustrations, and Linear filtering 1 SAMPLING The modeled signals and systems in this course are mostly analog (continuous
Communication Engineering Prof. Surendra Prasad Department of Electrical Engineering Indian Institute of Technology, Delhi
 Communication Engineering Prof. Surendra Prasad Department of Electrical Engineering Indian Institute of Technology, Delhi Lecture - 23 The Phase Locked Loop (Contd.) We will now continue our discussion
ENGINEERING FOR RURAL DEVELOPMENT Jelgava, EDUCATION METHODS OF ANALOGUE TO DIGITAL CONVERTERS TESTING AT FE CULS
 EDUCATION METHODS OF ANALOGUE TO DIGITAL CONVERTERS TESTING AT FE CULS Jakub Svatos, Milan Kriz Czech University of Life Sciences Prague jsvatos@tf.czu.cz, krizm@tf.czu.cz Abstract. Education methods for
Biometric: EEG brainwaves
 Biometric: EEG brainwaves Jeovane Honório Alves 1 1 Department of Computer Science Federal University of Parana Curitiba December 5, 2016 Jeovane Honório Alves (UFPR) Biometric: EEG brainwaves Curitiba
PSYC696B: Analyzing Neural Time-series Data
 PSYC696B: Analyzing Neural Time-series Data Spring, 2014 Tuesdays, 4:00-6:45 p.m. Room 338 Shantz Building Course Resources Online: jallen.faculty.arizona.edu Follow link to Courses Available from: Amazon:
Signal Processing First Lab 20: Extracting Frequencies of Musical Tones
 Signal Processing First Lab 20: Extracting Frequencies of Musical Tones Pre-Lab and Warm-Up: You should read at least the Pre-Lab and Warm-up sections of this lab assignment and go over all exercises in
CHAPTER. delta-sigma modulators 1.0
 CHAPTER 1 CHAPTER Conventional delta-sigma modulators 1.0 This Chapter presents the traditional first- and second-order DSM. The main sources for non-ideal operation are described together with some commonly
Lecture 3 Complex Exponential Signals
 Lecture 3 Complex Exponential Signals Fundamentals of Digital Signal Processing Spring, 2012 Wei-Ta Chu 2012/3/1 1 Review of Complex Numbers Using Euler s famous formula for the complex exponential The
Representing Images and Sounds
 11-755 Machine Learning for Signal Processing Representing Images and Sounds Class 4. 2 Sep 2010 Instructor: Bhiksha Raj 2 Sep 2010 1 Administrivia Homework up Basics of probability: Will not be covered
Rhythmic Similarity -- a quick paper review. Presented by: Shi Yong March 15, 2007 Music Technology, McGill University
 Rhythmic Similarity -- a quick paper review Presented by: Shi Yong March 15, 2007 Music Technology, McGill University Contents Introduction Three examples J. Foote 2001, 2002 J. Paulus 2002 S. Dixon 2004