DCSP-10: DFT and PSD. Jianfeng Feng. Department of Computer Science Warwick Univ., UK
|
|
|
- Thomas Bridges
- 5 years ago
- Views:
Transcription
1 DCSP-10: DFT and PSD Jianfeng Feng Department of Computer Science Warwick Univ., UK
2 DFT Definition: The discrete Fourier transform (DFT) and its own inverse DFT (IDFT) associated with a vector X = ( X[0], X[1],, X[N-1] ) to a vector x = ( x[0], x[1],, x[n-1] ) of N data points, is given by ) N 1 " X[k] = DFT{x[n]} = x[n]exp$ j 2πk # N n % + ' & n=0 + * + x[n] = IDFT{X[k]} = 1 N 1 + " X[k]exp$ j 2πk N # N n % ', + & k=0
3 Example Let (x[0], x[1], x[2], x[3]) = ( ) be a data vector of length N=4. Work out its DFT (X[0], X[1], X[2], X[3]) X[k] = 3 n=0 x[n]exp( j 2πk N n) X[0] = =1 X[1] = 3 n=0 x[n]exp( j 2π1 4 n) = exp( j 2π1 4 =1+ 2exp( j π 2 ) exp( j π 2 2) exp( j π 2 3) 0)+ 2exp( j 2π1 4 2π1 1) 1exp( j 4 2) 12exp( j 2π1 4 3) =1+ 2exp( j π 2 ) [exp( j π 2 )]2 [exp( j π 2 )]3 =1+ 2( j) ( j) 2 ( j) 3 =1 2 j +1 j = 2 3j X[2] = 3 n=0 x[n]exp( j 2π 2 4 n) =1+ 2( j)2 (( j) 2 ) 2 (( j) 3 ) 2 = = 1 X[3] = 3 n=0 x[n]exp( j 2π 3 4 n) =1+ 2( j)3 (( j) 2 ) 3 (( j) 3 ) 3 =1+ 2 j +1+ j = 2 + 3j
4 Example x [n] X [ k ] 2+3j α -α 2-3j [ ] Time domain [ j j ] Complex plane
5 Example x [n] X [ k ] 2+3j α -α 2-3j Time domain Complex plane
6 Example Complex plane (polar coordinate) x [n] Amplitude 13 1 phase α -α Time domain Frequency domain
7 Matlab demo x=[ ]; X=fft(x) X = i i i i ifft(x) ans =
![Recap FT [ integral (x*exp) ] Discretion DTFT [ sum](/docs-images/83/88027821/images/8-1.jpg "(x*exp) ] Truncation DFT [multiplication of two")
8 Recap FT [ integral (x*exp) ] Discretion DTFT [ sum (x*exp) ] Truncation DFT [multiplication of two matrices]
9 FFT: Fast Fourier Transform DFT is the basis of a number of applications. One of the most important tools in digital signal processing. The problem is that a brute-force implementation would hardly be feasible in real time (even for a data set of modest length).
10 FFT: Fast Fourier Transform DFT can be computed in a very efficient way, exploiting the very structure of the algorithm. For a data set of length N, the complexity of the FFT grows as N log N DFT computed by brute force grow as N 2. FFT is widely used in many applications.

11 Applications cover some today and more next week Essentially, the remain of the module is its application Frequency eye
12 I. DFT for spectral estimation One of the uses is to estimate the frequency spectrum of a signal. The Fourier transform produces a spectrum from which the original function can be reconstructed by an inverse transform. In order to do that, it preserves not only the magnitude of each frequency component, but also its phase. represented as a 2-dimensional vector or a complex number, or as magnitude and phase (polar coordinates). In graphical representations, often only the magnitude (or squared magnitude) component is shown. Referred to as a power spectrum Density (PSD)
13 Frequency domain (amplitude only) Locating tones close all N=10; %sampling rate N Hz T=10; % time d1=1; % first period d2=3 % second period for i=1:t*n t(i)=i/n; x(i)=cos(d1*2*pi*i/n)+cos(d2*2*pi*i/n); end figure(1) plot(t,x) figure(2) plot(t*n/(t),abs(fft(x))) xlim([0 N/2]); xlabel('hz') Time domain (sec) Fig. 1
14 Understanding the plot Sampling rate is F s, the largest (fastest) frequency from the data is then F s /2 Remembering that our frequency domain is in [0 2π] which matches to [0 F s ] Divide [0 F s ] into N intervals and plot abs X(K) against K which gives power against F s Since it is symmetric, we sometime only plot out [0, F s/ /2] Here F s =1 0 Hz
15 Mysterious sound Fig. 2 clear all close all sampling_rate=100;%hz omega=30; %signal frequecy Hz N=20000; %total number of samples for i=1:n x_sound(i)=cos(2*pi*omega*i/sampling_rate); %sign x(i)=x_sound(i)+2*randn(1,1); %signal+noise axis(i)=sampling_rate*i/n; % for psd time(i)=i/sampling_rate; % for time trace end subplot(1,2,1) plot(time,x); %signal + noise, time trace xlabel('second') ylabel('x') subplot(1,2,2) plot(axis,abs(fft(x)),'r'); % magnitude of signal xlabel('hz'); ylabel('amplitude') sound(x_sound) Simple Matlab program is left on slides

16 Issues on Signals Use this signal {x[0],, x[n-1]} FFT

![signal {x[0],, x[n-1]}](/docs-images/83/88027821/images/17-6.jpg "{x[0],, x[2n-1]} FFT")
17 Issues on Signals Use this signal Use this signal {x[0],, x[n-1]} {x[0],, x[2n-1]} FFT FFT

![signal FFT {x[0],,](/docs-images/83/88027821/images/18-6.jpg "x[8n-1]} FFT {x[0],,")
18 Issues on Signals Use this signal Use this signal FFT {x[0],, x[8n-1]} FFT {x[0],, x[3n-1]}
19 Issues on Signals Use this signal Use this signal FFT With the increased signal length The power increases We can locate the signal more precisely FFT

")
")
20 Issues on noise Two sets of random noise (100 points each, upper panel) Power Spectrum (bottom panel) Make sense?
21 Issues on noise When N is large abs (DFT ( {x[n], n=0,, N-1} ) ) à DFT ( {γ [n] } ) where γ [n] is the auto-correlation function (ACF) Remember that the ACF of white noise is X[k] = δ[n]exp( 2πk N 2πk jn) = exp( N j0) =1
22 Issues on noise When N is large abs (DFT ( {x[n], n=0,, N-1} ) ) à DFT ( {γ [n] } ) where γ [n] is the auto-correlation function (ACF) Remember that the ACF of white noise is X[k] = δ[n]exp( 2πk N 2πk jn) = exp( N j0) =1 Powers are equally distributed at each frequency Hence the name of white noise Colour noise: not equally distributed (ACF is not delta)
![Issues on noise light goes a through a prism White lightwhite passes prism Remember that the ACF of white noise is X[k] = δ[n]exp( 2π k 2π k jn) =](/docs-images/83/88027821/images/23-3.jpg "exp( j0) =1 N N Powers are equally distributed at each frequency Hence the name of white noise Colour noise: not equally distributed (ACF is not")
23 Issues on noise light goes a through a prism White lightwhite passes prism Remember that the ACF of white noise is X[k] = δ[n]exp( 2π k 2π k jn) = exp( j0) =1 N N Powers are equally distributed at each frequency Hence the name of white noise Colour noise: not equally distributed (ACF is not delta)
24 Coming back to Mysterious sound clear all close all sampling_rate=100;%hz omega=30; %signal frequecy Hz N=20000; %total number of samples for i=1:n x_sound(i)=cos(2*pi*omega*i/sampling_rate); %signal x(i)=x_sound(i)+2*randn(1,1); %signal+noise axis(i)=sampling_rate*i/n; % for psd time(i)=i/sampling_rate; % for time trace end subplot(1,2,1) plot(time,x); %signal + noise, time trace xlabel('second') ylabel('x') Fig. 2 subplot(1,2,2) plot(axis,abs(fft(x)),'r'); % magnitude of signal xlabel('hz'); ylabel('amplitude') sound(x_sound) noise
=x_sound(i)+2*randn(1,1); %signal+noise axis(i)=sampling_rate*i/n; % for psd time(i)=i/sampling_rate; % for time trace end subplot(1,2,1) plot(time,x); %signal + noise, time trace")
25 Coming back to Mysterious sound clear all close all sampling_rate=100;%hz omega=30; %signal frequecy Hz N=20000; %total number of samples for i=1:n x_sound(i)=cos(2*pi*omega*i/sampling_rate); %signal x(i)=x_sound(i)+2*randn(1,1); %signal+noise axis(i)=sampling_rate*i/n; % for psd time(i)=i/sampling_rate; % for time trace end subplot(1,2,1) plot(time,x); %signal + noise, time trace xlabel('second') ylabel('x') Fig. 2 subplot(1,2,2) plot(axis,abs(fft(x)),'r'); % magnitude of signal xlabel('hz'); ylabel('amplitude') sound(x_sound) signal noise
26 Matlab A few words on Matlab periodogram pwelch Fs = 1000; t = 0:1/Fs:.3; % Fs is the sampling rate x = cos(2*pi*t*200)+randn(size(t)); % A cosine of 200Hz plus noise periodogram(x,[],'twosided',512,fs); % The default window is used Fs = 1000; t = 0:1/Fs:.296; %Fs is the sampling rate x = cos(2*pi*t*200)+randn(size(t)); % A cosine of 200Hz plus noise pwelch(x,[],[],[],fs,'twosided'); % Uses default window, overlap & NFFT. It is essentially fft It is slightly advanced
27 Matlab A few words on Matlab periodogram pwelch Fs = 1000; t = 0:1/Fs:.3; % Fs is the sampling rate x = cos(2*pi*t*200)+randn(size(t)); % A cosine of 200Hz plus noise periodogram(x,[],'twosided',512,fs); % The default window is used Fs = 1000; t = 0:1/Fs:.296; %Fs is the sampling rate x = cos(2*pi*t*200)+randn(size(t)); % A cosine of 200Hz plus noise pwelch(x,[],[],[],fs,'twosided'); % Uses default window, overlap & NFFT. Abs(fft(x)) It is essentially fft It is slightly advanced
28 Matlab A few words on Matlab periodogram Fs = 1000; t = 0:1/Fs:.3; % Fs is the sampling rate x = cos(2*pi*t*200)+randn(size(t)); % A cosine of 200Hz plus noise periodogram(x,[],'twosided',512,fs); % The default window is used pwelch Fs = 1000; t = 0:1/Fs:.296; %Fs is the sampling rate x = cos(2*pi*t*200)+randn(size(t)); % A cosine of 200Hz plus noise pwelch(x,[],[],[],fs,'twosided'); % Uses default window, overlap & NFFT. Abs(fft(x)) In Welch, essentially the signals are divided into many segments For each segments, an FFT is carried The summation of FFT is plotted and hence the noise is averaged out It is essentially fft It is slightly advanced
29 Spectrogram In real life examples, all signals change with time (music for example)
30 Spectrogram In real life example, all signals change with time (music for example) Using sliding window to sample signals and calculate PSD
 Using sliding window to sample signals and calculate PSD")
31 Spectrogram In real life example, all signals change with time (music for example) Using sliding window to sample signals and calculate PSD
32 Spectrogram In real life example, all signals change with time (music for example) Using sliding windows to sample signals and calculate PSD
33 Spectrogram It is called STFT (short time Fourier transform) The obtained results are plotted using colour map as in the next figure: spectrogram


34 Spectrogram F r e q u e n c y 3 Hz 1 Hz Time (sec)
; % Start @ 100Hz, cross 200Hz at")
; sound(y) y=chirp(t,100,1,200,'q'); % Start @")
35 Example I t=0:0.001:2; % 2 1kHz sample rate y=chirp(t,100,1,200,'q'); % 100Hz, cross 200Hz at t=1sec spectrogram(y, 128,120,128,1E3); % Display the spectrogram title('quadratic Chirp: start at 100Hz and cross 200Hz at t=1sec'); sound(y) y=chirp(t,100,1,200,'q'); % Fs=5000; filename = 'h.wav'; audiowrite(filename,y,fs); F r e q u e n c y Time (sec)
; % Start @ 100Hz, cross 200Hz at t=1sec spectrogram(y,128,120,128,1e3); % Display the spectrogram")
36 Example II t=0:0.001:20; % 2 1kHz sample rate y=chirp(t,100,1,200,'q'); % 100Hz, cross 200Hz at t=1sec spectrogram(y,128,120,128,1e3); % Display the spectrogram title('quadratic Chirp: start at 100Hz and cross 200Hz at t=1sec'); Fs=6000; filename='h.wav'; audiowrite(filename,y,fs); F r e q u e n c y ); sound(y) Time (sec)

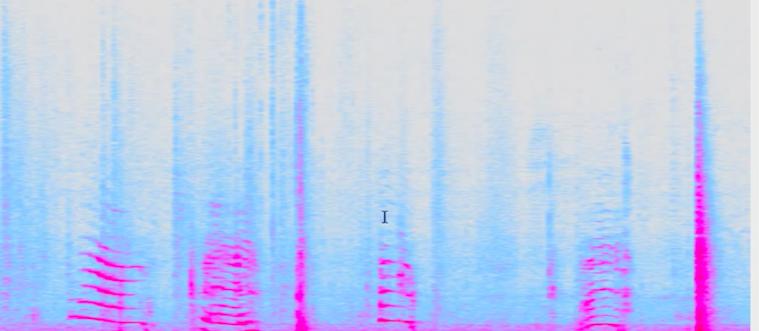
37 Spectrogram: real life example
38 Summary DFT Power Spectrum Density Spectrogram


39 Next week Image processing + sampling theorem Filter
Biomedical Signals. Signals and Images in Medicine Dr Nabeel Anwar
 Biomedical Signals Signals and Images in Medicine Dr Nabeel Anwar Noise Removal: Time Domain Techniques 1. Synchronized Averaging (covered in lecture 1) 2. Moving Average Filters (today s topic) 3. Derivative
Discrete Fourier Transform (DFT)
") Amplitude Amplitude Discrete Fourier Transform (DFT) DFT transforms the time domain signal samples to the frequency domain components. DFT Signal Spectrum Time Frequency DFT is often used to do frequency
Amplitude Amplitude Discrete Fourier Transform (DFT) DFT transforms the time domain signal samples to the frequency domain components. DFT Signal Spectrum Time Frequency DFT is often used to do frequency
EE 451: Digital Signal Processing
 EE 451: Digital Signal Processing Stochastic Processes and Spectral Estimation Aly El-Osery Electrical Engineering Department, New Mexico Tech Socorro, New Mexico, USA November 29, 2011 Aly El-Osery (NMT)
From Fourier Series to Analysis of Non-stationary Signals - VII
 From Fourier Series to Analysis of Non-stationary Signals - VII prof. Miroslav Vlcek November 23, 2010 Contents Short Time Fourier Transform 1 Short Time Fourier Transform 2 Contents Short Time Fourier
LABORATORY - FREQUENCY ANALYSIS OF DISCRETE-TIME SIGNALS
 LABORATORY - FREQUENCY ANALYSIS OF DISCRETE-TIME SIGNALS INTRODUCTION The objective of this lab is to explore many issues involved in sampling and reconstructing signals, including analysis of the frequency
EE 451: Digital Signal Processing
 EE 451: Digital Signal Processing Power Spectral Density Estimation Aly El-Osery Electrical Engineering Department, New Mexico Tech Socorro, New Mexico, USA December 4, 2017 Aly El-Osery (NMT) EE 451:
Fourier Methods of Spectral Estimation
 Department of Electrical Engineering IIT Madras Outline Definition of Power Spectrum Deterministic signal example Power Spectrum of a Random Process The Periodogram Estimator The Averaged Periodogram Blackman-Tukey
EE 464 Short-Time Fourier Transform Fall and Spectrogram. Many signals of importance have spectral content that
 EE 464 Short-Time Fourier Transform Fall 2018 Read Text, Chapter 4.9. and Spectrogram Many signals of importance have spectral content that changes with time. Let xx(nn), nn = 0, 1,, NN 1 1 be a discrete-time
URBANA-CHAMPAIGN. CS 498PS Audio Computing Lab. Audio DSP basics. Paris Smaragdis. paris.cs.illinois.
 UNIVERSITY ILLINOIS @ URBANA-CHAMPAIGN OF CS 498PS Audio Computing Lab Audio DSP basics Paris Smaragdis paris@illinois.edu paris.cs.illinois.edu Overview Basics of digital audio Signal representations
EE 215 Semester Project SPECTRAL ANALYSIS USING FOURIER TRANSFORM
 EE 215 Semester Project SPECTRAL ANALYSIS USING FOURIER TRANSFORM Department of Electrical and Computer Engineering Missouri University of Science and Technology Page 1 Table of Contents Introduction...Page
Digital Signal Processing PW1 Signals, Correlation functions and Spectra
 Digital Signal Processing PW1 Signals, Correlation functions and Spectra Nathalie Thomas Master SATCOM 018 019 1 Introduction The objectives of this rst practical work are the following ones : 1. to be
THE CITADEL THE MILITARY COLLEGE OF SOUTH CAROLINA. Department of Electrical and Computer Engineering. ELEC 423 Digital Signal Processing
 THE CITADEL THE MILITARY COLLEGE OF SOUTH CAROLINA Department of Electrical and Computer Engineering ELEC 423 Digital Signal Processing Project 2 Due date: November 12 th, 2013 I) Introduction In ELEC
Topic 2. Signal Processing Review. (Some slides are adapted from Bryan Pardo s course slides on Machine Perception of Music)
") Topic 2 Signal Processing Review (Some slides are adapted from Bryan Pardo s course slides on Machine Perception of Music) Recording Sound Mechanical Vibration Pressure Waves Motion->Voltage Transducer
Topic 2 Signal Processing Review (Some slides are adapted from Bryan Pardo s course slides on Machine Perception of Music) Recording Sound Mechanical Vibration Pressure Waves Motion->Voltage Transducer
Outline. Introduction to Biosignal Processing. Overview of Signals. Measurement Systems. -Filtering -Acquisition Systems (Quantisation and Sampling)
") Outline Overview of Signals Measurement Systems -Filtering -Acquisition Systems (Quantisation and Sampling) Digital Filtering Design Frequency Domain Characterisations - Fourier Analysis - Power Spectral
Outline Overview of Signals Measurement Systems -Filtering -Acquisition Systems (Quantisation and Sampling) Digital Filtering Design Frequency Domain Characterisations - Fourier Analysis - Power Spectral
Signal segmentation and waveform characterization. Biosignal processing, S Autumn 2012
 Signal segmentation and waveform characterization Biosignal processing, 5173S Autumn 01 Short-time analysis of signals Signal statistics may vary in time: nonstationary how to compute signal characterizations?
EE123 Digital Signal Processing
 EE123 Digital Signal Processing Lecture 5A Time-Frequency Tiling Subtleties in filtering/processing with DFT x[n] H(e j! ) y[n] System is implemented by overlap-and-save Filtering using DFT H[k] π 2π Subtleties
Frequency Domain Representation of Signals
 Frequency Domain Representation of Signals The Discrete Fourier Transform (DFT) of a sampled time domain waveform x n x 0, x 1,..., x 1 is a set of Fourier Coefficients whose samples are 1 n0 X k X0, X
Digital Signal Processing
 COMP ENG 4TL4: Digital Signal Processing Notes for Lecture #29 Wednesday, November 19, 2003 Correlation-based methods of spectral estimation: In the periodogram methods of spectral estimation, a direct
Digital Signal Processing Fourier Analysis of Continuous-Time Signals with the Discrete Fourier Transform
 Digital Signal Processing Fourier Analysis of Continuous-Time Signals with the Discrete Fourier Transform D. Richard Brown III D. Richard Brown III 1 / 11 Fourier Analysis of CT Signals with the DFT Scenario:
Time Series/Data Processing and Analysis (MATH 587/GEOP 505)
") Time Series/Data Processing and Analysis (MATH 587/GEOP 55) Rick Aster and Brian Borchers October 7, 28 Plotting Spectra Using the FFT Plotting the spectrum of a signal from its FFT is a very common activity.
Time Series/Data Processing and Analysis (MATH 587/GEOP 55) Rick Aster and Brian Borchers October 7, 28 Plotting Spectra Using the FFT Plotting the spectrum of a signal from its FFT is a very common activity.
Project 0: Part 2 A second hands-on lab on Speech Processing Frequency-domain processing
 Project : Part 2 A second hands-on lab on Speech Processing Frequency-domain processing February 24, 217 During this lab, you will have a first contact on frequency domain analysis of speech signals. You
Topic 6. The Digital Fourier Transform. (Based, in part, on The Scientist and Engineer's Guide to Digital Signal Processing by Steven Smith)
") Topic 6 The Digital Fourier Transform (Based, in part, on The Scientist and Engineer's Guide to Digital Signal Processing by Steven Smith) 10 20 30 40 50 60 70 80 90 100 0-1 -0.8-0.6-0.4-0.2 0 0.2 0.4
Topic 6 The Digital Fourier Transform (Based, in part, on The Scientist and Engineer's Guide to Digital Signal Processing by Steven Smith) 10 20 30 40 50 60 70 80 90 100 0-1 -0.8-0.6-0.4-0.2 0 0.2 0.4
Figure 1: Block diagram of Digital signal processing
 Experiment 3. Digital Process of Continuous Time Signal. Introduction Discrete time signal processing algorithms are being used to process naturally occurring analog signals (like speech, music and images).
Signal Processing Toolbox
 Signal Processing Toolbox Perform signal processing, analysis, and algorithm development Signal Processing Toolbox provides industry-standard algorithms for analog and digital signal processing (DSP).
Lab 8. Signal Analysis Using Matlab Simulink
 E E 2 7 5 Lab June 30, 2006 Lab 8. Signal Analysis Using Matlab Simulink Introduction The Matlab Simulink software allows you to model digital signals, examine power spectra of digital signals, represent
ELT COMMUNICATION THEORY
 ELT 41307 COMMUNICATION THEORY Matlab Exercise #1 Sampling, Fourier transform, Spectral illustrations, and Linear filtering 1 SAMPLING The modeled signals and systems in this course are mostly analog (continuous
Armstrong Atlantic State University Engineering Studies MATLAB Marina Sound Processing Primer
 Armstrong Atlantic State University Engineering Studies MATLAB Marina Sound Processing Primer Prerequisites The Sound Processing Primer assumes knowledge of the MATLAB IDE, MATLAB help, arithmetic operations,
B.Tech III Year II Semester (R13) Regular & Supplementary Examinations May/June 2017 DIGITAL SIGNAL PROCESSING (Common to ECE and EIE)
 Regular & Supplementary Examinations May/June 2017 DIGITAL SIGNAL PROCESSING (Common to ECE and EIE)") Code: 13A04602 R13 B.Tech III Year II Semester (R13) Regular & Supplementary Examinations May/June 2017 (Common to ECE and EIE) PART A (Compulsory Question) 1 Answer the following: (10 X 02 = 20 Marks)
Code: 13A04602 R13 B.Tech III Year II Semester (R13) Regular & Supplementary Examinations May/June 2017 (Common to ECE and EIE) PART A (Compulsory Question) 1 Answer the following: (10 X 02 = 20 Marks)
DCSP-3: Minimal Length Coding. Jianfeng Feng
 DCSP-3: Minimal Length Coding Jianfeng Feng Department of Computer Science Warwick Univ., UK Jianfeng.feng@warwick.ac.uk http://www.dcs.warwick.ac.uk/~feng/dcsp.html Automatic Image Caption (better than
6.02 Practice Problems: Modulation & Demodulation
 1 of 12 6.02 Practice Problems: Modulation & Demodulation Problem 1. Here's our "standard" modulation-demodulation system diagram: at the transmitter, signal x[n] is modulated by signal mod[n] and the
ELECTRONOTES APPLICATION NOTE NO Hanshaw Road Ithaca, NY Nov 7, 2014 MORE CONCERNING NON-FLAT RANDOM FFT
 ELECTRONOTES APPLICATION NOTE NO. 416 1016 Hanshaw Road Ithaca, NY 14850 Nov 7, 2014 MORE CONCERNING NON-FLAT RANDOM FFT INTRODUCTION A curiosity that has probably long been peripherally noted but which
ME scope Application Note 01 The FFT, Leakage, and Windowing
 INTRODUCTION ME scope Application Note 01 The FFT, Leakage, and Windowing NOTE: The steps in this Application Note can be duplicated using any Package that includes the VES-3600 Advanced Signal Processing
Sampling and Reconstruction of Analog Signals
 Sampling and Reconstruction of Analog Signals Chapter Intended Learning Outcomes: (i) Ability to convert an analog signal to a discrete-time sequence via sampling (ii) Ability to construct an analog signal
Speech Signal Analysis
 Speech Signal Analysis Hiroshi Shimodaira and Steve Renals Automatic Speech Recognition ASR Lectures 2&3 14,18 January 216 ASR Lectures 2&3 Speech Signal Analysis 1 Overview Speech Signal Analysis for
Digital Filters IIR (& Their Corresponding Analog Filters) Week Date Lecture Title
 Week Date Lecture Title") http://elec3004.com Digital Filters IIR (& Their Corresponding Analog Filters) 2017 School of Information Technology and Electrical Engineering at The University of Queensland Lecture Schedule: Week Date
http://elec3004.com Digital Filters IIR (& Their Corresponding Analog Filters) 2017 School of Information Technology and Electrical Engineering at The University of Queensland Lecture Schedule: Week Date
Design of FIR Filter for Efficient Utilization of Speech Signal Akanksha. Raj 1 Arshiyanaz. Khateeb 2 Fakrunnisa.Balaganur 3
 IJSRD - International Journal for Scientific Research & Development Vol. 3, Issue 03, 2015 ISSN (online): 2321-0613 Design of FIR Filter for Efficient Utilization of Speech Signal Akanksha. Raj 1 Arshiyanaz.
Time-Frequency analysis of biophysical time series. Courtesy of Arnaud Delorme
 Time-Frequency analysis of biophysical time series Courtesy of Arnaud Delorme 1 2 Why Frequency-domain Analysis For many signals, the signal's frequency content is of great importance. Beta Alpha Theta
JOURNAL OF OBJECT TECHNOLOGY
 JOURNAL OF OBJECT TECHNOLOGY Online at http://www.jot.fm. Published by ETH Zurich, Chair of Software Engineering JOT, 2009 Vol. 9, No. 1, January-February 2010 The Discrete Fourier Transform, Part 5: Spectrogram
DFT: Discrete Fourier Transform & Linear Signal Processing
 DFT: Discrete Fourier Transform & Linear Signal Processing 2 nd Year Electronics Lab IMPERIAL COLLEGE LONDON Table of Contents Equipment... 2 Aims... 2 Objectives... 2 Recommended Textbooks... 3 Recommended
Chapter 7. Frequency-Domain Representations 语音信号的频域表征
 Chapter 7 Frequency-Domain Representations 语音信号的频域表征 1 General Discrete-Time Model of Speech Production Voiced Speech: A V P(z)G(z)V(z)R(z) Unvoiced Speech: A N N(z)V(z)R(z) 2 DTFT and DFT of Speech The
Digital Signal Processing
 COMP ENG 4TL4: Digital Signal Processing Notes for Lecture #27 Tuesday, November 11, 23 6. SPECTRAL ANALYSIS AND ESTIMATION 6.1 Introduction to Spectral Analysis and Estimation The discrete-time Fourier
ADSP ADSP ADSP ADSP. Advanced Digital Signal Processing (18-792) Spring Fall Semester, Department of Electrical and Computer Engineering
 Spring Fall Semester, Department of Electrical and Computer Engineering") ADSP ADSP ADSP ADSP Advanced Digital Signal Processing (18-792) Spring Fall Semester, 201 2012 Department of Electrical and Computer Engineering PROBLEM SET 5 Issued: 9/27/18 Due: 10/3/18 Reminder: Quiz
ADSP ADSP ADSP ADSP Advanced Digital Signal Processing (18-792) Spring Fall Semester, 201 2012 Department of Electrical and Computer Engineering PROBLEM SET 5 Issued: 9/27/18 Due: 10/3/18 Reminder: Quiz
Laboratory Assignment 4. Fourier Sound Synthesis
 Laboratory Assignment 4 Fourier Sound Synthesis PURPOSE This lab investigates how to use a computer to evaluate the Fourier series for periodic signals and to synthesize audio signals from Fourier series
Lecture 7 Frequency Modulation
 Lecture 7 Frequency Modulation Fundamentals of Digital Signal Processing Spring, 2012 Wei-Ta Chu 2012/3/15 1 Time-Frequency Spectrum We have seen that a wide range of interesting waveforms can be synthesized
DSP First. Laboratory Exercise #11. Extracting Frequencies of Musical Tones
 DSP First Laboratory Exercise #11 Extracting Frequencies of Musical Tones This lab is built around a single project that involves the implementation of a system for automatically writing a musical score
Multirate Digital Signal Processing
 Multirate Digital Signal Processing Basic Sampling Rate Alteration Devices Up-sampler - Used to increase the sampling rate by an integer factor Down-sampler - Used to increase the sampling rate by an integer
Use Matlab Function pwelch to Find Power Spectral Density or Do It Yourself
 Use Matlab Function pwelch to Find Power Spectral Density or Do It Yourself In my last post, we saw that finding the spectrum of a signal requires several steps beyond computing the discrete Fourier transform
Problem Set 1 (Solutions are due Mon )
") ECEN 242 Wireless Electronics for Communication Spring 212 1-23-12 P. Mathys Problem Set 1 (Solutions are due Mon. 1-3-12) 1 Introduction The goals of this problem set are to use Matlab to generate and
ECEN 242 Wireless Electronics for Communication Spring 212 1-23-12 P. Mathys Problem Set 1 (Solutions are due Mon. 1-3-12) 1 Introduction The goals of this problem set are to use Matlab to generate and
It is the speed and discrete nature of the FFT that allows us to analyze a signal's spectrum with MATLAB.
 MATLAB Addendum on Fourier Stuff 1. Getting to know the FFT What is the FFT? FFT = Fast Fourier Transform. The FFT is a faster version of the Discrete Fourier Transform(DFT). The FFT utilizes some clever
(i) Understanding the basic concepts of signal modeling, correlation, maximum likelihood estimation, least squares and iterative numerical methods
 Understanding the basic concepts of signal modeling, correlation, maximum likelihood estimation, least squares and iterative numerical methods") Tools and Applications Chapter Intended Learning Outcomes: (i) Understanding the basic concepts of signal modeling, correlation, maximum likelihood estimation, least squares and iterative numerical methods
Tools and Applications Chapter Intended Learning Outcomes: (i) Understanding the basic concepts of signal modeling, correlation, maximum likelihood estimation, least squares and iterative numerical methods
Time-Frequency analysis of biophysical time series
 Time-Frequency analysis of biophysical time series Sept 9 th 2010, NCTU, Taiwan Arnaud Delorme Frequency analysis synchronicity of cell excitation determines amplitude and rhythm of the EEG signal 30-60
Signal Processing. Naureen Ghani. December 9, 2017
 Signal Processing Naureen Ghani December 9, 27 Introduction Signal processing is used to enhance signal components in noisy measurements. It is especially important in analyzing time-series data in neuroscience.
SAMPLING THEORY. Representing continuous signals with discrete numbers
 SAMPLING THEORY Representing continuous signals with discrete numbers Roger B. Dannenberg Professor of Computer Science, Art, and Music Carnegie Mellon University ICM Week 3 Copyright 2002-2013 by Roger
CS3291: Digital Signal Processing
 CS39 Exam Jan 005 //08 /BMGC University of Manchester Department of Computer Science First Semester Year 3 Examination Paper CS39: Digital Signal Processing Date of Examination: January 005 Answer THREE
Jawaharlal Nehru Engineering College
 Jawaharlal Nehru Engineering College Laboratory Manual SIGNALS & SYSTEMS For Third Year Students Prepared By: Ms.Sunetra S Suvarna Assistant Professor Author JNEC INSTRU. & CONTROL DEPT., Aurangabad SUBJECT
Signal Processing First Lab 20: Extracting Frequencies of Musical Tones
 Signal Processing First Lab 20: Extracting Frequencies of Musical Tones Pre-Lab and Warm-Up: You should read at least the Pre-Lab and Warm-up sections of this lab assignment and go over all exercises in
Filter Banks I. Prof. Dr. Gerald Schuller. Fraunhofer IDMT & Ilmenau University of Technology Ilmenau, Germany. Fraunhofer IDMT
 Filter Banks I Prof. Dr. Gerald Schuller Fraunhofer IDMT & Ilmenau University of Technology Ilmenau, Germany 1 Structure of perceptual Audio Coders Encoder Decoder 2 Filter Banks essential element of most
Lecture 3 Complex Exponential Signals
 Lecture 3 Complex Exponential Signals Fundamentals of Digital Signal Processing Spring, 2012 Wei-Ta Chu 2012/3/1 1 Review of Complex Numbers Using Euler s famous formula for the complex exponential The
ECE 201: Introduction to Signal Analysis
 ECE 201: Introduction to Signal Analysis Prof. Paris Last updated: October 9, 2007 Part I Spectrum Representation of Signals Lecture: Sums of Sinusoids (of different frequency) Introduction Sum of Sinusoidal
FFT analysis in practice
 FFT analysis in practice Perception & Multimedia Computing Lecture 13 Rebecca Fiebrink Lecturer, Department of Computing Goldsmiths, University of London 1 Last Week Review of complex numbers: rectangular
Limitations of Sum-of-Sinusoid Signals
 Limitations of Sum-of-Sinusoid Signals I So far, we have considered only signals that can be written as a sum of sinusoids. x(t) =A 0 + N Â A i cos(2pf i t + f i ). i=1 I For such signals, we are able
DISCRETE FOURIER TRANSFORM AND FILTER DESIGN
 DISCRETE FOURIER TRANSFORM AND FILTER DESIGN N. C. State University CSC557 Multimedia Computing and Networking Fall 2001 Lecture # 03 Spectrum of a Square Wave 2 Results of Some Filters 3 Notation 4 x[n]
Signal Processing. Introduction
 Signal Processing 0 Introduction One of the premiere uses of MATLAB is in the analysis of signal processing and control systems. In this chapter we consider signal processing. The final chapter of the
ECEGR Lab #8: Introduction to Simulink
 Page 1 ECEGR 317 - Lab #8: Introduction to Simulink Objective: By: Joe McMichael This lab is an introduction to Simulink. The student will become familiar with the Help menu, go through a short example,
Contents. Introduction 1 1 Suggested Reading 2 2 Equipment and Software Tools 2 3 Experiment 2
 ECE363, Experiment 02, 2018 Communications Lab, University of Toronto Experiment 02: Noise Bruno Korst - bkf@comm.utoronto.ca Abstract This experiment will introduce you to some of the characteristics
Laboration Exercises in Digital Signal Processing
 Laboration Exercises in Digital Signal Processing Mikael Swartling Department of Electrical and Information Technology Lund Institute of Technology revision 215 Introduction Introduction The traditional
Fourier Series. Discrete time DTFS. (Periodic signals) Continuous time. Same as one-period of discrete Fourier series
 Continuous time. Same as one-period of discrete Fourier series") Chapter 5 Discrete Fourier Transform, DFT and FFT In the previous chapters we learned about Fourier series and the Fourier transform. These representations can be used to both synthesize a variety of continuous
Chapter 5 Discrete Fourier Transform, DFT and FFT In the previous chapters we learned about Fourier series and the Fourier transform. These representations can be used to both synthesize a variety of continuous
Lecture 3, Multirate Signal Processing
 Lecture 3, Multirate Signal Processing Frequency Response If we have coefficients of an Finite Impulse Response (FIR) filter h, or in general the impulse response, its frequency response becomes (using
Fourier Transform. Prepared by :Eng. Abdo Z Salah
 Fourier Transform Prepared by :Eng. Abdo Z Salah What is Fourier analysis?? Fourier Analysis is based on the premise that any arbitrary signal can be constructed using a bunch of sine and cosine waves.
Spectral Estimation & Examples of Signal Analysis
 Spectral Estimation & Examples of Signal Analysis Examples from research of Kyoung Hoon Lee, Aaron Hastings, Don Gallant, Shashikant More, Weonchan Sung Herrick Graduate Students Estimation: Bias, Variance
Notes on Fourier transforms
 Fourier Transforms 1 Notes on Fourier transforms The Fourier transform is something we all toss around like we understand it, but it is often discussed in an offhand way that leads to confusion for those
Signal Analysis. Young Won Lim 2/9/18
 Signal Analysis Copyright (c) 2016 2018 Young W. Lim. Permission is granted to copy, distribute and/or modify this document under the terms of the GNU Free Documentation License, Version 1.2 or any later
Chapter 4 SPEECH ENHANCEMENT
 44 Chapter 4 SPEECH ENHANCEMENT 4.1 INTRODUCTION: Enhancement is defined as improvement in the value or Quality of something. Speech enhancement is defined as the improvement in intelligibility and/or
Design of FIR Filters
 Design of FIR Filters Elena Punskaya www-sigproc.eng.cam.ac.uk/~op205 Some material adapted from courses by Prof. Simon Godsill, Dr. Arnaud Doucet, Dr. Malcolm Macleod and Prof. Peter Rayner 1 FIR as a
EXPERIMENT 4 INTRODUCTION TO AMPLITUDE MODULATION SUBMITTED BY
 EXPERIMENT 4 INTRODUCTION TO AMPLITUDE MODULATION SUBMITTED BY NAME:. STUDENT ID:.. ROOM: INTRODUCTION TO AMPLITUDE MODULATION Purpose: The objectives of this laboratory are:. To introduce the spectrum
L A B 3 : G E N E R A T I N G S I N U S O I D S
 L A B 3 : G E N E R A T I N G S I N U S O I D S NAME: DATE OF EXPERIMENT: DATE REPORT SUBMITTED: 1/7 1 THEORY DIGITAL SIGNAL PROCESSING LABORATORY 1.1 GENERATION OF DISCRETE TIME SINUSOIDAL SIGNALS IN
Sampling of Continuous-Time Signals. Reference chapter 4 in Oppenheim and Schafer.
 Sampling of Continuous-Time Signals Reference chapter 4 in Oppenheim and Schafer. Periodic Sampling of Continuous Signals T = sampling period fs = sampling frequency when expressing frequencies in radians
Short-Time Fourier Transform and Its Inverse
 Short-Time Fourier Transform and Its Inverse Ivan W. Selesnick April 4, 9 Introduction The short-time Fourier transform (STFT) of a signal consists of the Fourier transform of overlapping windowed blocks
Signal Analysis. Young Won Lim 2/10/18
 Signal Analysis Copyright (c) 2016 2018 Young W. Lim. Permission is granted to copy, distribute and/or modify this document under the terms of the GNU Free Documentation License, Version 1.2 or any later
Wireless Communication Systems Laboratory Lab#1: An introduction to basic digital baseband communication through MATLAB simulation Objective
 Wireless Communication Systems Laboratory Lab#1: An introduction to basic digital baseband communication through MATLAB simulation Objective The objective is to teach students a basic digital communication
Noise estimation and power spectrum analysis using different window techniques
 IOSR Journal of Electrical and Electronics Engineering (IOSR-JEEE) e-issn: 78-1676,p-ISSN: 30-3331, Volume 11, Issue 3 Ver. II (May. Jun. 016), PP 33-39 www.iosrjournals.org Noise estimation and power
PROBLEM SET 5. Reminder: Quiz 1will be on March 6, during the regular class hour. Details to follow. z = e jω h[n] H(e jω ) H(z) DTFT.
![PROBLEM SET 5. Reminder: Quiz 1will be on March 6, during the regular class hour. Details to follow. z = e jω h[n] H(e jω ) H(z) DTFT.](/thumbs/96/129052141.jpg "PROBLEM SET 5. Reminder: Quiz 1will be on March 6, during the regular class hour. Details to follow. z = e jω h[n] H(e jω ) H(z) DTFT.") PROBLEM SET 5 Issued: 2/4/9 Due: 2/22/9 Reading: During the past week we continued our discussion of the impact of pole/zero locations on frequency response, focusing on allpass systems, minimum and maximum-phase
PROBLEM SET 5 Issued: 2/4/9 Due: 2/22/9 Reading: During the past week we continued our discussion of the impact of pole/zero locations on frequency response, focusing on allpass systems, minimum and maximum-phase
ENGR 210 Lab 12: Sampling and Aliasing
 ENGR 21 Lab 12: Sampling and Aliasing In the previous lab you examined how A/D converters actually work. In this lab we will consider some of the consequences of how fast you sample and of the signal processing
A Brief Introduction to the Discrete Fourier Transform and the Evaluation of System Transfer Functions
 MEEN 459/659 Notes 6 A Brief Introduction to the Discrete Fourier Transform and the Evaluation of System Transfer Functions Original from Dr. Joe-Yong Kim (ME 459/659), modified by Dr. Luis San Andrés
Chapter 2. Signals and Spectra
 Chapter 2 Signals and Spectra Outline Properties of Signals and Noise Fourier Transform and Spectra Power Spectral Density and Autocorrelation Function Orthogonal Series Representation of Signals and Noise
Short Time Fourier Transform *
 OpenStax-CNX module: m10570 1 Short Time Fourier Transform * Ivan Selesnick This work is produced by OpenStax-CNX and licensed under the Creative Commons Attribution License 1.0 1 Short Time Fourier Transform
1. In the command window, type "help conv" and press [enter]. Read the information displayed.
![1. In the command window, type help conv and press [enter]. Read the information displayed.](/thumbs/82/86785923.jpg "1. In the command window, type help conv and press [enter]. Read the information displayed.") ECE 317 Experiment 0 The purpose of this experiment is to understand how to represent signals in MATLAB, perform the convolution of signals, and study some simple LTI systems. Please answer all questions
ECE 317 Experiment 0 The purpose of this experiment is to understand how to represent signals in MATLAB, perform the convolution of signals, and study some simple LTI systems. Please answer all questions
Reading: Johnson Ch , Ch.5.5 (today); Liljencrants & Lindblom; Stevens (Tues) reminder: no class on Thursday.
; Liljencrants & Lindblom; Stevens (Tues) reminder: no class on Thursday.") L105/205 Phonetics Scarborough Handout 7 10/18/05 Reading: Johnson Ch.2.3.3-2.3.6, Ch.5.5 (today); Liljencrants & Lindblom; Stevens (Tues) reminder: no class on Thursday Spectral Analysis 1. There are
L105/205 Phonetics Scarborough Handout 7 10/18/05 Reading: Johnson Ch.2.3.3-2.3.6, Ch.5.5 (today); Liljencrants & Lindblom; Stevens (Tues) reminder: no class on Thursday Spectral Analysis 1. There are
Digital Signal Processing ETI
 2012 Digital Signal Processing ETI265 2012 Introduction In the course we have 2 laboratory works for 2012. Each laboratory work is a 3 hours lesson. We will use MATLAB for illustrate some features in digital
PYKC 27 Feb 2017 EA2.3 Electronics 2 Lecture PYKC 27 Feb 2017 EA2.3 Electronics 2 Lecture 11-2
 In this lecture, I will introduce the mathematical model for discrete time signals as sequence of samples. You will also take a first look at a useful alternative representation of discrete signals known
6.S02 MRI Lab Acquire MR signals. 2.1 Free Induction decay (FID)
") 6.S02 MRI Lab 1 2. Acquire MR signals Connecting to the scanner Connect to VMware on the Lab Macs. Download and extract the following zip file in the MRI Lab dropbox folder: https://www.dropbox.com/s/ga8ga4a0sxwe62e/mit_download.zip
6.S02 MRI Lab 1 2. Acquire MR signals Connecting to the scanner Connect to VMware on the Lab Macs. Download and extract the following zip file in the MRI Lab dropbox folder: https://www.dropbox.com/s/ga8ga4a0sxwe62e/mit_download.zip
Lab P-4: AM and FM Sinusoidal Signals. We have spent a lot of time learning about the properties of sinusoidal waveforms of the form: ) X
 X") DSP First, 2e Signal Processing First Lab P-4: AM and FM Sinusoidal Signals Pre-Lab and Warm-Up: You should read at least the Pre-Lab and Warm-up sections of this lab assignment and go over all exercises
DSP First, 2e Signal Processing First Lab P-4: AM and FM Sinusoidal Signals Pre-Lab and Warm-Up: You should read at least the Pre-Lab and Warm-up sections of this lab assignment and go over all exercises
CHAPTER 4 IMPLEMENTATION OF ADALINE IN MATLAB
 52 CHAPTER 4 IMPLEMENTATION OF ADALINE IN MATLAB 4.1 INTRODUCTION The ADALINE is implemented in MATLAB environment running on a PC. One hundred data samples are acquired from a single cycle of load current
Sampling and Reconstruction
 Sampling and Reconstruction Peter Rautek, Eduard Gröller, Thomas Theußl Institute of Computer Graphics and Algorithms Vienna University of Technology Motivation Theory and practice of sampling and reconstruction
Digital Filters FIR and IIR Systems
 Digital Filters FIR and IIR Systems ELEC 3004: Systems: Signals & Controls Dr. Surya Singh (Some material adapted from courses by Russ Tedrake and Elena Punskaya) Lecture 16 elec3004@itee.uq.edu.au http://robotics.itee.uq.edu.au/~elec3004/
Topic. Spectrogram Chromagram Cesptrogram. Bryan Pardo, 2008, Northwestern University EECS 352: Machine Perception of Music and Audio
 Topic Spectrogram Chromagram Cesptrogram Short time Fourier Transform Break signal into windows Calculate DFT of each window The Spectrogram spectrogram(y,1024,512,1024,fs,'yaxis'); A series of short term
5650 chapter4. November 6, 2015
 5650 chapter4 November 6, 2015 Contents Sampling Theory 2 Starting Point............................................. 2 Lowpass Sampling Theorem..................................... 2 Principle Alias Frequency..................................
Concordia University. Discrete-Time Signal Processing. Lab Manual (ELEC442) Dr. Wei-Ping Zhu
 Dr. Wei-Ping Zhu") Concordia University Discrete-Time Signal Processing Lab Manual (ELEC442) Course Instructor: Dr. Wei-Ping Zhu Fall 2012 Lab 1: Linear Constant Coefficient Difference Equations (LCCDE) Objective In this
Concordia University Discrete-Time Signal Processing Lab Manual (ELEC442) Course Instructor: Dr. Wei-Ping Zhu Fall 2012 Lab 1: Linear Constant Coefficient Difference Equations (LCCDE) Objective In this
Moving from continuous- to discrete-time
 Moving from continuous- to discrete-time Sampling ideas Uniform, periodic sampling rate, e.g. CDs at 44.1KHz First we will need to consider periodic signals in order to appreciate how to interpret discrete-time
Experiment 1 Introduction to MATLAB and Simulink
 Experiment 1 Introduction to MATLAB and Simulink INTRODUCTION MATLAB s Simulink is a powerful modeling tool capable of simulating complex digital communications systems under realistic conditions. It includes