Biomedical Signals. Signals and Images in Medicine Dr Nabeel Anwar
|
|
|
- Cecily Sara Holland
- 6 years ago
- Views:
Transcription
1 Biomedical Signals Signals and Images in Medicine Dr Nabeel Anwar
2 Noise Removal: Time Domain Techniques 1. Synchronized Averaging (covered in lecture 1) 2. Moving Average Filters (today s topic) 3. Derivative based operations to remove low frequency artifacts (today s topic) 4. Introduction to frequency domain
3 Moving Average Filters Problem: Propose a time-domain technique to remove random noise given only one realization of the signal or event of interest.
4 Moving Average (MA) Filter Ensemble of several realizations not available synchronized averaging is not possible. Consider temporal averaging for noise removal Temporal window of samples moved to obtain output at various points of time: moving-window averaging or movingaverage (MA) filter. Average weighted combination of samples
5 Moving Average (MA) Filter Rangaraj s book x and y: input and output of filter. b k : filter coefficients or tap weights. N: order of filter.
6 Moving Average (MA) Filter Basic Concept OF Z-Transform Z-Transform is a digital operation When identified with a digital data sequence, such as x(n), z n represents an interval shift of n samples, or an associated time shift of nts seconds. Every data sample in the sequence x(n) is associated with a unique power of z, and this power of z defines a sample s position in the sequence. For example, the time shifting characteristic of the Z-transform can be used to define a unit delay process, z 1. For such a process, the output is the same as the input, but shifted (or delayed) by one data sample
7 Delay of one Sample Consider the system y[n] = x[n-1], i.e., the onesample-delay system. The z-transform system function is H 1 z z Z -1
8 Delay of k Samples Similarly, the system y[n] = x[n-k], i.e., the k-sampledelay system, is the z-transform of the impulse response x[n - k]. H z z k Z -k
9
10

11 Moving Average (MA) Filter Signal-flow diagram of a moving-average filter of order N. Each block with the symbol z 1 represents a delay of one sample, and serves as a memory unit for the corresponding signal sample value.
12 Example: Running Average Algorithm Block Diagram Transfer Function z z z z z X z z z z X z Y z z z z z X Y k k k k k x x x x y Note: Each [Z -1 ] block can be thought of as a memory cell, storing the previously applied value. (Non-Recursive) Z Transform
13 Exercise
14 Moving Average (MA) Filter Moving Average can be symmetrical or non-symmterical. e.g. Y[80] = ( x[80] + x[79]+x[78] +x[77]) / 4 : nonsymmterical. Y[80] = ( x[79] + x[80]+x[81] ) / 3 : symmterical A potential problem is look-ahead
15 Moving Average (MA) Filter See Fig 15-1 in DSP Guide
16 Moving Average (MA) Filter Examples of moving average Moving average term is used for any process that uses a moving set of multiplier weights. That means we have finite number of weights. It gives the concept that An MA filter is a finite impulse response (FIR) filter: Output 'may depends only on the present input sample and a few past input samples.
17 MA: Application Example ECG signal with 1000 Hz noise 8 points moving average filter
18 Moving average is Recursive A tremendous advantage of the moving average filter is that it can be implemented with an algorithm that is very fast.
19 Assignment 2 Apply an 8 point moving average filter on the raw ECG data already provided. Apply a 32 point filter on the raw ECG data. What is the difference? Does 32 point filter preserved information?
20 Frequency Analysis
21 Next few slides are taken from book Advanced Engineering Mathematics by Erwin Kreyszig John Wiley & Sons, Inc. Consult the book for further info. Pages b
22
23 Advanced Engineering Mathematics by Erwin Kreyszig Copyright 2007 John Wiley & Sons, Inc. All rights reserved.
24 Pages c Advanced Engineering Mathematics by Erwin Kreyszig Copyright 2007 John Wiley & Sons, Inc. All rights reserved.
25 Fourier Transform Before we start, lets discuss a little about Fourier Transform. The basic idea is: A signal can be decomposed into periodic cosine and sine waves with different frequencies. Fourier Analysis has four categories (Slide 33-34: taken from Smith s book)
26 Frequency Spectra example : g(t) = sin(2πf t) + (1/3)sin(2π(3f) t) = +

27 Frequency Spectra =

28 Example: Music We think of music in terms of frequencies at different magnitudes Time information is LOST
29
30
31 Fourier Transforms All of us has basic concept of functions. In signal processing, most functions fall into two categories: 1. waveforms, images, or other data; 2. and entities that operate on waveforms, images, or other data The later group can be further divided into functions i. that modify the data, ii. and functions used to analyze or probe the data. For example, the basic filters use functions (the filter coefficients) that modify the spectral content of a waveform. The Fourier Transform detailed uses functions (harmonically related sinusoids) to analyze the spectral content of a waveform. Functions that modify data are also termed operations or transformations.
32 Fourier Transform A transform can be thought of as a re-mapping of the original data into a function that provides more information than the original. The Fourier Transform is classic example as it converts the original time data into frequency information which often provides greater insight into the nature and/or origin of the signal.
33 Fourier Transform How we do that?... Many of the transforms are achieved by comparing the signal of interest with some sort of probing function. This comparison takes the form of a correlation (produced by multiplication) that is averaged (or integrated) over the duration of the waveform, or some portion of the waveform:
34 Fourier Transform It is a technique for examining signals in the frequency domain. Our immediate goal is to represent a given function as a convergent series in the elementary trigonometric functions (already studied them few slides before) f(x) Fourier Transform F(w)
35 Fourier Analysis f ( t) a 2 0 n 1 a n cos 2 nt T n 1 b n sin 2 nt T DC Part Even Part Odd Part T is a period of all the above signals with the first term ½ a 0 representing the direct current (DC) component; the remaining sine and cosine waves weighted by the a n and b n coefficients represent the alternating current (AC) components of the signal. It is very important to find correct amplitude of a o, a n and b n


36 a o can be calculated by b n all coefficients are zero except b n General formula for a n
37 Fourier Analysis (in words) The above expression has a real part of cosine of frequency f, and an imaginary part of sine of frequency f. So what we are actually doing is, multiplying the original signal with a complex expression which has sines and cosines of frequency f. Then we integrate this product (In other words, we add all the points in this product). If the result of this integration (which is nothing but some sort of infinite summation) is a large value, then we say that : the signal x(t), has a dominant spectral component at frequency "f". This means that, a major portion of this signal is composed of frequency f. If the integration result is a small value, than this means that the signal does not have a major frequency component of f in it. If this integration result is zero, then the signal does not contain the frequency "f" at all. How this integration works: The signal is multiplied with the sinusoidal term of frequency "f". If the signal has a high amplitude component of frequency "f", then that component and the sinusoidal term will coincide, and the product of them will give a (relatively) large value. This shows that, the signal "x", has a major frequency component of "f". However, if the signal does not have a frequency component of "f", the product will yield zero, which shows that, the signal does not have a frequency component of "f". If the frequency "f", is not a major component of the signal "x(t)", then the product will give a (relatively) small value. This shows that, the frequency component "f" in the signal "x", has a small amplitude, in other words, it is not a major component of "x.
38 Fourier: Examples The typical syntax for computing the FFT of a signal is FFT(x,N) where x is the signal, x[n], you wish to transform, and N is the number of points in the FFT. N must be at least as large as the number of samples in x[n]. Matlab Example: To demonstrate the effect of changing the value of N, i.e 64, 128,256, 512 Matlab example
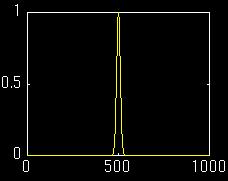
39 Fourier: Examples 20 N = N = N = N = N =
40 Fourier: Examples In the previous slide Upon examining the plot one can see that each of the transforms adheres to the same shape, differing only in the number of FFT samples used to approximate that shape. But once the number of FFT points are very small the shape is different (N=16 and N=32). When the FFT is computed with an N larger than the number of samples in x[n], it fills in the samples after x[n] with zeros. For example if x[n] is 30 samples long, and the length FFT is 256. When Matlab computes the FFT, it automatically fills the spaces from n= 30 to n = 255 with zeros. This is called zero padding.
41 Fourier: Examples 1. The FFT does not directly give you the spectrum of a signal. As we have seen with the last two examples, the FFT can vary dramatically depending on the number of points (N) of the FFT, and the number of periods of the signal that are represented. 2. The FFT contains information between 0 and fs, however, we know that the sampling frequency must be at least twice the highest frequency component. Therefore, the signal's spectrum should be entirly below fs/2, the Nyquist frequency. 3. Also real signal should have a transform magnitude that is symmetrical for positive and negative frequencies. So instead of having a spectrum that goes from 0 to fs, it would be more appropriate to show the spectrum from fs/2 to fs/2.
42 Fourier: Examples frequency / f s
43 A bit More on FFT It is clear that fft gives you a two sided spectrum. The basic computations for analyzing signals include converting from a two-sided power spectrum to a single-sided power spectrum. Converting from a Two-Sided Power Spectrum to a Single- Sided Power Spectrum In a two-sided spectrum, half the energy is displayed at the positive frequency, and half the energy is displayed at the negative frequency. Therefore, to convert from a two-sided spectrum to a single-sided spectrum, discard the second half of the array and multiply every point except for DC by two.
44 DC component remains same Others are multiplied by 2.
45 FFT: Spectrum Type and Scaling FFT returns complex-valued amplitudes Real part represents cosine components, imaginary part represents sine components (90 phase difference) Can be converted to magnitude and phase Squared magnitude represents signal power
46 Limitations of Fourier Analysis 1. Cannot not provide simultaneous time and frequency localization. 2. Not useful for analyzing time-variant, non-stationary signals. 3. Not efficient for representing discontinuities or sharp corners (i.e., requires a large number of Fourier components to represent discontinuities).

47 Limitations of Fourier Analysis f 4 ( t) cos(2 5 t) cos(2 25 t) cos(2 50 t) Provides excellent localization in the frequency domain but poor localization in the time domain.
48 Limitations of Fourier Analysis 1. Cannot not provide simultaneous time and frequency localization. 2. In its current form Not useful for analyzing time-variant, nonstationary signals. 3. Not appropriate for representing discontinuities or sharp corners (i.e., requires a large number of Fourier components to represent discontinuities).
49 Stationary vs non-stationary signals Stationary signals: timeinvariant spectra Non-stationary signals: time-varying spectra


50 Stationary vs non-stationary signals Stationary signal: Three frequency components, present at all times!

51 Stationary vs non-stationary signals Non-stationary signal: The reason of the noise like thing in between peaks show that, those frequencies also exist in the signal. But the reason they have a small amplitude, is because, they are not major spectral components of the given signal, and the reason we see those, is because of the sudden change between the frequencies.
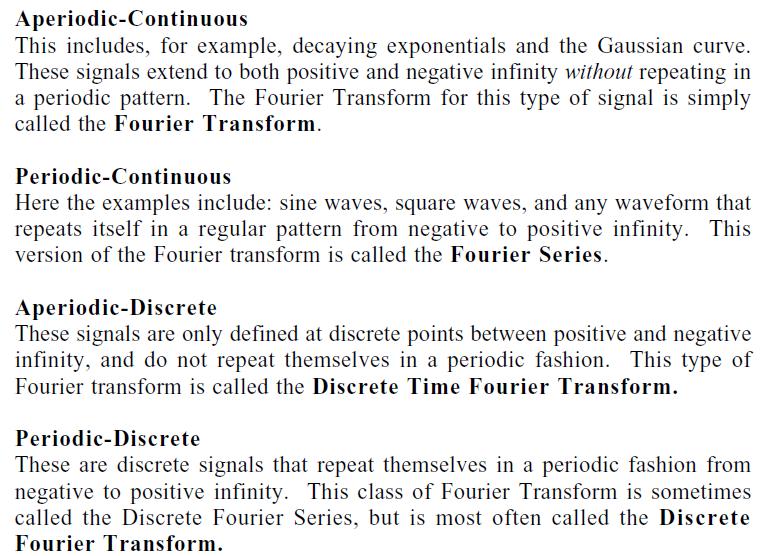
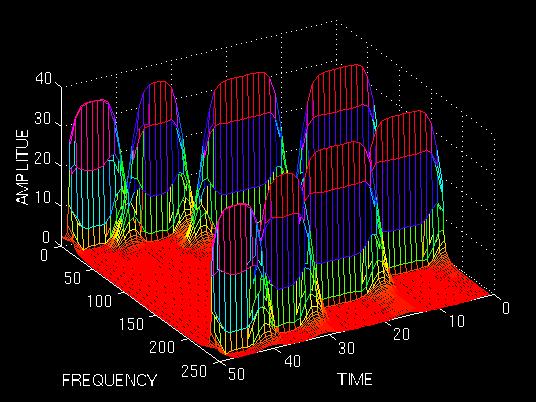
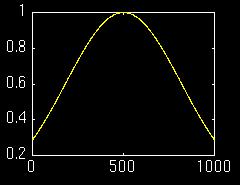
52 Short Time Fourier Transform What's the solution to tackle the problems of non-stationary signal? We Need a local analysis scheme for a time-frequency representation. Windowed F.T. or Short Time F.T. (STFT) Segmenting the signal into narrow time intervals (i.e., narrow enough to be considered stationary). Take the Fourier transform of each segment.
53 Short Time Fourier Transform Output = fft(signal,nfft_length); Above statement is from MATLAB, it has two variables namely Signal: is a signal (ECG/EMG ) which has some finite data points. Nfft_length: is length of fft you want to implement. So your output is dependent upon both signal length and nfft_length. Basically, the FFT size can be defined independently from the window size. The FFT size defines the number of bins used for dividing the window into equal strips, or bins. Hence, a bin is a spectrum sample, and defines the frequency resolution of the window. A window size is expressed in samples. This parameter is a variable. Practically, there is a relationship between the number of samples of the window and duration of the window.
54 Short Time Fourier Transform Suppose I want to analyze a frequency component of 10 Hz. That gives me time period of 100ms. In general we need 4~5 cycles to estimate the frequency component reasonably. That gives you 500 ms of time window of signal. Similarly for 250 Hz frequency you need 20 ms. Lower the frequency the bigger the window size should be.
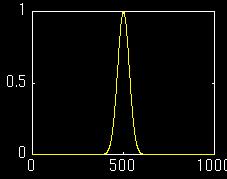
55 Short Time Fourier Transform Let's take a sampling rate (SR). SR=44100 Hz, F(max) = Hz. (according to Nyquist theorm) Case1: With a 1024 window size, we get. FR = 44100/1024 = Hz The spectrum is equally split into bins of Hz width. Case2: If we choose a 4096 window size we get FR = 44100/4096 = Hz The spectrum is equally split into bins of Hz width. The frequency resolution is more precise. The more bins, the more slices of frequency range we get, and the more precise these slices are.
56 Short Time Fourier Transform Steps : 1. Choose a window function of finite length 2. Place the window on top of the signal at t=0 3. Truncate the signal using this window 4. Compute the FT of the truncated signal, save results. 5. Incrementally slide the window to the right 6. Go to step 3, until window reaches the end of the signal
57 Short Time Fourier Transform Each FT provides the spectral information of a separate timeslice of the signal, providing simultaneous time and frequency information
58 Short Time Fourier Transform Time parameter Frequency parameter Signal to be analyzed 1D 2D u 2 (, ) ( ) ( ) j STFT ut f t u f t W t t e dt t STFT of f(t): computed for each window centered at t=t Windowing function centered at t=t
59 Choosing Window W(t) What shape should it have? Rectangular, Gaussian, Elliptic? How wide should it be? Window should be narrow enough to make sure that the portion of the signal falling within the window is stationary. Very narrow windows do not offer good localization in the frequency domain.
60 STFT Window Size u 2 (, ) ( ) ( ) j STFT ut f t u f t W t t e dt W(t) infinitely long: W ( t) 1 STFT turns into FT, providing excellent frequency localization, but no time information. W(t) infinitely short: W ( t) ( t) gives the time signal back, with a phase factor, providing excellent time localization but no frequency information. t 2 STFT ( t, u) f ( t) ( t t ) e dt f ( t ) e u j ut jut f t
61 STFT Window Size (cont d) Wide window good frequency resolution, poor time resolution. Narrow window good time resolution, poor frequency resolution. In next lectures: We will study different windowing types/shapes.


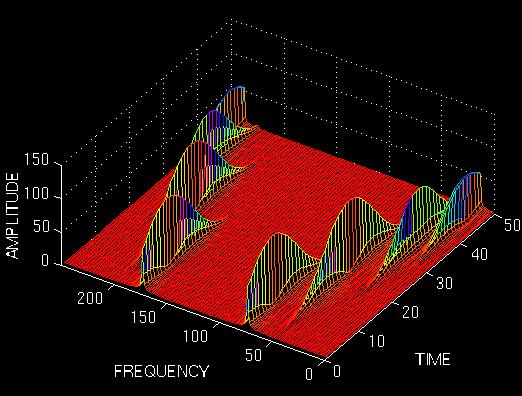
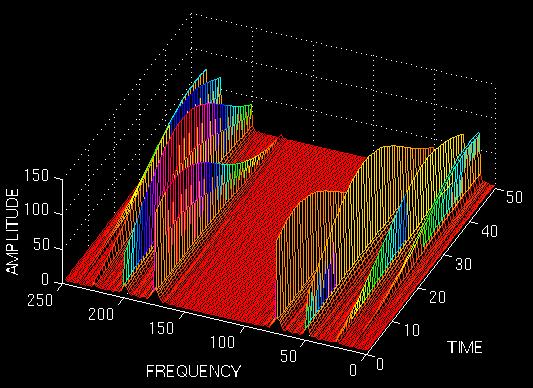
62 Example Use this link for an Excellent work of Polikar on STFT and wavelets different size windows (four frequencies, non-stationary)
63 Example
64 Example
65 Example: Effect of FFT window Consider following scenario Two sin waves have frequencies of 100 Hz and 110 Hz, and the sampling rate is 1 khz. Apply a FFT with window length 64 samples and 1024 samples. Solution: We experiment with two time windows of length N1=1024 with a theoretical frequency resolution of f=1000/1024=0.98 Hz, and N2=64 with a theoretical frequency resolution f=1000/64=15.7 Hz.
66
67 Heisenberg (or Uncertainty) Principle t f 1 4 Time resolution: How well two spikes in time can be separated from each other in the transform domain. Frequency resolution: How well two spectral components can be separated from each other in the transform domain t and f cannot be made arbitrarily small!
68 Heisenberg (or Uncertainty) Principle One cannot know the exact time-frequency representation of a signal. We cannot precisely know at what time instance a frequency component is located. We can only know what interval of frequencies are present in which time intervals.
69 The Effect of Finite Length Data (Windowing) We already know that In practical situation we have either with a short length signal, or with a long signal. Having a short segment of N samples of a signal or taking a slice of N samples from a signal is equivalent to multiplying the signal by a window (We have considered Gaussian shape in example) of N samples. Multiplying two signals in time is equivalent to the convolution of their frequency spectra. Thus the spectrum of a short segment of a signal is convolved with the spectrum of a rectangular pulse, the result of this convolution is some spreading of the signal energy.
70 Assignment Take the FFT of complete single trial signal. Already provided to you. Remember that FFT has both Real and Imagery Parts. So take real part only, you can also use abs function. Length of FFT window should also be the part of your concept. Vary the fft length and look into its influence on the signal.
71 Fs = 150; % Sampling frequency t = 0:1/Fs:1; % Time vector of 1 second f = 5; % Create a sine wave of f Hz. x = sin(2* pi*t*f); % x = cos(2* pi*t*f); %x = square(2* pi*t*f); nfft = 1024; % Length of FFT % Take fft, padding with zeros so that length(x) X = fft(x,nfft); % second %Power Spectrum of a Sine Wave FFT is symmetric, throw away half X = X(1:nfft/2); % Take the magnitude of fft of x mx = abs(x); % Frequency vector f = (0:nfft/2-1)*Fs/nfft; % Generate the plot, title and labels. subplot (2,1,1) plot(t,x); title('sine Wave Signal'); xlabel('time (s)'); ylabel('amplitude'); subplot(2,1,2) plot(f,mx); title('power Spectrum of a Sine Wave'); xlabel('frequency (Hz)'); ylabel('power');
72 Spectrum Types Magnitude: Amplitude Spectrum Squared magnitude: Power Spectrum Squared magnitude per unit bandwidth: Power Spectral Density Squared magnitude block time length: Energy Spectrum Squared magnitude block length per unit bandwidth: Energy Spectral Density
73 Spectrum Types: When to use Periodic signals (discrete frequencies): Amplitude or Power Spectrum Broadband random signals: Power Spectral Density Transient Signals: Energy Spectral Density
74 Averaging in Spectrum Combine multiple time blocks together to form one spectral estimate Random data: higher average number, better estimate of random characteristics
75 Flow diagram
Fourier and Wavelets
 Fourier and Wavelets Why do we need a Transform? Fourier Transform and the short term Fourier (STFT) Heisenberg Uncertainty Principle The continues Wavelet Transform Discrete Wavelet Transform Wavelets
Discrete Fourier Transform (DFT)
") Amplitude Amplitude Discrete Fourier Transform (DFT) DFT transforms the time domain signal samples to the frequency domain components. DFT Signal Spectrum Time Frequency DFT is often used to do frequency
Amplitude Amplitude Discrete Fourier Transform (DFT) DFT transforms the time domain signal samples to the frequency domain components. DFT Signal Spectrum Time Frequency DFT is often used to do frequency
DFT: Discrete Fourier Transform & Linear Signal Processing
 DFT: Discrete Fourier Transform & Linear Signal Processing 2 nd Year Electronics Lab IMPERIAL COLLEGE LONDON Table of Contents Equipment... 2 Aims... 2 Objectives... 2 Recommended Textbooks... 3 Recommended
LABORATORY - FREQUENCY ANALYSIS OF DISCRETE-TIME SIGNALS
 LABORATORY - FREQUENCY ANALYSIS OF DISCRETE-TIME SIGNALS INTRODUCTION The objective of this lab is to explore many issues involved in sampling and reconstructing signals, including analysis of the frequency
TRANSFORMS / WAVELETS
 RANSFORMS / WAVELES ransform Analysis Signal processing using a transform analysis for calculations is a technique used to simplify or accelerate problem solution. For example, instead of dividing two
The Discrete Fourier Transform. Claudia Feregrino-Uribe, Alicia Morales-Reyes Original material: Dr. René Cumplido
 The Discrete Fourier Transform Claudia Feregrino-Uribe, Alicia Morales-Reyes Original material: Dr. René Cumplido CCC-INAOE Autumn 2015 The Discrete Fourier Transform Fourier analysis is a family of mathematical
Introduction to Wavelet Transform. Chapter 7 Instructor: Hossein Pourghassem
 Introduction to Wavelet Transform Chapter 7 Instructor: Hossein Pourghassem Introduction Most of the signals in practice, are TIME-DOMAIN signals in their raw format. It means that measured signal is a
Signals A Preliminary Discussion EE442 Analog & Digital Communication Systems Lecture 2
 Signals A Preliminary Discussion EE442 Analog & Digital Communication Systems Lecture 2 The Fourier transform of single pulse is the sinc function. EE 442 Signal Preliminaries 1 Communication Systems and
EE216B: VLSI Signal Processing. Wavelets. Prof. Dejan Marković Shortcomings of the Fourier Transform (FT)
") 5//0 EE6B: VLSI Signal Processing Wavelets Prof. Dejan Marković ee6b@gmail.com Shortcomings of the Fourier Transform (FT) FT gives information about the spectral content of the signal but loses all time
5//0 EE6B: VLSI Signal Processing Wavelets Prof. Dejan Marković ee6b@gmail.com Shortcomings of the Fourier Transform (FT) FT gives information about the spectral content of the signal but loses all time
SAMPLING THEORY. Representing continuous signals with discrete numbers
 SAMPLING THEORY Representing continuous signals with discrete numbers Roger B. Dannenberg Professor of Computer Science, Art, and Music Carnegie Mellon University ICM Week 3 Copyright 2002-2013 by Roger
ELT COMMUNICATION THEORY
 ELT 41307 COMMUNICATION THEORY Matlab Exercise #1 Sampling, Fourier transform, Spectral illustrations, and Linear filtering 1 SAMPLING The modeled signals and systems in this course are mostly analog (continuous
Introduction to Wavelets Michael Phipps Vallary Bhopatkar
 Introduction to Wavelets Michael Phipps Vallary Bhopatkar *Amended from The Wavelet Tutorial by Robi Polikar, http://users.rowan.edu/~polikar/wavelets/wttutoria Who can tell me what this means? NR3, pg
Laboratory Assignment 4. Fourier Sound Synthesis
 Laboratory Assignment 4 Fourier Sound Synthesis PURPOSE This lab investigates how to use a computer to evaluate the Fourier series for periodic signals and to synthesize audio signals from Fourier series
Electrical & Computer Engineering Technology
 Electrical & Computer Engineering Technology EET 419C Digital Signal Processing Laboratory Experiments by Masood Ejaz Experiment # 1 Quantization of Analog Signals and Calculation of Quantized noise Objective:
It is the speed and discrete nature of the FFT that allows us to analyze a signal's spectrum with MATLAB.
 MATLAB Addendum on Fourier Stuff 1. Getting to know the FFT What is the FFT? FFT = Fast Fourier Transform. The FFT is a faster version of the Discrete Fourier Transform(DFT). The FFT utilizes some clever
ME scope Application Note 01 The FFT, Leakage, and Windowing
 INTRODUCTION ME scope Application Note 01 The FFT, Leakage, and Windowing NOTE: The steps in this Application Note can be duplicated using any Package that includes the VES-3600 Advanced Signal Processing
EE 215 Semester Project SPECTRAL ANALYSIS USING FOURIER TRANSFORM
 EE 215 Semester Project SPECTRAL ANALYSIS USING FOURIER TRANSFORM Department of Electrical and Computer Engineering Missouri University of Science and Technology Page 1 Table of Contents Introduction...Page
6.02 Practice Problems: Modulation & Demodulation
 1 of 12 6.02 Practice Problems: Modulation & Demodulation Problem 1. Here's our "standard" modulation-demodulation system diagram: at the transmitter, signal x[n] is modulated by signal mod[n] and the
Outline. Introduction to Biosignal Processing. Overview of Signals. Measurement Systems. -Filtering -Acquisition Systems (Quantisation and Sampling)
") Outline Overview of Signals Measurement Systems -Filtering -Acquisition Systems (Quantisation and Sampling) Digital Filtering Design Frequency Domain Characterisations - Fourier Analysis - Power Spectral
Outline Overview of Signals Measurement Systems -Filtering -Acquisition Systems (Quantisation and Sampling) Digital Filtering Design Frequency Domain Characterisations - Fourier Analysis - Power Spectral
INDEX TO SERIES OF TUTORIALS TO WAVELET TRANSFORM BY ROBI POLIKAR THE ENGINEER'S ULTIMATE GUIDE TO WAVELET ANALYSIS ROBI POLIKAR
 INDEX TO SERIES OF TUTORIALS TO WAVELET TRANSFORM BY ROBI POLIKAR THE ENGINEER'S ULTIMATE GUIDE TO WAVELET ANALYSIS THE WAVELET TUTORIAL by ROBI POLIKAR Also visit Rowan s Signal Processing and Pattern
L A B 3 : G E N E R A T I N G S I N U S O I D S
 L A B 3 : G E N E R A T I N G S I N U S O I D S NAME: DATE OF EXPERIMENT: DATE REPORT SUBMITTED: 1/7 1 THEORY DIGITAL SIGNAL PROCESSING LABORATORY 1.1 GENERATION OF DISCRETE TIME SINUSOIDAL SIGNALS IN
Objectives. Presentation Outline. Digital Modulation Lecture 03
 Digital Modulation Lecture 03 Inter-Symbol Interference Power Spectral Density Richard Harris Objectives To be able to discuss Inter-Symbol Interference (ISI), its causes and possible remedies. To be able
Lab 8. Signal Analysis Using Matlab Simulink
 E E 2 7 5 Lab June 30, 2006 Lab 8. Signal Analysis Using Matlab Simulink Introduction The Matlab Simulink software allows you to model digital signals, examine power spectra of digital signals, represent
THE CITADEL THE MILITARY COLLEGE OF SOUTH CAROLINA. Department of Electrical and Computer Engineering. ELEC 423 Digital Signal Processing
 THE CITADEL THE MILITARY COLLEGE OF SOUTH CAROLINA Department of Electrical and Computer Engineering ELEC 423 Digital Signal Processing Project 2 Due date: November 12 th, 2013 I) Introduction In ELEC
Signals and Systems Lecture 9 Communication Systems Frequency-Division Multiplexing and Frequency Modulation (FM)
") Signals and Systems Lecture 9 Communication Systems Frequency-Division Multiplexing and Frequency Modulation (FM) April 11, 2008 Today s Topics 1. Frequency-division multiplexing 2. Frequency modulation
Signals and Systems Lecture 9 Communication Systems Frequency-Division Multiplexing and Frequency Modulation (FM) April 11, 2008 Today s Topics 1. Frequency-division multiplexing 2. Frequency modulation
Signal Processing for Digitizers
 Signal Processing for Digitizers Modular digitizers allow accurate, high resolution data acquisition that can be quickly transferred to a host computer. Signal processing functions, applied in the digitizer
VU Signal and Image Processing. Torsten Möller + Hrvoje Bogunović + Raphael Sahann
 052600 VU Signal and Image Processing Torsten Möller + Hrvoje Bogunović + Raphael Sahann torsten.moeller@univie.ac.at hrvoje.bogunovic@meduniwien.ac.at raphael.sahann@univie.ac.at vda.cs.univie.ac.at/teaching/sip/17s/
DISCRETE FOURIER TRANSFORM AND FILTER DESIGN
 DISCRETE FOURIER TRANSFORM AND FILTER DESIGN N. C. State University CSC557 Multimedia Computing and Networking Fall 2001 Lecture # 03 Spectrum of a Square Wave 2 Results of Some Filters 3 Notation 4 x[n]
Fourier Methods of Spectral Estimation
 Department of Electrical Engineering IIT Madras Outline Definition of Power Spectrum Deterministic signal example Power Spectrum of a Random Process The Periodogram Estimator The Averaged Periodogram Blackman-Tukey
Department of Electronic Engineering NED University of Engineering & Technology. LABORATORY WORKBOOK For the Course SIGNALS & SYSTEMS (TC-202)
") Department of Electronic Engineering NED University of Engineering & Technology LABORATORY WORKBOOK For the Course SIGNALS & SYSTEMS (TC-202) Instructor Name: Student Name: Roll Number: Semester: Batch:
Department of Electronic Engineering NED University of Engineering & Technology LABORATORY WORKBOOK For the Course SIGNALS & SYSTEMS (TC-202) Instructor Name: Student Name: Roll Number: Semester: Batch:
Signal Processing. Naureen Ghani. December 9, 2017
 Signal Processing Naureen Ghani December 9, 27 Introduction Signal processing is used to enhance signal components in noisy measurements. It is especially important in analyzing time-series data in neuroscience.
Signal Processing Toolbox
 Signal Processing Toolbox Perform signal processing, analysis, and algorithm development Signal Processing Toolbox provides industry-standard algorithms for analog and digital signal processing (DSP).
Frequency Domain Representation of Signals
 Frequency Domain Representation of Signals The Discrete Fourier Transform (DFT) of a sampled time domain waveform x n x 0, x 1,..., x 1 is a set of Fourier Coefficients whose samples are 1 n0 X k X0, X
Complex Sounds. Reading: Yost Ch. 4
 Complex Sounds Reading: Yost Ch. 4 Natural Sounds Most sounds in our everyday lives are not simple sinusoidal sounds, but are complex sounds, consisting of a sum of many sinusoids. The amplitude and frequency
Fourier Signal Analysis
 Part 1B Experimental Engineering Integrated Coursework Location: Baker Building South Wing Mechanics Lab Experiment A4 Signal Processing Fourier Signal Analysis Please bring the lab sheet from 1A experiment
DCSP-10: DFT and PSD. Jianfeng Feng. Department of Computer Science Warwick Univ., UK
 DCSP-10: DFT and PSD Jianfeng Feng Department of Computer Science Warwick Univ., UK Jianfeng.feng@warwick.ac.uk http://www.dcs.warwick.ac.uk/~feng/dcsp.html DFT Definition: The discrete Fourier transform
6 Sampling. Sampling. The principles of sampling, especially the benefits of coherent sampling
 Note: Printed Manuals 6 are not in Color Objectives This chapter explains the following: The principles of sampling, especially the benefits of coherent sampling How to apply sampling principles in a test
Islamic University of Gaza. Faculty of Engineering Electrical Engineering Department Spring-2011
 Islamic University of Gaza Faculty of Engineering Electrical Engineering Department Spring-2011 DSP Laboratory (EELE 4110) Lab#4 Sampling and Quantization OBJECTIVES: When you have completed this assignment,
Fourier Transform. Prepared by :Eng. Abdo Z Salah
 Fourier Transform Prepared by :Eng. Abdo Z Salah What is Fourier analysis?? Fourier Analysis is based on the premise that any arbitrary signal can be constructed using a bunch of sine and cosine waves.
Sampling and Reconstruction of Analog Signals
 Sampling and Reconstruction of Analog Signals Chapter Intended Learning Outcomes: (i) Ability to convert an analog signal to a discrete-time sequence via sampling (ii) Ability to construct an analog signal
ANALOGUE AND DIGITAL COMMUNICATION
 ANALOGUE AND DIGITAL COMMUNICATION Syed M. Zafi S. Shah Umair M. Qureshi Lecture xxx: Analogue to Digital Conversion Topics Pulse Modulation Systems Advantages & Disadvantages Pulse Code Modulation Pulse
Project 0: Part 2 A second hands-on lab on Speech Processing Frequency-domain processing
 Project : Part 2 A second hands-on lab on Speech Processing Frequency-domain processing February 24, 217 During this lab, you will have a first contact on frequency domain analysis of speech signals. You
1. In the command window, type "help conv" and press [enter]. Read the information displayed.
![1. In the command window, type help conv and press [enter]. Read the information displayed.](/thumbs/82/86785923.jpg "1. In the command window, type help conv and press [enter]. Read the information displayed.") ECE 317 Experiment 0 The purpose of this experiment is to understand how to represent signals in MATLAB, perform the convolution of signals, and study some simple LTI systems. Please answer all questions
ECE 317 Experiment 0 The purpose of this experiment is to understand how to represent signals in MATLAB, perform the convolution of signals, and study some simple LTI systems. Please answer all questions
Chapter-2 SAMPLING PROCESS
 Chapter-2 SAMPLING PROCESS SAMPLING: A message signal may originate from a digital or analog source. If the message signal is analog in nature, then it has to be converted into digital form before it can
The Fast Fourier Transform
 The Fast Fourier Transform Basic FFT Stuff That s s Good to Know Dave Typinski, Radio Jove Meeting, July 2, 2014, NRAO Green Bank Ever wonder how an SDR-14 or Dongle produces the spectra that it does?
EE 791 EEG-5 Measures of EEG Dynamic Properties
 EE 791 EEG-5 Measures of EEG Dynamic Properties Computer analysis of EEG EEG scientists must be especially wary of mathematics in search of applications after all the number of ways to transform data is
ECE 201: Introduction to Signal Analysis
 ECE 201: Introduction to Signal Analysis Prof. Paris Last updated: October 9, 2007 Part I Spectrum Representation of Signals Lecture: Sums of Sinusoids (of different frequency) Introduction Sum of Sinusoidal
THE HONG KONG POLYTECHNIC UNIVERSITY Department of Electronic and Information Engineering. EIE2106 Signal and System Analysis Lab 2 Fourier series
 THE HONG KONG POLYTECHNIC UNIVERSITY Department of Electronic and Information Engineering EIE2106 Signal and System Analysis Lab 2 Fourier series 1. Objective The goal of this laboratory exercise is to
Chapter 2. Signals and Spectra
 Chapter 2 Signals and Spectra Outline Properties of Signals and Noise Fourier Transform and Spectra Power Spectral Density and Autocorrelation Function Orthogonal Series Representation of Signals and Noise
II Year (04 Semester) EE6403 Discrete Time Systems and Signal Processing
 EE6403 Discrete Time Systems and Signal Processing") Class Subject Code Subject II Year (04 Semester) EE6403 Discrete Time Systems and Signal Processing 1.CONTENT LIST: Introduction to Unit I - Signals and Systems 2. SKILLS ADDRESSED: Listening 3. OBJECTIVE
Class Subject Code Subject II Year (04 Semester) EE6403 Discrete Time Systems and Signal Processing 1.CONTENT LIST: Introduction to Unit I - Signals and Systems 2. SKILLS ADDRESSED: Listening 3. OBJECTIVE
G(f ) = g(t) dt. e i2πft. = cos(2πf t) + i sin(2πf t)
 = g(t) dt. e i2πft. = cos(2πf t) + i sin(2πf t)") Fourier Transforms Fourier s idea that periodic functions can be represented by an infinite series of sines and cosines with discrete frequencies which are integer multiples of a fundamental frequency
Fourier Transforms Fourier s idea that periodic functions can be represented by an infinite series of sines and cosines with discrete frequencies which are integer multiples of a fundamental frequency
Harmonic Analysis. Purpose of Time Series Analysis. What Does Each Harmonic Mean? Part 3: Time Series I
 Part 3: Time Series I Harmonic Analysis Spectrum Analysis Autocorrelation Function Degree of Freedom Data Window (Figure from Panofsky and Brier 1968) Significance Tests Harmonic Analysis Harmonic analysis
Reading: Johnson Ch , Ch.5.5 (today); Liljencrants & Lindblom; Stevens (Tues) reminder: no class on Thursday.
; Liljencrants & Lindblom; Stevens (Tues) reminder: no class on Thursday.") L105/205 Phonetics Scarborough Handout 7 10/18/05 Reading: Johnson Ch.2.3.3-2.3.6, Ch.5.5 (today); Liljencrants & Lindblom; Stevens (Tues) reminder: no class on Thursday Spectral Analysis 1. There are
L105/205 Phonetics Scarborough Handout 7 10/18/05 Reading: Johnson Ch.2.3.3-2.3.6, Ch.5.5 (today); Liljencrants & Lindblom; Stevens (Tues) reminder: no class on Thursday Spectral Analysis 1. There are
Lecture 3 Review of Signals and Systems: Part 2. EE4900/EE6720 Digital Communications
 EE4900/EE6720: Digital Communications 1 Lecture 3 Review of Signals and Systems: Part 2 Block Diagrams of Communication System Digital Communication System 2 Informatio n (sound, video, text, data, ) Transducer
The University of Texas at Austin Dept. of Electrical and Computer Engineering Final Exam
 The University of Texas at Austin Dept. of Electrical and Computer Engineering Final Exam Date: December 18, 2017 Course: EE 313 Evans Name: Last, First The exam is scheduled to last three hours. Open
PYKC 27 Feb 2017 EA2.3 Electronics 2 Lecture PYKC 27 Feb 2017 EA2.3 Electronics 2 Lecture 11-2
 In this lecture, I will introduce the mathematical model for discrete time signals as sequence of samples. You will also take a first look at a useful alternative representation of discrete signals known
Simulation Scenario For Digital Conversion And Line Encoding Of Data Transmission
 Simulation Scenario For Digital Conversion And Line Encoding Of Data Transmission Olutayo Ojuawo Department of Computer Science, The Federal Polytechnic, Ilaro, Ogun State, Nigeria Luis Binotto M.Sc in
FFT analysis in practice
 FFT analysis in practice Perception & Multimedia Computing Lecture 13 Rebecca Fiebrink Lecturer, Department of Computing Goldsmiths, University of London 1 Last Week Review of complex numbers: rectangular
Lecture 3 Complex Exponential Signals
 Lecture 3 Complex Exponential Signals Fundamentals of Digital Signal Processing Spring, 2012 Wei-Ta Chu 2012/3/1 1 Review of Complex Numbers Using Euler s famous formula for the complex exponential The
Signal Characteristics
 Data Transmission The successful transmission of data depends upon two factors:» The quality of the transmission signal» The characteristics of the transmission medium Some type of transmission medium
(i) Understanding of the characteristics of linear-phase finite impulse response (FIR) filters
 Understanding of the characteristics of linear-phase finite impulse response (FIR) filters") FIR Filter Design Chapter Intended Learning Outcomes: (i) Understanding of the characteristics of linear-phase finite impulse response (FIR) filters (ii) Ability to design linear-phase FIR filters according
FIR Filter Design Chapter Intended Learning Outcomes: (i) Understanding of the characteristics of linear-phase finite impulse response (FIR) filters (ii) Ability to design linear-phase FIR filters according
Chapter 5 Window Functions. periodic with a period of N (number of samples). This is observed in table (3.1).
. This is observed in table (3.1).") Chapter 5 Window Functions 5.1 Introduction As discussed in section (3.7.5), the DTFS assumes that the input waveform is periodic with a period of N (number of samples). This is observed in table (3.1).
Chapter 5 Window Functions 5.1 Introduction As discussed in section (3.7.5), the DTFS assumes that the input waveform is periodic with a period of N (number of samples). This is observed in table (3.1).
Lab 3.0. Pulse Shaping and Rayleigh Channel. Faculty of Information Engineering & Technology. The Communications Department
 Faculty of Information Engineering & Technology The Communications Department Course: Advanced Communication Lab [COMM 1005] Lab 3.0 Pulse Shaping and Rayleigh Channel 1 TABLE OF CONTENTS 2 Summary...
2.1 BASIC CONCEPTS Basic Operations on Signals Time Shifting. Figure 2.2 Time shifting of a signal. Time Reversal.
 1 2.1 BASIC CONCEPTS 2.1.1 Basic Operations on Signals Time Shifting. Figure 2.2 Time shifting of a signal. Time Reversal. 2 Time Scaling. Figure 2.4 Time scaling of a signal. 2.1.2 Classification of Signals
EE228 Applications of Course Concepts. DePiero
 EE228 Applications of Course Concepts DePiero Purpose Describe applications of concepts in EE228. Applications may help students recall and synthesize concepts. Also discuss: Some advanced concepts Highlight
Topic 2. Signal Processing Review. (Some slides are adapted from Bryan Pardo s course slides on Machine Perception of Music)
") Topic 2 Signal Processing Review (Some slides are adapted from Bryan Pardo s course slides on Machine Perception of Music) Recording Sound Mechanical Vibration Pressure Waves Motion->Voltage Transducer
Topic 2 Signal Processing Review (Some slides are adapted from Bryan Pardo s course slides on Machine Perception of Music) Recording Sound Mechanical Vibration Pressure Waves Motion->Voltage Transducer
PART I: The questions in Part I refer to the aliasing portion of the procedure as outlined in the lab manual.
 Lab. #1 Signal Processing & Spectral Analysis Name: Date: Section / Group: NOTE: To help you correctly answer many of the following questions, it may be useful to actually run the cases outlined in the
Subtractive Synthesis. Describing a Filter. Filters. CMPT 468: Subtractive Synthesis
 Subtractive Synthesis CMPT 468: Subtractive Synthesis Tamara Smyth, tamaras@cs.sfu.ca School of Computing Science, Simon Fraser University November, 23 Additive synthesis involves building the sound by
Wavelet Transform. From C. Valens article, A Really Friendly Guide to Wavelets, 1999
 Wavelet Transform From C. Valens article, A Really Friendly Guide to Wavelets, 1999 Fourier theory: a signal can be expressed as the sum of a series of sines and cosines. The big disadvantage of a Fourier
Discrete Fourier Transform, DFT Input: N time samples
 EE445M/EE38L.6 Lecture. Lecture objectives are to: The Discrete Fourier Transform Windowing Use DFT to design a FIR digital filter Discrete Fourier Transform, DFT Input: time samples {a n = {a,a,a 2,,a
MUS421/EE367B Applications Lecture 9C: Time Scale Modification (TSM) and Frequency Scaling/Shifting
 and Frequency Scaling/Shifting") MUS421/EE367B Applications Lecture 9C: Time Scale Modification (TSM) and Frequency Scaling/Shifting Julius O. Smith III (jos@ccrma.stanford.edu) Center for Computer Research in Music and Acoustics (CCRMA)
MUS421/EE367B Applications Lecture 9C: Time Scale Modification (TSM) and Frequency Scaling/Shifting Julius O. Smith III (jos@ccrma.stanford.edu) Center for Computer Research in Music and Acoustics (CCRMA)
(i) Understanding of the characteristics of linear-phase finite impulse response (FIR) filters
 Understanding of the characteristics of linear-phase finite impulse response (FIR) filters") FIR Filter Design Chapter Intended Learning Outcomes: (i) Understanding of the characteristics of linear-phase finite impulse response (FIR) filters (ii) Ability to design linear-phase FIR filters according
FIR Filter Design Chapter Intended Learning Outcomes: (i) Understanding of the characteristics of linear-phase finite impulse response (FIR) filters (ii) Ability to design linear-phase FIR filters according
(Time )Frequency Analysis of EEG Waveforms
Frequency Analysis of EEG Waveforms") (Time )Frequency Analysis of EEG Waveforms Niko Busch Charité University Medicine Berlin; Berlin School of Mind and Brain niko.busch@charite.de niko.busch@charite.de 1 / 23 From ERP waveforms to waves
(Time )Frequency Analysis of EEG Waveforms Niko Busch Charité University Medicine Berlin; Berlin School of Mind and Brain niko.busch@charite.de niko.busch@charite.de 1 / 23 From ERP waveforms to waves
ELEC Dr Reji Mathew Electrical Engineering UNSW
 ELEC 4622 Dr Reji Mathew Electrical Engineering UNSW Filter Design Circularly symmetric 2-D low-pass filter Pass-band radial frequency: ω p Stop-band radial frequency: ω s 1 δ p Pass-band tolerances: δ
Digital Signal Processing
 COMP ENG 4TL4: Digital Signal Processing Notes for Lecture #29 Wednesday, November 19, 2003 Correlation-based methods of spectral estimation: In the periodogram methods of spectral estimation, a direct
Signal Processing for Speech Applications - Part 2-1. Signal Processing For Speech Applications - Part 2
 Signal Processing for Speech Applications - Part 2-1 Signal Processing For Speech Applications - Part 2 May 14, 2013 Signal Processing for Speech Applications - Part 2-2 References Huang et al., Chapter
The Scientist and Engineer's Guide to Digital Signal Processing By Steven W. Smith, Ph.D.
 The Scientist and Engineer's Guide to Digital Signal Processing By Steven W. Smith, Ph.D. Home The Book by Chapters About the Book Steven W. Smith Blog Contact Book Search Download this chapter in PDF
Theory of Telecommunications Networks
 Theory of Telecommunications Networks Anton Čižmár Ján Papaj Department of electronics and multimedia telecommunications CONTENTS Preface... 5 1 Introduction... 6 1.1 Mathematical models for communication
DIGITAL COMMUNICATIONS SYSTEMS. MSc in Electronic Technologies and Communications
 DIGITAL COMMUNICATIONS SYSTEMS MSc in Electronic Technologies and Communications Bandpass binary signalling The common techniques of bandpass binary signalling are: - On-off keying (OOK), also known as
B.Tech III Year II Semester (R13) Regular & Supplementary Examinations May/June 2017 DIGITAL SIGNAL PROCESSING (Common to ECE and EIE)
 Regular & Supplementary Examinations May/June 2017 DIGITAL SIGNAL PROCESSING (Common to ECE and EIE)") Code: 13A04602 R13 B.Tech III Year II Semester (R13) Regular & Supplementary Examinations May/June 2017 (Common to ECE and EIE) PART A (Compulsory Question) 1 Answer the following: (10 X 02 = 20 Marks)
Code: 13A04602 R13 B.Tech III Year II Semester (R13) Regular & Supplementary Examinations May/June 2017 (Common to ECE and EIE) PART A (Compulsory Question) 1 Answer the following: (10 X 02 = 20 Marks)
Experiments #6. Convolution and Linear Time Invariant Systems
 Experiments #6 Convolution and Linear Time Invariant Systems 1) Introduction: In this lab we will explain how to use computer programs to perform a convolution operation on continuous time systems and
Signal Processing. Introduction
 Signal Processing 0 Introduction One of the premiere uses of MATLAB is in the analysis of signal processing and control systems. In this chapter we consider signal processing. The final chapter of the
Topic 6. The Digital Fourier Transform. (Based, in part, on The Scientist and Engineer's Guide to Digital Signal Processing by Steven Smith)
") Topic 6 The Digital Fourier Transform (Based, in part, on The Scientist and Engineer's Guide to Digital Signal Processing by Steven Smith) 10 20 30 40 50 60 70 80 90 100 0-1 -0.8-0.6-0.4-0.2 0 0.2 0.4
Topic 6 The Digital Fourier Transform (Based, in part, on The Scientist and Engineer's Guide to Digital Signal Processing by Steven Smith) 10 20 30 40 50 60 70 80 90 100 0-1 -0.8-0.6-0.4-0.2 0 0.2 0.4
REAL-TIME PROCESSING ALGORITHMS
 CHAPTER 8 REAL-TIME PROCESSING ALGORITHMS In many applications including digital communications, spectral analysis, audio processing, and radar processing, data is received and must be processed in real-time.
ECE438 - Laboratory 7a: Digital Filter Design (Week 1) By Prof. Charles Bouman and Prof. Mireille Boutin Fall 2015
 By Prof. Charles Bouman and Prof. Mireille Boutin Fall 2015") Purdue University: ECE438 - Digital Signal Processing with Applications 1 ECE438 - Laboratory 7a: Digital Filter Design (Week 1) By Prof. Charles Bouman and Prof. Mireille Boutin Fall 2015 1 Introduction
Purdue University: ECE438 - Digital Signal Processing with Applications 1 ECE438 - Laboratory 7a: Digital Filter Design (Week 1) By Prof. Charles Bouman and Prof. Mireille Boutin Fall 2015 1 Introduction
FFT Analyzer. Gianfranco Miele, Ph.D
 FFT Analyzer Gianfranco Miele, Ph.D www.eng.docente.unicas.it/gianfranco_miele g.miele@unicas.it Introduction It is a measurement instrument that evaluates the spectrum of a time domain signal applying
The Fundamentals of FFT-Based Signal Analysis and Measurement Michael Cerna and Audrey F. Harvey
 Application ote 041 The Fundamentals of FFT-Based Signal Analysis and Measurement Michael Cerna and Audrey F. Harvey Introduction The Fast Fourier Transform (FFT) and the power spectrum are powerful tools
MATLAB for Audio Signal Processing. P. Professorson UT Arlington Night School
 MATLAB for Audio Signal Processing P. Professorson UT Arlington Night School MATLAB for Audio Signal Processing Getting real world data into your computer Analysis based on frequency content Fourier analysis
Signal segmentation and waveform characterization. Biosignal processing, S Autumn 2012
 Signal segmentation and waveform characterization Biosignal processing, 5173S Autumn 01 Short-time analysis of signals Signal statistics may vary in time: nonstationary how to compute signal characterizations?
Contents. Introduction 1 1 Suggested Reading 2 2 Equipment and Software Tools 2 3 Experiment 2
 ECE363, Experiment 02, 2018 Communications Lab, University of Toronto Experiment 02: Noise Bruno Korst - bkf@comm.utoronto.ca Abstract This experiment will introduce you to some of the characteristics
Experiment 8: Sampling
 Prepared By: 1 Experiment 8: Sampling Objective The objective of this Lab is to understand concepts and observe the effects of periodically sampling a continuous signal at different sampling rates, changing
Problem Set 1 (Solutions are due Mon )
") ECEN 242 Wireless Electronics for Communication Spring 212 1-23-12 P. Mathys Problem Set 1 (Solutions are due Mon. 1-3-12) 1 Introduction The goals of this problem set are to use Matlab to generate and
ECEN 242 Wireless Electronics for Communication Spring 212 1-23-12 P. Mathys Problem Set 1 (Solutions are due Mon. 1-3-12) 1 Introduction The goals of this problem set are to use Matlab to generate and
Massachusetts Institute of Technology Dept. of Electrical Engineering and Computer Science Spring Semester, Introduction to EECS 2
 Massachusetts Institute of Technology Dept. of Electrical Engineering and Computer Science Spring Semester, 2007 6.082 Introduction to EECS 2 Lab #3: Modulation and Filtering Goal:... 2 Instructions:...
Digital Signal Processing. VO Embedded Systems Engineering Armin Wasicek WS 2009/10
 Digital Signal Processing VO Embedded Systems Engineering Armin Wasicek WS 2009/10 Overview Signals and Systems Processing of Signals Display of Signals Digital Signal Processors Common Signal Processing
Design of FIR Filter for Efficient Utilization of Speech Signal Akanksha. Raj 1 Arshiyanaz. Khateeb 2 Fakrunnisa.Balaganur 3
 IJSRD - International Journal for Scientific Research & Development Vol. 3, Issue 03, 2015 ISSN (online): 2321-0613 Design of FIR Filter for Efficient Utilization of Speech Signal Akanksha. Raj 1 Arshiyanaz.
From Fourier Series to Analysis of Non-stationary Signals - VII
 From Fourier Series to Analysis of Non-stationary Signals - VII prof. Miroslav Vlcek November 23, 2010 Contents Short Time Fourier Transform 1 Short Time Fourier Transform 2 Contents Short Time Fourier
EE 422G - Signals and Systems Laboratory
 EE 422G - Signals and Systems Laboratory Lab 3 FIR Filters Written by Kevin D. Donohue Department of Electrical and Computer Engineering University of Kentucky Lexington, KY 40506 September 19, 2015 Objectives:
Biomedical Instrumentation B2. Dealing with noise
 Biomedical Instrumentation B2. Dealing with noise B18/BME2 Dr Gari Clifford Noise & artifact in biomedical signals Ambient / power line interference: 50 ±0.2 Hz mains noise (or 60 Hz in many data sets)
Introduction to Wavelets. For sensor data processing
 Introduction to Wavelets For sensor data processing List of topics Why transform? Why wavelets? Wavelets like basis components. Wavelets examples. Fast wavelet transform. Wavelets like filter. Wavelets
Digital Image Processing
 In the Name of Allah Digital Image Processing Introduction to Wavelets Hamid R. Rabiee Fall 2015 Outline 2 Why transform? Why wavelets? Wavelets like basis components. Wavelets examples. Fast wavelet transform.