Acousonde TM Acoustic Tag Calibration at the Transducer Evaluation Center (TRANSDEC)
|
|
|
- Kevin Alexander
- 6 years ago
- Views:
Transcription
 Sean M.")

1 Acousonde TM Acoustic Tag Calibration at the Transducer Evaluation Center (TRANSDEC) Sean M. Wiggins Marine Physical Laboratory Scripps Institution of Oceanography University of California San Diego La Jolla, California / MPL TM-543 May
2 Executive Summary Calibration of the Acousonde TM acoustic recording tag was conducted at the U.S. Navy s SPAWAR SSC Pacific Transducer Evaluation Center (TRANSDEC) in San Diego. Data were collected on November 2012, using four Acousonde TM model 3B acoustic tags. The acoustic recorder in the Acousonde TM 3B consists of two separate channels, a low-power channel (LPC) and a high-frequency channel (HFC) with sample rates up to 25,811 Hz and 232,302 Hz, respectively. Four primary tests were conducted: LPC transfer function (TF), HFC transfer function, short-axis rotation beam pattern and longaxis rotation beam pattern. The LPC measured TF appears to be in good agreement with the expected TF below ~1-2 khz, above which the measured TF can be 5 10 db below the expected values. The general shapes of the measured HFC TFs follow the expected TFs, but acoustic shadowing and constructive and destructive interference from elements within each tag may result in peaks and notches in their frequency response. From the short-axis beam pattern tests, acoustic shadowing from the tag s syntactic foam flotation appears to be the dominant cause of reduced received levels by 15 db or more. For both the short- and long-axis tests, an acoustic shadowing effect of the battery housing is observed. To a lesser extent, constructive and destructive interference (i.e. ~ ± 6dB), potentially caused by elements within the tag, contributed to received level variability in all tests. These variations in beam pattern illustrate the challenge of using Acousonde TM recordings for studies requiring absolute received levels for frequencies above about 1 khz. Introduction Calibrated measurements of sound pressure levels in the ocean are useful for studying source levels of underwater sounds, acoustic propagation and ambient noise. Recent developments of compact Passive Acoustic Monitoring (PAM) devices allow for their attachment to marine mammals and include other sensors to measure animal movement. One such compact PAM recorder, or acoustic tag, is the Acousonde developed by Bill Burgess at Greeneridge Sciences, Inc. ( In this report, I describe the acoustic calibration of Acousonde conducted over a wide range of frequencies and orientations. All data processing and resulting plots were conducted using the high-level language technical computing software package MATLAB (The MathWorks Inc., Natick, MA). Methods Autonomous underwater acoustic recorders typically include hydrophone sensors, amplifiers, filters, digitizers, data storage and a computer to control these components. Individual components and subsystems can be bench-tested to verify design specifications, but a full system in-water test with calibrated sound sources provides a more complete description of the acoustic recorder s response. For this reason, we chose to conduct an in-water test of the Acousonde TM using the U.S. Navy s SPAWAR SSC Pacific Transducer Evaluation Center (TRANSDEC) located in San Diego. Data were collected on November 2012, using four Acousonde TM model 3B acoustic tags. 2
3 Acousonde 3B The Acousonde TM 3B (Appendix A1 & A2) is a compact, self-contained autonomous acoustic underwater recorder often configured as a marine mammal tag with suction cup attachments to record sounds as well as dive depth, 3-dimensional tilt, and compass heading. The acoustic recorder in the Acousonde TM 3B consists of two separate channels sampled at 16-bits: low-power channel (LPC) and high-frequency channel (HFC). Only one channel can be recorded at a time. The LPC can sample up to 25,811 Hz; whereas, the HFC can sample up to 232,302 Hz. Using the filter and saturation design specifications (Appendix A1), the system frequency response for the two channels can be estimated as transfer functions (TF) from analog-to-digital converter (ADC) integer counts to pressure levels (µpa) (Figures 1 and 2). Figure 1. Acousonde TM low-power channel (LPC) design specified transfer function ADC integer counts to pressure levels (µpa). The LPC can sample up to 25,811 Hz with gains of 0 or +20 db using a hydrophone sensor with -201 db re 1 V/µPa sensitivity and recording system nominal saturation at 0 db gain of 187 db re 1 µpa 0-peak. The LPC uses a single-pole high-pass filter (HPF) with a cutoff frequency (-3 db) at 22 Hz and an 8- pole elliptic low-pass filter (LPF) with a cutoff frequency (-3 db) at 9.2 khz and -22 db cutoff at 11.1 khz at maximum sample rate (Appendix A1). Linear Technology s LTC is used to provide the elliptic LPF and is specified with steep attenuation beyond the passband (42 1.3f cutoff ) and low ripple in the passband (±0.1dB up to 0.9f cutoff ). ADC uses signed 16-bit (int16) which has values to or 90 db re counts 0-peak. 3
4 Figure 2. Acousonde TM high-frequency channel (HFC) design specified transfer function ADC integer counts to pressure levels (µpa). The HFC can sample up to 232,302 Hz with gains of 0 or +20 db using a hydrophone with -204 db re 1 V/µPa sensitivity and recording system nominal saturation at 0 db gain of 172 db re 1 µpa 0-peak. The HFC uses a single-pole high-pass filter (HPF) with a cutoff frequency (-3 db) at 10 khz and a 6- pole linear-phase low-pass filter (LPF) with a cutoff frequency (-3 db) at 42 khz and -22 db cutoff at 100 khz (Appendix A1). Four Acousondes were used during the calibration tests (Table 1). Four primary tests were conducted: LPC transfer function, HFC transfer function, short-axis rotation beam pattern and long-axis rotation beam pattern. Tags A-D were used in LPC tests; whereas, only tags A, B and D were used in HFC tests. Tag D was used for both the short-axis and long-axis beam pattern tests. Note that tag A has a different sensitivity and TF for the LPC than the other tags (Table 1). 4
![Table 1. Four Acousondes used during calibration tests. Tag Serial ID Number calmin/calmax LPC [mpa] LPC TF [db re counts/ µpa] A B006-104090829e-01 1040876522e-02-110.](/docs-images/75/71959686/images/5-0.jpg "0 calmin/calmax HFC [mpa] HFC TF [db re counts/ µpa] Tests -893845504e-03 0893818226e-03-88.7 LPC,HFC B B008-214990848e-02 0214984287e-02-96.3-805863424e-03 0805838831e-03-87.")
5 Table 1. Four Acousondes used during calibration tests. Tag Serial ID Number calmin/calmax LPC [mpa] LPC TF [db re counts/ µpa] A B e e calmin/calmax HFC [mpa] HFC TF [db re counts/ µpa] Tests e e LPC,HFC B B e e e e LPC,HFC C B e e LPC D B e e e e LPC,HFC short,long For the LPC and HFC tests, the tags were attached to a nylon line, 30 cm apart with Scotch 33+ electrical tape and a weight was attached to the bitter end of the line to hold the line straight after lowering the tag array into the calibration pool (Figure 3). A mark was placed on the support line 5.5 m away from the center of the array of tags for vertical positioning (fixed depth) relative to the acoustic projector during calibration tests. Figure 3. Tag attachment to vertical support line. Both short- and long-axis rotation beam patterns tests were conducted by attaching tag D to a rotating pole with a known rate of revolution and placing the hydrophone sensor at 5.5m depth below the water s surface (Figures 4A and B). 5

.")
6 A B Figure 4. Attachments for (A) short- and (B) long-axis rotation beam pattern tests. The recorded acoustic data were saved in *.MT format files and offloaded to a personal computer via the USB port in the tag. The data files were converted into standard acoustic wav files for processing using a custom-developed MATLAB script (Appendix A3) to call the MTRead.m function provided by Greeneridge Sciences ( The script was provided by Erin Oleson and Megan McKenna, and was modified to produce wav files with ADC integer count values by applying the inverse Acousonde calibration values found in the header of *.MT files, which were previously applied during the call to MTRead.m. Also, the names of the wav files were changed to include the date and time of the first sample (e.g., MTfilename_YYMMDD-hhmmss.wav) so that they could be more easily processed, for example, using the acoustic analysis software tool, Triton (Wiggins and Hildebrand, 2007). TRANSDEC The U.S. Navy s SPAWAR SSC Pacific Transducer Evaluation Center (TRANSDEC) is a controlled environment, low ambient noise transducer calibration and underwater acoustic test facility. The anechoic pool (300 ft x 200 ft x 38 ft deep) contains 6 million gallons of chemically treated fresh water which is continuously circulated to maintain isothermal conditions (Figure 5). 6

7 Figure 5. Aerial view of TRANSDEC anechoic pool with building at mid-pool on crossbeam structure (photo: Google maps). At the center of the pool is a building which houses electronics, computers, calibrated hydrophones and acoustic projectors. In the center of the building, the floor can be removed to gain access to the pool to deploy hydrophones for calibrated tests. Three different acoustic projectors were used to transmit pulses at known frequencies, pressure levels and distances to the test tags. Different projectors are needed to span the wide band of frequencies that Acousonde TM is capable of recording. All projectors were positioned 5.5m below the air/water surface to minimize reflections. The low frequency projector was a J13 which was used to generate 150ms pulses from 30 Hz to 1200 Hz in 10 Hz steps at a nominal range of 0.5m from the array of tags (Appendix A4). An ITC projector was used for the mid-frequency range with 5.5ms pulses from 1 khz to 30 khz in 100Hz steps and at a range of 2.0m from the tags (Appendix A5). The projector used for the high frequency test was an ITC-1042 with 600µs pulses from 25 khz to 120 khz in 500Hz steps at a range of 2.0m from the tags (Appendix A6). The ITC-1042 projector was also used in the beam pattern tests with 600 µs pulses at three discrete frequencies, 25, 50, and 75 khz with rotations about the short- and longaxis of the tag (Figures 4A & B). The source levels for the three frequencies were held constant at 150, 153, and 154 db rms re 1 1m, respectively, with 2.0 m separation between the projector and the tag. The pole on which the tags were attached rotated counter-clockwise when viewed from above at the rate of ~ 1º / s. Tests were started at 260º relative to the tag where 0º was when the battery housing cap was closest to the 7
8 projector for the short-axis test and where 0º was when the side opposite the suction cups was closest to the projector for the long-axis test. The tests rotated the tag past one full revolution to 270º and times every 45º were noted. The projectors transmit voltage responses (TVR) at 1m was used to estimate transmitted source levels (SL) based on the recorded drive voltage levels (root-mean-squared rms) applied to the projectors at specified frequencies. The source level was then converted to estimated receive level (RL) at the tag by applying a transmission loss (TL) based on distance between projector and tag assuming spherical spreading (i.e., TL = 20*log 10 (range[m]) ). At 0.5m range the TL is +6dB, and at 2.0m the TL is -6dB. For the J13 projector (horizontal range 0.5m), slant ranges were used for TL because tag vertical positions on the line (Figure 3) account for 2-3 db differences in TL. Each projector s TVR was measured using calibrated reference hydrophone H52/43 (Figures 6 8). Figure 6. Low-frequency transmit voltage response (TVR) for J13 measured using calibrated reference hydrophone H52/43. The drive voltage in db is added to the TVR to estimate source (projector) sound pressure levels at 1m. Frequency range is 30 Hz 1200Hz, with a peak ~ 150Hz and larger uncertainty above 800 Hz. 8
9 Figure 7. Mid-frequency transmit voltage response (TVR) for ITC-1007 measured using calibrated reference hydrophone H52/43. The drive voltage in db is added to the TVR to estimate source (projector) sound pressure levels at 1m. Frequency range is 1 khz 30 khz with a peak ~ 11 khz. 9
10 Figure 8. High frequency transmit voltage response (TVR) for ITC-1042 measured using calibrated reference hydrophone H52/43. The drive voltage in db is added to the TVR to estimate source (projector) sound pressure levels at 1m. Frequency range is 25 khz 120 khz with a peak ~ 80 khz[jh1]. 10
11 Calibration Test Processing On November 2012, Acousonde TM calibration tests were conducted at TRANSDEC using 15 transmission runs from three projectors ranging from 30 Hz to 120 khz. In a few of the runs, the source level was too low, or the drive voltage was incorrect precluding these runs from being used for analysis; however, the remaining recordings provided sufficient data to cover the full range of frequency and beam pattern tests, including some redundant tests. Each transmission run consists of a series of pulses with known drive voltages at known source frequencies. These rms drive voltages were converted into projected peak-to-peak (pp) sound pressure levels (SPL db re 1 µpa) at the receiving hydrophone (i.e., tag) via the projector TVR values (Figures 6 8), the rms to peak-to-peak conversion factor of 9 db re pp/rms, and the distance TL expressed as db re 1 m. The tag measured receive levels (RL db re counts) are computed as peak-to-peak values from the tags waveform recordings of the individual pulses. The difference of RL to SPL provides the measured TF (db re counts/ µpa) and was compared to the manufacturer s specified design (expected) TFs (Figures 1 & 2). Since each transmission run consists of a series of many pulses, an automated method was developed to measure pp amplitude in the recorded waveforms (Figure 9). The algorithm consisted of a time series threshold detector executed at specific time offsets. The amplitude threshold was set after reviewing pulses in the recorded time series to make sure that the detector would trigger on the pulses, but not on the background noise. The first temporal offset provided a lock out time between successive detections based on the pulse rate of the transmission run. The second temporal offset was based on the pulse duration and was used to select a period to measure the pp amplitude near the middle of the pulse away from any transients near the start or end of the pulse (Figure 10). 11
12 Figure 9. Example linear received level (RL) time series showing recorded pulses and detector algorithm measured (red asterisks) peak-to-peak amplitude values (top panel). Logarithmic base10 RL as a function of pulse frequency (bottom panel). Data are raw pp ADC count values for tag A for pulses from projector J13 and have not been corrected for sensitivity or transmission losses. Note that the measured peak-to-peak RL values avoid the startup transient and are not always the maximum and minimum values for a given pulse (see Figure 10). 12
13 Figure 10. Example of linear received levels (RL) recorded and detector algorithm measured (red asterisks) peak-to-peak amplitude values for tag A and pulses from projector J13. Note that the maximum and minimum of the pulse are near the beginning of the pulse and are caused by projector system startup transient. The algorithm that measured peak-to-peak values avoids the pulse-end transients by choosing values near the middle of the pulse duration. 13
14 Results Transfer Function Frequency Response The system frequency response, or inverse sensitivity, was computed and displayed (Figures 11 and 12) as a TF (db re counts/µpa) so that comparisons can be made to the manufacturer s specified design (expected) TF for the LPC using four tags and the HFC using three tags (Table 1). The measured LPC TFs had good agreement with the expected TF s for the J13 ( Hz) test at mid-band, but show an increase in variability near the ends of the band (Figure 11, black circles). At higher frequencies (> 1 khz) during the ITC-1007 projector tests, the measured TFs progressively decrease in levels and increase in variability compared to the expected TFs until the transition band of the LPF above about 10 khz (Figure 11, blue circles). The overall shapes of the measured HFC TFs follow the expected TF shape, with some frequencies in better agreement than others. The measured TFs for the ITC-1007 tests match well with the expected TF at 1 5 khz for tags A and B, but are about 3 db lower than expected for tag D (Figure 12, blue circles). At frequencies above 10 khz, the measured TFs approach the expected values for tags B and D, but not tag A. All three tag TFs have notches around 6 khz, and tag A has a large notch around 23 khz. For the ITC projector tests, tag D s TF shows the best agreement across the band with values that are about 1-3 db low in the khz range (Figure 12, magenta circles). Tag B s TF also shows good agreement above about 65 khz with about ± 5 db variability at the lower frequencies. While the LPF shape is apparent in the TF plot for tag A, the levels are 5 10 db or more lower than the expected TF values, with a severe notch around 55 khz. 14
15 Figure 11. Low power channel (LPC) transfer function (TF) for tags A-D using projector J13 (black circles) and projector ITC-1007 (blue circles). The thin black lines show the expected TF. Note that tag A s expected (design) TF is less sensitive than the other three tags by about 13 db (Table 1). 15
16 Figure 12. High frequency channel (HFC) transfer function (TF) for tags A, B, and D using projector ITC-1007 (blue circles) and projector ITC-1042 (magenta circles). Thin black line shows expected TF and were adjusted per the individual tag s design values (Table 1). 16
17 Beam Patterns A set of three, single-frequency beam patterns was produced using both a short- and a long-axis rotation test (Figures 13 & 14). These polar plots are equivalent to the tag being held stationary (suction cups down for short-axis; battery housing end cap up for longaxis) and the projector being rotated horizontally around the tag counter-clockwise from 260º past 0º and back around to 270º. For the short-axis beam pattern, the tag s HFC hydrophone sensor was near 300º and the battery housing end caps was at 0º. At 25 khz, the -5 db beam width was about 135º wide from about 245º to 20º; whereas for both 50 khz and 75 khz, levels are above -5 db for a width of about 110º from approximately 225º to 335º which puts the center of the beam around 280º for khz (Figure 13). While the beam pattern is narrower for the two higher frequencies, lower levels by about 5 db were recorded during the 25 khz test. In the long-axis beam pattern test, the tag s HFC hydrophone sensor was near 60º and the suction cups were at 180º. The long-axis transition to below -5 db was not as distinct as for the short-axis test (Figure 14). At 25 khz, the -5 db beam was about 260º wide from 200º to 300º around clockwise; whereas, for both 50 khz and 75 khz the -5 db beam width was approximately 285º from about 225º to ~ 300º with more peaks and notches for the 75 khz test. 17
18 A B C D Figure 13. Short-axis beam pattern using ITC-1042 projector. (A) Tag attitude with HFC hydrophone sensor (red asterisk) at ~300º and battery housing end cap at 0º. (B) Beam pattern at 25 khz, (C) 50 khz, and (D) 75 khz. The 0 db circle is when the measured RL (corrected for the TF and TL) is the same as the projected SPL; these levels are respectively 144, 147, and 148 db rms re 1 µpa for the three test frequencies. 18
19 A B C D Figure 14. Long-axis beam pattern using ITC-1042 projector. (A) Tag attitude with HFC hydrophone sensor (red asterisk) at ~60º and suction cups at 180º. (B) Beam pattern at 25 khz, (C) 50 khz, (D) and 75 khz. The 0 db circle is when the measured RL (corrected for the TF and TL) is the same as the projected SPL; these levels are respectively 144, 147, and 148 db rms re 1 µpa for the three test frequencies. 19
20 Discussion Transfer Functions The LPC measured TF appears to be in good agreement with the expected TF below ~1-2 khz, above which the measured TF trend decreases by 5 10 db to the LPF cutoff frequency (Figure 11). This overall decreasing trend may be caused by the tags beam pattern (i.e., acoustic shadowing) because the orientation of the mounted tags on the flexible drop line relative to the projectors was not tightly controlled. In addition, the peak and notch variability shown may be a result of constructive and destructive interference as also observed with the beam pattern tests, although no beam pattern tests were conducted at these lower frequencies. Another possibility for the measured LPC TF shape above ~1 khz could be caused by the LPF because this type of filter (elliptic), which provides steep attenuation above the cutoff frequency, is also known to have significant ripple in the passband, similar to the measured TF. However, the LPF manufacturer s specification sheet shows this component has low ripple in the passband (±0.1dB up to 0.9f cutoff ) suggesting this is not the cause of the observed TF shape. Nonetheless, it would be worthwhile to bench test the frequency response of this component in the lab if this test previously has not been conducted. The general shapes of the measured HFC TFs follow the expected TFs, but potentially acoustic shadowing created the overall lower levels in tag A above 10 khz and in tag D below 10 khz. The peak and notch structure in these TFs is most likely caused by constructive and destructive interference either from components within each tag or between tags on the line. For example, the peak near 30 khz and the notch near 6 khz occur in all three TFs suggesting common geometry within each tag causing the interference gain and reduction. All four TF projector tests (two LPC and two HFC) were conducted with separate tag deployments (i.e., tags on line lowered into the test tank), so attitude of the tag sensors relative to the projectors could be different, which may explain the different TF levels at the same frequencies for different projectors (i.e., Hz and khz) and the different shapes from different interference patterns and different acoustic shadowing across the frequency bands. All three projectors had low TVR levels at the low end of their frequency band (Figures 6, 7, and 8), potentially increasing the uncertainty of the transmitted levels at these frequencies. Both the J13 (LPC Figure 11, black circles) and ITC-1007 (HFC Figure 12, blue circle) show increased variability at the low-frequency ends of their TFs, presumably from higher transmit level uncertainty. However, these uncertainties are at lower levels than those created by tag attitude differences (i.e., acoustic shadowing and constructive/destructive interference). 20
21 Beam Patterns For the short-axis beam pattern test, the sharp drop off in levels around 210º - 230º clockwise around to about 120º for all three frequencies suggests the syntactic foam flotation is providing acoustic shadowing across the khz range. From 120º to about 30º there appears to be shadowing from the battery housing for the 25 khz pings, and extends around to ~330º for 50 and 75 khz (Figure 13). The non-shadowed beam pattern for 25 khz is around 5 db lower than the other two frequencies, perhaps owing to destructive interference caused by the dimension of the non-shadowed region around the HFC sensor (i.e., corner area bounded by the syntactic foam flotation and the battery housing) which is similar to the wavelength at 25 khz (i.e., 0.06 m). For the long-axis beam pattern test, there were decreased levels around 240º to ~ 290º, potentially from acoustic shadowing from the battery housing, and lower levels around 150º to about 90º possibly from shadowing by the tag s main electronic circuit board (Figure 14). While in both short- and long-axis tests acoustic shadowing appeared to reduce received levels, some constructive and destructive interference must also have occurred based on the variability of levels around 0 db of the non-shadowed regions. Conclusions Attitude of the tag relative to the projectors was found to have a significant impact on the recorded received levels for the HFC sensor. From the short-axis beam pattern tests, acoustic shadowing from the tag s syntactic foam flotation appears to be the dominant source of reducing received levels by 15 db or more; whereas, with both the short- and long-axis tests, the acoustic shadowing effect of the battery housing appears to be less than the flotation, probably because of the battery housing s smaller size. To a lesser extent, constructive and destructive interference (i.e. ~ ± 6dB), potentially caused by elements within the tag, contributed to received level variability in all tests. In hindsight, to produce measured TF curves that better match the expected TFs without complications caused by acoustic shadowing, a single tag could be arranged on a rigid pole, such as used for the beam pattern tests, so that the tag s sensor was aimed directly at the projector without any obstruction from the flotation or battery housing; however, constructive and destructive interference likely still would cause received level variability. Furthermore, the lack of attitude control used for the TF tests presented here illustrates the challenge of using Acousonde TM recordings for studies requiring absolute received levels for frequencies above about 1 khz. 21

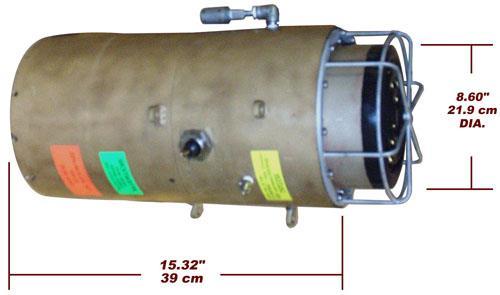
22 Appendix A1. Acousonde TM 3B brochure with performance specifications. 22
23 A2. Acousonde TM 3B diagram. 23
24 A3. MATLAB script MT2wav.m calls Greeneridge Sciences MTRead.m function to convert Acousonde TM *.MT files to standard acoustic wav files. %code to convert.mt files from Bprobes and Acousondes to.wav files for %analysis in Triton %mfm % % put time stamp in filename for Triton (ie wav file time and LTSAs) % converted p units from mpa (after MTRead) back to 16-bit A/D counts because % wavwrite was incorrectly adjusting amplitude values for 32-bit files. % smw % clear all;close all; clc %TAG TYPE prompt1={'enter tag type (1=Acousonde, 2=Bprobe)','Enter Speed: (1=Slow, 2=High)'}; inl = inputdlg(prompt1); flag = str2num(inl{1}); sptype = str2num(inl{2}); %DIRECTORY OF FILES TO PROCESS start_path = 'F:\TRANSDEC2012\'; if flag==1 %acousdonde if sptype == 1 inpath = uigetdir(start_path,'select Directory for MT files'); cd(inpath);d=dir('*s*.mt'); elseif sptype == 2 inpath = uigetdir(start_path,'select Directory for MT files'); cd(inpath);d=dir('*h*.mt'); end outpath = uigetdir(inpath,'select Directory for WAV files'); elseif flag==2 inpath = uigetdir(start_path);cd(inpath);d=dir('*_sound_*.mt'); end %PROCESS MT FILES (loop) disp('please wait...') for ii = 1:length(D); %ii=1; [p,header,info] = MTRead([inpath '\' D(ii).name]); % p2 = p; % convert units to upa from mpa %%%%%%%%%%%%%%%%%%%%%%%%%%%%%%%%%%%%%%%%%%%%%%%%%%%%%%%%%%%%%%%%%%%%%% % 32-bit wavwrite below doesn't preserve the mpa values, it % scales/normalizes in some unknown way, so convert mpa back to A/D counts calmax = str2num(header.calmax); calmin = str2num(header.calmin); % signed integer: bitmin = -(2^(str2num(header.samplebits)-1)); bitmax = (2^(str2num(header.samplebits)-1)) - 1; multiplier = (calmax-calmin)/(bitmax-bitmin); %p = (p - bitmin).*multiplier + calmin; % this converts A/D counts to mpa %in MTRead.m p2 = (p - calmin)./multiplier + bitmin; % convert units from mpa back to A/D counts % % HEADER INFORMATION yy =str2num(header.year); mm=str2num(header.month); dd=str2num(header.day); hh=str2num(header.hours); m=str2num(header.minutes); ss=str2num(header.seconds); strt = datenum(yy, mm, dd, hh, m, ss); n=info.srate; msamp = (length(p2)/n)/60; ftstr = datestr(strt,'yymmdd-hhmmss'); % file time string %write out wavfiles % pout = int32(p2); pout = int16(p2); max(p2);min(p2); if flag==1 % outfilea =(D(ii).name(1:8)); outfilea =[D(ii).name(1:8),'_',ftstr]; % put date/time string in file name for Triton 24
25 % wavwrite(pout,n,32,outfilea) f = fullfile(outpath,outfilea); wavwrite(pout,n,16,f) elseif flag==2 outfileb =(D(ii).name(1:22)); wavwrite(pout,n,32,outfileb) end outdat = char(datestr(strt,'mm/dd/yyyy HH:MM:ss')); if flag == 1 fprintf('%s %s \n',outdat, outfilea); elseif flag==2 fprintf('%s %s \n',outdat, outfileb); end clear p pout p2 %header info outfile outdate end disp('done') 25

26 A4. J13 Projector specifications 26

27 A5. International Transducer Corporation ITC-1007 projector specifications. 27

28 A6. International Transducer Corporation ITC-1042 projector specifications. 28
Marine Mammal Acoustic Tracking from Adapting HARP Technologies
 DISTRIBUTION STATEMENT A. Approved for public release; distribution is unlimited. Marine Mammal Acoustic Tracking from Adapting HARP Technologies Sean M. Wiggins Marine Physical Laboratory, Scripps Institution
Project Report Liquid Robotics, Inc. Integration and Use of a High-frequency Acoustic Recording Package (HARP) on a Wave Glider
 on a Wave Glider") Project Report Liquid Robotics, Inc. Integration and Use of a High-frequency Acoustic Recording Package (HARP) on a Wave Glider Sean M. Wiggins Marine Physical Laboratory Scripps Institution of Oceanography
Project Report Liquid Robotics, Inc. Integration and Use of a High-frequency Acoustic Recording Package (HARP) on a Wave Glider Sean M. Wiggins Marine Physical Laboratory Scripps Institution of Oceanography
DISTRIBUTION STATEMENT A. Approved for public release; distribution is unlimited.
 DISTRIBUTION STATEMENT A. Approved for public release; distribution is unlimited. Glider-based Passive Acoustic Monitoring Techniques in the Southern California Region & West Coast Naval Training Range
The Impact of Very High Frequency Surface Reverberation on Coherent Acoustic Propagation and Modeling
 DISTRIBUTION STATEMENT A. Approved for public release; distribution is unlimited. The Impact of Very High Frequency Surface Reverberation on Coherent Acoustic Propagation and Modeling Grant B. Deane Marine
Numerical Modeling of a Time Reversal Experiment in Shallow Singapore Waters
 Numerical Modeling of a Time Reversal Experiment in Shallow Singapore Waters H.C. Song, W.S. Hodgkiss, and J.D. Skinner Marine Physical Laboratory, Scripps Institution of Oceanography La Jolla, CA 92037-0238,
Effects of transducer geometry and beam spreading on acoustic Doppler velocity measurements near boundaries.
 Effects of transducer geometry and beam spreading on acoustic Doppler velocity measurements near boundaries. Vadim Polonichko and John Romeo SonTek/YSI, Inc., 994 Summers Ridge Rd. San Diego, CA, 92121,
Project Report for Bubbleology Research International, LLC Long-Term Acoustic Monitoring of North Sea Marine Seeps
 Project Report for Bubbleology Research International, LLC Long-Term Acoustic Monitoring of North Sea Marine Seeps Sean M. Wiggins Marine Physical Laboratory Scripps Institution of Oceanography swiggins@ucsd.edu
Using Frequency Diversity to Improve Measurement Speed Roger Dygert MI Technologies, 1125 Satellite Blvd., Suite 100 Suwanee, GA 30024
 Using Frequency Diversity to Improve Measurement Speed Roger Dygert MI Technologies, 1125 Satellite Blvd., Suite 1 Suwanee, GA 324 ABSTRACT Conventional antenna measurement systems use a multiplexer or
Week 1. Signals & Systems for Speech & Hearing. Sound is a SIGNAL 3. You may find this course demanding! How to get through it:
 Signals & Systems for Speech & Hearing Week You may find this course demanding! How to get through it: Consult the Web site: www.phon.ucl.ac.uk/courses/spsci/sigsys (also accessible through Moodle) Essential
DISTRIBUTION STATEMENT A. Approved for public release; distribution is unlimited.
 DISTRIBUTION STATEMENT A. Approved for public release; distribution is unlimited. Glider-based Passive Acoustic Monitoring Techniques in the Southern California Region & West Coast Naval Training Range
FREQUENCY RESPONSE AND LATENCY OF MEMS MICROPHONES: THEORY AND PRACTICE
 APPLICATION NOTE AN22 FREQUENCY RESPONSE AND LATENCY OF MEMS MICROPHONES: THEORY AND PRACTICE This application note covers engineering details behind the latency of MEMS microphones. Major components of
Phased Array Velocity Sensor Operational Advantages and Data Analysis
 Phased Array Velocity Sensor Operational Advantages and Data Analysis Matt Burdyny, Omer Poroy and Dr. Peter Spain Abstract - In recent years the underwater navigation industry has expanded into more diverse
Shallow water limits to hydro-acoustic communication baud rate and bit energy efficiency
 Shallow water limits to hydro-acoustic communication baud rate and bit energy efficiency Nicholas Andronis L3 Oceania Fremantle, Curtin University, ABSTRACT Shallow water hydro-acoustic communication channels
Shallow Water Array Performance (SWAP): Array Element Localization and Performance Characterization
: Array Element Localization and Performance Characterization") Shallow Water Array Performance (SWAP): Array Element Localization and Performance Characterization Kent Scarbrough Advanced Technology Laboratory Applied Research Laboratories The University of Texas
Shallow Water Array Performance (SWAP): Array Element Localization and Performance Characterization Kent Scarbrough Advanced Technology Laboratory Applied Research Laboratories The University of Texas
Gulf of Alaska fin whale calling behavior studied with acoustic tracking
 Gulf of Alaska fin whale calling behavior studied with acoustic tracking Sean M. Wiggins and John A. Hildebrand Marine Physical Laboratory Scripps Institution of Oceanography University of California San
Week I AUDL Signals & Systems for Speech & Hearing. Sound is a SIGNAL. You may find this course demanding! How to get through it: What is sound?
 AUDL Signals & Systems for Speech & Hearing Week I You may find this course demanding! How to get through it: Consult the Web site: www.phon.ucl.ac.uk/courses/spsci/sigsys Essential to do the reading and
Range-Depth Tracking of Sounds from a Single-Point Deployment by Exploiting the Deep-Water Sound Speed Minimum
 DISTRIBUTION STATEMENT A. Approved for public release; distribution is unlimited. Range-Depth Tracking of Sounds from a Single-Point Deployment by Exploiting the Deep-Water Sound Speed Minimum Aaron Thode
group D DSA250 Specifications 2-WAY FULL-RANGE DIGITALLY STEERABLE ARRAY See TABULAR DATA notes for details CONFIGURATION Subsystem Features
 Features 2-Way, full-range loudspeaker for voice and music applications Vertical coverage pattern adjustable to fit the audience area Integral signal processing and amplification Built-in electronic driver
BURIED OBJECT SCANNING SONAR (BOSS)
") BURIED OBJECT SCANNING SONAR (BOSS) The BOSS-SAS (Buried Object Scanning Sonar-Synthetic Aperture Sonar) system is a bottom looking sonar used for the detection and imaging of bottom and buried targets.
BURIED OBJECT SCANNING SONAR (BOSS) The BOSS-SAS (Buried Object Scanning Sonar-Synthetic Aperture Sonar) system is a bottom looking sonar used for the detection and imaging of bottom and buried targets.
Attenuation of low frequency underwater noise using arrays of air-filled resonators
 Attenuation of low frequency underwater noise using arrays of air-filled resonators Mark S. WOCHNER 1 Kevin M. LEE 2 ; Andrew R. MCNEESE 2 ; Preston S. WILSON 3 1 AdBm Corp, 3925 W. Braker Ln, 3 rd Floor,
Passive Acoustic Monitoring for Marine Mammals at Site C in Jacksonville, FL, February August 2014
 Passive Acoustic Monitoring for Marine Mammals at Site C in Jacksonville, FL, February August 2014 A Summary of Work Performed by Amanda J. Debich, Simone Baumann- Pickering, Ana Širović, John A. Hildebrand,
COOMET Pilot Comparison 473/RU-a/09: Comparison of hydrophone calibrations in the frequency range 250 Hz to 200 khz
 COOMET Pilot Comparison 473/RU-a/09: Comparison of hydrophone calibrations in the frequency range 250 Hz to 200 khz Chen Yi 1, A E Isaev 2, Wang Yuebing 1, A M Enyakov 2, Fei Teng 1 and A N Matveev 2 1
ENGINEERING STAFF REPORT. The JBL Model L40 Loudspeaker System. Mark R. Gander, Design Engineer
 James B Lansing Sound, Inc, 8500 Balboa Boulevard, Northridge, California 91329 USA ENGINEERING STAFF REPORT The JBL Model L40 Loudspeaker System Author: Mark R. Gander, Design Engineer ENGINEERING STAFF
Geophysical Applications Seismic Reflection Surveying
 Seismic sources and receivers Basic requirements for a seismic source Typical sources on land and on water Basic impact assessment environmental and social concerns EPS435-Potential-08-01 Basic requirements
Chapter 7. Introduction. Analog Signal and Discrete Time Series. Sampling, Digital Devices, and Data Acquisition
 Chapter 7 Sampling, Digital Devices, and Data Acquisition Material from Theory and Design for Mechanical Measurements; Figliola, Third Edition Introduction Integrating analog electrical transducers with
Beaked Whale Passive Acoustic Tracking Offshore of Cape Hatteras 2017
 Beaked Whale Passive Acoustic Tracking Offshore of Cape Hatteras 2017 Sean M. Wiggins, Bruce J. Thayre, Jenny S. Trickey, Simone Baumann-Pickering, John A. Hildebrand Marine Physical Laboratory Scripps
Radiated Noise of Research Vessels
 Radiated Noise of Research Vessels Greening the Research Fleet Workshop 10 January 2012 Christopher Barber Applied Research Laboratory Penn State University Ship Radiated Noise What makes noise? Propulsion
Application Note 7. Digital Audio FIR Crossover. Highlights Importing Transducer Response Data FIR Window Functions FIR Approximation Methods
 Application Note 7 App Note Application Note 7 Highlights Importing Transducer Response Data FIR Window Functions FIR Approximation Methods n Design Objective 3-Way Active Crossover 200Hz/2kHz Crossover
3. Sound source location by difference of phase, on a hydrophone array with small dimensions. Abstract
 3. Sound source location by difference of phase, on a hydrophone array with small dimensions. Abstract A method for localizing calling animals was tested at the Research and Education Center "Dolphins
NEutrino Mediterranean Observatory
 On line monitoring of underwater acoustic background from 2000 m depth NEutrino Mediterranean Observatory G. Riccobene, for the Collaboration The test site in Catania The Collaboration aims at installing
Active Sonar Wrap-up Exercise (Everyone should attempt to do the following problems and we will go over them in class.)
") Active Sonar Wrap-up Exercise (Everyone should attempt to do the following problems and we will go over them in class.) Name: 1. You are on a new Seawolf class submarine with the sonar system and the environment
Active Sonar Wrap-up Exercise (Everyone should attempt to do the following problems and we will go over them in class.) Name: 1. You are on a new Seawolf class submarine with the sonar system and the environment
Underwater Noise Levels
 TO: FROM: John Callahan Rick Huey Jim Laughlin (206) 440-4643 SUBJECT: Keystone Ferry Terminal Vibratory Pile Monitoring Technical Memorandum. Underwater Noise Levels This memo summarizes the vibratory
Underwater acoustic measurements of the WET-NZ device at Oregon State University s ocean test facility
 Underwater acoustic measurements of the WET-NZ device at Oregon State University s ocean test facility An initial report for the: Northwest National Marine Renewable Energy Center (NNMREC) Oregon State
Passive Acoustic Monitoring for Marine Mammals in the SOCAL Range Complex April 2016 June 2017
 Passive Acoustic Monitoring for Marine Mammals in the SOCAL Range Complex April 2016 June 2017 Ally C. Rice, Simone Baumann-Pickering, Ana Širović, John A. Hildebrand, Macey Rafter, Bruce J. Thayre, Jennifer
PRELIMINARY. group S. MicroWedge MW12 Specifications 2-WAY FULL-RANGE STAGE MONITOR FEATURES DESCRIPTION. CONFIGURATION Subsystem
 FEATURES Highly coherent coaxial design (12-inch LF) Enhanced fidelity and power handling Upgraded transducers and crossover design Switchable single-amp/bi-amp modes Convenient input connector location
Appendix B. Argonaut-SL Principles of Operation
 Appendix B. Argonaut-SL Principles of Operation SonTek/YSI, Inc. This Argonaut-SL System Manual appendix provides an introduction to the operating principles of the SonTek/YSI Argonaut Side-Looking (SL)
NEXT-LAB SENSOR Scritto da Administrator Martedì 24 Settembre :01 - Ultimo aggiornamento Mercoledì 20 Luglio :44 NEXT-LAB SENSOR 1 / 7
 NEXT-LAB SENSOR 1 / 7 3 Diversi strumenti per i moduli NEXT Next-Lab SPL Sensor A high precision sensor for measuring sound pressure - Lab-Bus digital bus - Internal precision ADC 16 Bit - Frequency range
Mid-Frequency Noise Notch in Deep Water. W.S. Hodgkiss / W.A. Kuperman. June 1, 2012 May 31, 2013
 Mid-Frequency Noise Notch in Deep Water W.S. Hodgkiss and W.A. Kuperman June 1, 2012 May 31, 2013 A Proposal to ONR Code 322 Attn: Dr. Robert Headrick, Office of Naval Research BAA 12-001 UCSD 20123651
Acoustic Blind Deconvolution and Frequency-Difference Beamforming in Shallow Ocean Environments
 DISTRIBUTION STATEMENT A. Approved for public release; distribution is unlimited. Acoustic Blind Deconvolution and Frequency-Difference Beamforming in Shallow Ocean Environments David R. Dowling Department
Broadband Temporal Coherence Results From the June 2003 Panama City Coherence Experiments
 Broadband Temporal Coherence Results From the June 2003 Panama City Coherence Experiments H. Chandler*, E. Kennedy*, R. Meredith*, R. Goodman**, S. Stanic* *Code 7184, Naval Research Laboratory Stennis
Chapter 2 Signal Conditioning, Propagation, and Conversion
 09/0 PHY 4330 Instrumentation I Chapter Signal Conditioning, Propagation, and Conversion. Amplification (Review of Op-amps) Reference: D. A. Bell, Operational Amplifiers Applications, Troubleshooting,
Underwater Acoustics Research
 Underwater Acoustics Research Laser Vibrometry Applications to Underwater Sound Field Measurements Paul Lepper & Simon Dible Senior Research Fellow Applied Signal Processing Group Loughborough University
arxiv: v1 [astro-ph.im] 23 Nov 2018
![arxiv: v1 [astro-ph.im] 23 Nov 2018](/thumbs/91/104518967.jpg "arxiv: v1 [astro-ph.im] 23 Nov 2018") arxiv:8.9523v [astro-ph.im] 23 Nov 28 Hydrophone characterization for the KM3NeT experiment Rasa Muller,3,, Sander von Benda-Beckmann 2, Ed Doppenberg, Robert Lahmann 4, and Ernst-Jan Buis on behalf of
arxiv:8.9523v [astro-ph.im] 23 Nov 28 Hydrophone characterization for the KM3NeT experiment Rasa Muller,3,, Sander von Benda-Beckmann 2, Ed Doppenberg, Robert Lahmann 4, and Ernst-Jan Buis on behalf of
Electronic Buzzer for Blind
 EE318 Electronic Design Lab Project Report, EE Dept, IIT Bombay, April 2009 Electronic Buzzer for Blind Group no. B08 Vaibhav Chaudhary (06007018) Anuj Jain (06007019)
Underwater Signal Processing Using ARM Cortex Processor
 Underwater Signal Processing Using ARM Cortex Processor Jahnavi M., Kiran Kumar R. V., Usha Rani N. and M. Srinivasa Rao Abstract: Acoustic signals are the important means of detecting underwater objects.
TARUN K. CHANDRAYADULA Sloat Ave # 3, Monterey,CA 93940
 TARUN K. CHANDRAYADULA 703-628-3298 650 Sloat Ave # 3, cptarun@gmail.com Monterey,CA 93940 EDUCATION George Mason University, Fall 2009 Fairfax, VA Ph.D., Electrical Engineering (GPA 3.62) Thesis: Mode
From Torpedo Fire Control to Sonar at Librascope by Dave Ghen
 From Torpedo Fire Control to Sonar at Librascope by Dave Ghen Librascope made a business decision in the late 1960 s or early 1970 s to try to expand its very successful surface ship and submarine torpedo
6.555 Lab1: The Electrocardiogram
 6.555 Lab1: The Electrocardiogram Tony Hyun Kim Spring 11 1 Data acquisition Question 1: Draw a block diagram to illustrate how the data was acquired. The EKG signal discussed in this report was recorded
PRELIMINARY. group S. M i cro W e dge M W 15 Speci f i cations. 2-Way full-range stage monitor See NOTES TABULAR DATA for details FEATURES DESCRIPTION
 FEATURES Highly coherent coaxial design (15 inch LF) Enhanced fidelity and power handling Upgraded transducers and crossover design Switchable single-amp/bi-amp modes Convenient input connector location
Modeling and Evaluation of Bi-Static Tracking In Very Shallow Water
 Modeling and Evaluation of Bi-Static Tracking In Very Shallow Water Stewart A.L. Glegg Dept. of Ocean Engineering Florida Atlantic University Boca Raton, FL 33431 Tel: (954) 924 7241 Fax: (954) 924-7270
Review of Filter Types
 ECE 440 FILTERS Review of Filters Filters are systems with amplitude and phase response that depends on frequency. Filters named by amplitude attenuation with relation to a transition or cutoff frequency.
Underwater Acoustics. A Brief Introduction. Ethem Mutlu Sözer Research Engineer MIT Sea Grant College Program
 Underwater Acoustics A Brief Introduction By Ethem Mutlu Sözer Research Engineer MIT Sea Grant College Program Table of Contents Table of Contents... 2 Decibel... 3 Understanding the Transducer and Hydrophone
EMC TEST REPORT RADISYS CORPORATION. Tel: Fax:
 EMC TEST REPORT Report No.: Product: Model No. : FCC2012-8029E GSM Tracker PRIME AT PLT Brand Name: PRIME Applicant: Address: Issued by: Lab Location: RADISYS CORPORATION 601 North Congress Ave Suite 439,
Audio Engineering Society. Convention Paper. Presented at the 113th Convention 2002 October 5 8 Los Angeles, California, USA
 Audio Engineering Society Convention Paper Presented at the 113th Convention 2002 October 5 8 Los Angeles, California, USA This convention paper has been reproduced from the author's advance manuscript,
Passive Acoustic Monitoring for Cetaceans Across the Continental Shelf off Virginia: 2016 Annual Progress Report
 Passive Acoustic Monitoring for Cetaceans Across the Continental Shelf off Virginia: Submitted to: Naval Facilities Engineering Command Atlantic under Contract No. N62470-15-D-8006, Task Order 032. Prepared
Biomimetic Signal Processing Using the Biosonar Measurement Tool (BMT)
") Biomimetic Signal Processing Using the Biosonar Measurement Tool (BMT) Ahmad T. Abawi, Paul Hursky, Michael B. Porter, Chris Tiemann and Stephen Martin Center for Ocean Research, Science Applications International
Biomimetic Signal Processing Using the Biosonar Measurement Tool (BMT) Ahmad T. Abawi, Paul Hursky, Michael B. Porter, Chris Tiemann and Stephen Martin Center for Ocean Research, Science Applications International
Fundamentals of Data Converters. DAVID KRESS Director of Technical Marketing
 Fundamentals of Data Converters DAVID KRESS Director of Technical Marketing 9/14/2016 Analog to Electronic Signal Processing Sensor (INPUT) Amp Converter Digital Processor Actuator (OUTPUT) Amp Converter
ECMA-108. Measurement of Highfrequency. emitted by Information Technology and Telecommunications Equipment. 4 th Edition / December 2008
 ECMA-108 4 th Edition / December 2008 Measurement of Highfrequency Noise emitted by Information Technology and Telecommunications Equipment COPYRIGHT PROTECTED DOCUMENT Ecma International 2008 Standard
Exploitation of Environmental Complexity in Shallow Water Acoustic Data Communications
 Exploitation of Environmental Complexity in Shallow Water Acoustic Data Communications W.S. Hodgkiss Marine Physical Laboratory Scripps Institution of Oceanography La Jolla, CA 92093-0701 phone: (858)
Quadra 10 Available in Black and White
 S P E C I F I C A T I O N S Quadra 10 Available in Black and White Frequency response, 1 meter on-axis, swept-sine in anechoic environment: 74 Hz 18 khz (±3 db) Usable low frequency limit (-10 db point):
Fibre Optic Sensors: basic principles and most common applications
 SMR 1829-21 Winter College on Fibre Optics, Fibre Lasers and Sensors 12-23 February 2007 Fibre Optic Sensors: basic principles and most common applications (PART 2) Hypolito José Kalinowski Federal University
Elizabethtown College Department of Physics and Engineering PHY104. Lab # 9- Oscilloscope and RC Circuit
 Elizabethtown College Department of Physics and Engineering PHY104 Lab # 9- Oscilloscope and RC Circuit Introduction This lab introduces you to very important tools, the oscilloscope and the waveform generator.
Experiment Five: The Noisy Channel Model
 Experiment Five: The Noisy Channel Model Modified from original TIMS Manual experiment by Mr. Faisel Tubbal. Objectives 1) Study and understand the use of marco CHANNEL MODEL module to generate and add
The Use of a Floating Threshold for Online Acoustic Emission Monitoring of Fossil High Energy Piping
 The Use of a Floating Threshold for Online Acoustic Emission Monitoring of Fossil High Energy Piping A common misconception about AE is that we can "tune in" to some discreet frequency the defect is emitting
Development of Control Algorithm for Ring Laser Gyroscope
 International Journal of Scientific and Research Publications, Volume 2, Issue 10, October 2012 1 Development of Control Algorithm for Ring Laser Gyroscope P. Shakira Begum, N. Neelima Department of Electronics
APPENDIX A to VOLUME A1 TIMS FILTER RESPONSES
 APPENDIX A to VOLUME A1 TIMS FILTER RESPONSES A2 TABLE OF CONTENTS... 5 Filter Specifications... 7 3 khz LPF (within the HEADPHONE AMPLIFIER)... 8 TUNEABLE LPF... 9 BASEBAND CHANNEL FILTERS - #2 Butterworth
ORE 654 Applications of Ocean Acoustics. Homework Problem Set #2. Assigned 27 October 2011 Due 10 November 2011
 ORE 654 Applications of Ocean Acoustics Homework Problem Set #2 Assigned 27 October 2011 Due 10 November 2011 Please use standard 8.5x11 paper. Write clearly in dark pencil/ink, or you can use this document
Observations of the deep-water mid-frequency ambient noise spatial structure and temporal fluctuation characteristics.
 Mid-Frequency Ambient Noise Experiment 4-21 August 2018 Objective Observations of the deep-water mid-frequency ambient noise spatial structure and temporal fluctuation characteristics. Background The 2D
Multi-channel Active Control of Axial Cooling Fan Noise
 The 2002 International Congress and Exposition on Noise Control Engineering Dearborn, MI, USA. August 19-21, 2002 Multi-channel Active Control of Axial Cooling Fan Noise Kent L. Gee and Scott D. Sommerfeldt
Test No. 1. Introduction to Scope Measurements. Report History. University of Applied Sciences Hamburg. Last chance!! EEL2 No 1
 University of Applied Sciences Hamburg Group No : DEPARTMENT OF INFORMATION ENGINEERING Laboratory for Instrumentation and Measurement L: in charge of the report Test No. Date: Assistant A2: Professor:
NTT DOCOMO Technical Journal. Method for Measuring Base Station Antenna Radiation Characteristics in Anechoic Chamber. 1.
 Base Station Antenna Directivity Gain Method for Measuring Base Station Antenna Radiation Characteristics in Anechoic Chamber Base station antennas tend to be long compared to the wavelengths at which
PHYS225 Lecture 15. Electronic Circuits
 PHYS225 Lecture 15 Electronic Circuits Last lecture Difference amplifier Differential input; single output Good CMRR, accurate gain, moderate input impedance Instrumentation amplifier Differential input;
The Fundamentals of Mixed Signal Testing
 The Fundamentals of Mixed Signal Testing Course Information The Fundamentals of Mixed Signal Testing course is designed to provide the foundation of knowledge that is required for testing modern mixed
Filter1D Time Series Analysis Tool
 Filter1D Time Series Analysis Tool Introduction Preprocessing and quality control of input time series for surface water flow and sediment transport numerical models are key steps in setting up the simulations
Module 1: Introduction to Experimental Techniques Lecture 2: Sources of error. The Lecture Contains: Sources of Error in Measurement
 The Lecture Contains: Sources of Error in Measurement Signal-To-Noise Ratio Analog-to-Digital Conversion of Measurement Data A/D Conversion Digitalization Errors due to A/D Conversion file:///g /optical_measurement/lecture2/2_1.htm[5/7/2012
NEMO - NIXIE Enhanced Modular Option Surface Ship Torpedo Defense (SSTD) Program Update Test Results
 Program Update Test Results") NEMO - NIXIE Enhanced Modular Option Surface Ship Torpedo Defense (SSTD) Program Update Test Results John P. Fumo, CTO ArgonST, Inc 12701 Fair Lakes Circle, Fairfax, VA 22033 Abstract NIXIE Enhanced Modular
NEMO - NIXIE Enhanced Modular Option Surface Ship Torpedo Defense (SSTD) Program Update Test Results John P. Fumo, CTO ArgonST, Inc 12701 Fair Lakes Circle, Fairfax, VA 22033 Abstract NIXIE Enhanced Modular
Terminology (1) Chapter 3. Terminology (3) Terminology (2) Transmitter Receiver Medium. Data Transmission. Direct link. Point-to-point.
 Chapter 3. Terminology (3) Terminology (2) Transmitter Receiver Medium. Data Transmission. Direct link. Point-to-point.") Terminology (1) Chapter 3 Data Transmission Transmitter Receiver Medium Guided medium e.g. twisted pair, optical fiber Unguided medium e.g. air, water, vacuum Spring 2012 03-1 Spring 2012 03-2 Terminology
Terminology (1) Chapter 3 Data Transmission Transmitter Receiver Medium Guided medium e.g. twisted pair, optical fiber Unguided medium e.g. air, water, vacuum Spring 2012 03-1 Spring 2012 03-2 Terminology
SIGNAL PROCESSING ALGORITHMS FOR HIGH-PRECISION NAVIGATION AND GUIDANCE FOR UNDERWATER AUTONOMOUS SENSING SYSTEMS
 SIGNAL PROCESSING ALGORITHMS FOR HIGH-PRECISION NAVIGATION AND GUIDANCE FOR UNDERWATER AUTONOMOUS SENSING SYSTEMS Daniel Doonan, Chris Utley, and Hua Lee Imaging Systems Laboratory Department of Electrical
Terminology (1) Chapter 3. Terminology (3) Terminology (2) Transmitter Receiver Medium. Data Transmission. Simplex. Direct link.
 Chapter 3. Terminology (3) Terminology (2) Transmitter Receiver Medium. Data Transmission. Simplex. Direct link.") Chapter 3 Data Transmission Terminology (1) Transmitter Receiver Medium Guided medium e.g. twisted pair, optical fiber Unguided medium e.g. air, water, vacuum Corneliu Zaharia 2 Corneliu Zaharia Terminology
Chapter 3 Data Transmission Terminology (1) Transmitter Receiver Medium Guided medium e.g. twisted pair, optical fiber Unguided medium e.g. air, water, vacuum Corneliu Zaharia 2 Corneliu Zaharia Terminology
LINEAR IC APPLICATIONS
 1 B.Tech III Year I Semester (R09) Regular & Supplementary Examinations December/January 2013/14 1 (a) Why is R e in an emitter-coupled differential amplifier replaced by a constant current source? (b)
Ch 5 Hardware Components for Automation
 Ch 5 Hardware Components for Automation Sections: 1. Sensors 2. Actuators 3. Analog-to-Digital Conversion 4. Digital-to-Analog Conversion 5. Input/Output Devices for Discrete Data Computer-Process Interface
SYSTEM 5900 SIDE SCAN SONAR
 SYSTEM 5900 SIDE SCAN SONAR HIGH-RESOLUTION, DYNAMICALLY FOCUSED, MULTI-BEAM SIDE SCAN SONAR Klein Marine System s 5900 sonar is the flagship in our exclusive family of multi-beam technology-based side
Mechatronics Project Report
 Mechatronics Project Report Introduction Robotic fish are utilized in the Dynamic Systems Laboratory in order to study and model schooling in fish populations, with the goal of being able to manage aquatic
Tunable Multi Notch Digital Filters A MATLAB demonstration using real data
 Tunable Multi Notch Digital Filters A MATLAB demonstration using real data Jon Bell CSIRO ATNF 27 Sep 2 1 Introduction Many people are investigating a wide range of interference suppression techniques.
Range-Depth Tracking of Sounds from a Single-Point Deployment by Exploiting the Deep-Water Sound Speed Minimum
 DISTRIBUTION STATEMENT A. Approved for public release; distribution is unlimited. Range-Depth Tracking of Sounds from a Single-Point Deployment by Exploiting the Deep-Water Sound Speed Minimum Aaron Thode
Rec. ITU-R P RECOMMENDATION ITU-R P *
 Rec. ITU-R P.682-1 1 RECOMMENDATION ITU-R P.682-1 * PROPAGATION DATA REQUIRED FOR THE DESIGN OF EARTH-SPACE AERONAUTICAL MOBILE TELECOMMUNICATION SYSTEMS (Question ITU-R 207/3) Rec. 682-1 (1990-1992) The
Operating Mode: PERFORMANCE Operating Range: 50 Hz to 19 khz Nominal Beamwidth: Horz 90 Vert 12 Axial Sensitivity (whole space SPL):
:") FEATURES Extremely high output to size & weight ratio. Size and output capabilities allow it to be used in the widest variety of venues Exceptional pattern control due to symmetrical design, large horn(s)
FEATURES Extremely high output to size & weight ratio. Size and output capabilities allow it to be used in the widest variety of venues Exceptional pattern control due to symmetrical design, large horn(s)
Long Range Acoustic Communications Experiment 2010
 Long Range Acoustic Communications Experiment 2010 Marine Physical Laboratory Scripps Institution of Oceanography La Jolla, CA 92093-0701 6 September 2010 Objectives Experimentally confirm that robust
Exercise 1-3. Radar Antennas EXERCISE OBJECTIVE DISCUSSION OUTLINE DISCUSSION OF FUNDAMENTALS. Antenna types
 Exercise 1-3 Radar Antennas EXERCISE OBJECTIVE When you have completed this exercise, you will be familiar with the role of the antenna in a radar system. You will also be familiar with the intrinsic characteristics
DEPARTMENT OF INFORMATION ENGINEERING. Test No. 1. Introduction to Scope Measurements. 1. Correction. Term Correction. Term...
 2. Correction. Correction Report University of Applied Sciences Hamburg Group No : DEPARTMENT OF INFORMATION ENGINEERING Laboratory for Instrumentation and Measurement L: in charge of the report Test No.
LLRF4 Evaluation Board
 LLRF4 Evaluation Board USPAS Lab Reference Author: Dmitry Teytelman Revision: 1.1 June 11, 2009 Copyright Dimtel, Inc., 2009. All rights reserved. Dimtel, Inc. 2059 Camden Avenue, Suite 136 San Jose, CA
MK2399i Specifications
 DESCRIPTION Premium Performance Application Flexibility The MK2300i Series of 2-way, high output, trapezoidal loudspeaker systems are designed as main PA elements for smaller venues, including small houses
What applications is a cardioid subwoofer configuration appropriate for?
 SETTING UP A CARDIOID SUBWOOFER SYSTEM Joan La Roda DAS Audio, Engineering Department. Introduction In general, we say that a speaker, or a group of speakers, radiates with a cardioid pattern when it radiates
Moku:Lab. Specifications INSTRUMENTS. Moku:Lab, rev
 Moku:Lab L I Q U I D INSTRUMENTS Specifications Moku:Lab, rev. 2018.1 Table of Contents Hardware 4 Specifications 4 Analog I/O 4 External trigger input 4 Clock reference 5 General characteristics 5 General
Operating Mode: PERFORMANCE Operating Range: Nominal Beamwidth: (rotatable) Horz 90 Vert 45 Axial Sensitivity (whole space SPL):
 Horz 90 Vert 45 Axial Sensitivity (whole space SPL):") 2-WAY FULL-RANGE LOUDSPEAKER 90 45 See NOTES TABULAR DATA for details CONFIGURATION Subsystem: Operating Mode: Transducer LF 1 15 in cone HF 1 1.4 in exit, 3 in voice coil compression driver Single-amp
2-WAY FULL-RANGE LOUDSPEAKER 90 45 See NOTES TABULAR DATA for details CONFIGURATION Subsystem: Operating Mode: Transducer LF 1 15 in cone HF 1 1.4 in exit, 3 in voice coil compression driver Single-amp
Operating Mode: PERFORMANCE 1 Operating Range: 57 Hz to 15 khz Nominal Beamwidth: (rotatable) Horz 120 Vert 60 Axial Sensitivity (whole space SPL):
 Horz 120 Vert 60 Axial Sensitivity (whole space SPL):") DESCRIPTION Premium Performance Application Flexibility The MK5300 Series of 2-way, high output, trapezoidal loudspeaker systems are designed as main PA elements for smaller venues, including small houses
DESCRIPTION Premium Performance Application Flexibility The MK5300 Series of 2-way, high output, trapezoidal loudspeaker systems are designed as main PA elements for smaller venues, including small houses
Laboratory Exercise 6 THE OSCILLOSCOPE
 Introduction Laboratory Exercise 6 THE OSCILLOSCOPE The aim of this exercise is to introduce you to the oscilloscope (often just called a scope), the most versatile and ubiquitous laboratory measuring
Scaled Laboratory Experiments of Shallow Water Acoustic Propagation
 Scaled Laboratory Experiments of Shallow Water Acoustic Propagation Panagiotis Papadakis, Michael Taroudakis FORTH/IACM, P.O.Box 1527, 711 10 Heraklion, Crete, Greece e-mail: taroud@iacm.forth.gr Patrick
FCC ID: A3LSLS-BD106Q. Report No.: HCT-RF-1801-FC003. Plot Data for Output Port 2_QPSK 9 khz ~ 150 khz Middle channel 150 khz ~ 30 MHz Low channel
 Plot Data for Output Port 2_QPSK 9 khz ~ 150 khz Middle channel 150 khz ~ 30 MHz Low channel 30 MHz ~ 1 GHz Middle channel 1 GHz ~ 2.491 GHz Low channel 2.695 GHz ~ 12.75 GHz High channel 12.75 GHz ~ 26.5
Structure of Speech. Physical acoustics Time-domain representation Frequency domain representation Sound shaping
 Structure of Speech Physical acoustics Time-domain representation Frequency domain representation Sound shaping Speech acoustics Source-Filter Theory Speech Source characteristics Speech Filter characteristics