Worksheet for the afternoon course Tune measurements simulated with a DSP card
|
|
|
- Gilbert Park
- 5 years ago
- Views:
Transcription
1 Worksheet for the afternoon course Tune measurements simulated with a DSP card CAS Tuusula, June 2018 D. Alves, S. Sadovich, H. Schmickler 1. Introduction In this course we will be replacing the betatron oscillations of the beam in the horizontal and vertical plane by two parallel LC resonators. The basic learning objective of the course is: Understand the different ways of stimulating transverse beam oscillations in time and frequency domain. Understand the signals of these transverse oscillations collected from a beam position monitors in time and frequency domain Generate various excitation modes with the help of an evaluation board carrying an Analog Devices SHARC DSP processor. The same DSP is also used for a treatment and display of the resulting beam oscillation. The whole measurement sequence is programmed in C++, but the code is freely available and can be modified by skilled students. Generate a principle understanding of the necessary signal treatment for tune measurements and exercise the use of a simple two channel oscilloscope. 2. Description of the setup Below the complete schematic of the two LC resonators representing the beam. The schematic has been generated with a freeware simulation tool, which is already installed on your computer. With one jumper (SW3) on the beam PCB you can change the resonant frequency by adding one capacitor in parallel. Also you can put into another jumper (SW2) in order to put a resistor in parallel to the LC resonator. This emulates different damping times of the beam (i.e. chromaticity). During all exercises you can manipulate these jumpers and look at the resulting differences. Please locate all components on the board if you know a little of electronics you can read the values of the resistances from their colour code.


2 Both, the tool and the schematics are on the indico website of the CAS course and are installed on the course computer. This way every experiment can also be simulated and the results compared to real measurements. Some of the simulation snapshots will also be included in this document.

3 LTspice simulation: The snapshot below shows the schematic (one beam) and its response for an excitation with a single pulse of 20 us length (exercise 3).

4 3. The DSP development environment The DSP development environment is preinstalled on the note-books, which are linked by a USB cable to the evaluation kit. After startup first the course project needs to be opened: - Download zip file with project from the indico page of the afternoon courses in Tuusula. - Unzip file to Desktop - Import project into VisualDSP++

5 The software is not written with a graphical user interface. It is a single program, which can do all steps of the exercise, but for each step the program has to be recompiled after one has modified a parameter file, which configures the program for each step. The parameter file is called Settings.h and the following picture shows part of its content. The meaning of each parameter shall be described in each exercise.
6 Configuration file: Settings.h DSP environment, compiling.. The following screen shots explain the various steps of invoking the program, compiling the code and loading the executable code into the DSP for execution. More explanations will be given in the course.

7 - Build project (first time you build it after importing):

8 - Build project (subsequent builds):
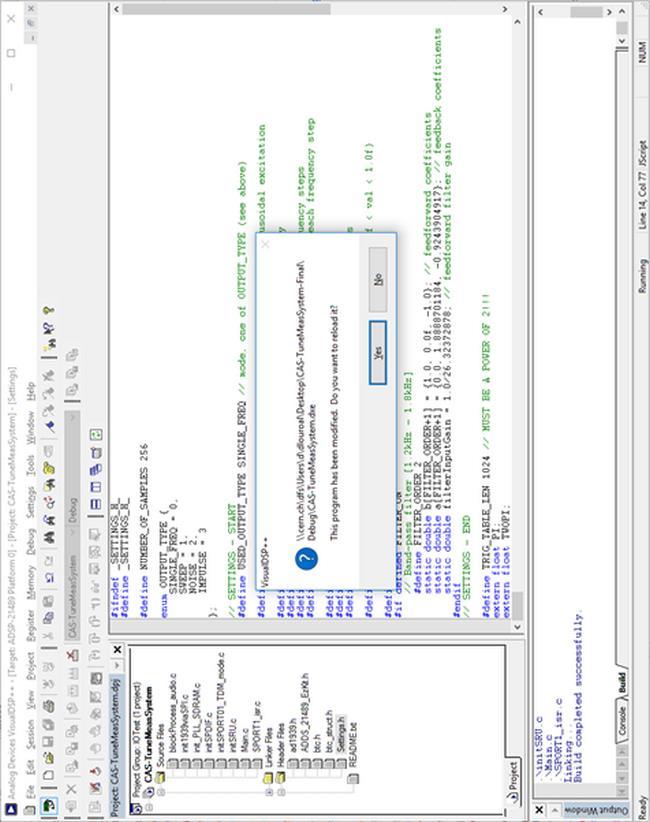
9

10 - Load compiled binary into DSP (automatic):
11 - Load binary file to DSP (manual):
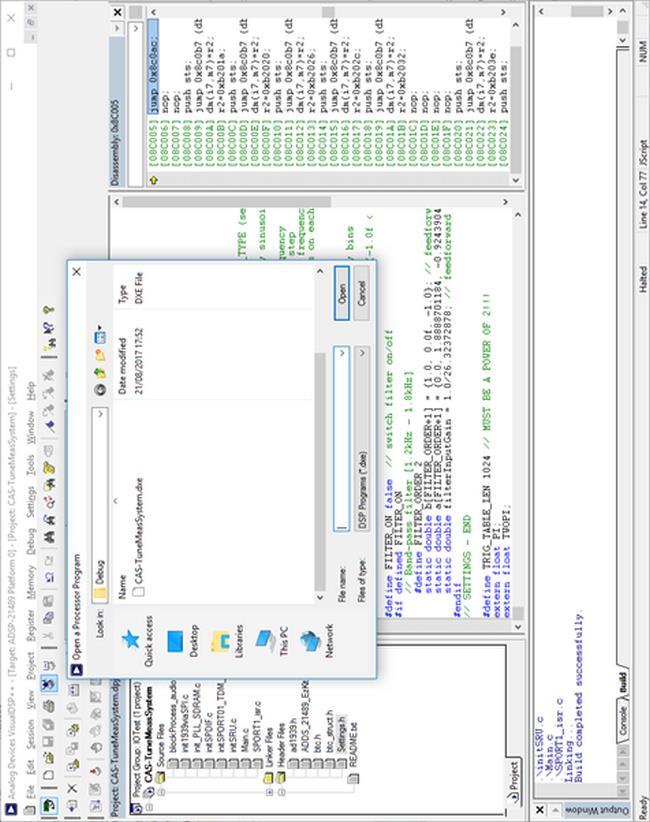
12
13 - Run code:
14 - Stop and reset:
 and make all connections to the DSP.")

15 Exersises: Exercise 0: Getting familiar Put the setup into the mode of continuous sine wave excitation (=: SINGLE_FREQ) and make all connections to the DSP. Use one channel of the oscilloscope to observe the excitation signal of the beam, the other channel to observe the beam oscillation. Choose as excitation frequency 1000 Hz, (re)build and run. Parameter page: Details:


16 Getting the realtime displays generated by the DSP: Load AmpDft.vps, AmpMix.vps and PhaseMix.vps:

17 Right-click on any plot window to setup auto-refresh settings.


18 Right-click on each plot window and enable auto refresh: Finally you should see:

19 Exercise 1: Measuring by hand the beam transfer function Use the setup of above, but vary the fixed frequency in at least 7 steps in the range 500 Hz to 2500 Hz. At each frequency measure the amplitude of the beam oscillation and the phase between excitation and beam oscillation directly from the AmpMix and PhaseMix plots. Draw on a piece of paper or in excel the results as a function of the excitation frequency. Below: Measurement on beam from about 1991

20 Exercise 2: Have the DSP do exercise 1 Use again the same setup, but this time put the DSP into the mode SWEPT FREQUENCY also often called network analysis. Use as sweep range again Hz. In real time the DSP will draw the curves which you have measured yourself. Details:

21 Above: Simulated result from LTspice Exercise 3: Broad band excitation We now switch to a different excitation mode of the beam, which we refer to as noise excitation. The advantage is that by applying noise, i.e. random excitation voltages, we excite the whole frequency spectrum, so we do can do the above measurements at the same time, with the price of reduced accuracy. Noise can be applied in various ways, we offer three different options a) single unipolar excitation pulse b) regular random voltage excitation pulses c) regular random excitation pulses after applying a filter, which is centred on the expected resonance frequency of the beam. The advantages and disadvantages of each excitation mode will become clear during the exercise.
 and observe the beam oscillation. Make the appropriate code changes and load AmpDftCum.vps and InOut.vps. Details of parameter file:")
22 3a) Set the DSP to the mode SINGLE PULSE EXCITATION Observe with the oscilloscope the excitation signal (use this also to trigger the scope) and observe the beam oscillation. Make the appropriate code changes and load AmpDftCum.vps and InOut.vps. Details of parameter file:


23 3b) Set the DSP into the mode of NOISE EXCITATION, FILTER OFF The DSP will work in an endless loop, each time sending excitation pulses, collecting the data and computing a discrete Fourier transform in the frequency range Hz. The amplitude spectrum of the excitation and the beam are displayed. In the top two graphs shot by shot, and the bottom two plots as accumulated spectra. Interpret the results. If wanted you can also observe the time domain data with the oscilloscope, but it is difficult to get a meaningful measurement.
.")
24 3c) Set the DSP into the mode of NOISE EXCITATION, FILTER ON The DSP will work in an endless loop, each time sending excitation pulses, collecting the data and computing a discrete Fourier transform in the frequency range Hz. The only difference compared to exercise 4b is that the noise excitation is pre-filtered around the expected resonant frequency (1600 Hz; jumper for extra C out ). Interpret the changes to 3b)
25 Details on the filter: The filter has been implemented in order to concentrate the excitation energy of the noise to the frequency range of interest. The following procedure is implemented in the code: - apply a digital Butterworth bandpass of 1 st order - determine the peak to peak signal level after filtering - apply a gain to these values, such that the maximum DAC input (-1 +1) is used. Possible Discussion: Pros and cons of this method? Alternatives? Filter data: Sampling frequency 48 khz Lower corner frequency 1200 Hz, higher corner frequency 1800 Hz Below the simulated filter amplitude and phase response plus its response to a kick excitation.

 coupling of both betatron planes.")
26 4.) Coupling Output 1 and 2 always produce the same excitation signal. So you can connect the excitation signal to both planes of the beam in parallel. Without the jumper inserted to the middle part of the PCB, both planes are uncoupled. Inserting this jumper produces a simple way of simulating (Strong) coupling of both betatron planes. Please repeat exercise 3a and 3b with coupled beam. Best results are obtained with both resonant frequencies different. So one jumper IN and the same jumper on the other board OUT. Below the results in simulation.
 or any other manipulation, during which magnetic fields in the")
27 4. Phase Locked Loop (PLL) tune tracking All tune diagnostics exercised so far results in a single shot tune measurement. This is for many situations sufficient, but people also want to diagnose operational transitions of an accelerator (like acceleration) or any other manipulation, during which magnetic fields in the accelerator get changed. A classical approach for such dynamic tune measurements is continuous noise excitation and consecutive Fourier transforms (FFT) of the measured turn by turn position data. With so called peak finding algorithms the tune is identified in each measurement as the maximum of the FFT amplitude spectrum and hence the evolution of the tune can be followed. Measurement resolution in tune and time resolution between two measurement points have always to be traded against each other. A more elegant way of tracking the evolution of the tune is by having an electronic circuit (analog or digital), which excites continuously the beam to transverse oscillations and changes automatically the frequency of the beam excitation, such that excitation and beam response stay in phase. So the circuit looks itself to a stable excitation phase and it is hence called a Phase locked loop. In contrary to the FFT method indicated above, the PLL uses the phase information as indicator for resonance, the FFT methods look for a maximum in amplitude. For the experiment with the DSP please close the previous project:


28 Open new project: The DSP is programmed to execute a PLL circuit. It generates a continuous sine wave oscillation and it measures permanently the phase between its excitation signal and the stimulated oscillation. You may have a look at the code in particular in order to see how the phase detection is made. But otherwise the only parameter that you need to care about is the start frequency of the oscillator (not too far from the expected resonance) and a loop gain for the PLL.

29 Settings overview in the file settings.h: Set starting frequency and PLL gain. Compile, load and start (PLL starts at 750Hz and converges to resonant frequency):


30 After locking, PLL frequency oscillates with small excursions around the resonant frequency: Change (increase) resonant frequency by removing jumper SW3: PLL tracks new resonant frequency:
31 You can experiment with the start frequency and the loop gain and observe the reactivity of the PLL circuit. At any time you may look at the signals with the oscilloscope.
The oscilloscope and RC filters
 (ta initials) first name (print) last name (print) brock id (ab17cd) (lab date) Experiment 4 The oscilloscope and C filters The objective of this experiment is to familiarize the student with the workstation
Experiment # 4. Frequency Modulation
 ECE 416 Fall 2002 Experiment # 4 Frequency Modulation 1 Purpose In Experiment # 3, a modulator and demodulator for AM were designed and built. In this experiment, another widely used modulation technique
Exploring DSP Performance
 ECE1756, Experiment 02, 2015 Communications Lab, University of Toronto Exploring DSP Performance Bruno Korst, Siu Pak Mok & Vaughn Betz Abstract The performance of two DSP architectures will be probed
P a g e 1 ST985. TDR Cable Analyzer Instruction Manual. Analog Arts Inc.
 P a g e 1 ST985 TDR Cable Analyzer Instruction Manual Analog Arts Inc. www.analogarts.com P a g e 2 Contents Software Installation... 4 Specifications... 4 Handling Precautions... 4 Operation Instruction...
The Tuned Circuit. Aim of the experiment. Circuit. Equipment and components. Display of a decaying oscillation. Dependence of L, C and R.
 The Tuned Circuit Aim of the experiment Display of a decaying oscillation. Dependence of L, C and R. Circuit Equipment and components 1 Rastered socket panel 1 Resistor R 1 = 10 Ω, 1 Resistor R 2 = 1 kω
Laboratory Exercise 6 THE OSCILLOSCOPE
 Introduction Laboratory Exercise 6 THE OSCILLOSCOPE The aim of this exercise is to introduce you to the oscilloscope (often just called a scope), the most versatile and ubiquitous laboratory measuring
Laboratory Experiment #1 Introduction to Spectral Analysis
 J.B.Francis College of Engineering Mechanical Engineering Department 22-403 Laboratory Experiment #1 Introduction to Spectral Analysis Introduction The quantification of electrical energy can be accomplished
Precalculations Individual Portion Introductory Lab: Basic Operation of Common Laboratory Instruments
 Name: Date of lab: Section number: M E 345. Lab 1 Precalculations Individual Portion Introductory Lab: Basic Operation of Common Laboratory Instruments Precalculations Score (for instructor or TA use only):
Lab 9 Frequency Domain
 Lab 9 Frequency Domain 1 Components Required Resistors Capacitors Function Generator Multimeter Oscilloscope 2 Filter Design Filters are electric components that allow applying different operations to
Sweep / Function Generator User Guide
 I. Overview Sweep / Function Generator User Guide The Sweep/Function Generator as developed by L. J. Haskell was designed and built as a multi-functional test device to help radio hobbyists align antique
Experiment 5.A. Basic Wireless Control. ECEN 2270 Electronics Design Laboratory 1
 .A Basic Wireless Control ECEN 2270 Electronics Design Laboratory 1 Procedures 5.A.0 5.A.1 5.A.2 5.A.3 5.A.4 5.A.5 5.A.6 Turn in your pre lab before doing anything else. Receiver design band pass filter
ME 365 EXPERIMENT 1 FAMILIARIZATION WITH COMMONLY USED INSTRUMENTATION
 Objectives: ME 365 EXPERIMENT 1 FAMILIARIZATION WITH COMMONLY USED INSTRUMENTATION The primary goal of this laboratory is to study the operation and limitations of several commonly used pieces of instrumentation:
Elizabethtown College Department of Physics and Engineering PHY104. Lab # 9- Oscilloscope and RC Circuit
 Elizabethtown College Department of Physics and Engineering PHY104 Lab # 9- Oscilloscope and RC Circuit Introduction This lab introduces you to very important tools, the oscilloscope and the waveform generator.
Experiment 1.A. Working with Lab Equipment. ECEN 2270 Electronics Design Laboratory 1
 .A Working with Lab Equipment Electronics Design Laboratory 1 1.A.0 1.A.1 3 1.A.4 Procedures Turn in your Pre Lab before doing anything else Setup the lab waveform generator to output desired test waveforms,
ECE Lab #4 OpAmp Circuits with Negative Feedback and Positive Feedback
 ECE 214 Lab #4 OpAmp Circuits with Negative Feedback and Positive Feedback 20 February 2018 Introduction: The TL082 Operational Amplifier (OpAmp) and the Texas Instruments Analog System Lab Kit Pro evaluation
EE477 Digital Signal Processing Laboratory Exercise #13
 EE477 Digital Signal Processing Laboratory Exercise #13 Real time FIR filtering Spring 2004 The object of this lab is to implement a C language FIR filter on the SHARC evaluation board. We will filter
Models 296 and 295 combine sophisticated
 Established 1981 Advanced Test Equipment Rentals www.atecorp.com 800-404-ATEC (2832) Models 296 and 295 50 MS/s Synthesized Multichannel Arbitrary Waveform Generators Up to 4 Independent Channels 10 Standard
Resonance in Circuits
 Resonance in Circuits Purpose: To map out the analogy between mechanical and electronic resonant systems To discover how relative phase depends on driving frequency To gain experience setting up circuits
Lab E5: Filters and Complex Impedance
 E5.1 Lab E5: Filters and Complex Impedance Note: It is strongly recommended that you complete lab E4: Capacitors and the RC Circuit before performing this experiment. Introduction Ohm s law, a well known
Cyclone II Filtering Lab
 May 2005, ver. 1.0 Application Note 376 Introduction The Cyclone II filtering lab design provided in the DSP Development Kit, Cyclone II Edition, shows you how to use the Altera DSP Builder for system
UCE-DSO212 DIGITAL OSCILLOSCOPE USER MANUAL. UCORE ELECTRONICS
 UCE-DSO212 DIGITAL OSCILLOSCOPE USER MANUAL UCORE ELECTRONICS www.ucore-electronics.com 2017 Contents 1. Introduction... 2 2. Turn on or turn off... 3 3. Oscilloscope Mode... 4 3.1. Display Description...
Waveform Generators and Oscilloscopes. Lab 6
 Waveform Generators and Oscilloscopes Lab 6 1 Equipment List WFG TEK DPO 4032A (or MDO3012) Resistors: 10kΩ, 1kΩ Capacitors: 0.01uF 2 Waveform Generators (WFG) The WFG supplies a variety of timevarying
Experiment 8: An AC Circuit
 Experiment 8: An AC Circuit PART ONE: AC Voltages. Set up this circuit. Use R = 500 Ω, L = 5.0 mh and C =.01 μf. A signal generator built into the interface provides the emf to run the circuit from Output
LAB #7: Digital Signal Processing
 LAB #7: Digital Signal Processing Equipment: Pentium PC with NI PCI-MIO-16E-4 data-acquisition board NI BNC 2120 Accessory Box VirtualBench Instrument Library version 2.6 Function Generator (Tektronix
DIGITAL SIGNAL PROCESSING LABORATORY
 DIGITAL SIGNAL PROCESSING LABORATORY SECOND EDITION В. Preetham Kumar CRC Press Taylor & Francis Group Boca Raton London New York CRC Press is an imprint of the Taylor & Francis Croup, an informa business
Experiment-4 Study of the characteristics of the Klystron tube
 Experiment-4 Study of the characteristics of the Klystron tube OBJECTIVE To study the characteristics of the reflex Klystron tube and to determine the its electronic tuning range EQUIPMENTS Klystron power
SHRI ANGALAMMAN COLLEGE OF ENGINEERING & TECHNOLOGY (An ISO 9001:2008 Certified Institution) SIRUGANOOR,TRICHY
 SIRUGANOOR,TRICHY") SHRI ANGALAMMAN COLLEGE OF ENGINEERING & TECHNOLOGY (An ISO 9001:2008 Certified Institution) SIRUGANOOR,TRICHY-621105. DEPARTMENT OF ELECTRICAL AND ELECTRONICS ENGINEERING EI 1306-MEASUREMENT AND INSTRUMENTATION
SHRI ANGALAMMAN COLLEGE OF ENGINEERING & TECHNOLOGY (An ISO 9001:2008 Certified Institution) SIRUGANOOR,TRICHY-621105. DEPARTMENT OF ELECTRICAL AND ELECTRONICS ENGINEERING EI 1306-MEASUREMENT AND INSTRUMENTATION
Introduction. In the frequency domain, complex signals are separated into their frequency components, and the level at each frequency is displayed
 SPECTRUM ANALYZER Introduction A spectrum analyzer measures the amplitude of an input signal versus frequency within the full frequency range of the instrument The spectrum analyzer is to the frequency
An Introductory Guide to Circuit Simulation using NI Multisim 12
 School of Engineering and Technology An Introductory Guide to Circuit Simulation using NI Multisim 12 This booklet belongs to: This document provides a brief overview and introductory tutorial for circuit
Study of Inductive and Capacitive Reactance and RLC Resonance
 Objective Study of Inductive and Capacitive Reactance and RLC Resonance To understand how the reactance of inductors and capacitors change with frequency, and how the two can cancel each other to leave
Time-Varying Signals
 Time-Varying Signals Objective This lab gives a practical introduction to signals that varies with time using the components such as: 1. Arbitrary Function Generator 2. Oscilloscopes The grounding issues
EITN90 Radar and Remote Sensing Lab 2
 EITN90 Radar and Remote Sensing Lab 2 February 8, 2018 1 Learning outcomes This lab demonstrates the basic operation of a frequency modulated continuous wave (FMCW) radar, capable of range and velocity
SGN Bachelor s Laboratory Course in Signal Processing Audio frequency band division filter ( ) Name: Student number:
 Name: Student number:") TAMPERE UNIVERSITY OF TECHNOLOGY Department of Signal Processing SGN-16006 Bachelor s Laboratory Course in Signal Processing Audio frequency band division filter (2013-2014) Group number: Date: Name: Student
TAMPERE UNIVERSITY OF TECHNOLOGY Department of Signal Processing SGN-16006 Bachelor s Laboratory Course in Signal Processing Audio frequency band division filter (2013-2014) Group number: Date: Name: Student
Exercise 2: Demodulation (Quadrature Detector)
") Analog Communications Angle Modulation and Demodulation Exercise 2: Demodulation (Quadrature Detector) EXERCISE OBJECTIVE When you have completed this exercise, you will be able to explain demodulation
Analog Communications Angle Modulation and Demodulation Exercise 2: Demodulation (Quadrature Detector) EXERCISE OBJECTIVE When you have completed this exercise, you will be able to explain demodulation
ET1210: Module 5 Inductance and Resonance
 Part 1 Inductors Theory: When current flows through a coil of wire, a magnetic field is created around the wire. This electromagnetic field accompanies any moving electric charge and is proportional to
LAB I. INTRODUCTION TO LAB EQUIPMENT
 1. OBJECTIVE LAB I. INTRODUCTION TO LAB EQUIPMENT In this lab you will learn how to properly operate the oscilloscope Agilent MSO6032A, the Keithley Source Measure Unit (SMU) 2430, the function generator
Introduction to Lab Instruments
 ECE316, Experiment 00, 2017 Communications Lab, University of Toronto Introduction to Lab Instruments Bruno Korst - bkf@comm.utoronto.ca Abstract This experiment will review the use of three lab instruments
Page 1/10 Digilent Analog Discovery (DAD) Tutorial 6-Aug-15. Figure 2: DAD pin configuration
 Tutorial 6-Aug-15. Figure 2: DAD pin configuration") Page 1/10 Digilent Analog Discovery (DAD) Tutorial 6-Aug-15 INTRODUCTION The Diligent Analog Discovery (DAD) allows you to design and test both analog and digital circuits. It can produce, measure and
Page 1/10 Digilent Analog Discovery (DAD) Tutorial 6-Aug-15 INTRODUCTION The Diligent Analog Discovery (DAD) allows you to design and test both analog and digital circuits. It can produce, measure and
EC310 Security Exercise 20
 EC310 Security Exercise 20 Introduction to Sinusoidal Signals This lab demonstrates a sinusoidal signal as described in class. In this lab you will identify the different waveform parameters for a pure
Exercise 8. Troubleshooting a Radar Target Tracker EXERCISE OBJECTIVE
 Exercise 8 Troubleshooting a Radar Target Tracker EXERCISE OBJECTIVE When you have completed this exercise, you will be able to apply an efficient troubleshooting procedure in order to locate instructor-inserted
Audio Analyzer R&S UPV. Up to the limits
 44187 FIG 1 The Audio Analyzer R&S UPV shows what is possible today in audio measurements. Audio Analyzer R&S UPV The benchmark in audio analysis High-resolution digital media such as audio DVD place extremely
EE 3302 LAB 1 EQIUPMENT ORIENTATION
 EE 3302 LAB 1 EQIUPMENT ORIENTATION Pre Lab: Calculate the theoretical gain of the 4 th order Butterworth filter (using the formula provided. Record your answers in Table 1 before you come to class. Introduction:
High-Speed Transceiver Toolkit
 High-Speed Transceiver Toolkit Stratix V FPGA Design Seminars 2011 3.0 Stratix V FPGA Design Seminars 2011 Our seminars feature hour-long modules on different Stratix V capabilities and applications to
LRC Circuit PHYS 296 Your name Lab section
 LRC Circuit PHYS 296 Your name Lab section PRE-LAB QUIZZES 1. What will we investigate in this lab? 2. Figure 1 on the following page shows an LRC circuit with the resistor of 1 Ω, the capacitor of 33
14 fasttest. Multitone Audio Analyzer. Multitone and Synchronous FFT Concepts
 Multitone Audio Analyzer The Multitone Audio Analyzer (FASTTEST.AZ2) is an FFT-based analysis program furnished with System Two for use with both analog and digital audio signals. Multitone and Synchronous
Making sense of electrical signals
 Making sense of electrical signals Our thanks to Fluke for allowing us to reprint the following. vertical (Y) access represents the voltage measurement and the horizontal (X) axis represents time. Most
Getting Started. MSO/DPO Series Oscilloscopes. Basic Concepts
 Getting Started MSO/DPO Series Oscilloscopes Basic Concepts 001-1523-00 Getting Started 1.1 Getting Started What is an oscilloscope? An oscilloscope is a device that draws a graph of an electrical signal.
MASSACHUSETTS INSTITUTE OF TECHNOLOGY /6.071 Introduction to Electronics, Signals and Measurement Spring 2006
 MASSACHUSETTS INSTITUTE OF TECHNOLOGY.071/6.071 Introduction to Electronics, Signals and Measurement Spring 006 Lab. Introduction to signals. Goals for this Lab: Further explore the lab hardware. The oscilloscope
Filters And Waveform Shaping
 Physics 3330 Experiment #3 Fall 2001 Purpose Filters And Waveform Shaping The aim of this experiment is to study the frequency filtering properties of passive (R, C, and L) circuits for sine waves, and
1.5k. (a) Resistive Circuit (b) Capacitive Circuit
 Resistive Circuit (b) Capacitive Circuit") Objective Information The purposes of this laboratory project are to become further acquainted with the use of an oscilloscope, and to observe the behavior of resistor and resistor capacitor circuits.
Objective Information The purposes of this laboratory project are to become further acquainted with the use of an oscilloscope, and to observe the behavior of resistor and resistor capacitor circuits.
ECEn 487 Digital Signal Processing Laboratory. Lab 3 FFT-based Spectrum Analyzer
 ECEn 487 Digital Signal Processing Laboratory Lab 3 FFT-based Spectrum Analyzer Due Dates This is a three week lab. All TA check off must be completed by Friday, March 14, at 3 PM or the lab will be marked
DIGITAL COMMUNICATIONS (INTRODUCTION TO MULTISIM SOFTWARE)
") PROJECT 1B DIGITAL COMMUNICATIONS (INTRODUCTION TO MULTISIM SOFTWARE) (i) FSK SYSTEM (MODULATOR / DEMODULATOR) Abstract: In this project, students are required to design a complete circuit of FSK SYSTEM.
PROJECT 1B DIGITAL COMMUNICATIONS (INTRODUCTION TO MULTISIM SOFTWARE) (i) FSK SYSTEM (MODULATOR / DEMODULATOR) Abstract: In this project, students are required to design a complete circuit of FSK SYSTEM.
MultiSim and Analog Discovery 2 Manual
 MultiSim and Analog Discovery 2 Manual 1 MultiSim 1.1 Running Windows Programs Using Mac Obtain free Microsoft Windows from: http://software.tamu.edu Set up a Windows partition on your Mac: https://support.apple.com/en-us/ht204009
ET 304A Laboratory Tutorial-Circuitmaker For Transient and Frequency Analysis
 ET 304A Laboratory Tutorial-Circuitmaker For Transient and Frequency Analysis All circuit simulation packages that use the Pspice engine allow users to do complex analysis that were once impossible to
Laboratory 3 (drawn from lab text by Alciatore)
") Laboratory 3 (drawn from lab text by Alciatore) The Oscilloscope Required Components: 1 10 resistor 2 100 resistors 2 lk resistors 1 2k resistor 2 4.7M resistors 1 0.F capacitor 1 0.1 F capacitor 1 1.0uF
Laboratory 3 (drawn from lab text by Alciatore) The Oscilloscope Required Components: 1 10 resistor 2 100 resistors 2 lk resistors 1 2k resistor 2 4.7M resistors 1 0.F capacitor 1 0.1 F capacitor 1 1.0uF
Troubleshooting Common EMI Problems
 By William D. Kimmel, PE Kimmel Gerke Associates, Ltd. Learn best practices for troubleshooting common EMI problems in today's digital designs. Industry expert William Kimmel of Kimmel Gerke Associates
Contents. Introduction 1 1 Suggested Reading 2 2 Equipment and Software Tools 2 3 Experiment 2
 ECE363, Experiment 02, 2018 Communications Lab, University of Toronto Experiment 02: Noise Bruno Korst - bkf@comm.utoronto.ca Abstract This experiment will introduce you to some of the characteristics
레이저의주파수안정화방법및그응용 박상언 ( 한국표준과학연구원, 길이시간센터 )
") 레이저의주파수안정화방법및그응용 박상언 ( 한국표준과학연구원, 길이시간센터 ) Contents Frequency references Frequency locking methods Basic principle of loop filter Example of lock box circuits Quantifying frequency stability Applications
레이저의주파수안정화방법및그응용 박상언 ( 한국표준과학연구원, 길이시간센터 ) Contents Frequency references Frequency locking methods Basic principle of loop filter Example of lock box circuits Quantifying frequency stability Applications
sin(wt) y(t) Exciter Vibrating armature ENME599 1
 y(t) Exciter Vibrating armature ENME599 1") ENME599 1 LAB #3: Kinematic Excitation (Forced Vibration) of a SDOF system Students must read the laboratory instruction manual prior to the lab session. The lab report must be submitted in the beginning
ENME599 1 LAB #3: Kinematic Excitation (Forced Vibration) of a SDOF system Students must read the laboratory instruction manual prior to the lab session. The lab report must be submitted in the beginning
Stratix Filtering Reference Design
 Stratix Filtering Reference Design December 2004, ver. 3.0 Application Note 245 Introduction The filtering reference designs provided in the DSP Development Kit, Stratix Edition, and in the DSP Development
LABORATORY 4. Palomar College ENGR210 Spring 2017 ASSIGNED: 3/21/17
 LABORATORY 4 ASSIGNED: 3/21/17 OBJECTIVE: The purpose of this lab is to evaluate the transient and steady-state circuit response of first order and second order circuits. MINIMUM EQUIPMENT LIST: You will
What the LSA1000 Does and How
 2 About the LSA1000 What the LSA1000 Does and How The LSA1000 is an ideal instrument for capturing, digitizing and analyzing high-speed electronic signals. Moreover, it has been optimized for system-integration
Series and Parallel Resonance
 School of Engineering Department of Electrical and Computer Engineering 33:4 Principles of Electrical Engineering II aboratory Experiment 1 Series and Parallel esonance 1 Introduction Objectives To introduce
Experiment 1: Instrument Familiarization
 Electrical Measurement Issues Experiment 1: Instrument Familiarization Electrical measurements are only as meaningful as the quality of the measurement techniques and the instrumentation applied to the
ANALOG COMMUNICATION
 ANALOG COMMUNICATION TRAINING LAB Analog Communication Training Lab consists of six kits, one each for Modulation (ACL-01), Demodulation (ACL-02), Modulation (ACL-03), Demodulation (ACL-04), Noise power
Experiment 1: Instrument Familiarization (8/28/06)
") Electrical Measurement Issues Experiment 1: Instrument Familiarization (8/28/06) Electrical measurements are only as meaningful as the quality of the measurement techniques and the instrumentation applied
Electrical Measurement Issues Experiment 1: Instrument Familiarization (8/28/06) Electrical measurements are only as meaningful as the quality of the measurement techniques and the instrumentation applied
SYSTEM ONE * DSP SYSTEM ONE DUAL DOMAIN (preliminary)
") SYSTEM ONE * DSP SYSTEM ONE DUAL DOMAIN (preliminary) Audio Precision's new System One + DSP (Digital Signal Processor) and System One Deal Domain are revolutionary additions to the company's audio testing
SYSTEM ONE * DSP SYSTEM ONE DUAL DOMAIN (preliminary) Audio Precision's new System One + DSP (Digital Signal Processor) and System One Deal Domain are revolutionary additions to the company's audio testing
Load Transient Tool User Manual
 Figure 1: Richtek connections and functions The Richtek contains a micro controller that switches a MOSFET on and off with a certain duty-cycle. When connected to a voltage regulator output, the MOSFET
Amplitude Modulation Methods and Circuits
 Amplitude Modulation Methods and Circuits By: Mark Porubsky Milwaukee Area Technical College Electronic Technology Electronic Communications Milwaukee, WI Purpose: The various parts of this lab unit will
UCE-DSO210 DIGITAL OSCILLOSCOPE USER MANUAL. FATIH GENÇ UCORE ELECTRONICS REV1
 UCE-DSO210 DIGITAL OSCILLOSCOPE USER MANUAL FATIH GENÇ UCORE ELECTRONICS www.ucore-electronics.com 2017 - REV1 Contents 1. Introduction... 2 2. Turn on or turn off... 3 3. Oscilloscope Mode... 3 3.1. Display
FREQUENCY RESPONSE OF R, L AND C ELEMENTS
 FREQUENCY RESPONSE OF R, L AND C ELEMENTS Marking scheme : Methods & diagrams : 3 Graph plotting : - Tables & analysis : 2 Questions & discussion : 3 Performance : 2 Aim: This experiment will investigate
PHY 123/253 Shot Noise
 PHY 123/253 Shot Noise HISTORY Complete Pre- Lab before starting this experiment In 1918, experimental physicist Walter Scottky working in the research lab at Siemens was investigating the origins of noise
Response spectrum Time history Power Spectral Density, PSD
 A description is given of one way to implement an earthquake test where the test severities are specified by time histories. The test is done by using a biaxial computer aided servohydraulic test rig.
UNIT-3. Electronic Measurements & Instrumentation
 UNIT-3 1. Draw the Block Schematic of AF Wave analyzer and explain its principle and Working? ANS: The wave analyzer consists of a very narrow pass-band filter section which can Be tuned to a particular
Fourier Signal Analysis
 Part 1B Experimental Engineering Integrated Coursework Location: Baker Building South Wing Mechanics Lab Experiment A4 Signal Processing Fourier Signal Analysis Please bring the lab sheet from 1A experiment
The object of this experiment is to become familiar with the instruments used in the low noise laboratory.
 0. ORIENTATION 0.1 Object The object of this experiment is to become familiar with the instruments used in the low noise laboratory. 0.2 Parts The following parts are required for this experiment: 1. A
Experiment Guide: RC/RLC Filters and LabVIEW
 Description and ackground Experiment Guide: RC/RLC Filters and LabIEW In this lab you will (a) manipulate instruments manually to determine the input-output characteristics of an RC filter, and then (b)
Stratix II Filtering Lab
 October 2004, ver. 1.0 Application Note 362 Introduction The filtering reference design provided in the DSP Development Kit, Stratix II Edition, shows you how to use the Altera DSP Builder for system design,
Welcome to your second Electronics Laboratory Session. In this session you will learn about how to use resistors, capacitors and inductors to make
 Welcome to your second Electronics Laboratory Session. In this session you will learn about how to use resistors, capacitors and inductors to make simple circuits. You will find out how these circuits
EECS40 RLC Lab guide
 EECS40 RLC Lab guide Introduction Second-Order Circuits Second order circuits have both inductor and capacitor components, which produce one or more resonant frequencies, ω0. In general, a differential
Advanced Lab LAB 6: Signal Acquisition & Spectrum Analysis Using VirtualBench DSA Equipment: Objectives:
 Advanced Lab LAB 6: Signal Acquisition & Spectrum Analysis Using VirtualBench DSA Equipment: Pentium PC with National Instruments PCI-MIO-16E-4 data-acquisition board (12-bit resolution; software-controlled
HAMEG Programmable Measuring Instruments Series 8100
 HAMEG Programmable Measuring Instruments Series 8100 HAMEG Programmable Measuring Instruments Series 8100 are ideally suited for test installations in production and automated tests in laboratories. They
PHY3902 PHY3904. Nuclear magnetic resonance Laboratory Protocol
 PHY3902 PHY3904 Nuclear magnetic resonance Laboratory Protocol PHY3902 PHY3904 Nuclear magnetic resonance Laboratory Protocol GETTING STARTED You might be tempted now to put a sample in the probe and try
INVESTIGATION AND DESIGN OF HIGH CURRENT SOURCES FOR B-H LOOP MEASUREMENTS
 INVESTIGATION AND DESIGN OF HIGH CURRENT SOURCES FOR B-H LOOP MEASUREMENTS Boyanka Marinova Nikolova, Georgi Todorov Nikolov Faculty of Electronics and Technologies, Technical University of Sofia, Studenstki
1. Hand Calculations (in a manner suitable for submission) For the circuit in Fig. 1 with f = 7.2 khz and a source vin () t 1.
 For the circuit in Fig. 1 with f = 7.2 khz and a source vin () t 1.") Objectives The purpose of this laboratory project is to introduce to equipment, measurement techniques, and simulations commonly used in AC circuit analysis. In this laboratory session, each student will:
Objectives The purpose of this laboratory project is to introduce to equipment, measurement techniques, and simulations commonly used in AC circuit analysis. In this laboratory session, each student will:
EE320L Electronics I. Laboratory. Laboratory Exercise #6. Current-Voltage Characteristics of Electronic Devices. Angsuman Roy
 EE320L Electronics I Laboratory Laboratory Exercise #6 Current-Voltage Characteristics of Electronic Devices By Angsuman Roy Department of Electrical and Computer Engineering University of Nevada, Las
Integrators, differentiators, and simple filters
 BEE 233 Laboratory-4 Integrators, differentiators, and simple filters 1. Objectives Analyze and measure characteristics of circuits built with opamps. Design and test circuits with opamps. Plot gain vs.
Definitions. Spectrum Analyzer
 SIGNAL ANALYZERS Spectrum Analyzer Definitions A spectrum analyzer measures the magnitude of an input signal versus frequency within the full frequency range of the instrument. The primary use is to measure
Digital Applications of the Operational Amplifier
 Lab Procedure 1. Objective This project will show the versatile operation of an operational amplifier in a voltage comparator (Schmitt Trigger) circuit and a sample and hold circuit. 2. Components Qty
Class #9: Experiment Diodes Part II: LEDs
 Class #9: Experiment Diodes Part II: LEDs Purpose: The objective of this experiment is to become familiar with the properties and uses of LEDs, particularly as a communication device. This is a continuation
Lab 3 FFT based Spectrum Analyzer
 ECEn 487 Digital Signal Processing Laboratory Lab 3 FFT based Spectrum Analyzer Due Dates This is a three week lab. All TA check off must be completed prior to the beginning of class on the lab book submission
Bunch-by-bunch studies at DELTA
 Bunch-by-bunch studies at DELTA November 17 19, 29 Author: Dmitry Teytelman Revision: 1.2 March 3, 21 Copyright Dimtel, Inc., 21. All rights reserved. Dimtel, Inc. 259 Camden Avenue, Suite 136 San Jose,
University of Michigan EECS 311: Electronic Circuits Fall 2009 LAB 2 NON IDEAL OPAMPS
 University of Michigan EECS 311: Electronic Circuits Fall 2009 LAB 2 NON IDEAL OPAMPS Issued 10/5/2008 Pre Lab Completed 10/12/2008 Lab Due in Lecture 10/21/2008 Introduction In this lab you will characterize
EE 210 Lab Exercise #3 Introduction to PSPICE
 EE 210 Lab Exercise #3 Introduction to PSPICE Appending 4 in your Textbook contains a short tutorial on PSPICE. Additional information, tutorials and a demo version of PSPICE can be found at the manufacturer
Cornerstone Electronics Technology and Robotics Week 21 Electricity & Electronics Section 10.5, Oscilloscope
 Cornerstone Electronics Technology and Robotics Week 21 Electricity & Electronics Section 10.5, Oscilloscope Field trip to Deerhaven Generation Plant: Administration: o Prayer o Turn in quiz Electricity
LAB II. INTRODUCTION TO LAB EQUIPMENT
 1. OBJECTIVE LAB II. INTRODUCTION TO LAB EQUIPMENT In this lab you will learn how to properly operate the oscilloscope Keysight DSOX1102A, the Keithley Source Measure Unit (SMU) 2430, the function generator
AC LAB ECE-D ecestudy.wordpress.com
 PART B EXPERIMENT NO: 1 AIM: PULSE AMPLITUDE MODULATION (PAM) & DEMODULATION DATE: To study Pulse Amplitude modulation and demodulation process with relevant waveforms. APPARATUS: 1. Pulse amplitude modulation
LLRF4 Evaluation Board
 LLRF4 Evaluation Board USPAS Lab Reference Author: Dmitry Teytelman Revision: 1.1 June 11, 2009 Copyright Dimtel, Inc., 2009. All rights reserved. Dimtel, Inc. 2059 Camden Avenue, Suite 136 San Jose, CA
Hardware Inputs. Hardware Outputs. PC Connection. Software
 Hardware Inputs Analog channels - 4,8,16,32 or 64 synchronized Resolution - 24-bit, ADC Voltage ranges - ±10, ±1 or ±0.1 VPK Filtering - Anti-aliasing analog filtering 160 db/oct digital filtering Coupling
ECE 231 Laboratory Exercise 6 Frequency / Time Response of RL and RC Circuits
 ECE 231 Laboratory Exercise 6 Frequency / Time Response of RL and RC Circuits Laboratory Group (Names) OBJECTIVES Observe and calculate the response of first-order low pass and high pass filters. Gain