R/V Falkor Multibeam Echosounder System Review
|
|
|
- Luke Powers
- 5 years ago
- Views:
Transcription

1 University of New Hampshire University of New Hampshire Scholars' Repository Center for Coastal and Ocean Mapping Center for Coastal and Ocean Mapping R/V Falkor Multibeam Echosounder System Review Jonathan Beaudoin University of New Hampshire, Durham Paul D. Johnson University of New Hampshire, Durham, Ashton F. Flinders University of New Hampshire, Durham Follow this and additional works at: Part of the Oceanography and Atmospheric Sciences and Meteorology Commons Recommended Citation Beaudoin, Jonathan; Johnson, Paul D.; and Flinders, Ashton F., "R/V Falkor Multibeam Echosounder System Review" (2013). Center for Coastal and Ocean Mapping This Report is brought to you for free and open access by the Center for Coastal and Ocean Mapping at University of New Hampshire Scholars' Repository. It has been accepted for inclusion in Center for Coastal and Ocean Mapping by an authorized administrator of University of New Hampshire Scholars' Repository. For more information, please contact
2 R/V Falkor Multibeam Echosounder System Review This report is available at University of New Hampshire Scholars' Repository:

3 UNH- CCOM/JHC Technical Report April 2, 2012 R/V Falkor Multibeam Echosounder System Review Jonathan D. Beaudoin, Paul D. Johnson and Ashton F. Flinders Center for Coastal and Ocean Mapping/Joint Hydrographic Center University of New Hampshire Durham, NH 03824
4 R/V Falkor Multibeam Echosounder System Review April 2, 2013 Report prepared by: Jonathan D. Beaudoin, Paul D. Johnson and Ashton F. Flinders Center for Coastal and Ocean Mapping/Joint Hydrographic Center 24 Colovos Road University of New Hampshire Durham, NH
5 Table of Contents Introduction...3 System Overview and Ancillary Instrumentation...4 Transducer and System Health...5 Noise Levels...8 Coverage Evaluation Accuracy Evaluation Acoustic Imagery Quality Software Installation SVP Editor Recommendations Follow-Up of 2012 Recommendations Recommendations from 2013 System Review Conclusion References Appendix A EM710 Noise Measurements Appendix B EM302 Noise Measurements Appendix C EM710 Accuracy Testing Appendix D EM302 Accuracy Testing Appendix F EM710 Acoustic Imagery Quality Appendix G EM302 Acoustic Imagery Quality
6 Introduction RV Falkor is equipped with Kongsberg Maritime (KM) EM302 and EM710 multibeam echosounders (MBES). Both systems were the subject of an annual system checkup conducted over March 1-4, 2013 in the vicinity of the Bahamas (Fig. 1) with the intention of verifying that performance levels of the systems had not degraded during the first year of operation. In our experience, multibeam system performance can degrade in terms of: Efficiency (swath coverage): Transducer degradation and changes in self- noise levels can compromise the maximum range/depth performance. What this means to the end- user is that the system achieves less coverage than expected and is thus less efficient as a mapping platform. Monitoring various subsystems, along with assessing coverage abilities, gives an idea of the overall acoustic health of the system as a whole. Bathymetric data quality: Bathymetric measurement artifacts can result from a number of sources, including faulty configuration of the multibeam and/or ancillary sensors or degradation in performance of the same. Geometric calibration and follow- up accuracy testing is an important set of tests that confirm the quality of the bathymetric data that is acquired. Acoustic imagery quality: Acoustic imagery, either of the seabed or of water column scatterers, is another data product commonly available from multibeam systems. Acoustic noise levels can degrade the quality of imagery, especially in cases of transient noise events. Other potential sources of artifacts include incorrect sector/swath normalization that can be difficult to correct in post- processing. Imagery products should be examined to identify and correct problems. To assess RV Falkor s two multibeam systems, the following test procedures were done during the cruise: 1. Transducer and System Health 2. Noise Evaluation 3. Coverage Evaluation 4. Geometric Calibration 5. Accuracy Evaluation 6. Acoustic Imagery Quality Evaluation It is the intent of this report to document the outcome of the evaluation trials and to provide an assessment of the capabilities of both systems with respect to the original baseline assessment conducted during the sea acceptance tests (SAT) conducted in May and July of 2012 (Beaudoin et al., 2012). 3

7 Figure 1. Overview of cruise track with EM302 bathymetry collected during the trials. System Overview and Ancillary Instrumentation The EM302 is a 30 khz MBES capable of full ocean depth mapping though it is most optimally used in depths from 1,500 to 3,000 m. The EM302 system is available in a number of transmit/receiver configurations; the system aboard Falkor provides 1 x1 angular resolution, yielding seafloor sounding resolution on the order of 1.7% of oblique range. Though the system is nominally 30 khz, the full frequency range is khz. The EM710 frequency range spans khz; the system aboard RV Falkor is capable of 0.5 x1.0 transmit and receiver angular resolution, respectively. The EM710 system is well suited for continental shelf mapping with maximum coverage being achieved at depths typically between 500-1,000 m. Maximum depth performance is typically less then 2,000 m. Both systems allow for seafloor mapping over a swath of 140, giving a roll stabilized coverage up to 5.5 multiples of water depth (5.5 x w.d.). The systems are capable of multiple sector transmission, this allows for pitch/yaw motion stabilization and also multi- ping capabilities. The latter functionality doubles the 4
8 along- track sounding density and permits surveying at higher speeds without loss of data density. Both systems use the manufacturer s software to configure, monitor and acquire the data, namely Seafloor Information System (SIS), v The ancillary components of the two mapping suites aboard RV Falkor are listed below: SeaPath 320 heading, attitude and positioning sensor CNAV positioning correction service Seabird 9 Conductivity Temperature Depth (CTD) profiler Valeport SV profiler Turo XBT Valeport minisvs surface velocimeter SBE38 and SBE45 thermosalinograph All of the above systems were installed in 2011/2012 and were tested extensively in May and July of All systems were found to be operating correctly and overall results from the 2012 testing indicated that RV Falkor multibeam systems were well calibrated and were not noise limited. The initial 2012 tests provide a baseline against which long term monitoring of system performance can be compared to assess system degradation with time. Transducer and System Health A full Built- In Self Test (BIST) diagnostic routine was run dockside on both the EM302 and EM710 with both systems passing all tests prior to sailing. Among other tests, the BIST provides the ability to perform impedance measurements of the RX and TX array, these being useful in establishing the health of the transducers as these components of the mapping system can degrade with time. It is important to note that the BIST impedance measurements do not provide a full characterization of transducer properties as a function of frequency as performed by Ifremer in 2012 (Le Gall and Pacault, 2012), however, they are believed to be good indicators of overall transducer health over their lifetime, especially when conducted on a routine basis. The EM302 and EM710 receiver impedances and receiver transducer impedances, as measured through the BIST routines, were compared to measurements made during the system acceptance tests in 2012 and were found to be within the nominal acceptable range expected by the manufacturer (Fig. 2 and 3 for EM302 and Fig. 4 and 5 for EM710). The BIST output lists two sets of impedance measurements for the EM302 and the EM710, the first set being referred to as the receiver impedance and the second set being the transducer impedance. Clarification is being sought from the manufacturer as to the distinction between these two sets of measurements. From this point forward, we will refer to the first as the receiver channel impedance and the second as the transducer impedance. 5
9 EM302 impedances, for both receiver channels and receiver transducers were consistent with previous BIST output dating back to The same can be said of the EM710 receiver channel impedances, however, there are inconsistencies between the 2012 and 2013 results for the transducer impedances (Fig. 5). Despite the inconsistencies, the values reported are within the legal range specified in the BIST test and the test thus passes these values. Discussions with the manufacturer regarding the EM710 transducer impedance values indicate that changes in the overall impedance levels can occur due to differing environmental conditions under which the impedance tests are done and that the impedance of modules relative to each other is a better metric for monitoring health of the transducers. Upon reviewing the results for the EM710 with the manufacturer, we do not feel that there is warrant for concern seeing as all modules have approximately the same impedance within a given test, i.e. there are no modules with significant differences in impedance across the array. Documentation regarding the BIST output and procedures is being sought from the manufacturer to increase our understanding of the BIST operations and to facilitate interpretation of these, and future, BIST results. The transmitter channel impedance tests (not to be confused with receiver transducer impedances tests discussed above) passed for both systems, however, module level granularity of impedance values are not available through the BIST routines when run in SIS. It is our understanding that these values can be obtained through telnet BIST routines. A standard operating procedure is being developed and tested with the intent of providing instructions to MTs on how to add these additional testing procedures to their standard BIST schedule such that the transmitter impedances can be monitored at the module/element level. Figure 2. EM302 receiver impedance measurements. Historic measurements are in grey, red are from the 2013 test. 6
10 Figure 3. EM302 receiver transducer impedance measurements. Historic measurements are in grey, red are from the 2013 test. Figure 4. EM710 receiver impedance measurements. Historic measurements are in grey, red are from the 2013 test. 7
11 Figure 5. EM710 receiver transducer impedance measurements. Historic measurements are in grey, red are from the 2013 test. The values greater than 700 ohms are from tests acquired during the 2012 acceptance and sea trials in the North Atlantic. The values in middle group (~ ohms) are from the 2013 tests done in the Bahamas. The low values (~300 ohms) were acquired on , presumably during early factory testing. Noise Levels A potentially major limiting factor in multibeam coverage performance is the effect of self- noise, either mechanical or electrical, on the system s ability to detect and track the acoustic signal reflected from the seafloor. Comprehensive acoustic testing is possible for problematic installations (Gates and Yearta, 2012), however as RV Falkor was initially assessed as a quiet platform (Le Gall et al., 2012), a minimal set of acoustic test routines can be performed through the BIST noise testing routines to determine if significant changes have occurred in terms of noise levels. A short series of noise tests, as a function of vessel speed, were conducted in 1,275 m of water on a course of 20 (Fig. 1). Sea conditions throughout the noise test were: Wind: 17 kts at 290 T, 270 relative to ship s head Sea state: Beaufort 3 from 290 T, 270 relative to ship s head All acoustic instrumentation, including bridge echosounders, was secured as was all deck work. Power plant configuration was set to Science Mode : In this mode, the engine RPM and propeller pitch are firstly tuned at their minimum values (respectively 85 RPM and 5% pitch). Secondly, the propeller pitch raises (to the maximum value of 85%) to increase 8
12 the vessel speed. And when the propeller pitch has reached 85%, the engine RPM is boosted to more increase the vessel speed. (Le Gall et al., 2012) The receiver broadband noise level was measured using the BIST functionality with at least twenty tests being conducted at each speed. The output from one BIST noise test consists of the broadband noise level as measured across the typical reception bandwidth spectrum by each receiver channel, reported as db ref. 1μPa/ Hz (Fig. 6). Figure 6. Broadband noise level for EM302 receiver modules at vessel speed of 12 knots. The distribution of the data points in Fig. 6 is shown in Fig. 7 along with the median, geometric mean and linear mean. The geometric mean is the mean of the db values in their natural logarithmic units, i.e. an arithmetic mean of the db values. The linear mean is the mean of the noise levels in linear intensity units and then expressed in db. Refer to Appendices A and B for equivalent plots for both sensors at all speeds investigated in this work. 9
13 Figure 7. Distribution of noise level measurements for EM302 at 12 knots. The complete noise measurement data set is plotted as a color image for both the EM302 and EM710 in Fig. 8 and Fig. 9, respectively. This allows for examination of all data points and for a better appreciation of the likelihood and nature of transient noise events such as the event observed in test 20 for the EM710 (Fig. 9). The series of speed tests allow for construction of platform noise level versus ship speed for both the EM302 and EM710 (Fig. 10 and Fig. 11). In these figures, the data points from all receiver modules and for all tests at a given speed are plotted as black dots, along with the summary statistics across the speed range, indicating the mean (linear and geometric) and the median values for each speed. Noise level characteristics with speed were consistent with those observed in previous trials performed by Ifremer (Le Gall et al., 2012): 1. The EM302 increases in noise level from approximately 41 db to 43 db from speeds of 6 to 12 knots in Science Mode. 2. The EM710 noise level is independent of speed and is instead controlled by electronic self- noise on the order of 38 db in Science Mode. 10
, this coincides with the side of the vessel facing the direction of the")
14 Figure 8. EM302 broadband noise level results for all receiver modules over the course of the entire noise test. Transient noise events were observed at lower speeds on the port side of the array (ranging from module 0 to roughly module 24), this coincides with the side of the vessel facing the direction of the seas. Some modules exhibit systematically increased noise levels (~10 db) relative to the lowest levels observed on any given test. This is inconsistent with previous results observed in 2012 noise trials based on discussion with T. Gates and could be indicative of a slight change in the noise characteristics of the EM302 that should be monitored. Note that Ifremer noise measurement protocols differed slightly in the number of tests taken at each speed (they took three) and that the mean results computed from each triplet of tests is computed as a linear mean without any mention of the underlying distribution or whether or not outlier measurements were excluded from their analysis. The tests conducted in these trials involved more tests per speed (we took twenty) and several summary statistics are presented to ease comparisons between tests by different parties (e.g. Ifremer, Gates Acoustic 11
15 Services, etc). These comments are not made to point out deficiencies in the methods used by other parties, it is our intent simply to highlight that different parties approach the problem of noise evaluation in different manners and this must be appreciated if one is to compare results from differing methods. We are currently collaborating with the manufacturer and other parties to arrive at a prescribed set of best practices for the acquisition and treatment of noise level measurements. Figure 9. EM710 broadband noise level results for all receiver modules over the course of the entire noise test. 12
16 Figure 10. EM302 broadband noise level versus speed. Several noise transients can be observed during the testing in 2013; without the ability to monitor the noise environment with speakers, it is not possible to determine the source of these transient noise events. The summary statistics computed in this work include these transient events, this is most notable in the increase of the linear mean in some of the tests, particularly for the EM710. For example, note the dispersion of noise levels in Fig. 11 where some of the 20+ tests run at 0 knots reported noise levels as high as db. The geometric mean and the median are not affected nearly as much by the infrequent transients and thus provide a closer estimate of the true platform self noise level. 13
17 Figure 11. EM710 broadband noise level versus speed. Note effects of transient noises on the linear mean. Coverage Evaluation The noise and impedance evaluations test only some factors that control the performance, in terms of swath coverage, of a multibeam sonar. There are other factors at play and an overall assessment can be done by evaluate the achievable coverage and to compare this to a baseline performance level. This is sometimes a straightforward comparison, for example, when a ship always returns to the same home port, it is possible to build up a long time- series of coverage performance as it leaves and returns to port over the same track line. Coverage can be compared from differing areas of similar water depths, however, one must recall that environmental conditions can affect the achievable coverage and caution must be exercised when interpreting or comparing results from areas with different oceanographic regimes and/or seafloor composition. Following the methods used in the 2012 sea trials (Beaudoin et al., 2012), system swath coverage was evaluated over a set of test lines running perpendicular to 14
 during the transit to and from the")
18 depth contours down to abyssal depths (~4,800 m) just off the northern tip of Eleuthera Island (Fig. 1). Additional data were acquired over the Great Bahama Canyon in the Northeast Providence Channel between Eleuthera Island and Great Abaco Island (down to 4,500 m) during the transit to and from the coverage testing site. Both the EM710 and EM302 were run with the depth mode set to automatic where the systems chooses the depth mode automatically based on water depth. Coverage was similar to that achieved during previous trials (Beaudoin et al., 2012) with differences likely due to environmental parameters (oceanographic conditions affecting refraction and attenuation and differing seafloor backscatter). The EM710 maintained maximum angular swath coverage to depths of ~500 m (Fig. 12) whereas the EM302 held to ~1,500 m (Fig. 13). Figure 12. EM710 coverage evaluation. Previous investigations with the EM302 in 2012 were limited to ~3,000 m depth and the increased depth in these trials allowed for an initial assessment of achievable coverage at near full ocean depth. At 4,700 m depth, the system tracked a swath width of nearly 10 km on the high backscatter (- 15 db) foot of the slope. Coverage reduced to 8 km in the lower backscatter (- 25 db) abyssal plain. Coverage 15

19 at depth is slightly greater than that predicted by coverage performance monitoring done by Lurton as part of the 2012 sonar trials (Lurton, 2012). Figure 13. EM302 coverage evaluation. Deepest depths encountered were approximately 4,800 m in which the system achieved 2x w.d. coverage for a total swath width of nearly 10 km in the high backscatter seafloor at the foot of the slope and roughly 8 km in the lower backscatter areas in the abyssal plain. Sensor Geometry Verification and Calibration System calibration was done over three sites on the southern side of Northwest Providence Channel (Fig. 1) with both systems being calibrated simultaneously. Prior to calibration procedures, the linear and angular offsets of all seabed mapping system components (EM710, EM302, SeaPath 320) were compared to the previously documented settings to verify the configuration of the MRU and multibeam echosounder systems. Linear and angular offsets agreed in all cases. The EM302 and EM710 systems were configured with the angular offsets from the original survey report to provide a fresh baseline for the calibration. The mount angles for the MRU, as configured in the SeaPath software, were not modified. A standard patch test procedure was used to determine the residual angular 16
20 misalignment angles between the MRU and the EM710/EM302 arrays. Calibration lines were run with both systems operating simultaneously while fully synchronized with the EM302 as the master. Offsets were determined one at a time and were immediately evaluated and applied in SIS. This was immediately followed by a repeat of the calibration lines to confirm correct application of the offset from the first pass prior to moving to the next offset solution. Patch test seafloor imaging geometry was much more favorable compared to the original 2012 calibration done in Sognefjord, Norway and thus we have higher confidence in the offsets determined from this particular calibration. Residual angular offsets were nearly negligible (<0.10 for roll, pitch and heading) and were applied to the MRU angular offset fields for pitch and roll and the gyrocompass heading offset field for heading. This procedure differs from what was done during the previous calibration where the patch test offsets were applied to the multibeam arrays. This was done for a number of reasons: 1. This is the recommended practice by the manufacturer. 2. The reverse mounting of the 710 RX array requires a change in sign convention for application of pitch and roll patch test offsets; this can introduce human error. 3. The offsets are only entered once (for the MRU) instead of having to be entered twice (once for the TX array and again for the RX array). The latter method can introduce human error. 4. The offsets can be evaluated in the SIS calibration tool and applied immediately to the installation after acceptance without need of transcription. This protects against human error in transcriptions, sign conventions, etc. 5. After calibrations, it is easy to verify the transmitter and receiver installation angles against the original survey data since they remain unchanged from year to year. Final system installation results are summarized in Table 1 below, items in bold differ from the previous system installation geometry summarized in Beaudoin et al. (2012). Note that the heading offset is applied to the standalone- heading (typically a gyrocompass) since this is the location that the SIS calibration tool applies the heading offset. This is counter- intuitive and more information is being sought from the manufacturer as to whether or not this is indeed the best practice. Table 1. Summary of Installation Geometry as configured in SIS. Parameter EM710 EM302 Transmitter X m m Transmitter Y m m Transmitter Z 6.09 m 6.09 m Transmitter roll Transmitter pitch
21 Transmitter heading Receiver X m m Receiver Y m m Receiver Z 6.10 m 6.11 m Receiver roll Receiver pitch Receiver heading MRU X 0.00 m 0.00 m MRU Y 0.00 m 0.00 m MRU Z 0.00 m 0.00 m MRU roll MRU pitch MRU heading Stand- alone heading Waterline Z 0.57 m 0.57 m Positioning time latency 0.00 sec 0.00 sec Accuracy Evaluation Accuracy testing was conducted over two areas (Fig. 1), with average depths of 525 m and 1,275 m for the southern and northern sites, respectively. For both sites, reference surfaces were constructed over a flat seafloor by running 5 survey lines of 8 w.d. length, with 1 w.d. spacing. Vessel speed was limited to 5-6 knots in both cases. Prior to acquisition of the reference survey lines, an XBT profile was acquired and uploaded to the echosounders after processing with the SVP Editor software (discussed below). Both reference surface surveys ran with both echosounders running in a synchronized manner with the EM302 as the master. The EM710 and EM302 systems were run with the following configuration for the shallow and deep sites, respectively: DEEP mode with FM waveforms disabled Dynamic dual swath Pitch and Yaw stabilization enabled Angular sector limited to +/- 60 For the shallow site, the EM302 main line settings were the same as above except that the depth mode was SHALLOW. All soundings were corrected for tide using a global tidal model described in Florent et al. (2006). The reference surfaces were constructed using an inverse distance weighting gridding scheme with grid resolutions of ~1% of water depth. Soundings 18
22 contributed to the gridded solutions with a 1 beam footprint radius of influence and beam weighting scheme that provided more weight to soundings in the nadir region with beam weighting decaying linearly with beam number from nadir (loosely equivalent to a beam angle weighting scheme). Cross lines, run orthogonally to the main lines, were acquired with soundings from the cross lines being compared to the reference surfaces constructed from the main lines. Note that time constraints did not allow for testing of EM710 SHALLOW and VERY SHALLOW modes or of thorough examination of dual- swath/single- swath modes in those modes that support dual- swath. The EM302 cross lines were compared to the EM302 reference surface at the shallow site and the EM710 cross lines were compared to the EM710 reference surface. EM710 cross line data at the deep site were compared to the EM302 surface due to the limited coverage attained by the EM710 during the main line survey. In all cases, bathymetric slopes were computed from the reference surface and used as a mask to exclude areas of significant topography (>5 ) from the crossline analysis. Example results are shown for EM710 Medium mode (dual swath) in Fig. 14 with a scatter plot of the depth differences between a cross line and a reference surface as a function of beam angle. The mean depth bias is computed in 1 angular bins across the swath and is shown as the solid lines, these being color coded by sector and by swath number in the dual swath geometry (blue- red is swath #1 of 2, magenta- cyan is swath #2 of 2). The dashed lines, using the same color- coding, indicate the standard deviation in each 1 angular bin; these are also plotted as a function of beam angle in Fig. 15. Similar plots are presented in Appendix C and D for the various sounder modes investigated during the accuracy tests. Referring to the accuracy plots in Appendices C and D, both systems show beam depth biases less than 0.05% w.d. across the majority of their achievable swaths with small residual refraction- like artifacts in the outer portions of the swath. The shallow site crossline statistics highlight a slight directional dependence to the mean bias with a slight refraction artifact being observed in the outermost sector corresponding to the side of the vessel facing to the west (Fig. 14). The crosslines were acquired in the north- south direction at a speed of 5-6 kts and crabbing of ~15 was observed in both directions due to an easterly setting current. Yaw stabilization was configured to stabilize based on mean relative heading (instead of the survey line heading), thus aggressive yaw stabilization cannot be blamed since the mean heading remained more or less constant throughout the line regardless of the crabbing. The same effect is observed in both the EM710 and EM302 though it appears more pronounced in the EM302 due to its ability to sound over its full swath in those water depths (the EM710 was signal- to- noise limited in its outer sector in the water depths chosen for the shallow reference area). Given the directional dependence and consistency of the artifact with the direction of the current, this effect is likely environmental. 19
23 Figure 14. Accuracy analysis results, EM710 MEDIUM mode (dual swath). Note the slight upward curling artifact in the outer port side sector. Standard deviations about the mean bias are within +/- 0.15% w.d (1- σ) across the majority of the swath with higher uncertainties at the limits of the swath as expected. Noisy soundings do occur in the usual cases: a deeper mode is used than what is recommended for a particular water depth, etc. It is notable that the EM302 and EM710 reference surfaces differ by about 0.5 m (0.1% w.d.) at the shallow site (the EM302 surface is the deeper of the two). This could point to a slight vertical offset discrepancy between the two systems (unlikely) or that the EM302 routine tracks slightly deeper than the EM710 due to its lower frequency. This depth difference is on the order of the EM302 range resolution for the shallow site (1.1 ms pulse width). The accuracy testing also confirmed that the EM710 FM related data artifact identified in 2012 has been rectified by increasing the output rate of the FM Doppler corrections from the SeaPath from 1 Hz to 100 Hz. 20
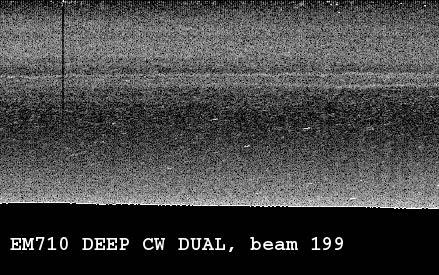
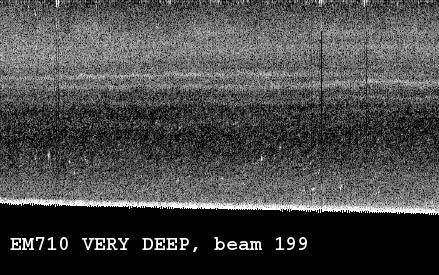
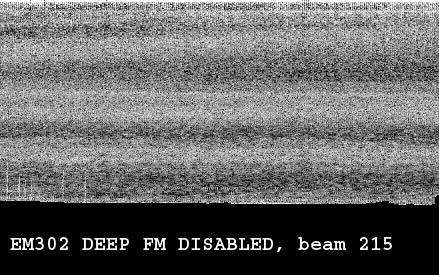
24 Figure 15. Accuracy analysis results, EM710 MEDIUM mode (dual swath). Acoustic Imagery Quality The multibeam systems were exercised through several depth modes during the accuracy trials. Acoustic imagery products were prepared for each mode and are included in Appendix E and F. Sample seabed and water column imagery for the EM302 in DEEP mode with FM waveforms enabled is shown in Fig. 16 and 17, respectively. The seabed imagery appears to remain well balanced between the swaths of the dual swath geometry. Sector balancing of the EM302 is satisfactory with only a few exceptions (Fig. 16, for example). These residual signal offsets are easily removed in most commercial software applications. Water column imagery is satisfactory with only occasional artifacts due to transient noise events and slight interference between the EM302 and EM710. Note that this interference does not affect the bottom tracking abilities of either system when run in a synchronized configuration but it may prove undesirable for water column mapping missions. 21
25 Figure 16. Raw seabed imagery from EM302 in DEEP mode with FM waveforms enabled. Vertical axis is ping and horizontal is across track distance (port side is on the left of the image). Note the bright band on the starboard side due to a sector source level imbalance. Figure 17. Water column imagery from center beam for EM302 in DEEP mode with FM waveforms enabled. Returns beyond the minimum slant-range are not included. Software Installation SVP Editor SVP Editor is an application that provides pre- processing tools to help bridge the gap between sound speed profiling instrumentation and multibeam echosounder 22
26 acquisition systems. This software was developed and is maintained by the Multibeam Advisory Committee (MAC) under NSF grant (Beaudoin, 2013). The software is freely available online at Version of the software was installed in 2012 on the CTD processing machine. The most recent version (1.0.4) was installed during the ship visit with training in new functionality provided to one of the MTs. The new version of the software was used throughout the trials described in this report and appears to be functioning correctly. Recommendations Follow- Up of 2012 Recommendations Recommendations from the 2012 final report on the multibeam status are repeated below along with follow up discussion as appropriate in bold text. 1. A yearly check up on the status of the system should be done either by the manufacturer or by a third party. This is obviously being followed. 2. Maintenance contracts should be sought with the manufacturer if these have not been pursued already. It is our understanding that this is still in progress and that arrangements for support are being sought with the US office (KUTI). 3. The configuration files should be loaded prior to every survey project to ensure a safe starting configuration. Any changes in system configuration (e.g. changing data ports, etc) should start by the import of the last known good settings, followed by the required changes and followed by an export of the updated settings as a new set of parameters. No system configuration changes were noted during the 2013 visit. This recommendation still applies, however. 4. A project file naming convention should be established for the multibeam data. The following format is suggested: CRUISEID_INSTRUMENT_SEQUENCE_SURVEYNAME Where: CRUISEID is the cruise identifier INSTRUMENT is either EM302 or EM710 SEQUENCE is zero- padded three digit integer that increments with cruise subprojects SURVEYNAME is a descriptive name for the particular project The CRUISEID allows for easy sorting of cruises. The INSTRUMENT field helps manage data by instrument. The SEQUENCE field helps keep cruise sub- projects sorted in the order that they were acquired. The SURVEYNAME helps keep track of the purpose of the survey. Here are some examples: 23
27 FK003_EM710_000_PatchTest FK003_EM710_001_TransitToArea FK003_EM710_002_MainSurvey FK003_EM710_003_ReturnTransit We have noted that a naming convention has been established and is being followed. 5. An automated backup and data transfer system for MBES data should be implemented. Data are currently copied manually (drag and drop) to the network data drive. This is HIGHLY error prone and will eventually result in loss of data. Common errors are: (1) copying data files while they are still actively being written to and (2) forgetting files. Further aggravating this is the fact that hand- made directory structures on the network may differ from the local directory structure. This makes it extremely difficult to ensure that all data have been transferred and backed up. Commercial software does exist to automate these tasks and should be sourced. Backup and transfer scripts, run perhaps from a Linux machine with access to both network directories, are another option but these rely heavily on all personnel being able to understand, modify and update the scripts. Automated backup procedures have been put in place. 6. MTs should prepare a set of standard operating procedures for the multibeam systems. The familiarity with the mapping systems varied between the technicians and such documentation will prove helpful in maintaining the level of service and knowledge in operating these systems as technicians rotate on and off the ship for crew changes. We were unable to assess technical competency of technicians during our visit due to time constraints. 7. It was found that the IP addresses of the two multibeam systems had changed between the two cruises. Upon investigation, it was found that the two machines were configured for DHCP network address assignment. This is acceptable, however, it is strongly recommended that the science computers be assigned static IP addresses by the DHCP server. This has been rectified. 8. The video matrix display has at least on occasion during the FK003 cruise contributed to loss of data. In this particular case, the last operator had left the mouse icon position over the Logging button in SIS. When the next operator wiggled the mouse to see what screen was active (a very common occurrence in such an installation), the overly sensitive built- in mouse pad on the keyboard reacted to the operator s touch as a mouse click event and subsequently caused the computer to stop logging data without the operator even realizing what they had done. During the second cruise, we all slowly learned to leave the mouse pointer somewhere safe on the screen when leaving the video matrix. The video matrix is likely most useful for monitoring of systems during which computer interaction is minimal. If 24
28 watch standing is to be done with the multibeam systems, or for any other system for that matter, it is recommended to use the dedicated workstations at the aft end of the lab. This recommendation still applies. Recommendations from 2013 System Review 1. An upgrade to a more recent version of SIS is recommended for the next visit. This would ideally entail a visit from a Kongsberg technician to perform the upgrade and also would be timed to occur during a 2014 system check up visit from UNH/CCOM. 2. MTs should familiarize themselves with new features of SVP Editor v Currently, only one of them has been shown the new features. 3. BIST tests should be routinely conducted (at least monthly). Meta data should be noted at the time of the BIST if noise measurements are to be of any use, e.g. ship speed, sea state/direction, wind speed/direction, water depth, other acoustic equipment in operation at time of test. A file naming convention should be established and followed. BIST output files should automatically be backed up along with other multibeam data. 4. An investigation into whether or not the second Seapath MRU could be used as a backup for the multibeams, without compromising its primary purpose, should be done. A patch test should be conducted if this is possible such that the angular offsets are known for this system in the event that it must be used for the multibeams. Conclusion The transducer impedances are similar to baseline measurements with exception of the EM710 transducer impedances. This latter potential issue is being examined with the manufacturer but we do not feel, after consultation with the manufacturer, that there is any cause for concern. Noise levels have not changed significantly since the 2012 trials in Science mode. Review of the noise results by Tim Gates indicates that there are some modules reporting higher noise levels compared to measurements taken by Gates in early 2012 and may warrant a closer investigation even though the system performance does not appear to have degraded. Despite the uncertainty associated with the EM710 transducer impedances, the consistency of achievable coverage relative to the 2012 results is a strong indicator that both systems, as a whole, have not experienced any acoustic degradation over their first year of life in terms of acoustic performance. Calibration of the two systems was performed with much more ideal seafloor imaging geometry compared to the 2012 patch test. The systems have been updated with the new calibration results. 25
29 Both multibeam systems provide bathymetric measurements that are in agreement with the expected performances of the systems and that are consistent with previous examinations. There is no evidence of degradation of ancillary sensor performance since the previous accuracy tests. Furthermore, the EM710 FM wobble data artifact identified in 2012 has indeed been corrected by increasing the MRU s data output rate for the Doppler velocity corrections required for FM waveforms. Seabed imagery quality is good and is generally artifact free. There are residual inter- sector imbalances with the EM302 despite the signal balancing routines undertaken in The EM710 has slight signal imbalances, however, it is not currently possible to correct for this using the same mechanism that is used for the EM302. In both cases, the residual offsets are easily corrected in commercial processing software. As a whole, the two multibeam systems are in satisfactory working condition and we do not anticipate any problems with either system for the 2013 mapping season. 26
30 References Beaudoin, J. (2013). SVP Editor Software Manual, Version (March 2, 2013), available online at ftp://ftp.ccom.unh.edu/fromccom/mac_data/svp_editor/v1.0.4_ /SVP Editor Manual v1.0.4.pdf Beaudoin, J., Johnson, P., Lurton, X. and Augustin, J.- M. (2012). R/V Falkor Multibeam Echosounder System Review. UNH- CCOM/JHC Technical Report , Sept. 4, Report, 57 pp. Florent, L., Lefevre, F., Letellier, T. and O. Francis (2006). Modelling the global ocean tides: modern insights from FES2004. Ocean Dynamics (2006) 56: ". Gates, T. and Yearta, M. (2012). R/V MELVILLE (AGOR 14): ACOUSTIC TRIAL RESULTS, Gates Acoustic Services technical report, 17 pp. Le Gall, Y. and Pacault, A. (2012). R/V FALKOR Sea- trials May 2012 (Horten dockside) Transducer measurements. Ifremer Technical Report, July 12, Report, 14 pp. Le Gall, Y., Duduyer, S., Pacault, A., Clec h, D., Lurton, X., and Floc h, H. (2012). R/V FALKOR Sea- trials May 2012 (Transit Horten- Bergen) Self- noise measurements. Ifremer Technical Report, July 23, Report, 20 pp. Lurton, X. (2012). R/V FALKOR Sea- trials July Coverage & Performance Predictions for Multibeam Echosounders. Ifremer Technical Report, July 23, Report, 16 pp. 27
31 Appendix A EM710 Noise Measurements All figures in this section show self- noise level for the EM710 as measured using the receiver hydrophones. The upper plots show the output as a function of receiver module. The lower plots show the distribution of the same data along with the median, geometric mean and linear mean. The geometric mean is the mean of the db values. The linear mean is the mean of the noise levels in linear intensity units and then transformed back to db. 28
32 29
33 30
34 31
35 32
36 33
37 34
38 35
39 36
40 37
41 38
42 39
43 Appendix B EM302 Noise Measurements All figures in this section show self- noise level for the EM302 as measured using the receiver hydrophones. The upper plots show the output as a function of receiver module. The lower plots show the distribution of the same data along with the median, geometric mean and linear mean. The geometric mean is the mean of the db values. The linear mean is the mean of the noise levels in linear intensity units and then transformed back to db. 40
44 41
45 42
46 43
47 44
48 45
49 46
50 47
51 48
52 49
53 50
54 51
55 Appendix C EM710 Accuracy Testing All figures in this section show a scatter plot of depth differences between cross line soundings and a reference surface in the lower half of the figure. The mean and standard deviation is computed in 1 bins across the swath with the mean plotted as a solid line and the standard deviation (1- σ) plotted as dashed lines. Color- coding corresponds to the transmission sectors, alternating in red- blue or magenta- cyan across the swath. Red- blue indicates data from the first swath of the dual- swath geometry and magenta- cyan is for the second swath of the dual- swath geometry. The upper half of each plot shows the standard deviations (the dashed- lines in the lower plot). 52
56 53
57 54
58 55
59 56
60 57
61 Appendix D EM302 Accuracy Testing All figures in this section show a scatter plot of depth differences between cross line soundings and a reference surface in the lower half of the figure. The mean and standard deviation is computed in 1 bins across the swath with the mean plotted as a solid line and the standard deviation (1- σ) plotted as dashed lines. Color- coding corresponds to the transmission sectors, alternating in red- blue or magenta- cyan across the swath. Red- blue indicates data from the first swath of the dual- swath geometry and magenta- cyan is for the second swath of the dual- swath geometry. The upper half of each plot shows the standard deviations (the dashed- lines in the lower plot). 58
62 59
63 60
64 61
65 62
66 63
67 64
68 65


69 Appendix F EM710 Acoustic Imagery Quality 66

70 67


71 68

72 69


73 70


74 Appendix G EM302 Acoustic Imagery Quality 71

75 72


76 73


77 74


78 75

79 76


80 77
R/V Falkor Multibeam Echosounder System Calibration September 22 24, 2014
 R/V Falkor Multibeam Echosounder System Calibration September 22 24, 2014 Report prepared by: Paul D. Johnson Ocean Mapping/Joint Hydrographic Center 24 Colovos Road University of New Hampshire Durham,
R/V Falkor Multibeam Echosounder System Review
 R/V Falkor Multibeam Echosounder System Review February 12, 2014 Report prepared by: Jonathan D. Beaudoin, Paul D. Johnson and Ashton F. Flinders Center for Coastal and Ocean Mapping/Joint Hydrographic
Optimizing Resolution and Uncertainty in Bathymetric Sonar Systems
 University of New Hampshire University of New Hampshire Scholars' Repository Center for Coastal and Ocean Mapping Center for Coastal and Ocean Mapping 6-2013 Optimizing Resolution and Uncertainty in Bathymetric
RVIB Nathaniel B. Palmer EM122 Multibeam Echosounder Sea Acceptance Trial for TX/RX Arrays NBP1505 June 10-15, 2015
 RVIB Nathaniel B. Palmer EM122 Multibeam Echosounder Sea Acceptance Trial for TX/RX Arrays NBP1505 June 10-15, 2015 Report prepared by: Paul Johnson and Kevin Jerram University of New Hampshire Center
Multibeam Echosounder Metadata and Quality Statistics
 Multibeam Echosounder Metadata and Quality Statistics Dave Mann, Survey Support Manager, Gardline Geosurvey Gardline MBES Systems Sea Explorer EM1002 RV Triton EM1002(S) Ocean Seeker EM1002(S) Ocean Endeavour
KONGSBERG seafloor-mapping echosounders
 KONGSBERG seafloor-mapping echosounders Berit Horvei WORLD CLASS through people, technology and dedication AGENDA Historical overview EM series Multibeam echosounder and Subbottom profiler Topside software.
SYSTEM 5900 SIDE SCAN SONAR
 SYSTEM 5900 SIDE SCAN SONAR HIGH-RESOLUTION, DYNAMICALLY FOCUSED, MULTI-BEAM SIDE SCAN SONAR Klein Marine System s 5900 sonar is the flagship in our exclusive family of multi-beam technology-based side
Phased Array Velocity Sensor Operational Advantages and Data Analysis
 Phased Array Velocity Sensor Operational Advantages and Data Analysis Matt Burdyny, Omer Poroy and Dr. Peter Spain Abstract - In recent years the underwater navigation industry has expanded into more diverse
Multibeam data quality assurance at Genavir. Karine Abel Michaux
 Multibeam data quality assurance at Genavir Hervé Bisquay hbisquay@genavir.fr Karine Abel Michaux kabelmic@genavir.fr Pascal Viollette pviollette@genavir.fr GENAVIR Genavir is the operator of the civilian
Broadband Temporal Coherence Results From the June 2003 Panama City Coherence Experiments
 Broadband Temporal Coherence Results From the June 2003 Panama City Coherence Experiments H. Chandler*, E. Kennedy*, R. Meredith*, R. Goodman**, S. Stanic* *Code 7184, Naval Research Laboratory Stennis
AN AIDED NAVIGATION POST PROCESSING FILTER FOR DETAILED SEABED MAPPING UUVS
 MODELING, IDENTIFICATION AND CONTROL, 1999, VOL. 20, NO. 3, 165-175 doi: 10.4173/mic.1999.3.2 AN AIDED NAVIGATION POST PROCESSING FILTER FOR DETAILED SEABED MAPPING UUVS Kenneth Gade and Bjørn Jalving
Company Profile. Facilities
 Company Profile R2Sonic was founded in February 2006 by three veteran underwater acoustical engineers; Jens R. Steenstrup, Mark Chun and Kirk Hobart; with the mission to utilize their experience to bring
Research Vessel Technical Enhancement Committee (RVTEC) November 2009 Meeting ISS - Integrated Survey Systems
 November 2009 Meeting ISS - Integrated Survey Systems") Research Vessel Technical Enhancement Committee (RVTEC) November 2009 Meeting ISS - Integrated Survey Systems John Kiernan, P.E. SAIC - Marine Science and Technology Division ISS-2000 Integrated Survey
Research Vessel Technical Enhancement Committee (RVTEC) November 2009 Meeting ISS - Integrated Survey Systems John Kiernan, P.E. SAIC - Marine Science and Technology Division ISS-2000 Integrated Survey
Autonomous Underwater Vehicle Navigation.
 Autonomous Underwater Vehicle Navigation. We are aware that electromagnetic energy cannot propagate appreciable distances in the ocean except at very low frequencies. As a result, GPS-based and other such
Hydroacoustic Aided Inertial Navigation System - HAIN A New Reference for DP
 Return to Session Directory Return to Session Directory Doug Phillips Failure is an Option DYNAMIC POSITIONING CONFERENCE October 9-10, 2007 Sensors Hydroacoustic Aided Inertial Navigation System - HAIN
Kongsberg Maritime Product overview
 Kongsberg Maritime Product overview / 1 / 1-Nov-12 Frequency Range Coverage 125,250,500kHz 0.5-200m 12xD 200-400kHz 0.5-500m 5.5xD / 140-200 deg 300 khz 0.5-270m 4-10xD / 130-200 deg 70-100 khz 3-2000m
Object Detection with Phase-Measuring Bathymetric Sidescan Sonar Depth Data
 Object Detection with Phase-Measuring Bathymetric Sidescan Sonar Depth Data Kevin Jerram and Val Schmidt Center for Coastal and Ocean Mapping Durham, New Hampshire A shipwreck and bedforms are visible
Tu A D Broadband Towed-Streamer Assessment, West Africa Deep Water Case Study
 Tu A15 09 4D Broadband Towed-Streamer Assessment, West Africa Deep Water Case Study D. Lecerf* (PGS), D. Raistrick (PGS), B. Caselitz (PGS), M. Wingham (BP), J. Bradley (BP), B. Moseley (formaly BP) Summary
INTRODUCING AN OPERATIONAL MULTI-BEAM ARRAY SONAR
 INTRODUCING AN OPERATIONAL MULTI-BEAM ARRAY SONAR b y Morris F. G l e n n Oceanographer U.S. Naval Oceanographic Office PRECIS The Multi-Beam Array Sonar Survey System is a revolutionary new bathymetric
Sonar advancements for coastal and maritime surveys
 ConférenceMéditerranéenneCôtièreetMaritime EDITION1,HAMMAMET,TUNISIE(2009) CoastalandMaritimeMediterraneanConference Disponibleenligne http://www.paralia.fr Availableonline Sonar advancements for coastal
Side-Scan Sonar Presentation STS
 Training Module Side-Scan Sonar Presentation STS SIDE-SCAN SONAR SAFETY Training Module Content: This module includes information on: Types of Side-Scan Benefits and Disadvantages System Configuration
The limits of spatial resolution achievable using a 30kHz multibeam sonar: model predictions and field results.
 The limits of spatial resolution achievable using a 30kHz multibeam sonar: model predictions and field results. John E. Hughes Clarke (1), James V. Gardner (2), Mike Torresan (2), and Larry Mayer (1) (1)
Corresponding author: Rebecca Woodgate,
 Correction of Teledyne Acoustic Doppler Current Profiler (ADCP) Bottom-Track Range Measurements for Instrument Pitch and Roll Rebecca A. Woodgate 1 and Alexander E. Holroyd 1 Applied Physics Laboratory,
Calibration of multibeam echo sounders: a comparison between two methodologies
 University of New Hampshire University of New Hampshire Scholars' Repository Center for Coastal and Ocean Mapping Center for Coastal and Ocean Mapping 11-2012 Calibration of multibeam echo sounders: a
Shallow Water Array Performance (SWAP): Array Element Localization and Performance Characterization
: Array Element Localization and Performance Characterization") Shallow Water Array Performance (SWAP): Array Element Localization and Performance Characterization Kent Scarbrough Advanced Technology Laboratory Applied Research Laboratories The University of Texas
Shallow Water Array Performance (SWAP): Array Element Localization and Performance Characterization Kent Scarbrough Advanced Technology Laboratory Applied Research Laboratories The University of Texas
Survey Sensors. 18/04/2018 Danny Wake Group Surveyor i-tech Services
 Survey Sensors 18/04/2018 Danny Wake Group Surveyor i-tech Services What do we need sensors for? For pure hydrographic surveying: Depth measurements Hazard identification Seabed composition Tides & currents
The Impact of Very High Frequency Surface Reverberation on Coherent Acoustic Propagation and Modeling
 DISTRIBUTION STATEMENT A. Approved for public release; distribution is unlimited. The Impact of Very High Frequency Surface Reverberation on Coherent Acoustic Propagation and Modeling Grant B. Deane Marine
EK60. SCIENTIFIC SOUNDER SCIENTIFIC ECHO SOUNDER
 EK60 SCIENTIFIC ECHO SOUNDER HIGH DYNAMIC RANGE RAW DATA RECORDING LOW SELF NOISE HIGH PING RATE MULTI FREQUENCY APPLICATION FOR SPECIES ID SEVERAL FREQUENCIES COVERING SAME SAMPLE VOLUME REMOTE CONTROL
HIGH FREQUENCY INTENSITY FLUCTUATIONS
 Proceedings of the Seventh European Conference on Underwater Acoustics, ECUA 004 Delft, The Netherlands 5-8 July, 004 HIGH FREQUENCY INTENSITY FLUCTUATIONS S.D. Lutz, D.L. Bradley, and R.L. Culver Steven
Simrad SX90 Long range high definition sonar system
 Simrad SX90 Long range high definition sonar system 360 omnidirectional sonar 90 vertical tip mode 20 to 30 KHz operational frequency Narrow beams Selectable beam width Hyperbolic FM Large dynamic range
Acoustic Resonance Classification of Swimbladder-Bearing Fish
 Acoustic Resonance Classification of Swimbladder-Bearing Fish Timothy K. Stanton and Dezhang Chu Applied Ocean Physics and Engineering Department Woods Hole Oceanographic Institution Bigelow 201, MS #11
Radiated Noise of Research Vessels
 Radiated Noise of Research Vessels Greening the Research Fleet Workshop 10 January 2012 Christopher Barber Applied Research Laboratory Penn State University Ship Radiated Noise What makes noise? Propulsion
Mid-Frequency Reverberation Measurements with Full Companion Environmental Support
 DISTRIBUTION STATEMENT A. Approved for public release; distribution is unlimited. Mid-Frequency Reverberation Measurements with Full Companion Environmental Support Dajun (DJ) Tang Applied Physics Laboratory,
GeoSwath Plus Wide swath bathymetry and georeferenced side scan
 GeoSwath Plus Wide swath bathymetry and georeferenced side scan www.geoacoustics.com GeoSwath Plus Wide Swath Bathymetry and co-registered georeferenced side scan system We maximise marine performance
Generic Bathymetry Data - Interface Control Document
 Generic Bathymetry Data - Interface Control Document For WASSP Prepared by: Keith Fletcher Electronic Navigation Ltd October 15, 2013 Version 2.2 2013 by WASSP Ltd No part of this document should be reproduced
EM 710. Multibeam echo sounder
 EM 710 Multibeam echo sounder EM 710 Multibeam echo sounder Product description This document presents a brief technical description of the EM 710 multibeam echo sounder. About this document Rev Date
Remote Sensing: John Wilkin IMCS Building Room 211C ext 251. Active microwave systems (1) Satellite Altimetry
 Satellite Altimetry") Remote Sensing: John Wilkin wilkin@marine.rutgers.edu IMCS Building Room 211C 732-932-6555 ext 251 Active microwave systems (1) Satellite Altimetry Active microwave instruments Scatterometer (scattering
Remote Sensing: John Wilkin wilkin@marine.rutgers.edu IMCS Building Room 211C 732-932-6555 ext 251 Active microwave systems (1) Satellite Altimetry Active microwave instruments Scatterometer (scattering
Sea Surface Backscatter Distortions of Scanning Radar Altimeter Ocean Wave Measurements
 Sea Surface Backscatter Distortions of Scanning Radar Altimeter Ocean Wave Measurements Edward J. Walsh and C. Wayne Wright NASA Goddard Space Flight Center Wallops Flight Facility Wallops Island, VA 23337
Modeling high-frequency reverberation and propagation loss in support of a submarine target strength trial
 Acoustics 8 Paris Modeling high-frequency reverberation and propagation loss in support of a submarine target strength trial B. Vasiliev and A. Collier DRDC Atlantic, 9 Grove St., Dartmouth, NS B2Y 3Z7,
Three-dimensional investigation of buried structures with multi-transducer parametric sub-bottom profiler as part of hydrographical applications
 Three-dimensional investigation of buried structures with multi-transducer parametric sub-bottom profiler as part Jens LOWAG, Germany, Dr. Jens WUNDERLICH, Germany, Peter HUEMBS, Germany Key words: parametric,
MAKING TRANSIENT ANTENNA MEASUREMENTS
 MAKING TRANSIENT ANTENNA MEASUREMENTS Roger Dygert, Steven R. Nichols MI Technologies, 1125 Satellite Boulevard, Suite 100 Suwanee, GA 30024-4629 ABSTRACT In addition to steady state performance, antennas
Old House Channel Bathymetric and Side Scan Survey
 FIELD RESEARCH FACILITY DUCK, NC Old House Channel Bathymetric and Side Scan Survey COASTAL AND HYDRAULICS LABORATORY FIELD DATA COLLECTION AND ANALYSIS BRANCH Michael Forte December 2009 View looking
P a g e 1 ST985. TDR Cable Analyzer Instruction Manual. Analog Arts Inc.
 P a g e 1 ST985 TDR Cable Analyzer Instruction Manual Analog Arts Inc. www.analogarts.com P a g e 2 Contents Software Installation... 4 Specifications... 4 Handling Precautions... 4 Operation Instruction...
PHINS, An All-In-One Sensor for DP Applications
 DYNAMIC POSITIONING CONFERENCE September 28-30, 2004 Sensors PHINS, An All-In-One Sensor for DP Applications Yves PATUREL IXSea (Marly le Roi, France) ABSTRACT DP positioning sensors are mainly GPS receivers
ACOUSTIC CALIBRATION AND BATHYMETRIC PROCESSING WITH A KLEIN 5410 SIDESCAN SONAR. JAMES MICHAEL GLYNN, JR. B.S.E.E., University of New Hampshire, 2004
 ACOUSTIC CALIBRATION AND BATHYMETRIC PROCESSING WITH A KLEIN 5410 SIDESCAN SONAR BY JAMES MICHAEL GLYNN, JR. B.S.E.E., University of New Hampshire, 2004 THESIS Submitted to the University of New Hampshire
Analysis of South China Sea Shelf and Basin Acoustic Transmission Data
 DISTRIBUTION STATEMENT A: Distribution approved for public release; distribution is unlimited. Analysis of South China Sea Shelf and Basin Acoustic Transmission Data Ching-Sang Chiu Department of Oceanography
The Discussion of this exercise covers the following points:
 Exercise 3-2 Frequency-Modulated CW Radar EXERCISE OBJECTIVE When you have completed this exercise, you will be familiar with FM ranging using frequency-modulated continuous-wave (FM-CW) radar. DISCUSSION
Handling Interferometric Data: Streamlining the Processing Flow
 Handling Interferometric Data: Streamlining the Processing Flow Paper 5 at Hydro8, 4 th November 2008 Tom Hiller, Advanced Products Manager, GeoAcoustics Ltd. WORLD CLASS through people, technology and
Rec. ITU-R F RECOMMENDATION ITU-R F *
 Rec. ITU-R F.162-3 1 RECOMMENDATION ITU-R F.162-3 * Rec. ITU-R F.162-3 USE OF DIRECTIONAL TRANSMITTING ANTENNAS IN THE FIXED SERVICE OPERATING IN BANDS BELOW ABOUT 30 MHz (Question 150/9) (1953-1956-1966-1970-1992)
Using Frequency Diversity to Improve Measurement Speed Roger Dygert MI Technologies, 1125 Satellite Blvd., Suite 100 Suwanee, GA 30024
 Using Frequency Diversity to Improve Measurement Speed Roger Dygert MI Technologies, 1125 Satellite Blvd., Suite 1 Suwanee, GA 324 ABSTRACT Conventional antenna measurement systems use a multiplexer or
HIGH-FREQUENCY ACOUSTIC PROPAGATION IN THE PRESENCE OF OCEANOGRAPHIC VARIABILITY
 HIGH-FREQUENCY ACOUSTIC PROPAGATION IN THE PRESENCE OF OCEANOGRAPHIC VARIABILITY M. BADIEY, K. WONG, AND L. LENAIN College of Marine Studies, University of Delaware Newark DE 19716, USA E-mail: Badiey@udel.edu
Kongsberg Seatex AS Pirsenteret N-7462 Trondheim Norway POSITION 303 VELOCITY 900 HEADING 910 ATTITUDE 413 HEAVE 888
 WinFrog Device Group: Device Name/Model: Device Manufacturer: Device Data String(s) Output to WinFrog: WinFrog Data String(s) Output to Device: WinFrog Data Item(s) and their RAW record: GPS SEAPATH Kongsberg
AN ACOUSTIC PIPELINE TRACKING AND SURVEY SYSTEM FOR THE OFFSHORE
 AN ACOUSTIC PIPELINE TRACKING AND SURVEY SYSTEM FOR THE OFFSHORE Nico Roosnek Roosnek Research & Development Vlaskamp 92 2592 AC The Hague The Netherlands e-mail: nico@roosnek.nl Abstract: Acoustic pipeline
High Frequency Acoustic Channel Characterization for Propagation and Ambient Noise
 High Frequency Acoustic Channel Characterization for Propagation and Ambient Noise Martin Siderius Portland State University, ECE Department 1900 SW 4 th Ave., Portland, OR 97201 phone: (503) 725-3223
Laboratory 1: Uncertainty Analysis
 University of Alabama Department of Physics and Astronomy PH101 / LeClair May 26, 2014 Laboratory 1: Uncertainty Analysis Hypothesis: A statistical analysis including both mean and standard deviation can
Teledyne Marine Acoustic Imagining
 RESON SeaBat high performance sonars for long range object detection and MCM applications Navigation, object avoidance & up close inspection with BlueView Greg Probst Sales Manager, Defense Teledyne Marine
HD Radio FM Transmission. System Specifications
 HD Radio FM Transmission System Specifications Rev. G December 14, 2016 SY_SSS_1026s TRADEMARKS HD Radio and the HD, HD Radio, and Arc logos are proprietary trademarks of ibiquity Digital Corporation.
NASNet DPR - NASNet as a deepwater acoustic DP position reference
 DYNAMIC POSITIONING CONFERENCE October 12-13, 2010 SENSORS I SESSION NASNet DPR - NASNet as a deepwater acoustic DP position reference By Sam Hanton DP Conference Houston October 12-13, 2010 Page 1 Introduction
Observation of sound focusing and defocusing due to propagating nonlinear internal waves
 Observation of sound focusing and defocusing due to propagating nonlinear internal waves J. Luo, M. Badiey, and E. A. Karjadi College of Marine and Earth Studies, University of Delaware, Newark, Delaware
Frequency and Time Domain Representation of Sinusoidal Signals
 Frequency and Time Domain Representation of Sinusoidal Signals By: Larry Dunleavy Wireless and Microwave Instruments University of South Florida Objectives 1. To review representations of sinusoidal signals
Remote Sensing: John Wilkin IMCS Building Room 211C ext 251. Active microwave systems (1) Satellite Altimetry
 Satellite Altimetry") Remote Sensing: John Wilkin wilkin@marine.rutgers.edu IMCS Building Room 211C 732-932-6555 ext 251 Active microwave systems (1) Satellite Altimetry Active microwave instruments Scatterometer (scattering
Remote Sensing: John Wilkin wilkin@marine.rutgers.edu IMCS Building Room 211C 732-932-6555 ext 251 Active microwave systems (1) Satellite Altimetry Active microwave instruments Scatterometer (scattering
Object Detection for Underwater Port Security
 Object Detection for Underwater Port Security Dr. Lloyd Huff LCHUFF CONSULTANCY,LLC Mr. John Thomas TRITON IMAGING,INC Shallow Survey 2012 February 22, 2012 INTRODUCTION I am glad to be here today to make
Active microwave systems (1) Satellite Altimetry
 Satellite Altimetry") Remote Sensing: John Wilkin Active microwave systems (1) Satellite Altimetry jwilkin@rutgers.edu IMCS Building Room 214C 732-932-6555 ext 251 Active microwave instruments Scatterometer (scattering from
Remote Sensing: John Wilkin Active microwave systems (1) Satellite Altimetry jwilkin@rutgers.edu IMCS Building Room 214C 732-932-6555 ext 251 Active microwave instruments Scatterometer (scattering from
MULTIPATH EFFECT ON DPCA MICRONAVIGATION OF A SYNTHETIC APERTURE SONAR
 MULTIPATH EFFECT ON DPCA MICRONAVIGATION OF A SYNTHETIC APERTURE SONAR L. WANG, G. DAVIES, A. BELLETTINI AND M. PINTO SACLANT Undersea Research Centre, Viale San Bartolomeo 400, 19138 La Spezia, Italy
Increased Safety and Efficiency using 3D Real-Time Sonar for Subsea Construction
 Increased Safety and Efficiency using 3D Real-Time Sonar for Subsea Construction Chief Technology Officer CodaOctopus Products, Ltd. Booth A33a 2D, 3D and Real-Time 3D (4D) Sonars? 2D Imaging 3D Multibeam
BROADBAND ACOUSTIC SIGNAL VARIABILITY IN TWO TYPICAL SHALLOW-WATER REGIONS
 BROADBAND ACOUSTIC SIGNAL VARIABILITY IN TWO TYPICAL SHALLOW-WATER REGIONS PETER L. NIELSEN SACLANT Undersea Research Centre, Viale San Bartolomeo 400, 19138 La Spezia, Italy E-mail: nielsen@saclantc.nato.int
Proper Environmental Reduction for Attenuation in Multi-sector Sonars
 Rodrigo de Campos CARVALHO, Brazil and John E. HUGHES CLARKE, Canada SUMMARY Multibeam backscatter data represent a major seabed discrimination tool. For seafloor characterization, however, one of the
27/11/2013' OCEANOGRAPHIC APPLICATIONS. Acoustic Current Meters
 egm502 seafloor mapping lecture 17 water column applications OCEANOGRAPHIC APPLICATIONS Acoustic Current Meters An acoustic current meter is a set of transducers fixed in a frame. Acoustic current meters
Dispersion of Sound in Marine Sediments
 DISTRIBUTION STATEMENT A. Approved for public release; distribution is unlimited. Dispersion of Sound in Marine Sediments N. Ross Chapman School of Earth and Ocean Sciences University of Victoria 3800
Acoustic Communications and Navigation for Mobile Under-Ice Sensors
 DISTRIBUTION STATEMENT A. Approved for public release; distribution is unlimited. Acoustic Communications and Navigation for Mobile Under-Ice Sensors Lee Freitag Applied Ocean Physics and Engineering 266
MULTI-CHANNEL SAR EXPERIMENTS FROM THE SPACE AND FROM GROUND: POTENTIAL EVOLUTION OF PRESENT GENERATION SPACEBORNE SAR
 3 nd International Workshop on Science and Applications of SAR Polarimetry and Polarimetric Interferometry POLinSAR 2007 January 25, 2007 ESA/ESRIN Frascati, Italy MULTI-CHANNEL SAR EXPERIMENTS FROM THE
The ship RV Timba repairs are now almost complete and it is expected that come September 2014 the ship will be fully operational.
 Malawi National Report 2014 1 Malawi Hydrographic Office The assembly of the 70 ton ship RV Timba with the assistance of the French government in 1989 ushered in the commencement of modern hydrographic
Semi-buried seabed object detection: Sonar vs. Geophysical methods
 Semi-buried seabed object detection: Sonar vs. Geophysical methods Dino DRAGUN, Croatia, Lieselot NOPPE, Belgium, Pierre SERPE, Belgium, Emeline CARON, France, Astrid ROBERT, France Key words: Site Investigation,
Applications of iusbl Technology overview
 Applications of iusbl Technology overview Tom Bennetts Project Manager Summary 1. What is iusbl and its target applications 2. Advantages of iusbl and sample data 3. Technical hurdles and Calibration methods
Pioneers of Wideband High Resolution Multibeam Systems
 Pioneers of Wideband High Resolution Multibeam Systems W W W. R 2 S O N I C. C O M Systems Overview The R2Sonic Sonic Series are the world s first true wideband high resolution Motion Heading SV GPS shallow
Exercise 1-4. The Radar Equation EXERCISE OBJECTIVE DISCUSSION OUTLINE DISCUSSION OF FUNDAMENTALS
 Exercise 1-4 The Radar Equation EXERCISE OBJECTIVE When you have completed this exercise, you will be familiar with the different parameters in the radar equation, and with the interaction between these
Exercise 1-3. Radar Antennas EXERCISE OBJECTIVE DISCUSSION OUTLINE DISCUSSION OF FUNDAMENTALS. Antenna types
 Exercise 1-3 Radar Antennas EXERCISE OBJECTIVE When you have completed this exercise, you will be familiar with the role of the antenna in a radar system. You will also be familiar with the intrinsic characteristics
MARKSMAN DP-INS DYNAMIC POSITIONING INERTIAL REFERENCE SYSTEM
 cc MARKSMAN DP-INS DYNAMIC POSITIONING INERTIAL REFERENCE SYSTEM Sonardyne s Marksman DP-INS is an advanced navigation-based Position Measuring Equipment (PME) source for dynamically positioned (DP) rigs.
Acoustics Digital, Spread Spectrum, DSP, Wideband What does this mean for Real World DP Operations? Jonathan Davis Sonardyne Inc
 Subsea Positioning & Communications Acoustics Digital, Spread Spectrum, DSP, Wideband What does this mean for Real World DP Operations? Jonathan Davis Sonardyne Inc Outline Introduction Signal Processing
CALTRANS BATHYMETRIC SURVEY VICINITY OF YERBA BUENA ISLAND AND OAKLAND MOLE ALONG SFOBB SAN FRANCISCO BAY
 FUGRO PELAGOS, INC. CALTRANS BATHYMETRIC SURVEY VICINITY OF YERBA BUENA ISLAND AND OAKLAND MOLE ALONG SFOBB SAN FRANCISCO BAY CALTRANS CONTRACT 59A0053 Survey Period: February 25 th March 1 st, 2013 Report
18th World Conference on Non-destructive Testing, April 2012, Durban, South Africa
 18th World Conference on Non-destructive Testing, 16-20 April 20, Durban, South Africa Guided Wave Testing for touch point corrosion David ALLEYNE Guided Ultrasonics Ltd, London, UK; Phone: +44 2082329102;
11. Lowered Acoustic Doppler Current Profiler (LADCP)
") 11. Lowered Acoustic Doppler Current Profiler (LADCP) 11.1 Instrument Setup The JC031 Drake Passage cruise began in Punta Arenas equipped with a compliment of 3 fully functioning LADCP s, all the same
11. Lowered Acoustic Doppler Current Profiler (LADCP) 11.1 Instrument Setup The JC031 Drake Passage cruise began in Punta Arenas equipped with a compliment of 3 fully functioning LADCP s, all the same
SECTION 2 BROADBAND RF CHARACTERISTICS. 2.1 Frequency bands
 SECTION 2 BROADBAND RF CHARACTERISTICS 2.1 Frequency bands 2.1.1 Use of AMS(R)S bands Note.- Categories of messages, and their relative priorities within the aeronautical mobile (R) service, are given
Why not narrowband? Philip Fontana* and Mikhail Makhorin, Polarcus; Thomas Cheriyan and Lee Saxton, GX Technology
 Philip Fontana* and Mikhail Makhorin, Polarcus; Thomas Cheriyan and Lee Saxton, GX Technology Summary A 2D towed streamer acquisition experiment was conducted in deep water offshore Gabon to evaluate techniques
Process Metrix Mobile Laser Contouring System (LCS) for Converter Lining Thickness Monitoring
 for Converter Lining Thickness Monitoring") Process Metrix Mobile Laser Contouring System (LCS) for Converter Lining Thickness Monitoring Process Metrix 6622 Owens Drive Pleasanton, CA 94588 USA Process Metrix A History of Instrumentation Development
Process Metrix Mobile Laser Contouring System (LCS) for Converter Lining Thickness Monitoring Process Metrix 6622 Owens Drive Pleasanton, CA 94588 USA Process Metrix A History of Instrumentation Development
APPLICATIONS OF KINEMATIC GPS AT SHOM
 International Hydrographic Review, Monaco, LXXVI(1), March 1999 APPLICATIONS OF KINEMATIC GPS AT SHOM by Michel EVEN 1 Abstract The GPS in kinematic mode has now been in use at SHOM for several years in
A Final Report to. The New Hampshire Estuaries Project. Submitted by
 OYSTER (CRASSOSTREA VIRGINICA) REEF MAPPING IN THE GREAT BAY ESTUARY, NEW HAMPSHIRE - 2003 A Final Report to The New Hampshire Estuaries Project Submitted by Raymond E. Grizzle and Melissa Brodeur University
Statistical Pulse Measurements using USB Power Sensors
 Statistical Pulse Measurements using USB Power Sensors Today s modern USB Power Sensors are capable of many advanced power measurements. These Power Sensors are capable of demodulating the signal and processing
Calibrating a 90-kHz multibeam sonar
 Calibrating a 90-kHz multibeam sonar Dezhang Chu 1, Kenneth G. Foote 1, Lawrence C. Hufnagle, Jr. 2, Terence R. Hammar 1, Stephen P. Liberatore 1, Kenneth C. Baldwin 3, Larry A. Mayer 3, Andrew McLeod
Numerical Modeling of a Time Reversal Experiment in Shallow Singapore Waters
 Numerical Modeling of a Time Reversal Experiment in Shallow Singapore Waters H.C. Song, W.S. Hodgkiss, and J.D. Skinner Marine Physical Laboratory, Scripps Institution of Oceanography La Jolla, CA 92037-0238,
Sound Speed Manager: An Open-Source Initiative to Streamline the Hydrographic Data Acquisition Workflow
 Sound Speed Manager: An Open-Source Initiative to Streamline the Hydrographic Data Acquisition Workflow B. Gallagher 1, G. Masetti 2, C. Zhang 1, B.R. Calder 2, M.J. Wilson 3 (1) Coast Survey Development
Sonars TECHNOLOGY FOR SUSTAINABLE FISHERIES
 Sonars TECHNOLOGY FOR SUSTAINABLE FISHERIES SIMRAD SU90 SONAR The SU90 Sonar is made with no compromises. The number of channels has been increased by 50% compared to the SX90 Sonar giving the sonar an
SODAR- sonic detecting and ranging
 Active Remote Sensing of the PBL Immersed vs. remote sensors Active vs. passive sensors RADAR- radio detection and ranging WSR-88D TDWR wind profiler SODAR- sonic detecting and ranging minisodar RASS RADAR
Th B3 05 Advances in Seismic Interference Noise Attenuation
 Th B3 05 Advances in Seismic Interference Noise Attenuation T. Elboth* (CGG), H. Shen (CGG), J. Khan (CGG) Summary This paper presents recent advances in the area of seismic interference (SI) attenuation
Presented on. Mehul Supawala Marine Energy Sources Product Champion, WesternGeco
 Presented on Marine seismic acquisition and its potential impact on marine life has been a widely discussed topic and of interest to many. As scientific knowledge improves and operational criteria evolve,
Falkor 2017 UHDAS installation and ADCP evaluation
 Falkor 2017 UHDAS installation and ADCP evaluation Dr. Julia M Hummon University of Hawaii hummon@hawaii.edu Revision History 06/06/17 draft 07/03/17 final Table of Contents 1 Introduction...1 1.1 ADCPs...1
Figure 121: Broadcast FM Stations
 BC4 107.5 MHz Large Grid BC5 107.8 MHz Small Grid Figure 121: Broadcast FM Stations Page 195 This document is the exclusive property of Agilent Technologies UK Limited and cannot be reproduced without
Rec. ITU-R P RECOMMENDATION ITU-R P *
 Rec. ITU-R P.682-1 1 RECOMMENDATION ITU-R P.682-1 * PROPAGATION DATA REQUIRED FOR THE DESIGN OF EARTH-SPACE AERONAUTICAL MOBILE TELECOMMUNICATION SYSTEMS (Question ITU-R 207/3) Rec. 682-1 (1990-1992) The
Acoustic Communications and Navigation for Mobile Under-Ice Sensors
 DISTRIBUTION STATEMENT A. Approved for public release; distribution is unlimited. Acoustic Communications and Navigation for Mobile Under-Ice Sensors Lee Freitag Applied Ocean Physics and Engineering 266
Development of Mid-Frequency Multibeam Sonar for Fisheries Applications
 Development of Mid-Frequency Multibeam Sonar for Fisheries Applications John K. Horne University of Washington, School of Aquatic and Fishery Sciences Box 355020 Seattle, WA 98195 phone: (206) 221-6890