Simultaneous broadband laser ranging and photonic Doppler velocimetry for
|
|
|
- Bertina James
- 5 years ago
- Views:
Transcription
1 DOE/NV/ Simultaneous broadband laser ranging and photonic Doppler velocimetry for dynamic compression experiments B. M. La Lone, 1,a) B. R. Marshall, 1 E. K. Miller, 1 G. D. Stevens, 1 W. D. Turley, 1 L. R. Veeser 2 1 National Security Technologies, LLC, Special Technologies Laboratory, Santa Barbara, California 93111, USA 2 National Security Technologies, LLC, Los Alamos Operations, Los Alamos, New Mexico 87544, USA A diagnostic was developed to simultaneously measure both the distance and velocity of rapidly moving surfaces in dynamic compression experiments, specifically non-planar experiments where integrating the velocity in one direction does not always give the material position accurately. The diagnostic is constructed mainly from fiber-optic telecommunications components. The distance measurement is based on a technique described by Xia and Zhang [Opt. Express 18, 4118 (2010)], which determines the target distance every 20 ns and is independent of the target speed. We have extended the full range of the diagnostic to several centimeters to allow its use in dynamic experiments, and we multiplexed it with a photonic Doppler velocimetry (PDV) system so that distance and velocity histories can be measured simultaneously using one fiber-optic probe. The diagnostic was demonstrated on a spinning square cylinder to show how integrating a PDV record can give an incorrect surface position and how the ranging diagnostic described here obtains it directly. The diagnostic was also tested on an explosive experiment where copper fragments and surface ejecta were identified in both the distance and velocity signals. We show how the distance measurements complement the velocity data. Potential applications are discussed. a) Author to whom correspondence should be addressed: Electronic mail: lalonebm@nv.doe.gov. 1
2 I. INTRODUCTION Optical velocimetry measurements are central to nearly all dynamic experiments, from wave profile measurements in simple 1-D plate impact experiments to assessing the drive shape for imploding capsules at the National Ignition Facility. In many non-planar experiments, time-resolved surface position is also desired for comparison with hydrodynamic models and other diagnostics, such as radiography, but the position cannot always be obtained from the velocity data. In general, the surface distance cannot be found by integrating the measured surface velocity because velocimetry techniques such as VISAR 1 or PDV 2 measure only one component (parallel to the probe axis) of the surface velocity, and the direction of motion can be unknown or changing. Examples of dynamic events with significant off-normal motion are imploding (or expanding) cylindrical liners, 3 explosively driven frangible joints, 4 shaped charge liners, imploding hemispheres, 5 and expanding cylinder tests. 6, 7 Another problem with integrating the velocity is that sometimes new material, such as ejecta or target fragments, enters the field of view of the probe, and there is no reference position for this material. These limitations of velocity measurements have been discussed previously. 6,8,9 To obtain position information directly in dynamic experiments, researchers have relied on x-ray and optical imaging techniques or on arrival time measurements, such as with piezoelectric and electrical shorting pins. However, these are limited to a few snapshots in time in the case of imaging or a few discrete position points in the case of impact fiducial times. Therefore, a continuous time history of the surface position is still desired. Optical distance measurements in dynamic compression experiments are challenging because surfaces can be moving at many kilometers per second, and experiments occur on relatively small length (~1 mm) and time (~1 µs) scales. Therefore, a ranging diagnostic for dynamic experiments should have time resolution << 1 µs and position accuracy << 1 mm. Recently, Briggs et al. have demonstrated a frequency swept LIDAR technique on a moving projectile, 10 but the relatively low sampling rates and sensitivity to the Doppler shift are limitations for dynamic applications. 11 They are also exploring a technique based on the phase detection of a modulated light source. 6 This technique may be used in future dynamic experiments, but it will be limited to experiments with a single, well defined surface, and 2
3 obtaining accuracy to better than 100 µm may be a challenge. Weng et al. 12 recently demonstrated a fast ranging diagnostic with distance precision of < 1 µm; it records a white light interference spectrum with a high-speed streak camera and relays the light source to the target and from the target to the streak camera over a photonic crystal fiber. This approach may be useful for some dynamic applications. An alternative optical ranging technique that operates on a similar principle was developed earlier by Xia and Zhang. 13,14 They constructed an interferometric optical ranging method based mainly on fiber telecommunications components. A wide-spectrum, mode-locked fiber laser was used as the light source, and the interference spectrum was converted into the time domain with a dispersive element so that the entire spectrum could be recorded on a single photoreceiver. Their ranging technique is insensitive to the Doppler shift, is sampled every 20 ns, and was demonstrated in quasi-static applications with a measurement precision of 1.5 µm. In this work we adapted the Xia and Zhang technique to dynamic experiments by extending the full range to several centimeters. To obtain a simultaneous velocity measurement along a single probe s optical axis we added a PDV system. 2,15 We demonstrated the combined distance and velocimetry diagnostic on a spinning square cylinder and on an explosively driven copper surface. Both experiments demonstrate that the added distance measurement provides information that cannot be obtained from velocity data alone. II. TECHNIQUE FOR SIMULTANEOUS DISTANCE AND VELOCITY MEASUREMENT A diagram of the diagnostic is shown in Fig. 1. It is constructed almost entirely from fiber-optic telecommunications components. A mode-locked fiber laser made by either PolarOnyx 16 or Menlo, 17 with a short temporal pulse of < 1 ps and a wide spectral width of ~ 80 nm (10 THz), sends pulses of laser light through a fiber-based Mach-Zehnder interferometer. The target leg of the interferometer contains a circulator that sends and receives signals from the target via a collimating probe. The path length in the target leg is dependent on the target distance along the probe axis. The other leg of the interferometer is a fixed reference. The reference leg contains a variable delay to adjust the relative path lengths and a 3
4 polarization controller for fine tuning of the polarization, but these have been omitted in the figure for clarity. After the light in the target and reference legs recombines and interferes, a dispersive element converts the interference spectrum into the time domain for high-speed recording. We used either 35.3 or 70.6 km of Corning single-mode optical fiber 18 for chromatic dispersion of the signals. After dispersion, the signals are detected with a fast photoreceiver and digitizing oscilloscope with a combined 18 GHz bandwidth. Experiments using the PolarOnyx laser have a laser repetition rate of 50 MHz. When using the Menlo laser, a pulse picker divides the repetition rate down from 100 MHz to 25 MHz to prevent the pulses from overlapping during detection. Erbium-doped fiber amplifiers (EDFA) 19 are placed before and after the interferometer to increase signal levels. The amplifiers cause the spectral width to be narrower than the laser output so that the actual spectral width used is about 35 nm (4.5 THz). A single ITU 20 channel add/drop filter is inserted into the probe leg of the interferometer to multiplex a PDV system with the ranging measurement. Our PDV system operates at a wavelength of nm and this wavelength takes a different path through the add/drop filter than other wavelengths as indicated in Fig. 1. The PDV shares the probe optics, but otherwise it is a separate system that is recorded with a separate photoreceiver and digitizer channel. A recorded ranging signal for a single pulse leaving the fiber spool is shown in Fig. 2. Such pulses arrive either every 20 or 40 ns, depending on the repetition rate of the laser and pulse picker. The difference in path lengths between the target and reference legs sets up an interference pattern in the recorded spectral time history. The interference pattern in Fig. 2 was recorded with a target distance of 1.6 mm from the balance point of the interferometer and 35 km of dispersion fiber for converting the spectrum into the time domain. The missing interference near 5.5 ns is caused by the add/drop filter removing light with optical frequencies near the THz PDV-laser frequency. During analysis of the experimental data, the spacing between constructively interfering optical frequencies (Δν) determines the target s distance (d) from the balance point of the interferometer d = c/2δν, where c is the velocity of 4
5 light. Since the spectrum is recorded in the time-domain, the optical frequency spacing is detected as a beat frequency (F) on the photoreceiver, F = (dν/dt) / Δν, (1) where dν/dt is the optical frequency vs. time slope determined by the amount of dispersion in the spool of optical fiber. Therefore, d is proportional to the measured beat frequency, d = F c/[2(dν/dt)]. (2) Because the pulses have undergone negligible dispersion (<1/1000 of the total pulse dispersion) before reflecting from the target, the beat frequency in the recorded signal is independent of the Doppler shift and is a function of only the target distance. 13 It is assumed in deriving Eqs. (1) and (2) that the chromatic dispersion in the fiber is linear so that dν/dt is a constant. However, the chromatic dispersion in the optical fiber used here is slightly nonlinear. Fig. 3 shows measured optical frequencies and their divergence from linear as a function of time for 35.3 km of fiber. As discuss by Xia and Zhang, 12 this nonlinearity can be compensated for in the analysis; otherwise there will be a slight chirp in the beat frequency across a single pulse. We removed the nonlinear chromatic dispersion of the fiber by remapping time for each pulse to the adjusted variable t* = t + a t 2, where the variable a is chosen to compensate for the third-order fiber dispersion. Fig. 3 also shows the fiber dispersion data plotted as a function of t*. A linear fit to the optical frequency versus t* is an excellent match. We also tried using a higher order polynomial for remapping time, and this change resulted in only a slight improvement over the second order polynomial fit. It is important to note that since this is a correction for the nonlinear dispersion in the fiber spool, the time remap is independent of the target distance. For analysis of the experimental range data, we transform each recorded pulse to the t* domain and then perform a Fast Fourier Transform (FFT) to obtain the beat frequency. The beat frequencies are converted to positions using a calibration that was done prior to the experiment. This procedure generates a position spectrogram. For 35 km of fiber for dispersion, the distance-beat frequency calibration slope is about 0.6 mm/ghz; for 70 km of fiber it is about 1.2 mm/ghz. With 70 km of fiber for dispersion, the 5
6 maximum detectable target distance (d) is 22 mm with a recorded beat frequency of 18 GHz. Since a target can be tracked from d to +d, the diagnostic can track the position over a range of 44 mm if the balance point is centered initially in the target range. The PDV data are analyzed using a sliding window FFT. 2 We named the diagnostic simultaneous broadband laser ranging (BLR) and PDV. III. EXPERIMENTS We performed two kinds of experiments with the BLR-PDV diagnostic. First we measured the distance to the surface of a spinning square cylinder and the surface velocity in the probe direction. As was pointed out by Dolan, 8,9 a PDV or VISAR system measures only one component of the velocity and does not give the derivative of the distance-time curve for a spinning object. First, we performed the spinning square cylinder measurement to illustrate how the BLR technique records the true distance and how this differs from an integrated velocity measurement. The second experiment measured the distance and velocity of a copper target in an explosive experiment. It demonstrates that the BLR-PDV diagnostic can be fielded on dynamic experiments and shows how it can provide complementary information to the velocimetry data. The explosive experiment also verifies the Doppler insensitivity of the BLR technique. We operated the BLR-PDV diagnostic with a stronger reference signal than the signal returning from the target to increase the heterodyne gain. Heterodyne gain provides high dynamic range and enables experiments with large (and time-varying) fluctuations in return light levels. For the BLR technique, we typically launched about +15 dbm of optical power toward the target and about 10 dbm of optical power into the reference leg of the interferometer. Target reflection and scattering losses ranged from 40 to 60 db so that 25 to 45 dbm of power was returned from the target and mixed with the reference. The second EDFA amplified the mixed signal to about +0 dbm before it entered the fiber spools. The PDV system was operated with approximately +20 dbm of optical power launched toward the target and 2 dbm or reference local oscillator power. A. Spinning square cylinder 6
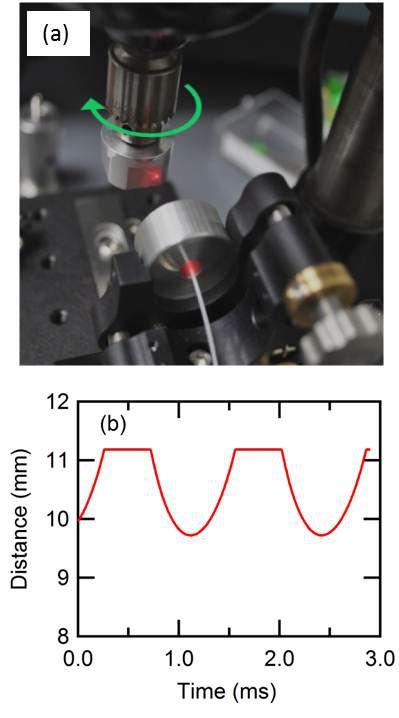
7 For the spinning square cylinder experiment, we used the BLR-PDV diagnostic to measure both the distance and velocity of the surface as the target rotates. The square cylinder in the experimental setup is shown in Fig. 4a. The square cylinder was made from an 11 mm diameter aluminum rod with its sides partially cut away, leaving rounded corners. It was mounted in a high-speed drill press and spun at a constant angular rate of about 12,000 rpm. The surface finish was diffuse so that it returned some of the reflected light to the probe at all surface angles. A collimating probe, used to send and receive signals between the BLR/PDV optical fibers and the surface, had its axis offset from the rotation axis by 2.2 mm. When the probe was viewing one of the rounded corners, the distance remained fixed, but when a flat side came into view, the distance would first decrease and then increase as shown by the calculation in Fig. 4b. The distance calculation is detailed in Appendix A. The measured velocity spectrogram from the spinning square experiment is shown in Fig. 5a. The square rotates about 90 in the times shown; two of the corners and one of the flat faces are viewed in this time window. Regardless of which portion of the square is being viewed, the velocity measured with PDV is a constant value of about 2.6 m/s and gives no indication of the shape of the object. A constant velocity was observed in previous work for a spinning cam shaft, and will always be observed 8,9 for an arbitrarily shaped object rotating about a fixed axis at a constant angular velocity (Appendix A). The distance spectrogram for the spinning square experiment is shown in Fig. 5b in the same time window as the velocity spectrogram. The signal intensity varies by more than 20 db, requiring us to display a large dynamic range in the spectrogram to show data at all times. This variation is responsible for the noise and artifacts between about 0.5 and 0.8 milliseconds when the signal return is the strongest. The distance spectrogram gives the true distance of the intersection between the square object and the probe axis. The distance calculated from geometry (Appendix A) is also shown in Fig. 5b and is an excellent fit to the data, deviating from the measurement by less than 40 µm. We believe that this small difference results from an imprecise angular velocity used in the calculation, not from a distance measurement error. It is clear that for the spinning object, the measured velocity is not the derivative of the distance-time history and could not be used to determine the position of the object. Similarly, the time derivative of the BLR 7
8 distance will not give the erroneous constant velocity component seen by the PDV. The BLR technique overcomes a limitation of traditional velocity measurements by directly measuring the dynamic distance to the intersection of the probe light with the material surface, regardless of the surface motion. B. Explosive experiment on copper A diagram of the copper experiment is shown in Fig. 6. An exploding bridge-wire detonator 21 was used as the explosive charge. The copper target was a 2 mm thick by 40 mm diameter copper disk with a diffusely scattering, bead-blasted surface. A small fiber-optic probe was placed about 25 mm from the rear surface of the disk and viewed a spot about 3 mm from the center axis of the detonator. Upon detonation, copper fragments were sent toward the probe at high speeds. Placing the probe off-axis allowed us to observe the effects of the dynamically sweeping point of intersection of the probe light with the spalled and damaged surface. Note that, as in most off-axis dynamic experiments, our sensor does not follow the position of a single object, but instead it responds to whatever reflecting material comes into its line of sight. The PDV velocity spectrogram from the explosive experiment is shown in Fig. 7a. The discontinuous jump in velocity at about 5 µs corresponds to the shock wave breakout at the rear surface. The strongest signal return is from the primary copper surface moving at about 850 m/s. A fainter signal is also observed and is caused by a cloud of ejected material (ejecta), which initially travels faster than the primary surface. Since the surface is still observed through the ejecta, it is somewhat transparent and likely of relatively low density. This experiment was performed in open air so that the ejecta decelerate with time due to air resistance and eventually recollect onto the surface. The recollection occurs at about 20 µs as evidenced by the disappearance of the ejecta signal. It is important to note that the distance between the ejecta and the copper surface cannot be determined from the velocity data prior to the recollection. Just after 30 µs, a second velocity appears at about 600 m/s. At this time the viewing spot of the probe moved off of the primary surface and onto a different copper fragment moving at a lower speed. This is labeled second fragment in Fig.7a. For a few microseconds, both the primary surface and the 8
9 second fragment are viewed simultaneously because of the finite spot size of the laser on the target. Because all of the signals are from material not moving parallel to the probe axis and have uncertain directions of motion, we cannot accurately determine their positions from the velocity data. The distance spectrogram for the explosive experiment is shown in Fig. 7b. The balance point of the interferometer was positioned about 12 mm ahead of the surface, resulting in low-frequency noise centered at 0 mm in the spectrogram. Each signal in the spectrogram appears as both positive and negative values because we cannot distinguish between positive and negative frequencies in the analysis. In Fig. 7b, the upper-left and lower-right portions of the spectrogram are removed to avoid displaying the distances with the wrong sign. All of the same qualitative features are observed in the distance spectrogram as are observed in the velocity spectrogram. Surface motion begins at 5 µs and is observed as an abrupt change in slope of the signal. If the distance measurement were sensitive to the Doppler shift there would have been a step in the distance spectrogram when the velocity changes discontinuously at shock breakout (see Fig. 7a). Ejecta appear as a cloud of material initially separating from the copper surface. The ejecta slow down relative to the free surface because of air resistance, reaching a maximum excursion of about 1.5 mm from the surface, and are eventually recollected. The recollection of ejecta by the surface occurs at near 20 µs and 0 mm in the spectrogram and is somewhat obscured by the low-frequency noise near the zero crossing. After the recollection, the surface is well defined. Measurement precision for each pulse is better than 10 µm for the surface after recollection. After 30 µs, the second fragment that was seen in the velocity is also observed in the distance spectrogram as another signal 4.5 mm behind the primary surface. Similar to the velocity data, both surfaces are viewed simultaneously for a few microseconds because of the finite laser spot size. Unlike in the velocity spectrogram, where the positions of the ejecta and surfaces were ambiguous, the BLR technique obtains the distances directly. IV. SUMMARY AND CONCLUSIONS 9
10 We have developed and successfully demonstrated a diagnostic for recording both the distance and velocity of rapidly moving surfaces in dynamic compression experiments. The diagnostic overcomes the limitation of velocity measurements in determining material distance in non-planar experiments. The diagnostic is an extension of that described by Xia and Zhang 13,14 and is built mainly from telecommunications components. It is compatible with probes typically used for PDV experiments, has high dynamic range, and can record multiple targets simultaneously (including clouds of ejecta). The distance measurement is insensitive to the Doppler shift. The target distance is recorded every 20 or 40 ns with a measurement precision of better than 10 µm. Currently, the diagnostic can track a target for a total distance of 44 mm, but we plan to extend this range in the future. The simultaneous ranging and velocity diagnostic was demonstrated on a spinning square cylinder experiment, in which the velocity measurement gave a constant speed, whereas the ranging measurement showed the true time-varying distance of the cylinder s surface. The diagnostic was also tested on an explosive experiment where the distance and velocity of copper fragments and ejecta were measured. Because of the non-planar geometry of the copper experiment, the positions of these features could not have been obtained from a velocity measurement alone. This BLR-PDV diagnostic has several potential uses in the dynamic compression community. In experiments where the direction of motion is unknown or changing with time, measurements that record only one component of the velocity result in position ambiguity. Our technique overcomes this ambiguity by recording material distance along the probe s optical axis directly. The diagnostic has potential uses in imploding and exploding cylinder or hemisphere experiments, explosive shape charge liner experiments, explosive frangible joint experiments, and perhaps others. The measurement sampling frequency of <100 MHz is probably not high enough for imploding capsule experiments at laser facilities such as Omega or NIF, but future developments may enable experiments at these facilities as well. ACKNOWLEDGMENTS 10
11 We would like to thank Matt Briggs, George Rodriguez, Richard Sandberg, and Joseph Stone of Los Alamos National Laboratory for numerous useful discussions and experimental assistance. We would also like to thank Ed Daykin, Carlos Perez, and Mike Grover of National Security Technologies, LLC, for their experimental assistance. This manuscript has been authored by National Security Technologies, LLC, under Contract No. DE-AC52-06NA25946 with the U.S. Department of Energy and supported by the Site-Directed Research and Development Program. The United States Government retains and the publisher, by accepting the article for publication, acknowledges that the United States Government retains a non-exclusive, paid-up, irrevocable, worldwide license to publish or reproduce the published form of this manuscript, or allow others to do so, for United States Government purposes. The U.S. Department of Energy will provide public access to these results of federally sponsored research in accordance with the DOE Public Access Plan ( APPENDIX A: VELOCITY AND DISTANCE TO THE SURFACE OF A SPINNING SQUARE CYLINDER This appendix details the calculation of the distance to, and the velocity of, the surface of a spinning square cylinder as measured by a fixed optical probe. A schematic diagram of the experiment is shown in Fig. 8. When the probe views a flat side, the distance from the midpoint of the square cylinder to the intersection between the probe axis and the surface is given by d = b/cosφ + h tanφ, where φ is the angle of rotation of the square. The square cylinder used in our experiments had rounded corners where the radius of the corner was also the radial distance from the center axis to the corners. When the probe is viewing one of the corners, the distance is constant and is given by d = (R 2 h 2 ) 0.5. The velocity of the intersection point between the probe axis and the surface is given by V = ω r, where r is the time varying distance from the center of the square to the contact point, and ω is the angular frequency (ω = dφ/dt) of the spinning square cylinder. The laser-based velocity system (PDV) 11
12 measures only the component of the velocity parallel to the probe axis. Therefore, the PDV records a velocity given by V y = ω r cosθ, where θ is the time varying angle between the probe axis and the velocity vector of the surface at the contact point (as shown in Fig. 8). However, r cosθ = h so that V y = ω h, which is a constant for constant spin rate. This result is independent of the shape of the object as r will always vary with θ in such a way as to keep r cosθ = h for any spinning object rotating about a fixed axis. Therefore, the velocity measured by the PDV system is constant, which is a somewhat surprising result given the complexity of the distance-time history. The apparent discrepancy between the time-varying distance and the constant speed measured by the PDV is a consequence of the probe spot moving across the surface instead of remaining on a single element on the target. References 1 L. M. Barker and R. E. Hollenbach, J. Appl. Phys. 43, 4669 (1972). 2 O. T. Strand, D. R. Goosman, C. Martinez, T. L. Whitworth, and W. W. Kuhlow, Rev. Sci. Instrum. 77, (2006). 3 D. H. Dolan, R. W. Lemke, R. D. McBride, M. R. Martin, E. Harding, D. G. Dalton, B. E. Blue, and S. S. Walker, Rev. Sci. Instrum. 84, (2013). 4 D. Wentzel, NASA Johnson Space Center White Sands Test Facility, Private communication (2014). 5 J. R. Danielson, E. P. Daykin, A. B. Diaz, D. L. Doty, B. C. Frogget, M. R. Furlanetto, C. H. Gallegos, M. Gibo, A. Garza, D. B. Holtkamp, M. S. Hutchins, C. Perez, M. Pena, V. T. Romero, M. A. Shinas, M. G. Teel, and L. J. Tabaka, J. Phys.: Conf. Series 500, (2014). 6 M. E. Briggs, E. A. Moro, M. A. Shinas, S. McGrane, and D. Knierim, J. Phys.: Conf. Series 500, (2014). 7 J. W. Ferguson and P. Taylor, J. Phys.: Conf. Series 500, (2014). 8 D. H. Dolan, AIP Conf. Proc. 505, 589 (2000). 9 D. H. Dolan, Rev. Sci. Instrum. 81, (2010). 12
13 10 M. E. Briggs, L. Hull, E. A. Moro, P. W. Younk, and D. Knierim, Proc. 15th Inter. Detonation Symp., (in press, to be published). 11 Most interferometric-based ranging techniques, such as frequency-swept LIDAR, are sensitive to the Doppler shift and have beat frequency contributions from both velocity and position. These contributions can sometimes be difficult to distinguish. For dynamic applications, where surfaces are moving at high velocities, the ideal ranging measurement is insensitive to the Doppler shift. 12 J. Weng, S. Liu, H. Ma, T. Tao, X. Wang, and C. Liu, Rev. Sci. Instrum. 85, (2014). 13 H. Xia and C. Zhang, Opt. Lett. 34, (2009). 14 H. Xia and C. Zhang, Opt. Express 18, 4118 (2010). 15 The configuration of our PDV system is such that the local oscillator is mixed in after the circulator, as in E. A. Moro, J. Phys.: Conf. Series 500, (2014). 16 PolarOnyx, San Jose, CA, model Mercury INS-PM (modified to broaden and flatten the spectrum). 17 Menlo Systems, Munich, Germany, model T-Light FC Femtosecond Fiber Laser. 18 Corning Optical Fiber, Corning, NY, optical fiber type SMF Amonics Limited, Hong Kong, models AEDFA-PA-25 and AEDFA-LP. 20 International Telecommunication Union, Geneva, Switzerland. 21 Teledyne-RISI, Tracy, CA, detonator model RP80. 13


14 FIG. 1. (Color online) Schematic diagram of the simultaneous broadband laser ranging and velocity diagnostic. PDV: photonic Doppler velocimetry system with a photoreceiver and digitizer channel that is separate from the rest of the diagnostic shown; A/D: single-channel optical add/drop filter; CP: collimating probe to relay the light to/from the optical fiber to the target surface; LASER: mode-locked fiber laser and pulse picker; EDFA: erbium-doped fiber amplifiers; FS: fiber spool that is either 35 or 70 km in length; P/D: photoreceiver and digitizer for recording the ranging signals. Arrows indicate the path for a laser pulse as it traverses the fiber interferometer. 14

15 FIG. 2. (Color online) Recorded time-resolved intensity for a single pulse from the broadband laser ranging measurement. The optical frequency spacing Δν is used to calculate the target distance. The missing spectrum at 5.5 ns (193.4 THz) is due to an add/drop filter, which removes reflected PDV light from the target leg of the fiber interferometer. 15
16 Fig. 3. (Color online) Measured dispersion in 35.3 km of optical fiber plotted as optical frequency vs. time (blue dots) and optical frequency vs. adjusted time, t* (red squares). Adjusted time t* is a quadratic function of real time that cancels out the effect of third-order dispersion. The black line is a linear function with a slope of THz/ns. Optical wavelengths are listed on the right axis. 16

17 FIG. 4. (Color online) (a) Photograph of the spinning square experiment. A collimating probe is used to send and receive light from the BLR-PDV diagnostic to and from the surface of the square. Here, the probe was backlit with red light for ease of viewing. A green arrow indicates the rotation direction. (b) A calculation of d as a function of time; see Appendix A. 17
 Distance spectrogram measured simultaneously using the ranging portion of the BLR/PDV diagnostic.")
18 FIG. 5. (Color) (a) Velocity spectrogram from the spinning square cylinder measured with the PDV portion of the BLR/PDV diagnostic. Signal strengths are color coded according to the db scale to the right. (b) Distance spectrogram measured simultaneously using the ranging portion of the BLR/PDV diagnostic. The red line in the distance spectrogram is a geometrical calculation. 18
19 FIG. 6. (Color online) Schematic diagram of the measurement on explosively driven copper. The copper is backed by an RP80 detonator. A single probe placed 3 mm off-axis sends and receives laser light between the copper surface and the BLR-PDV diagnostic for recording both the distance and velocity of the surface. After detonation, the copper surface travels at high speeds. A component of the surface velocity is toward the probe. 19
20 FIG. 7. (Color) (a) Velocity spectrogram from the copper surface in the explosive experiment measured with the PDV portion of the BLR/PDV diagnostic. (b) Distance spectrogram of the copper surface measured with the BLR diagnostic. Signal strengths for both figures are color coded according to the db scale in (b). 20
21 FIG. 8 (color online). Schematic drawing of the spinning square cylinder measurement. The green arrow indicates the direction of rotation of the cylinder, φ is its angle of rotation, d is the distance along the probe axis, r is the distance from the cylinder s center to the intersection between the probe axis and the surface, V is the velocity vector of the intersection point of the probe axis and the square cylinder, V y is the component of the velocity along the probe axis (parallel to y-axis), θ is the angle between r and the x-axis and is also the angle between V y and V, h is the offset between the probe axis and the y-axis, b is the distance from the center of the cylinder to an edge, and R is the distance from the center of the cylinder to a corner and is also the radius of the corners. 21
22 22

23
24 Optical Frequency (THz) Intensity (a.u.) Add/Drop Filter ν Time (ns)
25 Optical Frequency (THz) Freq vs.time Freq vs. Adjusted Time t* = t + a t 2 8 Relative Delay Time (ns) Wavelength (nm)
26

27
28

29

30
Broadband laser ranging for explosive experiments
 DOE/NV/25946--2828 Broadband laser ranging for explosive experiments B. La Lone, B. Marshall, C. V. Bennett, a P. Younk, b K. Miller, E. Daykin National Security Technologies, LLC Special Technologies
Deriving Broadband Laser Ranging Parameters from First Principles. Ted Strand National Securities Technologies, LLC
 DOE/NV/25946--2825 Deriving Broadband Laser Ranging Parameters from First Principles Ted Strand National Securities Technologies, LLC Presented to: PDV Workshop Livermore, CA June 7 9, 16 This work was
History of Velocimetry Technology
 SAND2012-9001C? History of Velocimetry Technology Brook Jilek Explosives Technologies Group Sandia National Laboratories Albuquerque, NM bajilek@sandia.gov The 7th Annual PDV Workshop, Albuquerque, NM
Application Note. Photonic Doppler Velocimetry
 Application Note Photonic Doppler Velocimetry The velocity measurement of fast-moving materials is essential to several areas of scientific and technical investigations, including shock physics and the
A Generally Applicable Laser Doppler Velocimetry Zhao Lili a, Jin Meishan b, Li Jing c
 International Power, Electronics and Materials Engineering Conference (IPEMEC 2015) A Generally Applicable Laser Doppler Velocimetry Zhao Lili a, Jin Meishan b, Li Jing c Department of Electrical and Electronic,
Cenobio H. Gallegos (Sonny) Phone:
 Phone:") Cenobio H. Gallegos (Sonny) Phone: 505-663-2056 E-mail: gallegch@nv.doe.gov Approved for public release. Distribution unlimited. Page 1 DOE/NV/25946--829 Cenobio Gallegos, Matthew Teel, Bruce Marshall,
Cenobio H. Gallegos (Sonny) Phone: 505-663-2056 E-mail: gallegch@nv.doe.gov Approved for public release. Distribution unlimited. Page 1 DOE/NV/25946--829 Cenobio Gallegos, Matthew Teel, Bruce Marshall,
Intuitive description and experimental proof tests of Optical Ranging
 Unclassified 1 Intuitive description and experimental proof tests of Optical Ranging Patrick Younk (P-23), Erik Moro (W-4), Matthew Briggs (W-4), Los Alamos National Laboratory, Dan Knierim, Tektronix
Photonic time-stretching of 102 GHz millimeter waves using 1.55 µm nonlinear optic polymer EO modulators
 Photonic time-stretching of 10 GHz millimeter waves using 1.55 µm nonlinear optic polymer EO modulators H. Erlig Pacific Wave Industries H. R. Fetterman and D. Chang University of California Los Angeles
Supplementary Figures
 Supplementary Figures Supplementary Figure 1: Mach-Zehnder interferometer (MZI) phase stabilization. (a) DC output of the MZI with and without phase stabilization. (b) Performance of MZI stabilization
Considerations in Building and Fielding MPDV Reducing Back Reflection and Leakage
 Considerations in Building and Fielding MPDV Reducing Back Reflection and Leakage Michael Pena* Martin Burk, Edward Daykin,Abel Diaz, Cenobio Gallegos, Anselmo Garza, Mandy Hutchins, Carlos Perez, Araceli
o Conclusion and future work. 2
 Robert Brown o Concept of stretch processing. o Current procedures to produce linear frequency modulation (LFM) chirps. o How sparse frequency LFM was used for multifrequency stretch processing (MFSP).
200-GHz 8-µs LFM Optical Waveform Generation for High- Resolution Coherent Imaging
 Th7 Holman, K.W. 200-GHz 8-µs LFM Optical Waveform Generation for High- Resolution Coherent Imaging Kevin W. Holman MIT Lincoln Laboratory 244 Wood Street, Lexington, MA 02420 USA kholman@ll.mit.edu Abstract:
Theory and Applications of Frequency Domain Laser Ultrasonics
 1st International Symposium on Laser Ultrasonics: Science, Technology and Applications July 16-18 2008, Montreal, Canada Theory and Applications of Frequency Domain Laser Ultrasonics Todd W. MURRAY 1,
Embedded Fiber Optic Probes to Measure Detonation Velocities Using the PDV
 Performance Measures x.x, x.x, and x.x 14 th International Detonation Symposium Coeur d Alene, Idaho April 11-16, 2010 Embedded Fiber Optic Probes to Measure Detonation Velocities Using the PDV D.E. Hare,
Investigations on the performance of lidar measurements with different pulse shapes using a multi-channel Doppler lidar system
 Th12 Albert Töws Investigations on the performance of lidar measurements with different pulse shapes using a multi-channel Doppler lidar system Albert Töws and Alfred Kurtz Cologne University of Applied
MicroPDV for Slapper Detonator Characterization
 MicroPDV for Slapper Detonator Characterization Steven Clarke Los Alamos National Lab PDV Workshop Livermore Calf Nov 2, 2011 Slide 1 Outline Slapper Flyer Velocity Problem History MicroPDV Probe Data
Setup of the four-wavelength Doppler lidar system with feedback controlled pulse shaping
 Setup of the four-wavelength Doppler lidar system with feedback controlled pulse shaping Albert Töws and Alfred Kurtz Cologne University of Applied Sciences Steinmüllerallee 1, 51643 Gummersbach, Germany
SUPPLEMENTARY INFORMATION DOI: /NPHOTON
 Supplementary Methods and Data 1. Apparatus Design The time-of-flight measurement apparatus built in this study is shown in Supplementary Figure 1. An erbium-doped femtosecond fibre oscillator (C-Fiber,
Swept Wavelength Testing:
 Application Note 13 Swept Wavelength Testing: Characterizing the Tuning Linearity of Tunable Laser Sources In a swept-wavelength measurement system, the wavelength of a tunable laser source (TLS) is swept
A Hybrid Φ/B-OTDR for Simultaneous Vibration and Strain Measurement
 PHOTONIC SENSORS / Vol. 6, No. 2, 216: 121 126 A Hybrid Φ/B-OTDR for Simultaneous Vibration and Strain Measurement Fei PENG * and Xuli CAO Key Laboratory of Optical Fiber Sensing & Communications (Ministry
Non-invasive timing of gas gun projectiles with light detection and ranging
 Journal of Physics: Conference Series OPEN ACCESS Non-invasive timing of gas gun s with light detection and ranging To cite this article: P M Goodwin et al 2014 J. Phys.: Conf. Ser. 500 142009 View the
PDV Usage for Initiation Train Applications
 PDV Usage for Initiation Train Applications Mike Bowden Matthew Maisey PDV Conference, 4-5 th September 2008 Sandia National Laboratories (Slide No. ) Outline of Presentation Introduction Current capability
Embedded Fiber Optic results: Recent progress measuring detonation speed using Heterodyne Velocimetry
 Embedded Fiber Optic results: Recent progress measuring detonation speed using Heterodyne Velocimetry D.E. Hare, Ted Strand Randy Bonner, Daron Hester, Tony Whitworth LLNL David Holtkamp LANS LLC Prepared
Photonics (OPTI 510R 2017) - Final exam. (May 8, 10:30am-12:30pm, R307)
 - Final exam. (May 8, 10:30am-12:30pm, R307)") Photonics (OPTI 510R 2017) - Final exam (May 8, 10:30am-12:30pm, R307) Problem 1: (30pts) You are tasked with building a high speed fiber communication link between San Francisco and Tokyo (Japan) which
Photonics (OPTI 510R 2017) - Final exam (May 8, 10:30am-12:30pm, R307) Problem 1: (30pts) You are tasked with building a high speed fiber communication link between San Francisco and Tokyo (Japan) which
Lecture 21. Wind Lidar (3) Direct Detection Doppler Lidar
 Direct Detection Doppler Lidar") Lecture 21. Wind Lidar (3) Direct Detection Doppler Lidar Overview of Direct Detection Doppler Lidar (DDL) Resonance fluorescence DDL Fringe imaging DDL Scanning FPI DDL FPI edge-filter DDL Absorption
Lecture 21. Wind Lidar (3) Direct Detection Doppler Lidar Overview of Direct Detection Doppler Lidar (DDL) Resonance fluorescence DDL Fringe imaging DDL Scanning FPI DDL FPI edge-filter DDL Absorption
Temporal phase mask encrypted optical steganography carried by amplified spontaneous emission noise
 Temporal phase mask encrypted optical steganography carried by amplified spontaneous emission noise Ben Wu, * Zhenxing Wang, Bhavin J. Shastri, Matthew P. Chang, Nicholas A. Frost, and Paul R. Prucnal
Single-photon excitation of morphology dependent resonance
 Single-photon excitation of morphology dependent resonance 3.1 Introduction The examination of morphology dependent resonance (MDR) has been of considerable importance to many fields in optical science.
1550 nm Programmable Picosecond Laser, PM
 1550 nm Programmable Picosecond Laser, PM The Optilab is a programmable laser that produces picosecond pulses with electrical input pulses. It functions as a seed pulse generator for Master Oscillator
Supplementary Information
 Supplementary Information Supplementary Figure 1. Modal simulation and frequency response of a high- frequency (75- khz) MEMS. a, Modal frequency of the device was simulated using Coventorware and shows
Characteristics of point-focus Simultaneous Spatial and temporal Focusing (SSTF) as a two-photon excited fluorescence microscopy
 as a two-photon excited fluorescence microscopy") Characteristics of point-focus Simultaneous Spatial and temporal Focusing (SSTF) as a two-photon excited fluorescence microscopy Qiyuan Song (M2) and Aoi Nakamura (B4) Abstracts: We theoretically and experimentally
Characteristics of point-focus Simultaneous Spatial and temporal Focusing (SSTF) as a two-photon excited fluorescence microscopy Qiyuan Song (M2) and Aoi Nakamura (B4) Abstracts: We theoretically and experimentally
taccor Optional features Overview Turn-key GHz femtosecond laser
 taccor Turn-key GHz femtosecond laser Self-locking and maintaining Stable and robust True hands off turn-key system Wavelength tunable Integrated pump laser Overview The taccor is a unique turn-key femtosecond
Optimization of supercontinuum generation in photonic crystal fibers for pulse compression
 Optimization of supercontinuum generation in photonic crystal fibers for pulse compression Noah Chang Herbert Winful,Ted Norris Center for Ultrafast Optical Science University of Michigan What is Photonic
Communication using Synchronization of Chaos in Semiconductor Lasers with optoelectronic feedback
 Communication using Synchronization of Chaos in Semiconductor Lasers with optoelectronic feedback S. Tang, L. Illing, J. M. Liu, H. D. I. barbanel and M. B. Kennel Department of Electrical Engineering,
HIGH-EFFICIENCY MQW ELECTROABSORPTION MODULATORS
 HIGH-EFFICIENCY MQW ELECTROABSORPTION MODULATORS J. Piprek, Y.-J. Chiu, S.-Z. Zhang (1), J. E. Bowers, C. Prott (2), and H. Hillmer (2) University of California, ECE Department, Santa Barbara, CA 93106
Lecture 27. Wind Lidar (6) Edge Filter-Based Direct Detection Doppler Lidar
 Edge Filter-Based Direct Detection Doppler Lidar") Lecture 27. Wind Lidar (6) Edge Filter-Based Direct Detection Doppler Lidar q FPI and Fizeau edge-filter DDL q Iodine-absorption-line edge-filter DDL q Edge-filter lidar data retrieval and error analysis
Lecture 27. Wind Lidar (6) Edge Filter-Based Direct Detection Doppler Lidar q FPI and Fizeau edge-filter DDL q Iodine-absorption-line edge-filter DDL q Edge-filter lidar data retrieval and error analysis
Designing for Femtosecond Pulses
 Designing for Femtosecond Pulses White Paper PN 200-1100-00 Revision 1.1 July 2013 Calmar Laser, Inc www.calmarlaser.com Overview Calmar s femtosecond laser sources are passively mode-locked fiber lasers.
Optical phase-coherent link between an optical atomic clock. and 1550 nm mode-locked lasers
 Optical phase-coherent link between an optical atomic clock and 1550 nm mode-locked lasers Kevin W. Holman, David J. Jones, Steven T. Cundiff, and Jun Ye* JILA, National Institute of Standards and Technology
Figure1. To construct a light pulse, the electric component of the plane wave should be multiplied with a bell shaped function.
 Introduction The Electric field of a monochromatic plane wave is given by is the angular frequency of the plane wave. The plot of this function is given by a cosine function as shown in the following graph.
DCS laser for Thomson scattering diagnostic applications
 DCS laser for Thomson scattering diagnostic applications Authors Jason Zweiback 10/6/2015 jzweiback@logostech.net 1 Summary Motivation DCS laser Laser for Thomson scattering diagnostics 2 What is the Dynamic
Stable dual-wavelength oscillation of an erbium-doped fiber ring laser at room temperature
 Stable dual-wavelength oscillation of an erbium-doped fiber ring laser at room temperature Donghui Zhao.a, Xuewen Shu b, Wei Zhang b, Yicheng Lai a, Lin Zhang a, Ian Bennion a a Photonics Research Group,
Spectral phase shaping for high resolution CARS spectroscopy around 3000 cm 1
 Spectral phase shaping for high resolution CARS spectroscopy around 3 cm A.C.W. van Rhijn, S. Postma, J.P. Korterik, J.L. Herek, and H.L. Offerhaus Mesa + Research Institute for Nanotechnology, University
WDM Transmitter Based on Spectral Slicing of Similariton Spectrum
 WDM Transmitter Based on Spectral Slicing of Similariton Spectrum Leila Graini and Kaddour Saouchi Laboratory of Study and Research in Instrumentation and Communication of Annaba (LERICA), Department of
Chapter 1. Overview. 1.1 Introduction
 1 Chapter 1 Overview 1.1 Introduction The modulation of the intensity of optical waves has been extensively studied over the past few decades and forms the basis of almost all of the information applications
Multiwavelength Single-Longitudinal-Mode Ytterbium-Doped Fiber Laser. Citation IEEE Photon. Technol. Lett., 2013, v. 25, p.
 Title Multiwavelength Single-Longitudinal-Mode Ytterbium-Doped Fiber Laser Author(s) ZHOU, Y; Chui, PC; Wong, KKY Citation IEEE Photon. Technol. Lett., 2013, v. 25, p. 385-388 Issued Date 2013 URL http://hdl.handle.net/10722/189009
EDFA Applications in Test & Measurement
 EDFA Applications in Test & Measurement White Paper PN 200-0600-00 Revision 1.1 September 2003 Calmar Optcom, Inc www.calamropt.com Overview Erbium doped fiber amplifiers (EDFAs) amplify optical pulses
Optical Transport Tutorial
 Optical Transport Tutorial 4 February 2015 2015 OpticalCloudInfra Proprietary 1 Content Optical Transport Basics Assessment of Optical Communication Quality Bit Error Rate and Q Factor Wavelength Division
Mechanism of intrinsic wavelength tuning and sideband asymmetry in a passively mode-locked soliton fiber ring laser
 28 J. Opt. Soc. Am. B/Vol. 17, No. 1/January 2000 Man et al. Mechanism of intrinsic wavelength tuning and sideband asymmetry in a passively mode-locked soliton fiber ring laser W. S. Man, H. Y. Tam, and
Optimisation of DSF and SOA based Phase Conjugators. by Incorporating Noise-Suppressing Fibre Gratings
 Optimisation of DSF and SOA based Phase Conjugators by Incorporating Noise-Suppressing Fibre Gratings Paper no: 1471 S. Y. Set, H. Geiger, R. I. Laming, M. J. Cole and L. Reekie Optoelectronics Research
Chirped Bragg Grating Dispersion Compensation in Dense Wavelength Division Multiplexing Optical Long-Haul Networks
 363 Chirped Bragg Grating Dispersion Compensation in Dense Wavelength Division Multiplexing Optical Long-Haul Networks CHAOUI Fahd 3, HAJAJI Anas 1, AGHZOUT Otman 2,4, CHAKKOUR Mounia 3, EL YAKHLOUFI Mounir
Directly Chirped Laser Source for Chirped Pulse Amplification
 Directly Chirped Laser Source for Chirped Pulse Amplification Input pulse (single frequency) AWG RF amp Output pulse (chirped) Phase modulator Normalized spectral intensity (db) 64 65 66 67 68 69 1052.4
Dispersion measurement in optical fibres over the entire spectral range from 1.1 mm to 1.7 mm
 15 February 2000 Ž. Optics Communications 175 2000 209 213 www.elsevier.comrlocateroptcom Dispersion measurement in optical fibres over the entire spectral range from 1.1 mm to 1.7 mm F. Koch ), S.V. Chernikov,
Flat Frequency Comb Generation Based on Efficiently Multiple Four-Wave Mixing Without Polarization Control
 PHOTONIC SENSORS / Vol. 6, No. 1, 216: 85 89 Flat Frequency Comb Generation Based on Efficiently Multiple Four-Wave Mixing Without Polarization Control Qimeng DONG, Bao SUN *, Fushen CHEN, and Jun JIANG
EENG473 Mobile Communications Module 3 : Week # (12) Mobile Radio Propagation: Small-Scale Path Loss
 Mobile Radio Propagation: Small-Scale Path Loss") EENG473 Mobile Communications Module 3 : Week # (12) Mobile Radio Propagation: Small-Scale Path Loss Introduction Small-scale fading is used to describe the rapid fluctuation of the amplitude of a radio
EENG473 Mobile Communications Module 3 : Week # (12) Mobile Radio Propagation: Small-Scale Path Loss Introduction Small-scale fading is used to describe the rapid fluctuation of the amplitude of a radio
FI..,. HEWLETT. High-Frequency Photodiode Characterization using a Filtered Intensity Noise Technique
 FI..,. HEWLETT ~~ PACKARD High-Frequency Photodiode Characterization using a Filtered Intensity Noise Technique Doug Baney, Wayne Sorin, Steve Newton Instruments and Photonics Laboratory HPL-94-46 May,
Differential measurement scheme for Brillouin Optical Correlation Domain Analysis
 Differential measurement scheme for Brillouin Optical Correlation Domain Analysis Ji Ho Jeong, 1,2 Kwanil Lee, 1,4 Kwang Yong Song, 3,* Je-Myung Jeong, 2 and Sang Bae Lee 1 1 Center for Opto-Electronic
Analysis of Self Phase Modulation Fiber nonlinearity in Optical Transmission System with Dispersion
 36 Analysis of Self Phase Modulation Fiber nonlinearity in Optical Transmission System with Dispersion Supreet Singh 1, Kulwinder Singh 2 1 Department of Electronics and Communication Engineering, Punjabi
Doppler-Free Spetroscopy of Rubidium
 Doppler-Free Spetroscopy of Rubidium Pranjal Vachaspati, Sabrina Pasterski MIT Department of Physics (Dated: April 17, 2013) We present a technique for spectroscopy of rubidium that eliminates doppler
PERFORMANCE OF PHOTODIGM S DBR SEMICONDUCTOR LASERS FOR PICOSECOND AND NANOSECOND PULSING APPLICATIONS
 PERFORMANCE OF PHOTODIGM S DBR SEMICONDUCTOR LASERS FOR PICOSECOND AND NANOSECOND PULSING APPLICATIONS By Jason O Daniel, Ph.D. TABLE OF CONTENTS 1. Introduction...1 2. Pulse Measurements for Pulse Widths
Lecture 25. Wind Lidar (3) Direct Detection Doppler Lidar
 Direct Detection Doppler Lidar") Lecture 25. Wind Lidar (3) Direct Detection Doppler Lidar Overview of Direct Detection Doppler Lidar (DDL) Fringe imaging DDL Scanning FPI DDL FPI edge-filter DDL Iodine absorption-line edge-filter DDL
Lecture 25. Wind Lidar (3) Direct Detection Doppler Lidar Overview of Direct Detection Doppler Lidar (DDL) Fringe imaging DDL Scanning FPI DDL FPI edge-filter DDL Iodine absorption-line edge-filter DDL
Extending the Offset Frequency Range of the D2-135 Offset Phase Lock Servo by Indirect Locking
 Extending the Offset Frequency Range of the D2-135 Offset Phase Lock Servo by Indirect Locking Introduction The Vescent Photonics D2-135 Offset Phase Lock Servo is normally used to phase lock a pair of
Generation of High-order Group-velocity-locked Vector Solitons
 Generation of High-order Group-velocity-locked Vector Solitons X. X. Jin, Z. C. Wu, Q. Zhang, L. Li, D. Y. Tang, D. Y. Shen, S. N. Fu, D. M. Liu, and L. M. Zhao, * Jiangsu Key Laboratory of Advanced Laser
Advanced Optical Communications Prof. R. K. Shevgaonkar Department of Electrical Engineering Indian Institute of Technology, Bombay
 Advanced Optical Communications Prof. R. K. Shevgaonkar Department of Electrical Engineering Indian Institute of Technology, Bombay Lecture No. # 27 EDFA In the last lecture, we talked about wavelength
CHAPTER 5 FINE-TUNING OF AN ECDL WITH AN INTRACAVITY LIQUID CRYSTAL ELEMENT
 CHAPTER 5 FINE-TUNING OF AN ECDL WITH AN INTRACAVITY LIQUID CRYSTAL ELEMENT In this chapter, the experimental results for fine-tuning of the laser wavelength with an intracavity liquid crystal element
Emerging Subsea Networks
 Optimization of Pulse Shaping Scheme and Multiplexing/Demultiplexing Configuration for Ultra-Dense WDM based on mqam Modulation Format Takanori Inoue, Yoshihisa Inada, Eduardo Mateo, Takaaki Ogata (NEC
Simultaneous measurement of two different-color ultrashort pulses on a single shot
 Wong et al. Vol. 29, No. 8 / August 2012 / J. Opt. Soc. Am. B 1889 Simultaneous measurement of two different-color ultrashort pulses on a single shot Tsz Chun Wong,* Justin Ratner, and Rick Trebino School
Frequency Noise Reduction of Integrated Laser Source with On-Chip Optical Feedback
 MITSUBISHI ELECTRIC RESEARCH LABORATORIES http://www.merl.com Frequency Noise Reduction of Integrated Laser Source with On-Chip Optical Feedback Song, B.; Kojima, K.; Pina, S.; Koike-Akino, T.; Wang, B.;
Agilent 81980/ 81940A, Agilent 81989/ 81949A, Agilent 81944A Compact Tunable Laser Sources
 Agilent 81980/ 81940A, Agilent 81989/ 81949A, Agilent 81944A Compact Tunable Laser Sources December 2004 Agilent s Series 819xxA high-power compact tunable lasers enable optical device characterization
PDV as a Diagnostic Tool for Separation Mechanisms, Particle Impact, and Hypervelocity Testing
 PDV as a Diagnostic Tool for Separation Mechanisms, Particle Impact, and Hypervelocity Testing Daniel Wentzel Project Manager NASA JSC White Sands Test Facility Outline Purpose WSTF Capabilities WSTF PDV
7 CHAPTER 7: REFRACTIVE INDEX MEASUREMENTS WITH COMMON PATH PHASE SENSITIVE FDOCT SETUP
 7 CHAPTER 7: REFRACTIVE INDEX MEASUREMENTS WITH COMMON PATH PHASE SENSITIVE FDOCT SETUP Abstract: In this chapter we describe the use of a common path phase sensitive FDOCT set up. The phase measurements
R. J. Jones College of Optical Sciences OPTI 511L Fall 2017
 R. J. Jones College of Optical Sciences OPTI 511L Fall 2017 Active Modelocking of a Helium-Neon Laser The generation of short optical pulses is important for a wide variety of applications, from time-resolved
Testing with Femtosecond Pulses
 Testing with Femtosecond Pulses White Paper PN 200-0200-00 Revision 1.3 January 2009 Calmar Laser, Inc www.calmarlaser.com Overview Calmar s femtosecond laser sources are passively mode-locked fiber lasers.
Teaching fiber-optic communications in engineering technology programs by virtual collaboration with industry
 Teaching fiber-optic communications in engineering technology programs by virtual collaboration with industry Djafar K. Mynbaev New York City College of Technology of the City University of New York, 300
Integrated-optical modulators
 LASERS & MATERIAL PROCESSING I OPTICAL SYSTEMS I INDUSTRIAL METROLOGY I TRAFFIC SOLUTIONS I DEFENSE & CIVIL SYSTEMS Integrated-optical modulators Technical information and instructions for use Optoelectronic
Chad A. Husko 1,, Sylvain Combrié 2, Pierre Colman 2, Jiangjun Zheng 1, Alfredo De Rossi 2, Chee Wei Wong 1,
 SOLITON DYNAMICS IN THE MULTIPHOTON PLASMA REGIME Chad A. Husko,, Sylvain Combrié, Pierre Colman, Jiangjun Zheng, Alfredo De Rossi, Chee Wei Wong, Optical Nanostructures Laboratory, Columbia University
Visible to infrared high-speed WDM transmission over PCF
 Visible to infrared high-speed WDM transmission over PCF Koji Ieda a), Kenji Kurokawa, Katsusuke Tajima, and Kazuhide Nakajima NTT Access Network Service Systems Laboratories, NTT Corporation, 1 7 1 Hanabatake,
Nonlinear Optics (WiSe 2015/16) Lecture 9: December 11, 2015
 Lecture 9: December 11, 2015") Nonlinear Optics (WiSe 2015/16) Lecture 9: December 11, 2015 Chapter 9: Optical Parametric Amplifiers and Oscillators 9.8 Noncollinear optical parametric amplifier (NOPA) 9.9 Optical parametric chirped-pulse
Nonlinear Optics (WiSe 2015/16) Lecture 9: December 11, 2015 Chapter 9: Optical Parametric Amplifiers and Oscillators 9.8 Noncollinear optical parametric amplifier (NOPA) 9.9 Optical parametric chirped-pulse
Far field intensity distributions of an OMEGA laser beam were measured with
 Experimental Investigation of the Far Field on OMEGA with an Annular Apertured Near Field Uyen Tran Advisor: Sean P. Regan Laboratory for Laser Energetics Summer High School Research Program 200 1 Abstract
40Gb/s Optical Transmission System Testbed
 The University of Kansas Technical Report 40Gb/s Optical Transmission System Testbed Ron Hui, Sen Zhang, Ashvini Ganesh, Chris Allen and Ken Demarest ITTC-FY2004-TR-22738-01 January 2004 Sponsor: Sprint
Constant Modulus 4D Optimized Constellation Alternative for DP-8QAM
 MTSUBSH ELECTRC RESEARCH LABORATORES http://www.merl.com Constant Modulus 4D Optimized Constellation Alternative for DP-8AM Kojima, K,; Millar, D.S.; Koike-Akino, T.; Parsons, K. TR24-83 September 24 Abstract
C. J. S. de Matos and J. R. Taylor. Femtosecond Optics Group, Imperial College, Prince Consort Road, London SW7 2BW, UK
 Multi-kilowatt, all-fiber integrated chirped-pulse amplification system yielding 4 pulse compression using air-core fiber and conventional erbium-doped fiber amplifier C. J. S. de Matos and J. R. Taylor
A NOVEL SCHEME FOR OPTICAL MILLIMETER WAVE GENERATION USING MZM
 A NOVEL SCHEME FOR OPTICAL MILLIMETER WAVE GENERATION USING MZM Poomari S. and Arvind Chakrapani Department of Electronics and Communication Engineering, Karpagam College of Engineering, Coimbatore, Tamil
OPTI510R: Photonics. Khanh Kieu College of Optical Sciences, University of Arizona Meinel building R.626
 OPTI510R: Photonics Khanh Kieu College of Optical Sciences, University of Arizona kkieu@optics.arizona.edu Meinel building R.626 Announcements Homework #4 is due today, HW #5 is assigned (due April 8)
Experimental demonstration of both inverted and non-inverted wavelength conversion based on transient cross phase modulation of SOA
 Experimental demonstration of both inverted and non-inverted wavelength conversion based on transient cross phase modulation of SOA Songnian Fu, Jianji Dong *, P. Shum, and Liren Zhang (1) Network Technology
Lecture 7 Fiber Optical Communication Lecture 7, Slide 1
 Dispersion management Lecture 7 Dispersion compensating fibers (DCF) Fiber Bragg gratings (FBG) Dispersion-equalizing filters Optical phase conjugation (OPC) Electronic dispersion compensation (EDC) Fiber
Performance Analysis of SOA-MZI based All-Optical AND & XOR Gate
 International Journal of Current Engineering and Technology E-ISSN 2277 4106, P-ISSN 2347 5161 2016 INPRESSCO, All Rights Reserved Available at http://inpressco.com/category/ijcet Research Article Utkarsh
All-Optical Clock Division Using Period-one Oscillation of Optically Injected Semiconductor Laser
 International Conference on Logistics Engineering, Management and Computer Science (LEMCS 2014) All-Optical Clock Division Using Period-one Oscillation of Optically Injected Semiconductor Laser Shengxiao
PHASE TO AMPLITUDE MODULATION CONVERSION USING BRILLOUIN SELECTIVE SIDEBAND AMPLIFICATION. Steve Yao
 PHASE TO AMPLITUDE MODULATION CONVERSION USING BRILLOUIN SELECTIVE SIDEBAND AMPLIFICATION Steve Yao Jet Propulsion Laboratory, California Institute of Technology 4800 Oak Grove Dr., Pasadena, CA 91109
Optical Complex Spectrum Analyzer (OCSA)
") Optical Complex Spectrum Analyzer (OCSA) First version 24/11/2005 Last Update 05/06/2013 Distribution in the UK & Ireland Characterisation, Measurement & Analysis Lambda Photometrics Limited Lambda House
Optical Complex Spectrum Analyzer (OCSA) First version 24/11/2005 Last Update 05/06/2013 Distribution in the UK & Ireland Characterisation, Measurement & Analysis Lambda Photometrics Limited Lambda House
Intensity-modulated and temperature-insensitive fiber Bragg grating vibration sensor
 Intensity-modulated and temperature-insensitive fiber Bragg grating vibration sensor Lan Li, Xinyong Dong, Yangqing Qiu, Chunliu Zhao and Yiling Sun Institute of Optoelectronic Technology, China Jiliang
Fast Raman Spectral Imaging Using Chirped Femtosecond Lasers
 Fast Raman Spectral Imaging Using Chirped Femtosecond Lasers Dan Fu 1, Gary Holtom 1, Christian Freudiger 1, Xu Zhang 2, Xiaoliang Sunney Xie 1 1. Department of Chemistry and Chemical Biology, Harvard
PXA Configuration. Frequency range
 Keysight Technologies Making Wideband Measurements Using the Keysight PXA Signal Analyzer as a Down Converter with Infiniium Oscilloscopes and 89600 VSA Software Application Note Introduction Many applications
DIELECTRIC WAVEGUIDES and OPTICAL FIBERS
 DIELECTRIC WAVEGUIDES and OPTICAL FIBERS Light Light Light n 2 n 2 Light n 1 > n 2 A planar dielectric waveguide has a central rectangular region of higher refractive index n 1 than the surrounding region
3 General Principles of Operation of the S7500 Laser
 Application Note AN-2095 Controlling the S7500 CW Tunable Laser 1 Introduction This document explains the general principles of operation of Finisar s S7500 tunable laser. It provides a high-level description
Optical Communications and Networking 朱祖勍. Sept. 25, 2017
 Optical Communications and Networking Sept. 25, 2017 Lecture 4: Signal Propagation in Fiber 1 Nonlinear Effects The assumption of linearity may not always be valid. Nonlinear effects are all related to
Optical RI sensor based on an in-fiber Bragg grating. Fabry-Perot cavity embedded with a micro-channel
 Optical RI sensor based on an in-fiber Bragg grating Fabry-Perot cavity embedded with a micro-channel Zhijun Yan *, Pouneh Saffari, Kaiming Zhou, Adedotun Adebay, Lin Zhang Photonic Research Group, Aston
RF-based Synchronization of the Seed and Pump-Probe Lasers to the Optical Synchronization System at FLASH
 RF-based Synchronization of the Seed and Pump-Probe Lasers to the Optical Synchronization System at FLASH Introduction to the otical synchronization system and concept of RF generation for locking of Ti:Sapphire
Time-Multiplexed Pulse Shaping
 Time-Multiplexed Pulse Shaping Introduction Optical pulses are used to transmit information, perform remote sensing and metrology, and study physical processes in matter. These optics and photonics applications
RZ BASED DISPERSION COMPENSATION TECHNIQUE IN DWDM SYSTEM FOR BROADBAND SPECTRUM
 RZ BASED DISPERSION COMPENSATION TECHNIQUE IN DWDM SYSTEM FOR BROADBAND SPECTRUM Prof. Muthumani 1, Mr. Ayyanar 2 1 Professor and HOD, 2 UG Student, Department of Electronics and Communication Engineering,
Lecture 10. Dielectric Waveguides and Optical Fibers
 Lecture 10 Dielectric Waveguides and Optical Fibers Slab Waveguide, Modes, V-Number Modal, Material, and Waveguide Dispersions Step-Index Fiber, Multimode and Single Mode Fibers Numerical Aperture, Coupling
Comparison of FMCW-LiDAR system with optical- and electricaldomain swept light sources toward self-driving mobility application
 P1 Napat J.Jitcharoenchai Comparison of FMCW-LiDAR system with optical- and electricaldomain swept light sources toward self-driving mobility application Napat J.Jitcharoenchai, Nobuhiko Nishiyama, Tomohiro