Supplementary Material
|
|
|
- Logan Riley
- 5 years ago
- Views:
Transcription
1 Supplementary Material Orthogonal representation of sound dimensions in the primate midbrain Simon Baumann, Timothy D. Griffiths, Li Sun, Christopher I. Petkov, Alex Thiele & Adrian Rees Methods: Animals The data was obtained from 28 fmri sessions with three male macaque monkeys (Macaca mulatta) weighting 9 16 kg. For two animals we acquired three sessions for the tonotopy experiment and seven sessions for the periodotopy experiment. In a third animal, the data consist of one tonotopy session and seven periodotopy sessions. The animals were previously habituated to the scanner environment and were scanned while awake. A custom made primate chair was used to position the animal in the bore of the scanner and head movements were minimised with a head holder. Details of the positioning procedures are given in Baumann et al. 11. All experiments were carried out in accordance with the UK, Animals (Scientific Procedures) Act (1986), European Communities Council Directive 1986 (86/609/EEC) and the US National Institutes of Health Guidelines for the Care and Use of Animals for Experimental Procedures, and were performed with great care to ensure the well-being of the animals. Sound stimuli and presentation Sound stimuli were created in MATLAB 7.1 (MathWorks, Natick, USA) with a sample rate of 44.1 khz and 16 bit resolution. Stimuli for characterising the BOLD response to spectral frequencies (tonotopy-experiment) were based on a random-phase noise carrier with three different pass-bands, khz, 2 4 khz and 8 16 khz resulting in three different stimuli that encompassed different spectral ranges. The carriers were amplitude modulated with a 1
2 sinusoidal envelope of 90% depth at 10 Hz to achieve a robust response in the brain stem. The stimuli for characterising the temporal frequencies in the amplitude modulation experiment (periodotopy-experiment) were also based on random-phase noise carrier but had a flat broadband spectrum from 25 Hz to 16 khz. This carrier was amplitude modulated at six different frequencies, 0.5 Hz, 2 Hz, 8 Hz, 32 Hz, 128 Hz and 512 Hz resulting in six different stimuli that cover the approximate range of amplitude modulation rates to which neurons in the midbrain are responsive 10. The duration of all the stimuli was 6 s which included at least three cycles of the modulation in the case of the lowest temporal frequency. This duration is also sufficient for the BOLD response in the brain stem of macaques to reach the plateau 11. The on- and off-set of the stimulus were smoothed by a linear ramp of 50 ms. We presented the stimuli in the scanner at an RMS sound pressure level of 75 db using custom adapted electrostatic headphones based on a Nordic NeuroLab system (NordicNeuroLab, Bergen, Norway). These headphones feature a flat frequency transfer function up to 16 khz and are free from harmonic-distortion at the applied sound pressure level. Sound pressure levels were verified using an MR-compatible condenser microphone B&K Type 4189 (Bruel&Kjaer, Naerum, Denmark) connected by an extension cable to the sound level meter Type 2260 from the same company. MRI hardware and imaging Data were recorded in an actively shielded, vertical 4.7 T MRI scanner (Bruker Biospec 47/60 VAS) equipped with a Bruker GA-38S gradient system with an inner-bore diameter of 38 cm (Bruker Medical, Ettlingen, Germany). The applied RF transmitter-receiver coil (Bruker) was of a volume array design that covered the entire head of the animals. Functional and structural data were acquired from identical 2 mm thick slices in a plane orientated roughly perpendicular to the axis of the brainstem. Two slices that covered the inferior colliculus (IC) were used for this study. The slices were selected with the help of an additional structural scan that covered the brainstem in sagittal orientation. The approximate location and orientation of the scanned slices are displayed in Fig 1a. 2
3 Functional scan parameters: Single-shot gradient-recalled echo-planar imaging sequences were optimised for each subject sharing an in-plane resolution of 1 x 1 mm 2 and a volume acquisition time (TA) of 1s. Typical acquisition parameters were: TE: 21 ms, flip angle (FA): 90º, spectral bandwidth: 200 khz, Field of view (FOV): 9.6 x 9.6 cm 2, with an acquisition matrix of 96 x 96. Each volume acquisition was separated by a 9 s gap to avoid recording the BOLD response to the gradient noise of the previous scan ( sparse design ). In combination with the TA of 1s this results in a repetition time (TR) of 10 s. The stimuli were presented during the last 6 s of the silent gap. The detailed timing was based on a previous BOLD response time course characterisation in the auditory system of macaques 11. Before every other volume acquisition no stimulus was presented to obtain data for a silent baseline. For the tonotopy-experiment a total 720 volumes were acquired per session. This resulted in 120 volumes per stimulus per session (half of the volumes served for the baseline) or 360 volumes per stimulus in total for the three sessions. For the periodotopy-experiment 540 volumes per session were acquired resulting in 45 volumes per stimulus per session and 315 volumes per stimulus for the combined seven sessions. Structural scan parameters: Structural images (T1-weighted) used the same slice geometry as the functional scans to simplify coregistration. The imaging parameters of the MDEFT (Modified Driven Equilibrium Fourier Transform) sequence were: TE: 6 ms, TR: 2240 ms, FA: 30º, FOV 9.6 x 9.6 cm 2 using an encoding matrix of 256 x 256 to result in an in-plane resolution of x mm 2 per voxel. Correct overlap of structural and functional images has been confirmed for all maps. Data analysis For preprocessing and general linear model analysis we employed the SPM5 software package ( implemented in Matlab 7.1. The data acquired from each animal were analysed separately. Image volumes from each session were realigned to the first volume and the sessions of the two experiments were subsequently realigned to each other before smoothing the data with a kernel of 2 mm full-width half-maximum. The time-series were high 3
4 pass filtered with a cut-off of 300 s to account for slow signal drifts and the data was adjusted for global signal fluctuations (global scaling). In a general linear model analysis for the combined sessions of each experiment, the voxel-wise response estimate coefficients (beta-values) and t- values for the contrast of the different stimuli versus the silent baseline were calculated. Fig 1b shows the map of t-values for the combined AM stimuli versus baseline for animal Cr. Significant auditory responses based on t-maps matched the predicted location and extent of the IC derived from anatomical features in the corresponding structural scans. Further analysis and data display was performed using custom designed Matlab scripts. The two slices of the response estimate coefficient maps covering the IC were collapsed in to one by calculating the mean, and the resulting maps were masked retaining only the voxels that showed significant values for the combined stimuli versus baseline contrast for each of the two experiments (FWE corrected for multiple comparisons). Given the relatively small number of voxels (20 30) that remained for each of the two ICs we collapsed the maps of the six temporal stimuli obtained for each animal into three by taking the mean of the 0.5 Hz and 2 Hz, the 8 Hz and 32 Hz, and the 128 Hz and 512 Hz maps. This left us with a low rate (lr), a middle rate (mr) and a high rate (hr) map of the response estimate coefficients (beta-values) for each animal for the periodotopy experiment. In the case of the tonotopy-experiment the three different stimulus conditions that were tested (0.5 1 khz, 2 4 khz and 8 16 khz spectral bands) already resulted in three response estimation coefficient maps for low frequencies (lf), middle frequencies (mf) and high frequencies (hf). These six response estimate maps for the temporal and the spectral stimuli for each of the three animals were used for further analysis of the detailed spectro-temporal organisation in the IC. Best frequency/rate response maps (BF/R-map): The best frequency/rate response maps were calculated by identifying voxel by voxel for each experiment and animal which of the three spectral frequencies or temporal rates showed the highest response estimate coefficients. The resulting maps represent the preferred frequency or rate for each voxel (Suppl. Fig. S1). 4
5 Frequency/rate response difference maps (Diff-map): In order to highlight the gradual change of frequency or rate preference for the different voxels we subtracted voxel by voxel the response estimate coefficents of the low frequencies (lf) or rates (lr) from the high frequencies (hf) or rates (hr). The resulting maps represent the degree of preference for high or low frequencies/rates. Direction and quantification of frequency/rate gradients: The observed one-dimensional gradients for spectral frequencies and temporal rates in two-dimensional maps were tested by a linear, two-dimensional multi-regression analysis. Effectively, a plane was fitted to the values of the Diff-map (Fig. 2) and regression coefficients (R 2 ), p-values for the fit were obtained. The application of a linear (planar) regression was used as the simplest model to test a one dimensional frequency or AM rate versus distance trend, respectively. The results do not exclude that a higher order model would better explain the data. The direction of gradient (or steepest angle) of the plane represent the estimated direction of the frequency/rate preference gradient or the direction of the tonotopy and periodotopy axis, respectively. The angles of the gradients relative to the dorsal-ventral axis were calculated for both ICs in all three animals for the tonotopy- and periodotpy-experiments. From these angles we calculated the relative angles between the tonotopy gradient and the periodotopy gradient for the IC nuclei. 5
6 Supplementary Figure S1 Example waveforms and spectra for sound stimuli. Each panel shows (above) a 1-s excerpt of the stimulus waveform (temporal envelope) and (below) its spectrum. Panels A and B show example stimuli from the spectral experiment. The frequency range is 500 Hz to 1 khz in A and 8 khz to 16 khz in B; in both cases the temporal envelope is fixed at 10 Hz. Panels C and D show example stimuli from the temporal experiment. The spectrum is fixed at 25 Hz 16 khz, while the amplitude modulation rate is 2 Hz in panel C and 32 Hz in panel D. 6


7 Supplementary Figure S2 Maps of stimulus types that show maximal BOLD response in the inferior colliculi of three animals (IC). The maps in the left column show which frequency range gives the strongest BOLD response in each voxel. The color code for low frequencies (lf), middle frequencies (mf) and high frequencies is displayed in the bottom panel. The maps in the right column show the best range of amplitude modulation rates for each voxel. The colour code for low, middle and high rates (lr, mr and hr) is located in the right bottom panel. 7
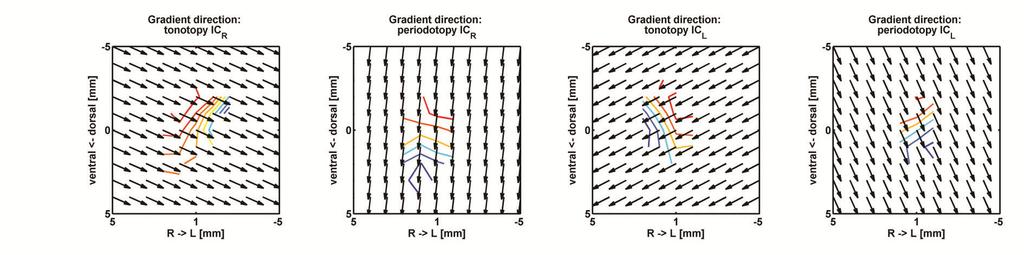
8 Supplementary Figure S3 8
9 Regression planes and gradient direction maps for all subjects. The figure shows data equivalent to data in Figure 2 but for all subjects. The first two columns show data from the right IC s and the second two columns show data from the left IC s. Tonotopic experiments are represented by column 1, 3 and periodotopic experiments are represented by column 2, 4. Abbreviations Ws, Dl and CR indicate subjects. 9
10 Supplementary Table 1 Animal L R relative angle [degree] periodotopy tonotopy periodotopy tonotopy L R Direction Ws [degree] Dl Cr average std. dev R 2 coeff. Ws Dl Cr p value Ws <10 5 <10 6 < *10 4 Dl <10 12 <10 7 <10 6 <10 6 Cr <10 6 <10 6 < *10 4 N Ws [voxel] Dl Cr Direction and significance values from regression analysis for tonotopy and periodotopy maps. Gradient quantification data from the tontotopy and periodotopy experiment for the left (L) and right (R) ICs of the three animals. Gradient directions are shown relative to the dorso-ventral axis (0 ). The relative angles between the gradients from the two experiments are shown on the right side with the average and standard deviation of the direction values immediately below. Regression coefficients (R 2 ), p-values, and the number of data points per map (N) are shown for each gradient analysis. 10
Methods. Experimental Stimuli: We selected 24 animals, 24 tools, and 24
 Methods Experimental Stimuli: We selected 24 animals, 24 tools, and 24 nonmanipulable object concepts following the criteria described in a previous study. For each item, a black and white grayscale photo
SUPPLEMENTARY INFORMATION
 a b STS IOS IOS STS c "#$"% "%' STS posterior IOS dorsal anterior ventral d "( "& )* e f "( "#$"% "%' "& )* Supplementary Figure 1. Retinotopic mapping of the non-lesioned hemisphere. a. Inflated 3D representation
M R I Physics Course. Jerry Allison Ph.D., Chris Wright B.S., Tom Lavin B.S., Nathan Yanasak Ph.D. Department of Radiology Medical College of Georgia
 M R I Physics Course Jerry Allison Ph.D., Chris Wright B.S., Tom Lavin B.S., Nathan Yanasak Ph.D. Department of Radiology Medical College of Georgia M R I Physics Course Magnetic Resonance Imaging Spatial
2015 Spin echoes and projection imaging
 1. Spin Echoes 1.1 Find f0, transmit amplitudes, and shim settings In order to acquire spin echoes, we first need to find the appropriate scanner settings using the FID GUI. This was all done last week,
MRI Summer Course Lab 2: Gradient Echo T1 & T2* Curves
 MRI Summer Course Lab 2: Gradient Echo T1 & T2* Curves Experiment 1 Goal: Examine the effect caused by changing flip angle on image contrast in a simple gradient echo sequence and derive T1-curves. Image
Supplementary Figure 1
 Supplementary Figure 1 Left aspl Right aspl Detailed description of the fmri activation during allocentric action observation in the aspl. Averaged activation (N=13) during observation of the allocentric
Background (~EE369B)
") Background (~EE369B) Magnetic Resonance Imaging D. Nishimura Overview of NMR Hardware Image formation and k-space Excitation k-space Signals and contrast Signal-to-Noise Ratio (SNR) Pulse Sequences 13
Background (~EE369B) Magnetic Resonance Imaging D. Nishimura Overview of NMR Hardware Image formation and k-space Excitation k-space Signals and contrast Signal-to-Noise Ratio (SNR) Pulse Sequences 13
MARP. MR Accreditation Program Quality Control Beyond Just the Scans and Measurements July 2005
 ACR MRI accreditation program MR Accreditation Program Quality Control Beyond Just the Scans and Measurements July 2005 Carl R. Keener, Ph.D., DABMP, DABR keener@marpinc.com MARP Medical & Radiation Physics,
3T Unlimited. ipat on MAGNETOM Allegra The Importance of ipat at 3T. medical
 3T Unlimited ipat on MAGNETOM Allegra The Importance of ipat at 3T s medical ipat on MAGNETOM Allegra The Importance of ipat at 3T The rise of 3T MR imaging Ultra High Field MR (3T) has flourished during
1 Introduction. 2 The basic principles of NMR
 1 Introduction Since 1977 when the first clinical MRI scanner was patented nuclear magnetic resonance imaging is increasingly being used for medical diagnosis and in scientific research and application
Lab 8 6.S02 Spring 2013 MRI Projection Imaging
 1. Spin Echos 1.1 Find f0, TX amplitudes, and shim settings In order to acquire spin echos, we first need to find the appropriate scanner settings using the FID GUI. This was all done last week, but these
HETERONUCLEAR IMAGING. Topics to be Discussed:
 HETERONUCLEAR IMAGING BioE-594 Advanced MRI By:- Rajitha Mullapudi 04/06/2006 Topics to be Discussed: What is heteronuclear imaging. Comparing the hardware of MRI and heteronuclear imaging. Clinical applications
Image Quality/Artifacts Frequency (MHz)
") The Larmor Relation 84 Image Quality/Artifacts (MHz) 42 ω = γ X B = 2πf 84 0.0 1.0 2.0 Magnetic Field (Tesla) 1 A 1D Image Magnetic Field Gradients Magnet Field Strength Field Strength / Gradient Coil
The Larmor Relation 84 Image Quality/Artifacts (MHz) 42 ω = γ X B = 2πf 84 0.0 1.0 2.0 Magnetic Field (Tesla) 1 A 1D Image Magnetic Field Gradients Magnet Field Strength Field Strength / Gradient Coil
Spectro-Temporal Methods in Primary Auditory Cortex David Klein Didier Depireux Jonathan Simon Shihab Shamma
 Spectro-Temporal Methods in Primary Auditory Cortex David Klein Didier Depireux Jonathan Simon Shihab Shamma & Department of Electrical Engineering Supported in part by a MURI grant from the Office of
Analysis of magnetic and electromagnetic field emissions produced by a MRI device
 Sept. 8-1, 21, Kosice, Slovakia Analysis of magnetic and electromagnetic field emissions produced by a MRI device D. Giordano, M. Borsero, G. Crotti, M. ucca INRIM Istituto Nazionale di Ricerca Metrologica,
SIEMENS MAGNETOM Skyra syngo MR D13
 Page 1 of 12 SIEMENS MAGNETOM Skyra syngo MR D13 \\USER\CIND\StudyProtocols\PTSA\*ep2d_M0Map_p2_TE15 TA:7.9 s PAT:2 Voxel size:2.5 2.5 3.0 mm Rel. SNR:1.00 :epfid Properties Routine Contrast Prio Recon
Structure of Speech. Physical acoustics Time-domain representation Frequency domain representation Sound shaping
 Structure of Speech Physical acoustics Time-domain representation Frequency domain representation Sound shaping Speech acoustics Source-Filter Theory Speech Source characteristics Speech Filter characteristics
2014 M.S. Cohen all rights reserved
 2014 M.S. Cohen all rights reserved mscohen@g.ucla.edu IMAGE QUALITY / ARTIFACTS SYRINGOMYELIA Source http://gait.aidi.udel.edu/res695/homepage/pd_ortho/educate/clincase/syrsco.htm Surgery is usually recommended
Proceedings of Meetings on Acoustics
 Proceedings of Meetings on Acoustics Volume 19, 2013 http://acousticalsociety.org/ ICA 2013 Montreal Montreal, Canada 2-7 June 2013 Psychological and Physiological Acoustics Session 1pPPb: Psychoacoustics
S1 Table. Characterization of the articles (n=20) included for systematic review. (A) population, acquisition and analysis parameters; (B)
 included for systematic review. (A) population, acquisition and analysis parameters; (B)") S1 Table. Characterization of the articles (n=20) included for systematic review. (A) population, acquisition and analysis parameters; (B) experimental design, paradigm and stimuli. A # Article Population
S1 Table. Characterization of the articles (n=20) included for systematic review. (A) population, acquisition and analysis parameters; (B) experimental design, paradigm and stimuli. A # Article Population
(N)MR Imaging. Lab Course Script. FMP PhD Autumn School. Location: C81, MRI Lab B0.03 (basement) Instructor: Leif Schröder. Date: November 3rd, 2010
MR Imaging. Lab Course Script. FMP PhD Autumn School. Location: C81, MRI Lab B0.03 (basement) Instructor: Leif Schröder. Date: November 3rd, 2010") (N)MR Imaging Lab Course Script FMP PhD Autumn School Location: C81, MRI Lab B0.03 (basement) Instructor: Leif Schröder Date: November 3rd, 2010 1 Purpose: Understanding the basic principles of MR imaging
(N)MR Imaging Lab Course Script FMP PhD Autumn School Location: C81, MRI Lab B0.03 (basement) Instructor: Leif Schröder Date: November 3rd, 2010 1 Purpose: Understanding the basic principles of MR imaging
PET Performance Evaluation of MADPET4: A Small Animal PET Insert for a 7-T MRI Scanner
 PET Performance Evaluation of MADPET4: A Small Animal PET Insert for a 7-T MRI Scanner September, 2017 Results submitted to Physics in Medicine & Biology Negar Omidvari 1, Jorge Cabello 1, Geoffrey Topping
Measurement at defined terminal voltage AN 41
 Measurement at defined terminal voltage AN 41 Application Note to the KLIPPEL ANALYZER SYSTEM (Document Revision 1.1) When a loudspeaker is operated via power amplifier, cables, connectors and clips the
Transfer Function (TRF)
") (TRF) Module of the KLIPPEL R&D SYSTEM S7 FEATURES Combines linear and nonlinear measurements Provides impulse response and energy-time curve (ETC) Measures linear transfer function and harmonic distortions
(TRF) Module of the KLIPPEL R&D SYSTEM S7 FEATURES Combines linear and nonlinear measurements Provides impulse response and energy-time curve (ETC) Measures linear transfer function and harmonic distortions
Advanced Test Equipment Rentals ATEC (2832)
") Established 1981 Advanced Test Equipment Rentals www.atecorp.com 800-404-ATEC (2832) Electric and Magnetic Field Measurement For Isotropic Measurement of Magnetic and Electric Fields Evaluation of Field
Established 1981 Advanced Test Equipment Rentals www.atecorp.com 800-404-ATEC (2832) Electric and Magnetic Field Measurement For Isotropic Measurement of Magnetic and Electric Fields Evaluation of Field
19 th INTERNATIONAL CONGRESS ON ACOUSTICS MADRID, 2-7 SEPTEMBER 2007
 19 th INTERNATIONAL CONGRESS ON ACOUSTICS MADRID, 2-7 SEPTEMBER 2007 MODELING SPECTRAL AND TEMPORAL MASKING IN THE HUMAN AUDITORY SYSTEM PACS: 43.66.Ba, 43.66.Dc Dau, Torsten; Jepsen, Morten L.; Ewert,
a. Use (at least) window lengths of 256, 1024, and 4096 samples to compute the average spectrum using a window overlap of 0.5.
 window lengths of 256, 1024, and 4096 samples to compute the average spectrum using a window overlap of 0.5.") 1. Download the file signal.mat from the website. This is continuous 10 second recording of a signal sampled at 1 khz. Assume the noise is ergodic in time and that it is white. I used the MATLAB Signal
1. Download the file signal.mat from the website. This is continuous 10 second recording of a signal sampled at 1 khz. Assume the noise is ergodic in time and that it is white. I used the MATLAB Signal
Page 1 of 9. Protocol: adult_other_adni3_study_human_ge_3t_25w_ _ _1. 3 Plane Localizer. 3 Plane Localizer PATIENT POSITION
 3 Localizer FOV 26.0 Slice Thickness 5.0 Slice Spacing 0.0 Freq 256 Phase 128 3-PLANE 3 Localizer Unswap Phase Correction Gradient Echo Imaging Options Seq, Fast Recon All Images Contrast Yes/ 3 Localizer
Module 2. Artefacts and Imaging Optimisation for single shot methods. Content: Introduction. Phase error. Phase bandwidth. Chemical shift review
 MRES 7005 - Fast Imaging Techniques Module 2 Artefacts and Imaging Optimisation for single shot methods Content: Introduction Phase error Phase bandwidth Chemical shift review Chemical shift in pixels
BACKGROUND. ** 78% of all MRI scanners have Image Quality problems. *** *** 25% of all Multi-Channel RF coils have at least one bad channel.
 Range of Results from over 534 ACR-mandated Annual MRI Performance Evaluations on over 204 Magnets from 8 Vendors Spanning a 10-year Period Moriel NessAiver, Ph.D. - Simply Physics - Baltimore, MD moriel@simplyphysics.com
Magnetic Resonance Research Facility (MRRF) Resources
 Resources") Magnetic Resonance Research Facility (MRRF) Resources The Magnetic Resonance Research Facility (MRRF) has scanners located in both the hospital and research buildings on the campus of the University of
Magnetic Resonance Research Facility (MRRF) Resources The Magnetic Resonance Research Facility (MRRF) has scanners located in both the hospital and research buildings on the campus of the University of
(i) Understanding the basic concepts of signal modeling, correlation, maximum likelihood estimation, least squares and iterative numerical methods
 Understanding the basic concepts of signal modeling, correlation, maximum likelihood estimation, least squares and iterative numerical methods") Tools and Applications Chapter Intended Learning Outcomes: (i) Understanding the basic concepts of signal modeling, correlation, maximum likelihood estimation, least squares and iterative numerical methods
Tools and Applications Chapter Intended Learning Outcomes: (i) Understanding the basic concepts of signal modeling, correlation, maximum likelihood estimation, least squares and iterative numerical methods
Predicting discrimination of formant frequencies in vowels with a computational model of the auditory midbrain
 F 1 Predicting discrimination of formant frequencies in vowels with a computational model of the auditory midbrain Laurel H. Carney and Joyce M. McDonough Abstract Neural information for encoding and processing
Magnetoencephalography and Auditory Neural Representations
 Magnetoencephalography and Auditory Neural Representations Jonathan Z. Simon Nai Ding Electrical & Computer Engineering, University of Maryland, College Park SBEC 2010 Non-invasive, Passive, Silent Neural
NEMA Standards Publication MS (R2014) Determination of Signal-to-Noise Ratio (SNR) in Diagnostic Magnetic Resonance Imaging
 Determination of Signal-to-Noise Ratio (SNR) in Diagnostic Magnetic Resonance Imaging") NEMA Standards Publication MS 1-2008 (R2014) Determination of Signal-to-Noise Ratio (SNR) in Diagnostic Magnetic Resonance Imaging Published by: National Electrical Manufacturers Association 1300 North
NEMA Standards Publication MS 1-2008 (R2014) Determination of Signal-to-Noise Ratio (SNR) in Diagnostic Magnetic Resonance Imaging Published by: National Electrical Manufacturers Association 1300 North
New Features of IEEE Std Digitizing Waveform Recorders
 New Features of IEEE Std 1057-2007 Digitizing Waveform Recorders William B. Boyer 1, Thomas E. Linnenbrink 2, Jerome Blair 3, 1 Chair, Subcommittee on Digital Waveform Recorders Sandia National Laboratories
Encoding of inductively measured k-space trajectories in MR raw data
 Downloaded from orbit.dtu.dk on: Apr 10, 2018 Encoding of inductively measured k-space trajectories in MR raw data Pedersen, Jan Ole; Hanson, Christian G.; Xue, Rong; Hanson, Lars G. Publication date:
Acoustic resolution. photoacoustic Doppler velocimetry. in blood-mimicking fluids. Supplementary Information
 Acoustic resolution photoacoustic Doppler velocimetry in blood-mimicking fluids Joanna Brunker 1, *, Paul Beard 1 Supplementary Information 1 Department of Medical Physics and Biomedical Engineering, University
FREQUENCY RESPONSE AND LATENCY OF MEMS MICROPHONES: THEORY AND PRACTICE
 APPLICATION NOTE AN22 FREQUENCY RESPONSE AND LATENCY OF MEMS MICROPHONES: THEORY AND PRACTICE This application note covers engineering details behind the latency of MEMS microphones. Major components of
Analysis of spatial dependence of acoustic noise transfer function in magnetic resonance imaging
 Analysis of spatial dependence of acoustic noise transfer function in magnetic resonance imaging Award: Magna Cum Laude Poster No.: C-1988 Congress: ECR 2014 Type: Scientific Exhibit Authors: T. Hamaguchi,
Noise Measurements Using a Teledyne LeCroy Oscilloscope
 Noise Measurements Using a Teledyne LeCroy Oscilloscope TECHNICAL BRIEF January 9, 2013 Summary Random noise arises from every electronic component comprising your circuits. The analysis of random electrical
Advanced MSK MRI Protocols at 3.0T. Garry E. Gold, M.D. Associate Professor Department of Radiology Stanford University
 Advanced MSK MRI Protocols at 3.0T Garry E. Gold, M.D. Associate Professor Department of Radiology Stanford University Outline Why High Field for MSK? SNR and Relaxation Times Technical Issues Example
Matlab for FMRI Module 2: BOLD signals, Matlab and the general linear model Instructor: Luis Hernandez-Garcia
 Matlab for FMRI Module 2: BOLD signals, Matlab and the general linear model Instructor: Luis Hernandez-Garcia The goal for this tutorial is to see how the statistics that we will be discussing in class
1.5T HIGH FIELD SMALL ANIMAL MRI
 1.5T HIGH FIELD SMALL ANIMAL MRI Designed Specifically for Veterinarians TECHNICAL GUIDE ADVANCING THE ART AND SCIENCE OF VETERINARY MRI The PetVet is the only high-field MRI system designed specifically
3.2 Measuring Frequency Response Of Low-Pass Filter :
 2.5 Filter Band-Width : In ideal Band-Pass Filters, the band-width is the frequency range in Hz where the magnitude response is at is maximum (or the attenuation is at its minimum) and constant and equal
VDSL2 radiation and its signal characterisation
 VDSL2 radiation and its signal characterisation Overview The EMC committee of the Radio Society of Great Britain has been monitoring sources of RFI for many years. A particular problem for HF communications
Large-scale cortical correlation structure of spontaneous oscillatory activity
 Supplementary Information Large-scale cortical correlation structure of spontaneous oscillatory activity Joerg F. Hipp 1,2, David J. Hawellek 1, Maurizio Corbetta 3, Markus Siegel 2 & Andreas K. Engel
TNS Journal Club: Efficient coding of natural sounds, Lewicki, Nature Neurosceince, 2002
 TNS Journal Club: Efficient coding of natural sounds, Lewicki, Nature Neurosceince, 2002 Rich Turner (turner@gatsby.ucl.ac.uk) Gatsby Unit, 18/02/2005 Introduction The filters of the auditory system have
Field Simulation Software to Improve Magnetic Resonance Imaging
 Field Simulation Software to Improve Magnetic Resonance Imaging a joint project with the NRI in South Korea CST Usergroup Meeting 2010 Darmstadt Institute for Biometry and Medicine Informatics J. Mallow,
Signals & Systems for Speech & Hearing. Week 6. Practical spectral analysis. Bandpass filters & filterbanks. Try this out on an old friend
 Signals & Systems for Speech & Hearing Week 6 Bandpass filters & filterbanks Practical spectral analysis Most analogue signals of interest are not easily mathematically specified so applying a Fourier
functional MRI: A primer
 Activation Leads to: functional MRI: A primer CBF Increased +ΔR CBV Increased +ΔR (C+) O Utilization Increased slightly? Venous [O ] Increased -ΔR* Glucose Utilization Increased? Lactate BOLD R=/T R=/T
For Isotropic Measurement of Magnetic and Electric Fields
 Field Analyzers EFA-300 For Isotropic Measurement of Magnetic and Electric Fields Evaluation of Field Exposure compared to Major Standards and Guidance (selectable) Shaped Time Domain (STD) an innovative
PHYSIOLOGICAL DE-NOISING FMRI DATA. Katie Dickerson & Jeff MacInnes February 11th, 2013
 PHYSIOLOGICAL DE-NOISING FMRI DATA Katie Dickerson & Jeff MacInnes February 11th, 2013 OUTLINE OUTLINE Theoretical overview OUTLINE Theoretical overview OUTLINE Theoretical overview Tutorial in FSL OVERVIEW
MAKING TRANSIENT ANTENNA MEASUREMENTS
 MAKING TRANSIENT ANTENNA MEASUREMENTS Roger Dygert, Steven R. Nichols MI Technologies, 1125 Satellite Boulevard, Suite 100 Suwanee, GA 30024-4629 ABSTRACT In addition to steady state performance, antennas
Complex Sounds. Reading: Yost Ch. 4
 Complex Sounds Reading: Yost Ch. 4 Natural Sounds Most sounds in our everyday lives are not simple sinusoidal sounds, but are complex sounds, consisting of a sum of many sinusoids. The amplitude and frequency
Measurement of Digital Transmission Systems Operating under Section March 23, 2005
 Measurement of Digital Transmission Systems Operating under Section 15.247 March 23, 2005 Section 15.403(f) Digital Modulation Digital modulation is required for Digital Transmission Systems (DTS). Digital
MATLAB for time series analysis! e.g. M/EEG, ERP, ECG, EMG, fmri or anything else that shows variation over time! Written by!
 MATLAB for time series analysis e.g. M/EEG, ERP, ECG, EMG, fmri or anything else that shows variation over time Written by Joe Bathelt, MSc PhD candidate Developmental Cognitive Neuroscience Unit UCL Institute
Rapid Formation of Robust Auditory Memories: Insights from Noise
 Neuron, Volume 66 Supplemental Information Rapid Formation of Robust Auditory Memories: Insights from Noise Trevor R. Agus, Simon J. Thorpe, and Daniel Pressnitzer Figure S1. Effect of training and Supplemental
Cardiac MR. Dr John Ridgway. Leeds Teaching Hospitals NHS Trust, UK
 Cardiac MR Dr John Ridgway Leeds Teaching Hospitals NHS Trust, UK Cardiac MR Physics for clinicians: Part I Journal of Cardiovascular Magnetic Resonance 2010, 12:71 http://jcmr-online.com/content/12/1/71
2620 Modular Measurement and Control System
 European Union (EU) Council Directive 89/336/EEC Electromagnetic Compatibility (EMC) Test Report 2620 Modular Measurement and Control System Sensoray March 31, 2006 April 4, 2006 Tests Conducted by: ElectroMagnetic
Detection of Modulated Tones in Modulated Noise by Non-human Primates
 JARO 15: 801 821 (14) DOI:.07/s162-014-0467-7 D 14 Association for Research in Otolaryngology Research Article JARO Journal of the Association for Research in Otolaryngology Detection of Modulated Tones
Where DSP meets Measurement Science: A Sound Example. By Andrew Hurrell PhD
 Where DSP meets Measurement Science: A Sound Example By Andrew Hurrell PhD Measuring ultrasound why bother? 6 million ultrasound scans within NHS during 2004-2005 Ultrasound has potential for: Thermal
Lesson 06: Pulse-echo Imaging and Display Modes. These lessons contain 26 slides plus 15 multiple-choice questions.
 Lesson 06: Pulse-echo Imaging and Display Modes These lessons contain 26 slides plus 15 multiple-choice questions. These lesson were derived from pages 26 through 32 in the textbook: ULTRASOUND IMAGING
University Tunku Abdul Rahman LABORATORY REPORT 1
 University Tunku Abdul Rahman FACULTY OF ENGINEERING AND GREEN TECHNOLOGY UGEA2523 COMMUNICATION SYSTEMS LABORATORY REPORT 1 Signal Transmission & Distortion Student Name Student ID 1. Low Hui Tyen 14AGB06230
The role of intrinsic masker fluctuations on the spectral spread of masking
 The role of intrinsic masker fluctuations on the spectral spread of masking Steven van de Par Philips Research, Prof. Holstlaan 4, 5656 AA Eindhoven, The Netherlands, Steven.van.de.Par@philips.com, Armin
STEM Spectrum Imaging Tutorial
 STEM Spectrum Imaging Tutorial Gatan, Inc. 5933 Coronado Lane, Pleasanton, CA 94588 Tel: (925) 463-0200 Fax: (925) 463-0204 April 2001 Contents 1 Introduction 1.1 What is Spectrum Imaging? 2 Hardware 3
Temporal resolution AUDL Domain of temporal resolution. Fine structure and envelope. Modulating a sinusoid. Fine structure and envelope
 Modulating a sinusoid can also work this backwards! Temporal resolution AUDL 4007 carrier (fine structure) x modulator (envelope) = amplitudemodulated wave 1 2 Domain of temporal resolution Fine structure
Spectrum Analyzer TEN MINUTE TUTORIAL
 Spectrum Analyzer TEN MINUTE TUTORIAL November 4, 2011 Summary The Spectrum Analyzer option allows users who are familiar with RF spectrum analyzers to start using the FFT with little or no concern about
3D Distortion Measurement (DIS)
") 3D Distortion Measurement (DIS) Module of the R&D SYSTEM S4 FEATURES Voltage and frequency sweep Steady-state measurement Single-tone or two-tone excitation signal DC-component, magnitude and phase of
3D Distortion Measurement (DIS) Module of the R&D SYSTEM S4 FEATURES Voltage and frequency sweep Steady-state measurement Single-tone or two-tone excitation signal DC-component, magnitude and phase of
EC209 - Improving Signal-To-Noise Ratio (SNR) for Optimizing Repeatable Auditory Brainstem Responses
 for Optimizing Repeatable Auditory Brainstem Responses") EC209 - Improving Signal-To-Noise Ratio (SNR) for Optimizing Repeatable Auditory Brainstem Responses Aaron Steinman, Ph.D. Director of Research, Vivosonic Inc. aaron.steinman@vivosonic.com 1 Outline Why
EC209 - Improving Signal-To-Noise Ratio (SNR) for Optimizing Repeatable Auditory Brainstem Responses Aaron Steinman, Ph.D. Director of Research, Vivosonic Inc. aaron.steinman@vivosonic.com 1 Outline Why
LAB #7: Digital Signal Processing
 LAB #7: Digital Signal Processing Equipment: Pentium PC with NI PCI-MIO-16E-4 data-acquisition board NI BNC 2120 Accessory Box VirtualBench Instrument Library version 2.6 Function Generator (Tektronix
MR Advance Techniques. Flow Phenomena. Class II
 MR Advance Techniques Flow Phenomena Class II Flow Phenomena In this class we will explore different phenomenona produced from nuclei that move during the acquisition of data. Flowing nuclei exhibit different
Spiral MRI on a 9.4T Vertical-bore Superconducting Magnet Using Unshielded and Self-shielded Gradient Coils
 Magn Reson Med Sci doi:10.2463/mrms.tn.2016-0049 Published Online: March 27, 2017 TECHNICAL NOTE Spiral MRI on a 9.4T Vertical-bore Superconducting Magnet Using Unshielded and Self-shielded Gradient Coils
Signal Processing for Digitizers
 Signal Processing for Digitizers Modular digitizers allow accurate, high resolution data acquisition that can be quickly transferred to a host computer. Signal processing functions, applied in the digitizer
IMAGING OF DEFECTS IN CONCRETE COMPONENTS WITH NON-CONTACT ULTRASONIC TESTING W. Hillger, DLR and Ing. Büro Dr. Hillger, Braunschweig, Germany
 IMAGING OF DEFECTS IN CONCRETE COMPONENTS WITH NON-CONTACT ULTRASONIC TESTING W. Hillger, DLR and Ing. Büro Dr. Hillger, Braunschweig, Germany Abstract: The building industries require NDT- methods for
EPR2010 Puerto Rico. Rapid Scan EPR. Mark Tseitlin, Deborah G. Mitchell, Joshua A. Biller, Richard W. Quine, George A. Rinard, Sandra S.
 EPR2010 Puerto Rico Rapid Scan EPR Mark Tseitlin, Deborah G. Mitchell, Joshua A. Biller, Richard W. Quine, George A. Rinard, Sandra S. Eaton, Gareth R. Eaton, and Ralph T. Weber University of Denver and
- 1 - Rap. UIT-R BS Rep. ITU-R BS.2004 DIGITAL BROADCASTING SYSTEMS INTENDED FOR AM BANDS
 - 1 - Rep. ITU-R BS.2004 DIGITAL BROADCASTING SYSTEMS INTENDED FOR AM BANDS (1995) 1 Introduction In the last decades, very few innovations have been brought to radiobroadcasting techniques in AM bands
Signals A Preliminary Discussion EE442 Analog & Digital Communication Systems Lecture 2
 Signals A Preliminary Discussion EE442 Analog & Digital Communication Systems Lecture 2 The Fourier transform of single pulse is the sinc function. EE 442 Signal Preliminaries 1 Communication Systems and
3D Intermodulation Distortion Measurement AN 8
 3D Intermodulation Distortion Measurement AN 8 Application Note to the R&D SYSTEM The modulation of a high frequency tone f (voice tone and a low frequency tone f (bass tone is measured by using the 3D
Works-in-Progress package Version 1.0. For the SIEMENS Magnetom. Installation and User s Guide NUMARIS/4VA21B. January 22, 2003
 Works-in-Progress package Version 1.0 For the Installation and User s Guide NUMARIS/4VA21B January 22, 2003 Section of Medical Physics, University Hospital Freiburg, Germany Contact: Klaus Scheffler PhD,
Measuring the complexity of sound
 PRAMANA c Indian Academy of Sciences Vol. 77, No. 5 journal of November 2011 physics pp. 811 816 Measuring the complexity of sound NANDINI CHATTERJEE SINGH National Brain Research Centre, NH-8, Nainwal
Perception of pitch. Definitions. Why is pitch important? BSc Audiology/MSc SHS Psychoacoustics wk 4: 7 Feb A. Faulkner.
 Perception of pitch BSc Audiology/MSc SHS Psychoacoustics wk 4: 7 Feb 2008. A. Faulkner. See Moore, BCJ Introduction to the Psychology of Hearing, Chapter 5. Or Plack CJ The Sense of Hearing Lawrence Erlbaum,
Pulse Sequence Design and Image Procedures
 Pulse Sequence Design and Image Procedures 1 Gregory L. Wheeler, BSRT(R)(MR) MRI Consultant 2 A pulse sequence is a timing diagram designed with a series of RF pulses, gradients switching, and signal readout
Nuove tecnologie per ecografia ad ultrasuoni: da 2D a 4D
 DINFO Dipartimento di Ingegneria dell Informazione Department of Information Engineering Nuove tecnologie per ecografia ad ultrasuoni: da 2D a 4D Piero Tortoli Microelectronics Systems Design Lab 1 Introduction
Philips Site Yearly Performance Evaluation Philips Openview 16-Jan-08. Table of Contents
 Philips Site Yearly Performance Evaluation Philips Openview 6-Jan-8 Table of Contents Summary and Signature Page 2 Specific Comments 3 Site Information 4 Equipment Information 4 Table Position Accuracy
Definitions. Spectrum Analyzer
 SIGNAL ANALYZERS Spectrum Analyzer Definitions A spectrum analyzer measures the magnitude of an input signal versus frequency within the full frequency range of the instrument. The primary use is to measure
Characterization of medical devices electromagnetic immunity to environmental RF fields.
 Characterization of medical devices electromagnetic immunity to environmental RF fields. INTRODUCTION The diffusion of personal communication devices and radio communication systems has strongly increased
Influence of the human body mass in the open air MRI on acoustic noise spectrum
 ACTA IMEKO ISSN: 1 87X November 16, Volume, Number 3, 81 86 Influence of the human body mass in the open air MRI on acoustic noise spectrum Jiří Přibil 1, Anna Přibilová, Ivan Frollo 1 1 Institute of Measurement
DESIGN OF VOICE ALARM SYSTEMS FOR TRAFFIC TUNNELS: OPTIMISATION OF SPEECH INTELLIGIBILITY
 DESIGN OF VOICE ALARM SYSTEMS FOR TRAFFIC TUNNELS: OPTIMISATION OF SPEECH INTELLIGIBILITY Dr.ir. Evert Start Duran Audio BV, Zaltbommel, The Netherlands The design and optimisation of voice alarm (VA)
Research Article Implementation and Application of PSF-Based EPI Distortion Correction to High Field Animal Imaging
 Hindawi Publishing Corporation International Journal of Biomedical Imaging Volume 2009, Article ID 946271, 7 pages doi:10.1155/2009/946271 Research Article Implementation and Application of PSF-Based EPI
THE USE OF VOLUME VELOCITY SOURCE IN TRANSFER MEASUREMENTS
 THE USE OF VOLUME VELOITY SOURE IN TRANSFER MEASUREMENTS N. Møller, S. Gade and J. Hald Brüel & Kjær Sound and Vibration Measurements A/S DK850 Nærum, Denmark nbmoller@bksv.com Abstract In the automotive
Localizer provides signal generation over the Localizer band of to MHz with 90 Hz and 150 Hz tones, amplitude modulated
 The IFR 4000 verifies the operation and installation of ILS, VOR and Marker Beacon receivers and VHF/UHF AM/FM and HF AM/SSB transceivers. The IFR 4000, with its lightweight size (under 8 lbs.), long run
THE APPLICATION WAVELET TRANSFORM ALGORITHM IN TESTING ADC EFFECTIVE NUMBER OF BITS
 ABSTRACT THE APPLICATION WAVELET TRANSFORM ALGORITHM IN TESTING EFFECTIVE NUMBER OF BITS Emad A. Awada Department of Electrical and Computer Engineering, Applied Science University, Amman, Jordan In evaluating
Evaluation of sliding window correlation performance for characterizing dynamic functional connectivity and brain states
 Evaluation of sliding window correlation performance for characterizing dynamic functional connectivity and brain states Sadia Shakil, Georgia Institute of Technology Chin-Hui Lee, Georgia Institute of
Reading: Johnson Ch , Ch.5.5 (today); Liljencrants & Lindblom; Stevens (Tues) reminder: no class on Thursday.
; Liljencrants & Lindblom; Stevens (Tues) reminder: no class on Thursday.") L105/205 Phonetics Scarborough Handout 7 10/18/05 Reading: Johnson Ch.2.3.3-2.3.6, Ch.5.5 (today); Liljencrants & Lindblom; Stevens (Tues) reminder: no class on Thursday Spectral Analysis 1. There are
L105/205 Phonetics Scarborough Handout 7 10/18/05 Reading: Johnson Ch.2.3.3-2.3.6, Ch.5.5 (today); Liljencrants & Lindblom; Stevens (Tues) reminder: no class on Thursday Spectral Analysis 1. There are
Phased Array Velocity Sensor Operational Advantages and Data Analysis
 Phased Array Velocity Sensor Operational Advantages and Data Analysis Matt Burdyny, Omer Poroy and Dr. Peter Spain Abstract - In recent years the underwater navigation industry has expanded into more diverse
ACRIN 6686 / RTOG 0825
 ACRIN 6686 (RTOG 0825) Advanced MRI Imaging Manual ACRIN 6686 / RTOG 0825 A phase III double blind placebo controlled trial of conventional chemoradiation and adjuvant temozolomide plus bevacizumab vs
Supplementary User Manual for BSWA Impedance Tube Measurement Systems
 Supplementary User Manual for BSWA Impedance Tube Measurement Systems 1 P age Contents Software Installation... 3 Absorption Measurements -- ASTM Method... 4 Hardware Set-Up... 4 Sound card Settings...
EDDY CURRENT MEASUREMENT OF REMOTE TUBE POSITIONS IN CANDU REACTORS S.T. Craig, T.W. Krause, B.V. Luloff and J.J. Schankula Atomic Energy of Canada
 EDDY CURRENT MEASUREMENT OF REMOTE TUBE POSITIONS IN CANDU REACTORS S.T. Craig, T.W. Krause, B.V. Luloff and J.J. Schankula Atomic Energy of Canada Limited, Chalk River, Ontario, Canada Abstract: Regular
inter.noise 2000 The 29th International Congress and Exhibition on Noise Control Engineering August 2000, Nice, FRANCE
 Copyright SFA - InterNoise 2000 1 inter.noise 2000 The 29th International Congress and Exhibition on Noise Control Engineering 27-30 August 2000, Nice, FRANCE I-INCE Classification: 7.2 MICROPHONE T-ARRAY