15EI403J- IMAGE PROCESSING LAB MANUAL
|
|
|
- Dwayne Green
- 5 years ago
- Views:
Transcription

1 15EI403J- IMAGE PROCESSING LAB MANUAL Department of Electronics and Instrumentation Engineering Faculty of Engineering and Technology Department of Electronics and Instrumentation Engineering SRM IST, SRM Nagar Kattankulathur Kancheepuram District Tamil Nadu
2 CONTENTS S.No. CONTENTS Page No. 1 Mark Assessment details 3 2 General Instructions for Laboratory classes 4 3 Syllabus 5 4 Introduction to the laboratory 6 List of Experiments 5.1 Display of gray scale images Histogram Equalization Design non-linear filtering Determination of edge detection using operators D DFT and DCT Filtering in Frequency domain Display of colour images Conversion between colour spaces DWT of images Segmentation using watershed transform 56 2
3 1. MARK ASSESSMENT DETAILS ALLOTMENT OF MARKS: Internal assessment = 60 marks Practical examination = 40 marks Total = 100 marks INTERNAL ASSESSMENT (60 MARKS) Split up of internal marks Record Model exam Quiz/Viva Experiments Total 5 marks 10 marks 5 marks 40 marks 60 marks PRACTICAL EXAMINATION (40MARKS) Split up of practical examination marks Aim and Procedure Circuit Diagram Tabulation Result Viva voce Total 25 marks 30 marks 30 marks 05 marks 10 marks 100 marks 3
4 2. GENERAL INSTRUCTIONS FOR LABORATORY CLASSES Enter the Lab with CLOSED TOE SHOES. Students should wear lab coat. The HAIR should be protected, let it not be loose. TOOLS, APPARATUS and COMPONENT sets are to be returned before leaving the lab. HEADINGS and DETAILS should be neatly written o o o Aim of the experiment Apparatus / Tools / Instruments required Theory o Procedure / Algorithm / Program o o o o Model Calculations/ Design calculations Block Diagram / Flow charts/ Circuit diagram Tabulations/ Waveforms/ Graph Result / discussions. Experiment number and date should be written in the appropriate place. After completing the experiment, the answer to pre lab viva-voce questions should be neatly written in the workbook. Be REGULAR, SYSTEMATIC, PATIENT, AND STEADY. 4
5 3. SYLLABUS 15EI403J Image Processing L T P C Co-requisite: NIL 15EI Prerequisite: 301 Data Book / Codes/Standards NIL ELECTRONICS Course Category P PROFESSIONAL ENGINEERING ENGINEERING Course designed by Department of Electronics and Instrumentation Engineering Approval 32 nd Academic Council Meeting held on 23 rd July, 2016 PURPOSE INSTRUCTIONAL OBJECTIVES The purpose of this course is to introduce the basic concept and methodolog for digital image processing STUDENT OUTCOMES At the end of the course, student will be able to 1. Study the image fundamentals, mathematical transforms a b d k necessary for image processing 2. About the various techniques of image enhancement, reconstruction, compression and segmentation a b h 3.. Know sampling and reconstruction procedures a b e 4. Design image processing systems Session Description of experiments Contact C-Dhours I-O IOs Reference 1. Display of Gray scale Images. 3 I 1-4 1,2 2. Histogram Equalization. 3 C 1 1,2 3. Design of Non-linear Filtering. 3 D 1 1,3 4. Determination of Edge detection using Operators. 3 C,I 1,3, D DFT and DCT. 3 C,D 1, Filtering in frequency domain. 3 C 3, Display of colour images. 3 D,I 3, Conversion between colour spaces. 3 I 3,4 1,3,4 9. DWT of images. 3 I 4 1,4,2 10. Segmentation using watershed transform. 3 I 4 1 Total contact hours 30 LEARNING RESOURCES Sl.No TEXT BOOKS 1. Rafael.C,Gonzalez, Richard E Woods, Digital Image Processing,3rdEdition, Pearson India, Jain A.K, Fundamentals of Digital Image Processing, 4 th Edition, Prentice hall of India, REFERENCE BOOKS/OTHER READING MATERIAL 3. B.Chanda, D. DuttaMajumder, Digital Image Processing and Analysis, 2 nd Edition, Phi learning, William K Pratt, Digital Image Processing, 4 th Edition, Wiley, Assessment Method Practical Component (Weightage 50%) Assessment MCQ/Quiz/Viva Model In- Experiments Record Total tool Voce examination semester Weightage 40% 5% 5% 10% 60% End semester examination Weightage : 40% 5
6 4. INTRODUCTION IMAGE PROCESSING LABORATORY COURSE FLOW: This laboratory course completely deals with basics of image processing and their experimental observations. Here the students are exposed to design the image processing blocks and do image filtering, image enhancement, edge detection etc. To start with this laboratory session, initially all students are trained to use the LabVIEW software. Thorough understanding of LabVIEW software is mandatory for proceeding with the course wear. Instructions to the students are given in the start of this document which they are advised to read before they start conducting experiments. INSTRUCTIONS BEFORE STARTING THE EXPERIMENT Study the theory and procedures, expected output before doing the experiment. Get familiarize with the LabVIEW software Introduction to IMAQ Vision for LabVIEW software: This introduction describes the IMAQ Vision for LabVIEW software, outlines the IMAQ Vision palette organization, and lists the steps for making a machine vision application. Note Refer to the release notes that came with your software for information about the system requirements and installation procedure for IMAQ Vision for LabVIEW. About IMAQ Vision: IMAQ Vision Control Palette: IMAQ Vision for LabVIEW a part of the Vision Development Module is a library of LabVIEW VIs that you can use to develop machine vision and scientific imaging applications. The Vision Development Module also includes the same imaging functions for LabWindows /CVI and other C development environments, as well as ActiveX controls for Visual Basic. Vision Assistant, another Vision Development Module software product, enables you to prototype your application strategy quickly without having to do any programming. Additionally, NI offers Vision Builder AI: configurable machine vision software that you can use to prototype, benchmark, and deploy applications. The Vision control palette is available from the top level of the controls palette in LabVIEW 7.0 or later. In LabVIEW 6.x, the Vision control palette is available from the user controls palette. The Vision control palette has the following elements: IMAQ Image.ctl This control is the type definition that describes the image data type. You can use this control to represent the image data type on the front panel of a VI. For example, use this control as an input or output of a subvi so that a calling VI can pass an image to the subvi. In LabVIEW 6.x, this control is located on the IMAQ Vision control palette. 6
7 IMAQ Vision Function Palettes: Vision Utilities: Image Display Use this control to display your images directly on the LabVIEW front panel if you are using LabVIEW 7.0 or later. You also can use this control to create regions of interest (ROIs). Classic and 3D versions are available. 1. IMAQ Vision controls Use these controls to get the functionality of corresponding IMAQ Vision VI controls directly into your own VIs. 2. Machine Vision controls Use these controls to get the functionality of corresponding Machine Vision VI controls directly into your own VIs. IMAQ Vision for LabVIEW is organized into three main function palettes: Vision Utilities, Image Processing, and Machine Vision. This section describes these palettes and their subpalettes. Note This document references many VIs from the IMAQ Vision function palette. If you have difficulty finding a VI, use the search capability of the LabVIEW VI browser. Image Processing: Vision Utilities functions allow you to manipulate and display images in IMAQ Vision. Image Management A group of VIs that manage images. Use these VIs to create and dispose images, set and read attributes of an image such as its size and offset, and copy one image to another. You also can use some of the advanced VIs to define the border region of an image and access the pointer to the image data. Files A group of VIs that read images from files, write images to files in different file formats, and get information about the image contained in a file. External Display A group of VIs that control the display of images in external image windows. Use these VIs to complete the following tasks: Get and set window attributes, such as size, position, and zoom factor Assign color palettes to image windows Set up and use image browsers Set up and use different drawing tools to interactively select ROIs on image windows Detect draw events Retrieve information about ROIs drawn on the image window Use the Image Processing functions to analyze, filter, and process images in IMAQ Vision. 1. Processing A group of VIs that process grayscale and binary images. Use these VIs to convert a grayscale image into a binary image using different thresholding techniques. You also can use these VIs to transform images using predefined or custom lookup tables, change the contrast information in the image, and invert the values in an image. 2. Filters A group of VIs that filter an image to enhance the information in the image. Use these VIs to smooth an image, remove noise, and highlight or enhance edges in the image. You can use a predefined convolution kernel or create custom convolution kernels. 3. Morphology A group of VIs that perform morphological operations on an image. Some of these VIs perform basic morphological operations, such as dilation and erosion, on grayscale and binary images. Other VIs improve the quality of binary images by filling holes in particles, removing particles that 7
8 touch the image border, removing small particles, and removing unwanted particles based on different shape characteristics of the particle. Another set of VIs in this subpalette separate touching particles, find the skeleton of particles, and detect circular particles. 4. Analysis A group of VIs that analyze the content of grayscale and binary images. Use these VIs to compute the histogram information and grayscale statistics of an image, retrieve pixel information and statistics along any onedimensional profile in an image, and detect and measure particles in binary images. 5. Color Processing A group of VIs that analyze and process color images. Use these VIs to compute the histogram of color images; apply lookup tables to color images; change the brightness, contrast, and gamma information associated with a color image; and threshold a color image. Some of these VIs also compare the color information in different images or different regions in an image using a color matching process. Operators A group of VIs that perform basic arithmetic and logical operations on images. Use some of these VIs to add, subtract, multiply, and divide an image with other images or constants. Use other VIs in this subpalette to apply logical operations such as AND/NAND, OR/NOR, XOR/XNOR and make pixel comparisons between an image and other images or a constant. In addition, one VI in this subpalette allows you to select regions in an image to process using a masking operation. Frequency Domain A group of VIs that analyze and process images in the frequency domain. Use these VIs to convert an image from the spatial domain to the frequency domain using a two-dimensional Fast Fourier Transform (FFT) and convert from the frequency domain to the spatial domain using the inverse FFT. These VIs also extract the magnitude, phase, real, and imaginary planes of the complex image. In addition, these VIs allow you to convert complex images into complex 2D arrays and back. Also in this subpalette are VIs that perform basic arithmetic operations such as addition, subtraction, multiplication, and division between a complex image and other images or a constant. Lastly, some of these VIs allow you to filter images in the frequency domain. 8
9 EXPERIMENT 1 DISPLAY OF GRAY SCALE IMAGES 1(a). Aim To create a program to display grayscale image using read and write operation. Apparatus Used A PC with LabVIEW software Vision Toolbox Theory In photography and computing, a grayscale or greyscale digital image is an image in which the value of each pixel is a single sample, that is, it carries only intensity information. Images of this sort, also known as black-and-white, are composed exclusively of shades of gray, varying from black at the weakest intensity to white at the strongest. Procedure 1. Open LabVIEW from desktop. 2. Create a separate editor window and front panel. 3. Right click, select vision motion and choose IMAQ create and choose image type(specify U- 32) as grayscale. 4. Create control by choosing read image (IMAQ Read) and specifying the file path (from which the image is to be acquired). 5. Similarly, create control for writing by choosing write image (IMAQ Write). 6. Create an indicator image for display to the front panel and join. 9

10 Block Diagram 10

11 Output Result : Thus,the program to display gray scale image using read and write operation was created. 11
12 1(b). Aim To create a vision program to convert a 2D array into a grayscale image. Apparatus Used A PC with LabVIEW software Vision Toolbox Theory An array is a container object that holds a fixed number of values of a single type. The length of an array is established when the array is created. After creation, its length is fixed.the Image block displays the data in array as an image. Each element of array specifies the color for 1 pixel of the image. The resulting image is an m-by-n grid of pixels where m is the number of columns and n is the number of rows. The row and column indices of the elements determine the centers of the corresponding pixels. The array values range from 0 to 255 to display the various shades of black. Procedure 1. Open LabVIEW from desktop. 2. Create a separate editor window and front panel. 3. Right click in the window and set parameters as constant and the image type as grayscale. 4. In the editor window, through right click and the vision and motion category choose (by searching for) Array to Image, set specifications as Image pixels-u8. 5. From the previous block, create an image display indicator. 6. Input values in Image Pixels present in front panel and check the Output. 12

13 Block Diagram 13

14 Output Result : Thus,the vision program to convert a 2D array into a gray scale image was created. 14
15 1(c). Aim To create a vision program to convert gray images into an array of numbers. Apparatus Used A PC with LabVIEW software Vision Toolbox Theory A digital gray scale image is nothing more than data numbers indicating variations of black and white at a particular location on a grid of pixels. Most of the time, we view these pixels as miniature rectangles sandwiched together on a computer screen. With a little creative thinking and some lower level manipulation of pixels with code, however, we can display that information in a myriad of ways. This tutorial is dedicated to breaking out of simple shape drawing in Processing and using images (and their pixels) as the building blocks of Processing graphics. Procedure 1. Open LabVIEW from desktop. 2. Create a separate editor window and front panel. 3. Right click, select vision and motion >> choose IMAQ create. Add a constant and image to it. 4. Add a file path and specify the path of the image (at the particular storage location) which is to be processed. 5. Add a gray image to array block to obtain values into array. 6. Add an indicator at the end to check for the image pixels at the Output. 7. The Output will be obtained in the front panel in the image pixel indicator (set to U32). 15

16 Block Diagram 16

17 Output Result : Thus,the vision program to convert gray image into an array of numbers was created. 17
 of a picture element in an input image onto a")
18 1 (d) Aim To create a program to rotate an image. Apparatus Used A PC with Lab VIEW software Vision Toolbox Theory The rotation operator performs a geometric transform which maps the position (x1,y1) of a picture element in an input image onto a position (x2,y2) in an Output image by rotating it through a userspecified angle ϴ about an origin. In most implementations, Output locations (x2,y2) which are outside the boundary of the image are ignored. Rotation is most commonly used to improve the visual appearance of an image, although it can be useful as a preprocessor in applications where directional operators are involved. Rotation is a special case of affine transformation. Procedure 1. Create a new VI. 2. Select jpeg read file and provide file path control and indicator for jpeg read file. 3. Choose Draw flattened pix map and provide an indicator for it. 4. Create unbundle, reverse 1D array and bundle. 5. Connect the above to draw flattened pix map and provide it with an indicator. 6. Choose a file path and run the program. 18


19 Block Diagram Output Result: Thus, the program to rotate an image was created. 19
20 EXPERIMENT 2 HISTOGRAM EQUALIZATION Aim To create a vision program to find histogram value and display histograph of a grayscale and color image. Apparatus Used A PC with LabVIEW software Vision Toolbox Theory An image histogram is a type of histogram that acts as a graphical representation of the tonal distribution in a digital image. It plots the number of pixels for each tonal value. By looking at the histogram for a specific image a viewer will be able to judge the entire tonal distribution at a glance. The horizontal axis of the graph represents the tonal variations, while the vertical axis represents the number of pixels in that particular tone. The left side of the horizontal axis represents the black and dark areas, the middle represents medium grey and the right hand side represents light and pure white areas. The vertical axis represents the size of the area that is captured in each one of these zones. Procedure 1. Create a new VI. 2. Select Vision and Motion >> Vision Utilities >> Image Management >> IMAQ create. 3. Vision Utilities >> Files >> Read File. 4. Analyser >> Histogram and place it. 5. Analyser >>Histograph and place it. 6. Run the program. 20

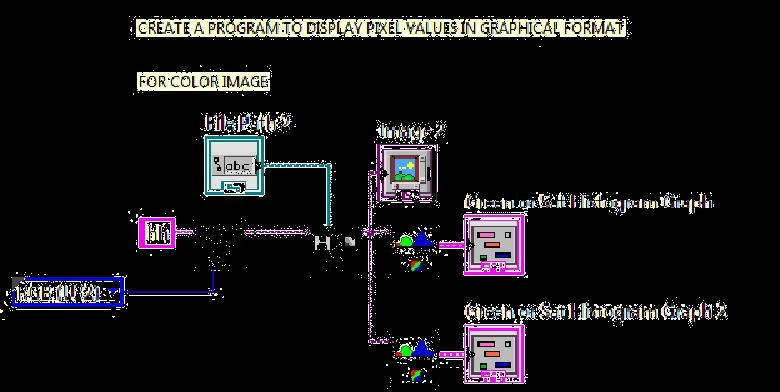
21 Block Diagram 21


22 OUTPUT Block Diagram 22

23 Output Result : Thus,the program to find histogram value and display histograph of a grayscale and colour image was created. 23
24 EXPERIMENT 3 DESIGN OF NON-LINEAR FILTERING. Aim To create a vision program for Non-Linear Filtering technique using edge detection. Apparatus Used A PC with LabVIEW software Vision Toolbox Theory Edge detection includes a variety of mathematical methods that aim at identifying points in a digital image at which the image brightness changes sharply or, more formally, has discontinuities. The points at which image brightness changes sharply are typically organized into a set of curved line segments termed edges. The same problem of finding discontinuities in 1D signals is known as step detection and the problem of finding signal discontinuities over time is known as change detection. Edge detection is a fundamental tool in image processing, machine vision and computer vision, particularly in the areas of feature detection and feature extraction. Procedure 1. Open LabVIEW software in desktop. 2. Create separate editor window and front panel. 3. Right click, select vision motion chooses IMAQ create. Add constant image type (grayscale U8) to it. 4. Select file read and this is given to IMAQ edge detection. Give a constant for it. 5. Create an indicator for display and join it. 6. Give a file path and run the program. 24

25 Block Diagram 25


26 Output Block Diagram 26
27 Output Result: Thus, the program for the non linear filtering for an image using edge detection was created. 27
28 EXPERIMENT 4 DETERMINATION OF EDGE DETECTION USING OPERATORS. Aim To create a vision program to determine the edge detection of an image using different operators. Apparatus Used A PC with LabVIEW software Vision Toolbox Theory Edge detection includes a variety of mathematical methods that aim at identifying points in a digital image at which the image brightness changes sharply or, more formally, has discontinuities. The points at which image brightness changes sharply are typically organized into a set of curved line segments termed edges. The same problem of finding discontinuities in 1D signals is known as step detection and the problem of finding signal discontinuities over time is known as change detection. Edge detection is a fundamental tool in image processing, machine vision and computer vision, particularly in the areas of feature detection and feature extraction. Procedure 1. Open LabVIEW software in desktop. 2. Create separate editor window and front panel. 3. Right click, select vision motion choose IMAQ create. Add constant image type (grayscale U8) to it. 4. Select file read and this is given to IMAQ edge detection. Give a constant for it. 5. Create an indicator for display and join it. 6. Give a file path and run the program. 28
29 Block Diagram 29
30 Output Block Diagram 30
31 Output Block Diagram 31
32 Output Block Diagram 32
33 Output Result:. Thus, the vision program to determine the edge detection of an image using different operators was created. 33
34 Experiment 5 2-D DFT and DCT 5 (a) Aim: To create a program to discretize an image using Fourier transformation. Apparatus Used A PC with LabVIEW software Vision Toolbox Theory The Fourier Transform is an important image processing tool which is used to decompose an image into its sine and cosine components. The Output of the transformation represents the image in the Fourier or frequency domain, while the input image is the spatial domain equivalent. In the Fourier domain image, each point represents a particular frequency contained in the spatial domain image. The Fourier Transform is used in a wide range of applications, such as image analysis, image filtering, image reconstruction and image compression. Procedure 1. Open LabVIEW software in desktop. 2. Create separate editor window and front panel. 3. Right click, select vision motion chooses IMAQ create. Add constant image type (grayscale U8) to it. 4. Select file read and give a control. 5. Choose IMAQ FFT and give it to ab indicator (Image display), For IMAQ FFT give IMAQ create (with image type as complex CSG ). 6. Choose Inverse FFT and to it give an indicator (image display). Also for inverse FFT give and \ IMAQ create with image type (grayscale U8). 7. Give a file path and run the program. 34
")
35 Block Diagram (Using vision Motion Tool) 35
")
36 Block Diagram (Using DSP Tool) 36

37 Output Result : Thus, the program to discretize the image using Fourier Transform was created. 37
38 5(b) Aim To create a program to perform Discrete cosine transform on an image. Apparatus Used A PC with LabVIEW software Vision Toolbox Theory A discrete cosine transform (DCT) expresses a finite sequence of data points in terms of a sum of cosine functions oscillating at different frequencies. DCTs are important to numerous applications in science and engineering, from lossy compression of audio (e.g. MP3) and images (e.g. JPEG) (where small high-frequency components can be discarded), tospectral methods for the numerical solution of partial differential equations. The use of cosine rather than sine functions is critical for compression, since it turns out (as described below) that fewer cosine functions are needed to approximate a typical signal, whereas for differential equations the cosines express a particular choice of boundary conditions. Procedure 1.Open LabVIEW software in desktop. 2.Create separate editor window and front panel. 3. Right click, select vision motion choose IMAQ create. Add constant image type (grayscale U8) to it. Duplicate the blocks again. 4.Select file read and give a control. 5.Choose Image to array connect the same. 6. Select DCT block from signal processing and connect it to array to image block. 7.Create an indicator (image display). 8.Give an image file path and run the program. 38


39 Block Diagram Output Result : Thus,The program to perform Discrete cosine transform on an image was created. 39

40 EXPERIMENT 6 FILTERING IN FREQUENCY DOMAIN Aim To create a program to eliminate the high frequency components of an image. Apparatus Used A PC with LabVIEW software Vision Toolbox Theory The most basic of filtering operations is called "low-pass". A low-pass filter, also called a "blurring" or "smoothing" filter, averages out rapid changes in intensity. The simplest low-pass filter just calculates the average of a pixel and all of its eight immediate neighbours. The result replaces the original value of the pixel. The process is repeated for every pixel in the image. Procedure 1. Open LabVIEW software in desktop. 2. Create separate editor window and front panel. 3. Right click, select vision motion chooses IMAQ create. Add constant image type (grayscale U8) to it. 4. Select file read and give a control. 5. Choose IMAQ Low pass connect the same. 6. Create an indicator (image display). 7. Give an image file path and run the program. 40

41 Block Diagram Output Result : Thus,the program to eliminate the high frequency components of an image was created. 41
42 EXPERIMENT 7 DISPLAY OF COLOUR IMAGES. 7 (a) Aim To create a color image and perform read and write operation. Apparatus Used A PC with LabVIEW software Vision Toolbox Theory A (digital) color image is a digital image that includes color information for each pixel. For visually acceptable results, it is necessary (and almost sufficient) to provide three samples (color channels) for each pixel, which are interpreted as coordinates in some color space. The RGB color space is commonly used in computer displays, but other spaces such as YCbCr, HSV, and are often used in other contexts. A color image has three values (or channels) per pixel and they measure the intensity and chrominance of light. The actual information stored in the digital image data is the brightness information in each spectral band. Procedure 1. Open LabVIEW from desktop. 2. Create a separate editor window and front panel. 3. Go to file, right click and choose IMAQ. Create and choose image type as RGB (color image) 4. Create control by choosing read image (IMAQ Read) and specifying the file path (from which the image is to be acquired). 5. Similarly, create control for writing by choosing write image (IMAQ Write). 6. Create an indicator image for display to the front panel and join. 42

43 Block Diagram 43
 was created.")
44 Output Result: Thus, the program to performed read and write operation on it a color image (RGB) was created. 44
45 7 (b) Aim To create a vision program to convert a 2D array into a color image. Apparatus Used A PC with LabVIEW software Vision Toolbox Theory An array is a container object that holds a fixed number of values of a single type. The length of an array is established when the array is created. After creation, its length is fixed. The Image block displays the data in array as an image. Each element of array specifies the color for 1 pixel of the image. The resulting image is an m-by-n grid of pixels where m is the number of columns and n is the number of rows in C. The row and column indices of the elements determine the centers of the corresponding pixels. Procedure 1. Open LabVIEW from desktop. 2. Create a separate editor window and front panel. 3. Right click, select vision and motion, choose IMAQ create. Add a constant and control image to it. 4. Create an array to colour image block (by adding it) and set image pixel (U32) as it s parameter. 5. Add an indicator image at the end to check the Output. Run the program. 6. Input values into the array and check the Output. 45

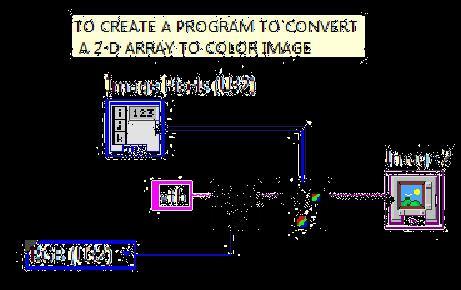
46 Block Diagram 46

47 Output Result : Thus,the program to convert a 2D array into a colour image using Vision tool was created. 47

48 7 (c) Aim To create a vision program to convert colour images into an array of numbers. Apparatus Used A PC with Lab VIEW software Vision Toolbox Theory A digital image is nothing more than data numbers indicating variations of red, green, and blue at a particular location on a grid of pixels. Most of the time, we view these pixels as miniature rectangles sandwiched together on a computer screen. With a little creative thinking and some lower level manipulation of pixels with code, however, we can display that information in a myriad of ways. This tutorial is dedicated to breaking out of simple shape drawing in Processing and using images (and their pixels) as the building blocks of Processing graphics. Procedure 1. Open LabVIEW from desktop. 2. Create a separate editor window and front panel. 3. Right click, select vision and motion >> choose IMAQ create. Add a constant and image to it. 4. Add a file path and specify the path of the image (at the particular storage location) which is to be processed. 5. Add a colour image to array block to obtain values into array. 6. Add an indicator at the end to check for the image pixels at the Output. 7. The Output will be obtained in the front panel in the image pixel indicator (set to U32). Block Diagram 48

49 Output Result : Thus, we created a vision program to convert colour image into an array of numbers 49
50 EXPERIMENT 8 CONVERSION BETWEEN COLOUR SPACES. Aim: To obtain the R, B, G colour values and resolved colour values from a colour box by choosing any colour. Apparatus Used A PC with LabVIEW software Vision Toolbox Theory The RGB colour model is an additive colour model in which red, green and blue light are added together in various ways to reproduce a broad array of colours. The name of the model comes from the initials of the three additive primary colours, red, green and blue. The main purpose of the RGB colour model is for the sensing, representation and display of images in electronic systems, such as televisions and computers, though it has also been used in conventional photography. Before the electronic age, the RGB colour model already had a solid theory behind it, based in human perception of colours. Procedure 1. Open LabVIEW from desktop. 2. Create a separate editor window and front panel. 3. Select Vision and Motion >> Vision Utilities >> Image Management >> IMAQ Create. 4. Select colour utilities >> Select RGB to colour and place it. 5. Give values for red, blue and green. 6. Select colour utilities >> Select colour to RGB. 7. Give values to colour box. 8. Run the program. 50

51 Block Diagram 51

52 Output Result : Thus, we obtained the RGB colour values and resolved colour values from a colour box by choosing any colour. 52
53 EXPERIMENT 9 DWT OF IMAGES Aim To create a program performs discrete wavelet transform on image. Apparatus Used A PC with LabVIEW software Vision Toolbox Theory A discrete wavelet transform (DWT) is any wavelet transform for which the wavelets are discretely sampled. As with other wavelet transforms, a key advantage it has over Fourier transforms is temporal resolution: it captures both frequency and location information (location in time). Procedure 1.OpenLabVIEW software in desktop. 2.Create separate editor window and front panel. 3.Right click, select vision motion choose IMAQ create. Add constant image type (grayscale U8) to it. 4.Select file read and give a control. 5.Choose IMAQ extract wavelet band and connect the same. 6.Choose 4 blocks of IMAQ create and place them. Select grayscale(sgl) as image type for all of them and give name. 7.Choose 4 blocks of IMAQ array to image and place them. Connect them to image display. 8.Connect the Output of extract wavelet band to the four block of array to image. 9.Give an image file path and run the program. 53

54 Block Diagram 54

55 Output Result : Thus, Discrete wavelet transform was performed on the image and the Output was verified. 55
56 EXPERIMENT 10 SEGMENTATION USING WATERSHED TRANSFORM Aim To create a program for segmentation of an image using watershed transforms. Apparatus Used A PC with LabVIEW software Vision Toolbox Theory In the study of image processing a watershed of a grayscale image is analogous to the notion of a catchment basin of a height map. In short, a drop of water following the gradient of an image flows along a path to finally reach a local minimum. Intuitively, the watershed of a relief corresponds to the limits of the adjacent catchment basins of the drops of water. There are different technical definitions of a watershed. In graphs, watershed lines may be defined on the nodes, on the edges, or hybrid lines on both nodes and edges. Watersheds may also be defined in the continuous domain. There are also many different algorithms to compute watersheds. Watershed algorithm is used in image processing primarily for segmentation purposes. Procedure 1. Open LabVIEW software in desktop. 2. Create separate editor window and front panel. 3. Right click, select vision motion chooses IMAQ create. Add constant image type (grayscale U8) to it. 4. Select file read and give a control. 5. Choose IMAQ Watershed Transform connect the same. 6. Create an indicator (image display). 7. Give an image file path and run the program. 56

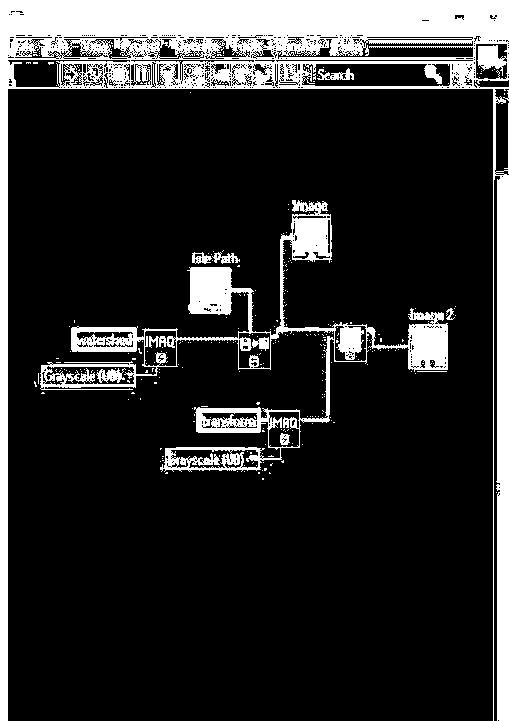
57 Block Diagram 57

58 Output Result: Thus, watershed transformation was performed on the image and the Output was verified. 58
Teaching Scheme. Credits Assigned (hrs/week) Theory Practical Tutorial Theory Oral & Tutorial Total
 Theory Practical Tutorial Theory Oral & Tutorial Total") Code ITC7051 Name Processing Teaching Scheme Credits Assigned (hrs/week) Theory Practical Tutorial Theory Oral & Tutorial Total Practical 04 02 -- 04 01 -- 05 Code ITC704 Name Wireless Technology Examination
Code ITC7051 Name Processing Teaching Scheme Credits Assigned (hrs/week) Theory Practical Tutorial Theory Oral & Tutorial Total Practical 04 02 -- 04 01 -- 05 Code ITC704 Name Wireless Technology Examination
SECTION I - CHAPTER 2 DIGITAL IMAGING PROCESSING CONCEPTS
 RADT 3463 - COMPUTERIZED IMAGING Section I: Chapter 2 RADT 3463 Computerized Imaging 1 SECTION I - CHAPTER 2 DIGITAL IMAGING PROCESSING CONCEPTS RADT 3463 COMPUTERIZED IMAGING Section I: Chapter 2 RADT
Anna University, Chennai B.E./B.TECH DEGREE EXAMINATION, MAY/JUNE 2013 Seventh Semester
 www.vidyarthiplus.com Anna University, Chennai B.E./B.TECH DEGREE EXAMINATION, MAY/JUNE 2013 Seventh Semester Electronics and Communication Engineering EC 2029 / EC 708 DIGITAL IMAGE PROCESSING (Regulation
The Scientist and Engineer's Guide to Digital Signal Processing By Steven W. Smith, Ph.D.
 The Scientist and Engineer's Guide to Digital Signal Processing By Steven W. Smith, Ph.D. Home The Book by Chapters About the Book Steven W. Smith Blog Contact Book Search Download this chapter in PDF
SRM UNIVERSITY FACULTY OF ENGINEERING AND TECHNOLOGY SCHOOL OF COMPUTING DEPARTMENT OF CSE COURSE PLAN
 SRM UNIVERSITY FACULTY OF ENGINEERING AND TECHNOLOGY SCHOOL OF COMPUTING DEPARTMENT OF CSE COURSE PLAN Course Code : CS0323 Course Title : Digital Image Processing Semester : V Course Time : July Dec 2011
8.2 IMAGE PROCESSING VERSUS IMAGE ANALYSIS Image processing: The collection of routines and
 8.1 INTRODUCTION In this chapter, we will study and discuss some fundamental techniques for image processing and image analysis, with a few examples of routines developed for certain purposes. 8.2 IMAGE
PRACTICAL IMAGE AND VIDEO PROCESSING USING MATLAB
 PRACTICAL IMAGE AND VIDEO PROCESSING USING MATLAB OGE MARQUES Florida Atlantic University *IEEE IEEE PRESS WWILEY A JOHN WILEY & SONS, INC., PUBLICATION CONTENTS LIST OF FIGURES LIST OF TABLES FOREWORD
IMAGE PROCESSING FOR EVERYONE
 IMAGE PROCESSING FOR EVERYONE George C Panayi, Alan C Bovik and Umesh Rajashekar Laboratory for Vision Systems, Department of Electrical and Computer Engineering The University of Texas at Austin, Austin,
SYLLABUS CHAPTER - 2 : INTENSITY TRANSFORMATIONS. Some Basic Intensity Transformation Functions, Histogram Processing.
 Contents i SYLLABUS UNIT - I CHAPTER - 1 : INTRODUCTION TO DIGITAL IMAGE PROCESSING Introduction, Origins of Digital Image Processing, Applications of Digital Image Processing, Fundamental Steps, Components,
NON UNIFORM BACKGROUND REMOVAL FOR PARTICLE ANALYSIS BASED ON MORPHOLOGICAL STRUCTURING ELEMENT:
 IJCE January-June 2012, Volume 4, Number 1 pp. 59 67 NON UNIFORM BACKGROUND REMOVAL FOR PARTICLE ANALYSIS BASED ON MORPHOLOGICAL STRUCTURING ELEMENT: A COMPARATIVE STUDY Prabhdeep Singh1 & A. K. Garg2
Digital Image Processing 3/e
 Laboratory Projects for Digital Image Processing 3/e by Gonzalez and Woods 2008 Prentice Hall Upper Saddle River, NJ 07458 USA www.imageprocessingplace.com The following sample laboratory projects are
Digital Image Processing
 Digital Image Processing Part 2: Image Enhancement Digital Image Processing Course Introduction in the Spatial Domain Lecture AASS Learning Systems Lab, Teknik Room T26 achim.lilienthal@tech.oru.se Course
SRI VENKATESWARA COLLEGE OF ENGINEERING. COURSE DELIVERY PLAN - THEORY Page 1 of 6
 COURSE DELIVERY PLAN - THEORY Page 1 of 6 Department of Electronics and Communication Engineering B.E/B.Tech/M.E/M.Tech : EC Regulation: 2013 PG Specialisation : NA Sub. Code / Sub. Name : IT6005/DIGITAL
Assistant Lecturer Sama S. Samaan
 MP3 Not only does MPEG define how video is compressed, but it also defines a standard for compressing audio. This standard can be used to compress the audio portion of a movie (in which case the MPEG standard
Color and More. Color basics
 Color and More In this lesson, you'll evaluate an image in terms of its overall tonal range (lightness, darkness, and contrast), its overall balance of color, and its overall appearance for areas that
Chapter 17. Shape-Based Operations
 Chapter 17 Shape-Based Operations An shape-based operation identifies or acts on groups of pixels that belong to the same object or image component. We have already seen how components may be identified
ECC419 IMAGE PROCESSING
 ECC419 IMAGE PROCESSING INTRODUCTION Image Processing Image processing is a subclass of signal processing concerned specifically with pictures. Digital Image Processing, process digital images by means
INSTITUTIONEN FÖR SYSTEMTEKNIK LULEÅ TEKNISKA UNIVERSITET
 INSTITUTIONEN FÖR SYSTEMTEKNIK LULEÅ TEKNISKA UNIVERSITET Some color images on this slide Last Lecture 2D filtering frequency domain The magnitude of the 2D DFT gives the amplitudes of the sinusoids and
1.Discuss the frequency domain techniques of image enhancement in detail.
 1.Discuss the frequency domain techniques of image enhancement in detail. Enhancement In Frequency Domain: The frequency domain methods of image enhancement are based on convolution theorem. This is represented
Keywords: Image segmentation, pixels, threshold, histograms, MATLAB
 Volume 6, Issue 3, March 2016 ISSN: 2277 128X International Journal of Advanced Research in Computer Science and Software Engineering Research Paper Available online at: www.ijarcsse.com Analysis of Various
Computers and Imaging
 Computers and Imaging Telecommunications 1 P. Mathys Two Different Methods Vector or object-oriented graphics. Images are generated by mathematical descriptions of line (vector) segments. Bitmap or raster
MATLAB 6.5 Image Processing Toolbox Tutorial
 MATLAB 6.5 Image Processing Toolbox Tutorial The purpose of this tutorial is to gain familiarity with MATLAB s Image Processing Toolbox. This tutorial does not contain all of the functions available in
INSTITUTE OF AERONAUTICAL ENGINEERING Dundigal, Hyderabad
 INSTITUTE OF AERONAUTICAL ENGINEERING Dundigal, Hyderabad - 500 043 ELECTRONICS AND COMMUNICATION ENGINEERING QUESTION BANK Course Title Course Code Class Branch DIGITAL IMAGE PROCESSING A70436 IV B. Tech.
IMAGE PROCESSING: AREA OPERATIONS (FILTERING)
") IMAGE PROCESSING: AREA OPERATIONS (FILTERING) N. C. State University CSC557 Multimedia Computing and Networking Fall 2001 Lecture # 13 IMAGE PROCESSING: AREA OPERATIONS (FILTERING) N. C. State University
IMAGE PROCESSING: AREA OPERATIONS (FILTERING) N. C. State University CSC557 Multimedia Computing and Networking Fall 2001 Lecture # 13 IMAGE PROCESSING: AREA OPERATIONS (FILTERING) N. C. State University
Digital Image Processing
 Digital Image Processing Lecture # 5 Image Enhancement in Spatial Domain- I ALI JAVED Lecturer SOFTWARE ENGINEERING DEPARTMENT U.E.T TAXILA Email:: ali.javed@uettaxila.edu.pk Office Room #:: 7 Presentation
Image Forgery. Forgery Detection Using Wavelets
 Image Forgery Forgery Detection Using Wavelets Introduction Let's start with a little quiz... Let's start with a little quiz... Can you spot the forgery the below image? Let's start with a little quiz...
CoE4TN4 Image Processing. Chapter 3: Intensity Transformation and Spatial Filtering
 CoE4TN4 Image Processing Chapter 3: Intensity Transformation and Spatial Filtering Image Enhancement Enhancement techniques: to process an image so that the result is more suitable than the original image
IMAGE ENHANCEMENT IN SPATIAL DOMAIN
 A First Course in Machine Vision IMAGE ENHANCEMENT IN SPATIAL DOMAIN By: Ehsan Khoramshahi Definitions The principal objective of enhancement is to process an image so that the result is more suitable
BASIC OPERATIONS IN IMAGE PROCESSING USING MATLAB
 BASIC OPERATIONS IN IMAGE PROCESSING USING MATLAB Er.Amritpal Kaur 1,Nirajpal Kaur 2 1,2 Assistant Professor,Guru Nanak Dev University, Regional Campus, Gurdaspur Abstract: - This paper aims at basic image
Digital Image Processing. Lecture # 3 Image Enhancement
 Digital Image Processing Lecture # 3 Image Enhancement 1 Image Enhancement Image Enhancement 3 Image Enhancement 4 Image Enhancement Process an image so that the result is more suitable than the original
Objectives. Abstract. This PRO Lesson will examine the Fast Fourier Transformation (FFT) as follows:
 as follows:") : FFT Fast Fourier Transform This PRO Lesson details hardware and software setup of the BSL PRO software to examine the Fast Fourier Transform. All data collection and analysis is done via the BIOPAC MP35
: FFT Fast Fourier Transform This PRO Lesson details hardware and software setup of the BSL PRO software to examine the Fast Fourier Transform. All data collection and analysis is done via the BIOPAC MP35
APPLICATION OF COMPUTER VISION FOR DETERMINATION OF SYMMETRICAL OBJECT POSITION IN THREE DIMENSIONAL SPACE
 APPLICATION OF COMPUTER VISION FOR DETERMINATION OF SYMMETRICAL OBJECT POSITION IN THREE DIMENSIONAL SPACE Najirah Umar 1 1 Jurusan Teknik Informatika, STMIK Handayani Makassar Email : najirah_stmikh@yahoo.com
IMAQ. IMAQ Vision for LabVIEW User Manual. IMAQ Vision for LabVIEW User Manual. August 2004 Edition Part Number A-01
 TM IMAQ TM IMAQ Vision for LabVIEW User Manual IMAQ Vision for LabVIEW User Manual August 2004 Edition Part Number 371007A-01 Support Worldwide Technical Support and Product Information ni.com National
TDI2131 Digital Image Processing
 TDI2131 Digital Image Processing Image Enhancement in Spatial Domain Lecture 3 John See Faculty of Information Technology Multimedia University Some portions of content adapted from Zhu Liu, AT&T Labs.
Lossy and Lossless Compression using Various Algorithms
 Available Online at www.ijcsmc.com International Journal of Computer Science and Mobile Computing A Monthly Journal of Computer Science and Information Technology ISSN 2320 088X IMPACT FACTOR: 6.017 IJCSMC,
FACULTY OF ENGINEERING AND TECHNOLOGY
 FACULTY OF ENGINEERING AND TECHNOLOGY SCHOOL OF COMPUTING DEPARTMENT OF CSE COURSE PLAN Course Code : CS0323 (Elective) Course Title : DIGITAL IMAGE PROCESSING Semester : V Course Time : JULY 2014 DEC
Image Filtering Josef Pelikán & Alexander Wilkie CGG MFF UK Praha
 Image Filtering 1995-216 Josef Pelikán & Alexander Wilkie CGG MFF UK Praha pepca@cgg.mff.cuni.cz http://cgg.mff.cuni.cz/~pepca/ 1 / 32 Image Histograms Frequency table of individual brightness (and sometimes
LAB MANUAL SUBJECT: IMAGE PROCESSING BE (COMPUTER) SEM VII
 SEM VII") LAB MANUAL SUBJECT: IMAGE PROCESSING BE (COMPUTER) SEM VII IMAGE PROCESSING INDEX CLASS: B.E(COMPUTER) SR. NO SEMESTER:VII TITLE OF THE EXPERIMENT. 1 Point processing in spatial domain a. Negation of an
LAB MANUAL SUBJECT: IMAGE PROCESSING BE (COMPUTER) SEM VII IMAGE PROCESSING INDEX CLASS: B.E(COMPUTER) SR. NO SEMESTER:VII TITLE OF THE EXPERIMENT. 1 Point processing in spatial domain a. Negation of an
Session 1. by Shahid Farid
 Session 1 by Shahid Farid Course introduction What is image and its attributes? Image types Monochrome images Grayscale images Course introduction Color images Color lookup table Image Histogram Shahid
Fourier Transform. Any signal can be expressed as a linear combination of a bunch of sine gratings of different frequency Amplitude Phase
 Fourier Transform Fourier Transform Any signal can be expressed as a linear combination of a bunch of sine gratings of different frequency Amplitude Phase 2 1 3 3 3 1 sin 3 3 1 3 sin 3 1 sin 5 5 1 3 sin
Solution for Image & Video Processing
 Solution for Image & Video Processing December-2015 Index Q.1) a). 2-3 b). 4 (N.A.) c). 4 (N.A.) d). 4 (N.A.) e). 4-5 Q.2) a). 5 to 7 b). 7 (N.A.) Q.3) a). 8-9 b). 9 to 12 Q.4) a). 12-13 b). 13 to 16 Q.5)
The Discrete Fourier Transform. Claudia Feregrino-Uribe, Alicia Morales-Reyes Original material: Dr. René Cumplido
 The Discrete Fourier Transform Claudia Feregrino-Uribe, Alicia Morales-Reyes Original material: Dr. René Cumplido CCC-INAOE Autumn 2015 The Discrete Fourier Transform Fourier analysis is a family of mathematical
Chapter 8. Representing Multimedia Digitally
 Chapter 8 Representing Multimedia Digitally Learning Objectives Explain how RGB color is represented in bytes Explain the difference between bits and binary numbers Change an RGB color by binary addition
PHYC 500: Introduction to LabView. Exercise 9 (v 1.1) Spectral content of waveforms. M.P. Hasselbeck, University of New Mexico
 Spectral content of waveforms. M.P. Hasselbeck, University of New Mexico") PHYC 500: Introduction to LabView M.P. Hasselbeck, University of New Mexico Exercise 9 (v 1.1) Spectral content of waveforms This exercise provides additional experience with the Waveform palette, along
PHYC 500: Introduction to LabView M.P. Hasselbeck, University of New Mexico Exercise 9 (v 1.1) Spectral content of waveforms This exercise provides additional experience with the Waveform palette, along
Image Enhancement using Histogram Equalization and Spatial Filtering
 Image Enhancement using Histogram Equalization and Spatial Filtering Fari Muhammad Abubakar 1 1 Department of Electronics Engineering Tianjin University of Technology and Education (TUTE) Tianjin, P.R.
Image Filtering. Median Filtering
 Image Filtering Image filtering is used to: Remove noise Sharpen contrast Highlight contours Detect edges Other uses? Image filters can be classified as linear or nonlinear. Linear filters are also know
Introduction to computer vision. Image Color Conversion. CIE Chromaticity Diagram and Color Gamut. Color Models
 Introduction to computer vision In general, computer vision covers very wide area of issues concerning understanding of images by computers. It may be considered as a part of artificial intelligence and
MATLAB Image Processing Toolbox
 MATLAB Image Processing Toolbox Copyright: Mathworks 1998. The following is taken from the Matlab Image Processing Toolbox users guide. A complete online manual is availabe in the PDF form (about 5MB).
An Efficient Color Image Segmentation using Edge Detection and Thresholding Methods
 19 An Efficient Color Image Segmentation using Edge Detection and Thresholding Methods T.Arunachalam* Post Graduate Student, P.G. Dept. of Computer Science, Govt Arts College, Melur - 625 106 Email-Arunac682@gmail.com
L2. Image processing in MATLAB
 L2. Image processing in MATLAB 1. Introduction MATLAB environment offers an easy way to prototype applications that are based on complex mathematical computations. This annex presents some basic image
Images and Graphics. 4. Images and Graphics - Copyright Denis Hamelin - Ryerson University
 Images and Graphics Images and Graphics Graphics and images are non-textual information that can be displayed and printed. Graphics (vector graphics) are an assemblage of lines, curves or circles with
Version 6. User Manual OBJECT
 Version 6 User Manual OBJECT 2006 BRUKER OPTIK GmbH, Rudolf-Plank-Str. 27, D-76275 Ettlingen, www.brukeroptics.com All rights reserved. No part of this publication may be reproduced or transmitted in any
Image Smoothening and Sharpening using Frequency Domain Filtering Technique
 Volume 5, Issue 4, April (17) Image Smoothening and Sharpening using Frequency Domain Filtering Technique Swati Dewangan M.Tech. Scholar, Computer Networks, Bhilai Institute of Technology, Durg, India.
Color Image Processing
 Color Image Processing Jesus J. Caban Outline Discuss Assignment #1 Project Proposal Color Perception & Analysis 1 Discuss Assignment #1 Project Proposal Due next Monday, Oct 4th Project proposal Submit
CHAPTER 4 LOCATING THE CENTER OF THE OPTIC DISC AND MACULA
 90 CHAPTER 4 LOCATING THE CENTER OF THE OPTIC DISC AND MACULA The objective in this chapter is to locate the centre and boundary of OD and macula in retinal images. In Diabetic Retinopathy, location of
Detection and Verification of Missing Components in SMD using AOI Techniques
 , pp.13-22 http://dx.doi.org/10.14257/ijcg.2016.7.2.02 Detection and Verification of Missing Components in SMD using AOI Techniques Sharat Chandra Bhardwaj Graphic Era University, India bhardwaj.sharat@gmail.com
Image and Video Processing
 Image and Video Processing () Image Representation Dr. Miles Hansard miles.hansard@qmul.ac.uk Segmentation 2 Today s agenda Digital image representation Sampling Quantization Sub-sampling Pixel interpolation
ME 365 EXPERIMENT 8 FREQUENCY ANALYSIS
 ME 365 EXPERIMENT 8 FREQUENCY ANALYSIS Objectives: There are two goals in this laboratory exercise. The first is to reinforce the Fourier series analysis you have done in the lecture portion of this course.
Introduction to More Advanced Steganography. John Ortiz. Crucial Security Inc. San Antonio
 Introduction to More Advanced Steganography John Ortiz Crucial Security Inc. San Antonio John.Ortiz@Harris.com 210 977-6615 11/17/2011 Advanced Steganography 1 Can YOU See the Difference? Which one of
Computer Graphics Fundamentals
 Computer Graphics Fundamentals Jacek Kęsik, PhD Simple converts Rotations Translations Flips Resizing Geometry Rotation n * 90 degrees other Geometry Rotation n * 90 degrees other Geometry Translations
Unit 1.1: Information representation
 Unit 1.1: Information representation 1.1.1 Different number system A number system is a writing system for expressing numbers, that is, a mathematical notation for representing numbers of a given set,
Digital Image Processing
 Digital Image Processing Digital Imaging Fundamentals Christophoros Nikou cnikou@cs.uoi.gr Images taken from: R. Gonzalez and R. Woods. Digital Image Processing, Prentice Hall, 2008. Digital Image Processing
Performance Evaluation of Edge Detection Techniques for Square Pixel and Hexagon Pixel images
 Performance Evaluation of Edge Detection Techniques for Square Pixel and Hexagon Pixel images Keshav Thakur 1, Er Pooja Gupta 2,Dr.Kuldip Pahwa 3, 1,M.Tech Final Year Student, Deptt. of ECE, MMU Ambala,
Follower Robot Using Android Programming
 545 Follower Robot Using Android Programming 1 Pratiksha C Dhande, 2 Prashant Bhople, 3 Tushar Dorage, 4 Nupur Patil, 5 Sarika Daundkar 1 Assistant Professor, Department of Computer Engg., Savitribai Phule
Digital Image Fundamentals. Digital Image Processing. Human Visual System. Contents. Structure Of The Human Eye (cont.) Structure Of The Human Eye
 Structure Of The Human Eye") Digital Image Processing 2 Digital Image Fundamentals Digital Imaging Fundamentals Christophoros Nikou cnikou@cs.uoi.gr Those who wish to succeed must ask the right preliminary questions Aristotle Images
Digital Image Processing 2 Digital Image Fundamentals Digital Imaging Fundamentals Christophoros Nikou cnikou@cs.uoi.gr Those who wish to succeed must ask the right preliminary questions Aristotle Images
Computer Vision. Howie Choset Introduction to Robotics
 Computer Vision Howie Choset http://www.cs.cmu.edu.edu/~choset Introduction to Robotics http://generalrobotics.org What is vision? What is computer vision? Edge Detection Edge Detection Interest points
Digital Image Fundamentals. Digital Image Processing. Human Visual System. Contents. Structure Of The Human Eye (cont.) Structure Of The Human Eye
 Structure Of The Human Eye") Digital Image Processing 2 Digital Image Fundamentals Digital Imaging Fundamentals Christophoros Nikou cnikou@cs.uoi.gr Images taken from: R. Gonzalez and R. Woods. Digital Image Processing, Prentice Hall,
Digital Image Processing 2 Digital Image Fundamentals Digital Imaging Fundamentals Christophoros Nikou cnikou@cs.uoi.gr Images taken from: R. Gonzalez and R. Woods. Digital Image Processing, Prentice Hall,
Steganography & Steganalysis of Images. Mr C Rafferty Msc Comms Sys Theory 2005
 Steganography & Steganalysis of Images Mr C Rafferty Msc Comms Sys Theory 2005 Definitions Steganography is hiding a message in an image so the manner that the very existence of the message is unknown.
Digital Image Processing
 Digital Image Processing Digital Imaging Fundamentals Christophoros Nikou cnikou@cs.uoi.gr Images taken from: R. Gonzalez and R. Woods. Digital Image Processing, Prentice Hall, 2008. Digital Image Processing
Prof. Vidya Manian Dept. of Electrical and Comptuer Engineering
 Image Processing Intensity Transformations Chapter 3 Prof. Vidya Manian Dept. of Electrical and Comptuer Engineering INEL 5327 ECE, UPRM Intensity Transformations 1 Overview Background Basic intensity
Applying mathematics to digital image processing using a spreadsheet
 Jeff Waldock Applying mathematics to digital image processing using a spreadsheet Jeff Waldock Department of Engineering and Mathematics Sheffield Hallam University j.waldock@shu.ac.uk Introduction When
CSE 166: Image Processing. Overview. What is an image? Representing an image. What is image processing? History. Today
 CSE 166: Image Processing Overview Image Processing CSE 166 Today Course overview Logistics Some mathematics Lectures will be boardwork and slides CSE 166, Fall 2016 2 What is an image? Representing an
Fig Color spectrum seen by passing white light through a prism.
 1. Explain about color fundamentals. Color of an object is determined by the nature of the light reflected from it. When a beam of sunlight passes through a glass prism, the emerging beam of light is not
A New Framework for Color Image Segmentation Using Watershed Algorithm
 A New Framework for Color Image Segmentation Using Watershed Algorithm Ashwin Kumar #1, 1 Department of CSE, VITS, Karimnagar,JNTUH,Hyderabad, AP, INDIA 1 ashwinvrk@gmail.com Abstract Pradeep Kumar 2 2
DSP First Lab 06: Digital Images: A/D and D/A
 DSP First Lab 06: Digital Images: A/D and D/A Pre-Lab and Warm-Up: You should read at least the Pre-Lab and Warm-up sections of this lab assignment and go over all exercises in the Pre-Lab section before
EE482: Digital Signal Processing Applications
 Professor Brendan Morris, SEB 3216, brendan.morris@unlv.edu EE482: Digital Signal Processing Applications Spring 2014 TTh 14:30-15:45 CBC C222 Lecture 15 Image Processing 14/04/15 http://www.ee.unlv.edu/~b1morris/ee482/
OFFSET AND NOISE COMPENSATION
 OFFSET AND NOISE COMPENSATION AO 10V 8.1 Offset and fixed pattern noise reduction Offset variation - shading AO 10V 8.2 Row Noise AO 10V 8.3 Offset compensation Global offset calibration Dark level is
FPGA implementation of DWT for Audio Watermarking Application
 FPGA implementation of DWT for Audio Watermarking Application Naveen.S.Hampannavar 1, Sajeevan Joseph 2, C.B.Bidhul 3, Arunachalam V 4 1, 2, 3 M.Tech VLSI Students, 4 Assistant Professor Selection Grade
Image Enhancement in Spatial Domain
 Image Enhancement in Spatial Domain 2 Image enhancement is a process, rather a preprocessing step, through which an original image is made suitable for a specific application. The application scenarios
Non Linear Image Enhancement
 Non Linear Image Enhancement SAIYAM TAKKAR Jaypee University of information technology, 2013 SIMANDEEP SINGH Jaypee University of information technology, 2013 Abstract An image enhancement algorithm based
DIGITAL IMAGE PROCESSING (COM-3371) Week 2 - January 14, 2002
 Week 2 - January 14, 2002") DIGITAL IMAGE PROCESSING (COM-3371) Week 2 - January 14, 22 Topics: Human eye Visual phenomena Simple image model Image enhancement Point processes Histogram Lookup tables Contrast compression and stretching
DIGITAL IMAGE PROCESSING (COM-3371) Week 2 - January 14, 22 Topics: Human eye Visual phenomena Simple image model Image enhancement Point processes Histogram Lookup tables Contrast compression and stretching
Digital Image Processing
 Digital Image Processing D. Sundararajan Digital Image Processing A Signal Processing and Algorithmic Approach 123 D. Sundararajan Formerly at Concordia University Montreal Canada Additional material to
Filip Malmberg 1TD396 fall 2018 Today s lecture
 Today s lecture Local neighbourhood processing Convolution smoothing an image sharpening an image And more What is it? What is it useful for? How can I compute it? Removing uncorrelated noise from an image
Introduction to Color Theory
 Systems & Biomedical Engineering Department SBE 306B: Computer Systems III (Computer Graphics) Dr. Ayman Eldeib Spring 2018 Introduction to With colors you can set a mood, attract attention, or make a
Digital Image Processing. Lecture # 8 Color Processing
 Digital Image Processing Lecture # 8 Color Processing 1 COLOR IMAGE PROCESSING COLOR IMAGE PROCESSING Color Importance Color is an excellent descriptor Suitable for object Identification and Extraction
Chapter 3 Part 2 Color image processing
 Chapter 3 Part 2 Color image processing Motivation Color fundamentals Color models Pseudocolor image processing Full-color image processing: Component-wise Vector-based Recent and current work Spring 2002
CHAPTER 4 IMPLEMENTATION OF ADALINE IN MATLAB
 52 CHAPTER 4 IMPLEMENTATION OF ADALINE IN MATLAB 4.1 INTRODUCTION The ADALINE is implemented in MATLAB environment running on a PC. One hundred data samples are acquired from a single cycle of load current
DESIGN & DEVELOPMENT OF COLOR MATCHING ALGORITHM FOR IMAGE RETRIEVAL USING HISTOGRAM AND SEGMENTATION TECHNIQUES
 International Journal of Information Technology and Knowledge Management July-December 2011, Volume 4, No. 2, pp. 585-589 DESIGN & DEVELOPMENT OF COLOR MATCHING ALGORITHM FOR IMAGE RETRIEVAL USING HISTOGRAM
Image Processing : Introduction
 Image Processing : Introduction What is an Image? An image is a picture stored in electronic form. An image map is a file containing information that associates different location on a specified image.
Table of contents. Vision industrielle 2002/2003. Local and semi-local smoothing. Linear noise filtering: example. Convolution: introduction
 Table of contents Vision industrielle 2002/2003 Session - Image Processing Département Génie Productique INSA de Lyon Christian Wolf wolf@rfv.insa-lyon.fr Introduction Motivation, human vision, history,
Preparing Remote Sensing Data for Natural Resources Mapping (image enhancement, rectifications )
") Preparing Remote Sensing Data for Natural Resources Mapping (image enhancement, rectifications ) Why is this important What are the major approaches Examples of digital image enhancement Follow up exercises
Preparing Remote Sensing Data for Natural Resources Mapping (image enhancement, rectifications ) Why is this important What are the major approaches Examples of digital image enhancement Follow up exercises
Digital Image Processing. Lecture # 6 Corner Detection & Color Processing
 Digital Image Processing Lecture # 6 Corner Detection & Color Processing 1 Corners Corners (interest points) Unlike edges, corners (patches of pixels surrounding the corner) do not necessarily correspond
PARAMETRIC ANALYSIS OF IMAGE ENHANCEMENT TECHNIQUES
 PARAMETRIC ANALYSIS OF IMAGE ENHANCEMENT TECHNIQUES Ruchika Shukla 1, Sugandha Agarwal 2 1,2 Electronics and Communication Engineering, Amity University, Lucknow (India) ABSTRACT Image processing is one
GE 113 REMOTE SENSING. Topic 7. Image Enhancement
 GE 113 REMOTE SENSING Topic 7. Image Enhancement Lecturer: Engr. Jojene R. Santillan jrsantillan@carsu.edu.ph Division of Geodetic Engineering College of Engineering and Information Technology Caraga State
Lane Detection in Automotive
 Lane Detection in Automotive Contents Introduction... 2 Image Processing... 2 Reading an image... 3 RGB to Gray... 3 Mean and Gaussian filtering... 5 Defining our Region of Interest... 6 BirdsEyeView Transformation...
Guided Image Filtering for Image Enhancement
 International Journal of Research Studies in Science, Engineering and Technology Volume 1, Issue 9, December 2014, PP 134-138 ISSN 2349-4751 (Print) & ISSN 2349-476X (Online) Guided Image Filtering for
2.1. General Purpose Run Length Encoding Relative Encoding Tokanization or Pattern Substitution
 2.1. General Purpose There are many popular general purpose lossless compression techniques, that can be applied to any type of data. 2.1.1. Run Length Encoding Run Length Encoding is a compression technique
Introduction to DSP ECE-S352 Fall Quarter 2000 Matlab Project 1
 Objective: Introduction to DSP ECE-S352 Fall Quarter 2000 Matlab Project 1 This Matlab Project is an extension of the basic correlation theory presented in the course. It shows a practical application
AN ERROR LIMITED AREA EFFICIENT TRUNCATED MULTIPLIER FOR IMAGE COMPRESSION
 AN ERROR LIMITED AREA EFFICIENT TRUNCATED MULTIPLIER FOR IMAGE COMPRESSION K.Mahesh #1, M.Pushpalatha *2 #1 M.Phil.,(Scholar), Padmavani Arts and Science College. *2 Assistant Professor, Padmavani Arts
Frequency Domain Enhancement
 Tutorial Report Frequency Domain Enhancement Page 1 of 21 Frequency Domain Enhancement ESE 558 - DIGITAL IMAGE PROCESSING Tutorial Report Instructor: Murali Subbarao Written by: Tutorial Report Frequency