IMAGE PROCESSING FOR EVERYONE
|
|
|
- Beryl Dennis
- 6 years ago
- Views:
Transcription
1 IMAGE PROCESSING FOR EVERYONE George C Panayi, Alan C Bovik and Umesh Rajashekar Laboratory for Vision Systems, Department of Electrical and Computer Engineering The University of Texas at Austin, Austin, TX USA {panayi, bovik, umesh}@ece.utexas.edu ABSTRACT The techniques of digital image processing have found a myriad of applications in diverse fields of scientific, commerical, and technical endeavor. Image processing education therefore needs to cater to a wide spectrum of people coming from different educational backgrounds. In this paper, we describe tools and techniques that facilitate a gentle introduction to image processing. We present novel LabVIEW-based image processing demonstrations that, when supplemented with web-based class lectures, illustrate the power and beauty of image processing algorithms. 1 Introduction Digital Image Processing (DIP) is a multidisciplinary science that borrows principles from diverse fields such as optics, surface physics, visual psychophysics, computer science and mathematics. The many applications of image processing include: astronomy, ultrasonic imaging, remote sensing, video communications and microscopy, among innumerable others. In this paper, we discuss teaching visualization tools developed for the EE 371R - Digital Image and Video Processing course offered every Fall semester at the University of Texas at Austin. The aim of the course is to make DIP accessible to an audience of fairly mixed backgrounds, using numerous visual examples to supplement the theory with reasonable mathematical simplicity. Though designed for an undergraduate Electrical Engineering curriculum, EE 371R attracts many undergraduate and graduate students from various departments, such as geology, psychology, astronomy, computer science (to name a few) as well as local industry. Image acquisition, image processing theory, and practical applications are introduced from an operational perspective with some exposure to theory. To encourage a web-based educational system, all course material and visualization tools are made available to the students for downloading so that they can experiment with the tools at their leisure. MATLAB based assignments help reinforce the concepts. The "Best Project Award" for the best DIP class project (with a $100 first prize) motivates students to investigate and apply the concepts learned in the course to their respective fields. Beginning this Fall, students will also be provided camcorders and webcams to develop their projects. Introductory material covered in the course includes binary image processing, image analysis, and image enhancement, while the more advanced material covers Hough transforms, edge detection and video processing. Since visualization is invaluable to interpret the concepts, lecturing is accompanied with "in-class" LabVIEW demonstrations to illustrate the concepts being discussed. Section 2 of this paper gives a brief overview of LabVIEW and its basic image processing functions, such as those embodied in the IMAQ Vision modules. In Section 3, we explain some of the visualization modules we have created and we conclude in Section 4. 1
2 2 LabVIEW LabVIEW (Laboratory Virtual Instrument Engineering Workbench) is a graphical programming language used as a powerful and flexible instrumentation and analysis software system in industry and academia. LabVIEW uses a graphical programming language - G to create programs called Virtual Instruments or VI (pronounced vee-eye) in a pictorial form called a block diagram, eliminating a lot of the syntactical details of other programming languages like C and MATLAB that use a text based programming approach. LabVIEW also includes many tools for data acquisition, analysis and display of results. The analysis library contains a multitude of functions in signal generation, signal processing, filtering and statistics. LabVIEW is available for all the major platforms and is easily portable across platforms. Each VI contains 3 parts: 1) The front panel contains the user interface like knobs, push buttons, graphs and many other controls (inputs) and indicators (outputs). Inputs can be fed using the mouse or the keyboard. Fig 1a shows a typical front panel. 2) The block diagram shown in Fig 1b is the VI s source code constructed in G and is the actual executable program. The block diagram has other lower-level VIs and built in functions. The blocks can be connected using wires to indicate the dataflow. Front panel objects have corresponding terminals on the block diagram to allow dataflow from the user to the program and back to the user. 3) Sub-VIs are analogous to subroutines in conventional programming languages. [1] provides an introduction to LabVIEW. [2] provides more information on LabVIEW. In some applications such as image processing, execution speed is critical. LabVIEW is the only graphical programming system with a compiler that generates optimized code with execution speeds comparable to compiled C programs. Thus, LabVIEW has the ability to create stand-alone executable applications, which run at compiled execution speeds. Another advantage of LabVIEW is the fact that it includes built in applications, such as the IMAQ Vision for image processing. IMAQ Vision includes more than 400 imaging functions and interactive imaging windows and utilities for displaying and building imaging systems. IMAQ Vision gave us the opportunity to create examples for all the important functions in image processing, and use them for educational purposes. [3] provides information on IMAQ Vision. 3 Visualization modules The front panel provides an excellent intuitive graphical user interface (GUI) to vary various parameters in the algorithm. These GUIs resemble the controls on many instruments and provide a user-friendly interface (hence the name Virtual Instrument). We have developed a wide range of VI s that can be used in conjunction with class lectures. In this section, we describe few of the LabVIEW VIs that we developed. The reader can download other VI s from: dules/demos.htm. [4] provides detailed information on how the VI s were created. 3.1 Analog to digital conversion Sampling and quantization help to transform the continuous domain image into a digital format. The effects of sampling and quantization can be visualized effectively with the following two VI s. This is a basic concept that must be understood by any practitioner in any field utilizing digital images Quantization The Quantization VI (front panel in Fig 2a) demonstrates the effects that different quantization levels have on images. This VI reads in an 8-bits/pixel image and creates an output image whose number of bit levels is 2
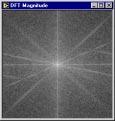
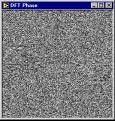
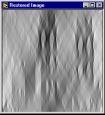
3 specified by the input parameter Number of bits. The user has the options to create images that have 1, 2, 4, or 8 bit levels. Fig 2b shows the effects of quantization Sampling To demonstrate the effects that different sampling rates have on images, we created the Sampling VI whose front panel shown in Fig 3a. While there is a mathematical theory of sampling, the intuitive aspects of sampling can be understood by a diversity of users by visual observation of its effects. This VI reads in an image and sub-samples it to the user-specified size. The user has the option to sub-sample the image to the sizes of 256*256, 128*128, 64*64, and 32*32, using our VI. Fig 3b shows the subsampling of the input image to the specified size. The sub-sampled image is scaled to the size of the input image, by duplicating columns and rows of the sub-sampled image. In this image, we can see the effects that sampling has on images. The effects of sampling become more pronounced when the sampling rate is decreased. Aliasing effects can be demonstrated when severe undersampling occurs. 3.2 Binary Image processing Binary images have only two possible "gray levels" and can be represented using only one bit per pixel. Besides developing VIs for thresholding grayscale images to binary, we also demonstrate the effects of binary morphology. Morphological operations are defined by moving a structuring element over the image to be modified, in such a way that it is centered over every image pixel at some point. When the structuring element is centered over a region of the image, a logical operation is performed on the pixels covered by the structuring element, yielding a binary output. We created the Morphology VI for demonstrating the effects of various morphological operations on binary images. In this VI, we implemented the seven following morphological operations: Median, Dilation, Erosion, Open, Close, Open-Clos, and Clos-Open. The user has the option to test all the above morphological operations on an image, and also to modify the type and size of the structuring element. The Morphology VI allows the following structuring element types: Row, Column, Square, Cross, and X-Shape. 3.3 Histogram and point operations (Grayscale) We developed VIs that perform linear (offset, scaling and full-scale contrast stretch) and non-linear (logarithmic range compression) image point operations. The VI for a linear point operation is shown in Fig 4a. The user has the option to perform the offset and scaling operations or to perform a full scale contrast stretch operation on an input image. The histograms of the input image and the image after the linear point operation are also displayed in the front panel in the Histogram and New Histogram Waveform Graph indicators. Effects of linear point operations on an image are shown in Fig 4b. 3.4 Image analysis (Frequency interpretations) Discrete Fourier Transform (DFT) The Fourier transform is fundamental to image filtering and spectral theory, yet is a difficult concept for many users to correctly grasp. We therefore begin by teaching the concept of digital frequency and digital sinusoidal gratings (2-D sine waves) as the basis functions for the DFT. We have also constructed the FFT (Fast Fourier Transform) demonstration VI that calculates and displays the magnitude and the phase of the DFT for gray level images. The front panel of this VI is shown in Fig 5a Usually, the DFT is displayed with its centered coordinates (u, v) = (0, 0) at the center of the image. This way, the lower frequency information is clustered together near the origin at the centered of the display. The Center/ Uncenter input parameter of the front panel specifies whether the DFT will be displayed 3


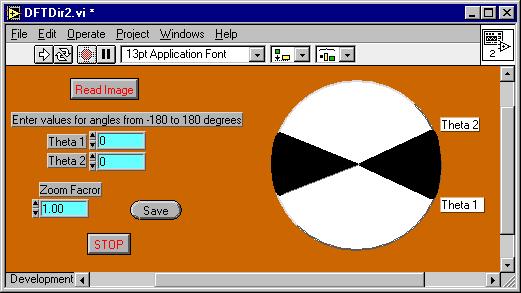
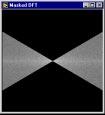
4 with its low frequencies clustered together at the center of the image or not. It is also the case that the low-amplitude frequencies in the magnitude of the DFT will be hard to see, thus it is best to logarithmically compress the DFT magnitude prior to display. An option is given again for displaying the log compressed or uncompressed magnitude of the DFT. This is specified by the Compr/Uncompr input parameter of the front panel. Fig 5b shows an image and the magnitude and phase of the DFT Directional DFTs When the DFT of an image is brighter along a specific orientation, the image contains highly oriented components in that direction. Suppose that we define several oriented zeroone images. Masking the DFT with these images will produce IDFT images with only highly-oriented frequencies remaining. To demonstrate this effect, we implemented the DFT Direction VI. The input parameters, Theta 1 and Theta 2, to this VI, are used as the starting and final angles (in degrees) respectively, of the black region in the mask images as it can be seen from the Circle illustration in the front panel in Fig 6a. Results of DFT masking are shown in Fig 6b. The other VI s developed includes linear and non-linear filtering, image compression schemes and a large number of edge detectors. We have presented the simplest ones here for the purpose of illustration. 4 Conclusions In this paper, we gave an overview of Digital Image Processing education at UT- Austin. We describe the use of powerful visualization tools developed using LabVIEW for image processing. An overview of LabVIEW and a few of the demonstrations developed were provided. 5 References 1. Lisa K. Wells and Jeffrey Travis, "LabVIEW for Everyone, Graphical Programming made even easier," Prentice Hall, ,"Labview User Manual," National Instruments, , "BridgeVIEW and LabVIEW IMAQ Vision for G reference manual," National Instruments, George C Panayi, "Implementation of Digital Image Processing functions using LabVIEW," Master s thesis, UT-Austin Fig 1a: Typical front panel Fig 1b: Block diagram for front panel 4
,")
,")

, Full")
5 Fig 2a: Front panel for Quantization Fig 2b: Original (left), Quantized(right) Fig 3a: Front panel for sampling Fig 3b: Original(left), sampled(middle), interpolated (right) Fig 4a: Front panel for linear point operations Fig 4b: Original(left), Offset and Scaling(middle), Full Scale stretch(right) 5

,")
6 Fig 5a: Front panel for DFT Fig 5b: Original(left), DFT Magnitude(middle), DFT Phase(right) Fig 6a: Front Panel for directional DFT Fig 6b: Original (left), Result of directional DFT(middle), regions selected(right) 6
Teaching Scheme. Credits Assigned (hrs/week) Theory Practical Tutorial Theory Oral & Tutorial Total
 Theory Practical Tutorial Theory Oral & Tutorial Total") Code ITC7051 Name Processing Teaching Scheme Credits Assigned (hrs/week) Theory Practical Tutorial Theory Oral & Tutorial Total Practical 04 02 -- 04 01 -- 05 Code ITC704 Name Wireless Technology Examination
Code ITC7051 Name Processing Teaching Scheme Credits Assigned (hrs/week) Theory Practical Tutorial Theory Oral & Tutorial Total Practical 04 02 -- 04 01 -- 05 Code ITC704 Name Wireless Technology Examination
ME 365 EXPERIMENT 8 FREQUENCY ANALYSIS
 ME 365 EXPERIMENT 8 FREQUENCY ANALYSIS Objectives: There are two goals in this laboratory exercise. The first is to reinforce the Fourier series analysis you have done in the lecture portion of this course.
Laboratory set-up for Real-Time study of Electric Drives with Integrated Interfaces for Test and Measurement
 Laboratory set-up for Real-Time study of Electric Drives with Integrated Interfaces for Test and Measurement Fong Mak, Ram Sundaram, Varun Santhaseelan, and Sunil Tandle Gannon University, mak001@gannon.edu,
VI-Based Introductory Electrical Engineering Laboratory Course*
 Int. J. Engng Ed. Vol. 16, No. 3, pp. 212±217, 2000 0949-149X/91 $3.00+0.00 Printed in Great Britain. # 2000 TEMPUS Publications. VI-Based Introductory Electrical Engineering Laboratory Course* A. BRUCE
PRACTICAL IMAGE AND VIDEO PROCESSING USING MATLAB
 PRACTICAL IMAGE AND VIDEO PROCESSING USING MATLAB OGE MARQUES Florida Atlantic University *IEEE IEEE PRESS WWILEY A JOHN WILEY & SONS, INC., PUBLICATION CONTENTS LIST OF FIGURES LIST OF TABLES FOREWORD
The Fundamentals of Mixed Signal Testing
 The Fundamentals of Mixed Signal Testing Course Information The Fundamentals of Mixed Signal Testing course is designed to provide the foundation of knowledge that is required for testing modern mixed
1. (a) Explain the process of Image acquisition. (b) Discuss different elements used in digital image processing system. [8+8]
![1. (a) Explain the process of Image acquisition. (b) Discuss different elements used in digital image processing system. [8+8]](/thumbs/77/75889541.jpg "1. (a) Explain the process of Image acquisition. (b) Discuss different elements used in digital image processing system. [8+8]") Code No: R05410408 Set No. 1 1. (a) Explain the process of Image acquisition. (b) Discuss different elements used in digital image processing system. [8+8] 2. (a) Find Fourier transform 2 -D sinusoidal
Code No: R05410408 Set No. 1 1. (a) Explain the process of Image acquisition. (b) Discuss different elements used in digital image processing system. [8+8] 2. (a) Find Fourier transform 2 -D sinusoidal
LabVIEW Basics Peter Avitabile,Jeffrey Hodgkins Mechanical Engineering Department University of Massachusetts Lowell
 LabVIEW Basics Peter Avitabile,Jeffrey Hodgkins Mechanical Engineering Department University of Massachusetts Lowell 1 Dr. Peter Avitabile LabVIEW LabVIEW is a data acquisition software package commonly
Image Compression Using SVD ON Labview With Vision Module
 International Journal of Computational Intelligence Research ISSN 0973-1873 Volume 14, Number 1 (2018), pp. 59-68 Research India Publications http://www.ripublication.com Image Compression Using SVD ON
Digital Image Processing
 Digital Image Processing D. Sundararajan Digital Image Processing A Signal Processing and Algorithmic Approach 123 D. Sundararajan Formerly at Concordia University Montreal Canada Additional material to
15EI403J- IMAGE PROCESSING LAB MANUAL
 15EI403J- IMAGE PROCESSING LAB MANUAL Department of Electronics and Instrumentation Engineering Faculty of Engineering and Technology Department of Electronics and Instrumentation Engineering SRM IST,
Lecture # 01. Introduction
 Digital Image Processing Lecture # 01 Introduction Autumn 2012 Agenda Why image processing? Image processing examples Course plan History of imaging Fundamentals of image processing Components of image
Innovative Communications Experiments Using an Integrated Design Laboratory
 Innovative Communications Experiments Using an Integrated Design Laboratory Frank K. Tuffner, John W. Pierre, Robert F. Kubichek University of Wyoming Abstract In traditional undergraduate teaching laboratory
8.2 IMAGE PROCESSING VERSUS IMAGE ANALYSIS Image processing: The collection of routines and
 8.1 INTRODUCTION In this chapter, we will study and discuss some fundamental techniques for image processing and image analysis, with a few examples of routines developed for certain purposes. 8.2 IMAGE
Introduction to Image Analysis with
 Introduction to Image Analysis with PLEASE ENSURE FIJI IS INSTALLED CORRECTLY! WHAT DO WE HOPE TO ACHIEVE? Specifically, the workshop will cover the following topics: 1. Opening images with Bioformats
SECTION I - CHAPTER 2 DIGITAL IMAGING PROCESSING CONCEPTS
 RADT 3463 - COMPUTERIZED IMAGING Section I: Chapter 2 RADT 3463 Computerized Imaging 1 SECTION I - CHAPTER 2 DIGITAL IMAGING PROCESSING CONCEPTS RADT 3463 COMPUTERIZED IMAGING Section I: Chapter 2 RADT
INSTITUTE OF AERONAUTICAL ENGINEERING Dundigal, Hyderabad
 INSTITUTE OF AERONAUTICAL ENGINEERING Dundigal, Hyderabad - 500 043 ELECTRONICS AND COMMUNICATION ENGINEERING QUESTION BANK Course Title Course Code Class Branch DIGITAL IMAGE PROCESSING A70436 IV B. Tech.
Department of Electronic Engineering NED University of Engineering & Technology. LABORATORY WORKBOOK For the Course SIGNALS & SYSTEMS (TC-202)
") Department of Electronic Engineering NED University of Engineering & Technology LABORATORY WORKBOOK For the Course SIGNALS & SYSTEMS (TC-202) Instructor Name: Student Name: Roll Number: Semester: Batch:
Department of Electronic Engineering NED University of Engineering & Technology LABORATORY WORKBOOK For the Course SIGNALS & SYSTEMS (TC-202) Instructor Name: Student Name: Roll Number: Semester: Batch:
The Scientist and Engineer's Guide to Digital Signal Processing By Steven W. Smith, Ph.D.
 The Scientist and Engineer's Guide to Digital Signal Processing By Steven W. Smith, Ph.D. Home The Book by Chapters About the Book Steven W. Smith Blog Contact Book Search Download this chapter in PDF
Image Processing and Particle Analysis for Road Traffic Detection
 Image Processing and Particle Analysis for Road Traffic Detection ABSTRACT Aditya Kamath Manipal Institute of Technology Manipal, India This article presents a system developed using graphic programming
CSE 166: Image Processing. Overview. What is an image? Representing an image. What is image processing? History. Today
 CSE 166: Image Processing Overview Image Processing CSE 166 Today Course overview Logistics Some mathematics Lectures will be boardwork and slides CSE 166, Fall 2016 2 What is an image? Representing an
This content has been downloaded from IOPscience. Please scroll down to see the full text.
 This content has been downloaded from IOPscience. Please scroll down to see the full text. Download details: IP Address: 148.251.232.83 This content was downloaded on 10/07/2018 at 03:39 Please note that
Introduction. Chapter Time-Varying Signals
 Chapter 1 1.1 Time-Varying Signals Time-varying signals are commonly observed in the laboratory as well as many other applied settings. Consider, for example, the voltage level that is present at a specific
from: Point Operations (Single Operands)
") from: http://www.khoral.com/contrib/contrib/dip2001 Point Operations (Single Operands) Histogram Equalization Histogram equalization is as a contrast enhancement technique with the objective to obtain
from: http://www.khoral.com/contrib/contrib/dip2001 Point Operations (Single Operands) Histogram Equalization Histogram equalization is as a contrast enhancement technique with the objective to obtain
Midterm Review. Image Processing CSE 166 Lecture 10
 Midterm Review Image Processing CSE 166 Lecture 10 Topics covered Image acquisition, geometric transformations, and image interpolation Intensity transformations Spatial filtering Fourier transform and
Digital Image Processing. Lecture # 3 Image Enhancement
 Digital Image Processing Lecture # 3 Image Enhancement 1 Image Enhancement Image Enhancement 3 Image Enhancement 4 Image Enhancement Process an image so that the result is more suitable than the original
GENERATION OF SIGNALS USING LABVIEW FOR MAGNETIC COILS WITH POWER AMPLIFIERS
 GENERATION OF SIGNALS USING LABVIEW FOR MAGNETIC COILS WITH POWER AMPLIFIERS Ashmi G V 1, Meena M S 2 1 ER&DCI-IT, Centre for Development of Advanced Computing, Thiruvananthapuram(India) 2 LAMP Group,
Scrabble Board Automatic Detector for Third Party Applications
 Scrabble Board Automatic Detector for Third Party Applications David Hirschberg Computer Science Department University of California, Irvine hirschbd@uci.edu Abstract Abstract Scrabble is a well-known
Development of 4/16-Channel Data Acquisition System Using Lab VIEW
 Development of 4/16-Channel Data Acquisition System Using Lab VIEW Kishori Jadhav 1, Nisha Sarwade 2 1 PG scholar, Electrical department, VJTI, Matunga, 400019 2 Associate professor, Electrical department,
Digital Image Processing
 Digital Image Processing Part 2: Image Enhancement Digital Image Processing Course Introduction in the Spatial Domain Lecture AASS Learning Systems Lab, Teknik Room T26 achim.lilienthal@tech.oru.se Course
ECC419 IMAGE PROCESSING
 ECC419 IMAGE PROCESSING INTRODUCTION Image Processing Image processing is a subclass of signal processing concerned specifically with pictures. Digital Image Processing, process digital images by means
CS4495/6495 Introduction to Computer Vision. 2C-L3 Aliasing
 CS4495/6495 Introduction to Computer Vision 2C-L3 Aliasing Recall: Fourier Pairs (from Szeliski) Fourier Transform Sampling Pairs FT of an impulse train is an impulse train Sampling and Aliasing Sampling
Session 1. by Shahid Farid
 Session 1 by Shahid Farid Course introduction What is image and its attributes? Image types Monochrome images Grayscale images Course introduction Color images Color lookup table Image Histogram Shahid
What is image enhancement? Point operation
 IMAGE ENHANCEMENT 1 What is image enhancement? Image enhancement techniques Point operation 2 What is Image Enhancement? Image enhancement is to process an image so that the result is more suitable than
Image Enhancement in Spatial Domain
 Image Enhancement in Spatial Domain 2 Image enhancement is a process, rather a preprocessing step, through which an original image is made suitable for a specific application. The application scenarios
SYLLABUS CHAPTER - 2 : INTENSITY TRANSFORMATIONS. Some Basic Intensity Transformation Functions, Histogram Processing.
 Contents i SYLLABUS UNIT - I CHAPTER - 1 : INTRODUCTION TO DIGITAL IMAGE PROCESSING Introduction, Origins of Digital Image Processing, Applications of Digital Image Processing, Fundamental Steps, Components,
Laboratory Experiment #1 Introduction to Spectral Analysis
 J.B.Francis College of Engineering Mechanical Engineering Department 22-403 Laboratory Experiment #1 Introduction to Spectral Analysis Introduction The quantification of electrical energy can be accomplished
Digital image processing. Árpád BARSI BME Dept. Photogrammetry and Geoinformatics
 Digital image processing Árpád BARSI BME Dept. Photogrammetry and Geoinformatics barsi.arpad@epito.bme.hu Part 1: (5/12/) Theory of image processing Part 2: (12/12/) Practice with software examples Main
Image processing. Image formation. Brightness images. Pre-digitization image. Subhransu Maji. CMPSCI 670: Computer Vision. September 22, 2016
 Image formation Image processing Subhransu Maji : Computer Vision September 22, 2016 Slides credit: Erik Learned-Miller and others 2 Pre-digitization image What is an image before you digitize it? Continuous
MAV-ID card processing using camera images
 EE 5359 MULTIMEDIA PROCESSING SPRING 2013 PROJECT PROPOSAL MAV-ID card processing using camera images Under guidance of DR K R RAO DEPARTMENT OF ELECTRICAL ENGINEERING UNIVERSITY OF TEXAS AT ARLINGTON
ME 6406 MACHINE VISION. Georgia Institute of Technology
 ME 6406 MACHINE VISION Georgia Institute of Technology Class Information Instructor Professor Kok-Meng Lee MARC 474 Office hours: Tues/Thurs 1:00-2:00 pm kokmeng.lee@me.gatech.edu (404)-894-7402 Class
A Virtual Instrument for Automobiles Fuel Consumption Investigation. Tsvetozar Georgiev
 A Virtual Instrument for Automobiles Fuel Consumption Investigation Tsvetozar Georgiev Abstract: A virtual instrument for investigation of automobiles fuel consumption is presented in this paper. The purpose
Lab VIEW Programming for Vibration Analysis
 IOSR Journal of Mechanical and Civil Engineering (IOSR-JMCE) e-issn: 2278-1684,p-ISSN: 2320-334X PP. 01-05 www.iosrjournals.org Lab VIEW Programming for Vibration Analysis A.K.Desai, A.G.Bharate,V.P.Rane,
ENGINEERING FOR RURAL DEVELOPMENT Jelgava, EDUCATION METHODS OF ANALOGUE TO DIGITAL CONVERTERS TESTING AT FE CULS
 EDUCATION METHODS OF ANALOGUE TO DIGITAL CONVERTERS TESTING AT FE CULS Jakub Svatos, Milan Kriz Czech University of Life Sciences Prague jsvatos@tf.czu.cz, krizm@tf.czu.cz Abstract. Education methods for
INSTITUTIONEN FÖR SYSTEMTEKNIK LULEÅ TEKNISKA UNIVERSITET
 INSTITUTIONEN FÖR SYSTEMTEKNIK LULEÅ TEKNISKA UNIVERSITET Some color images on this slide Last Lecture 2D filtering frequency domain The magnitude of the 2D DFT gives the amplitudes of the sinusoids and
Understanding Digital Signal Processing
 Understanding Digital Signal Processing Richard G. Lyons PRENTICE HALL PTR PRENTICE HALL Professional Technical Reference Upper Saddle River, New Jersey 07458 www.photr,com Contents Preface xi 1 DISCRETE
An Efficient Color Image Segmentation using Edge Detection and Thresholding Methods
 19 An Efficient Color Image Segmentation using Edge Detection and Thresholding Methods T.Arunachalam* Post Graduate Student, P.G. Dept. of Computer Science, Govt Arts College, Melur - 625 106 Email-Arunac682@gmail.com
Anna University, Chennai B.E./B.TECH DEGREE EXAMINATION, MAY/JUNE 2013 Seventh Semester
 www.vidyarthiplus.com Anna University, Chennai B.E./B.TECH DEGREE EXAMINATION, MAY/JUNE 2013 Seventh Semester Electronics and Communication Engineering EC 2029 / EC 708 DIGITAL IMAGE PROCESSING (Regulation
LAB #7: Digital Signal Processing
 LAB #7: Digital Signal Processing Equipment: Pentium PC with NI PCI-MIO-16E-4 data-acquisition board NI BNC 2120 Accessory Box VirtualBench Instrument Library version 2.6 Function Generator (Tektronix
DIGITAL SIGNAL PROCESSING LABORATORY
 DIGITAL SIGNAL PROCESSING LABORATORY SECOND EDITION В. Preetham Kumar CRC Press Taylor & Francis Group Boca Raton London New York CRC Press is an imprint of the Taylor & Francis Croup, an informa business
DIGITAL IMAGE PROCESSING (COM-3371) Week 2 - January 14, 2002
 Week 2 - January 14, 2002") DIGITAL IMAGE PROCESSING (COM-3371) Week 2 - January 14, 22 Topics: Human eye Visual phenomena Simple image model Image enhancement Point processes Histogram Lookup tables Contrast compression and stretching
DIGITAL IMAGE PROCESSING (COM-3371) Week 2 - January 14, 22 Topics: Human eye Visual phenomena Simple image model Image enhancement Point processes Histogram Lookup tables Contrast compression and stretching
Chapter 3 Graphics and Image Data Representations
 Chapter 3 Graphics and Image Data Representations 3.1 Graphics/Image Data Types 3.2 Popular File Formats 3.3 Further Exploration 1 Li & Drew c Prentice Hall 2003 3.1 Graphics/Image Data Types The number
AC : LOW-COST VECTOR SIGNAL ANALYZER FOR COMMUNICATION EXPERIMENTS
 AC 2007-3034: LOW-COST VECTOR SIGNAL ANALYZER FOR COMMUNICATION EXPERIMENTS Frank Tuffner, University of Wyoming FRANK K. TUFFNER received his B.S. degree (2002) and M.S. degree (2004) in EE from the University
Lab 8. Signal Analysis Using Matlab Simulink
 E E 2 7 5 Lab June 30, 2006 Lab 8. Signal Analysis Using Matlab Simulink Introduction The Matlab Simulink software allows you to model digital signals, examine power spectra of digital signals, represent
EE 422G - Signals and Systems Laboratory
 EE 422G - Signals and Systems Laboratory Lab 3 FIR Filters Written by Kevin D. Donohue Department of Electrical and Computer Engineering University of Kentucky Lexington, KY 40506 September 19, 2015 Objectives:
Laboratory Assignment 2 Signal Sampling, Manipulation, and Playback
 Laboratory Assignment 2 Signal Sampling, Manipulation, and Playback PURPOSE This lab will introduce you to the laboratory equipment and the software that allows you to link your computer to the hardware.
Computer Assisted Image Analysis 1 GW 1, Filip Malmberg Centre for Image Analysis Deptartment of Information Technology Uppsala University
 Computer Assisted Image Analysis 1 GW 1, 2.1-2.4 Filip Malmberg Centre for Image Analysis Deptartment of Information Technology Uppsala University 2 Course Overview 9+1 lectures (Filip, Damian) 5 computer
Digital Image Processing 3/e
 Laboratory Projects for Digital Image Processing 3/e by Gonzalez and Woods 2008 Prentice Hall Upper Saddle River, NJ 07458 USA www.imageprocessingplace.com The following sample laboratory projects are
IMAGE PROCESSING: POINT PROCESSES
 IMAGE PROCESSING: POINT PROCESSES N. C. State University CSC557 Multimedia Computing and Networking Fall 2001 Lecture # 11 IMAGE PROCESSING: POINT PROCESSES N. C. State University CSC557 Multimedia Computing
Laser Induced Fluorescence Imaging Of Thermal Damage in Polymer Composites Using LabView and IMAQ Vision
 Session 3659 Laser Induced Fluorescence Imaging Of Thermal Damage in Polymer Composites Using LabView and IMAQ Vision Asad Yousuf, P.E Professor, Electronics Engineering Technology Savannah State University
BIOMEDICAL SIGNAL PROCESSING (BMSP) TOOLS
 TOOLS") BIOMEDICAL SIGNAL PROCESSING (BMSP) TOOLS A Guide that will help you to perform various BMSP functions, for a course in Digital Signal Processing. Pre requisite: Basic knowledge of BMSP tools : Introduction
BIOMEDICAL SIGNAL PROCESSING (BMSP) TOOLS A Guide that will help you to perform various BMSP functions, for a course in Digital Signal Processing. Pre requisite: Basic knowledge of BMSP tools : Introduction
Effective Teaching Learning Process for PID Controller Based on Experimental Setup with LabVIEW
 Effective Teaching Learning Process for PID Controller Based on Experimental Setup with LabVIEW Komal Sampatrao Patil & D.R.Patil Electrical Department, Walchand college of Engineering, Sangli E-mail :
Image acquisition. Midterm Review. Digitization, line of image. Digitization, whole image. Geometric transformations. Interpolation 10/26/2016
 Image acquisition Midterm Review Image Processing CSE 166 Lecture 10 2 Digitization, line of image Digitization, whole image 3 4 Geometric transformations Interpolation CSE 166 Transpose these matrices
Advanced Digital Signal Processing Part 2: Digital Processing of Continuous-Time Signals
 Advanced Digital Signal Processing Part 2: Digital Processing of Continuous-Time Signals Gerhard Schmidt Christian-Albrechts-Universität zu Kiel Faculty of Engineering Institute of Electrical Engineering
Table of contents. Vision industrielle 2002/2003. Local and semi-local smoothing. Linear noise filtering: example. Convolution: introduction
 Table of contents Vision industrielle 2002/2003 Session - Image Processing Département Génie Productique INSA de Lyon Christian Wolf wolf@rfv.insa-lyon.fr Introduction Motivation, human vision, history,
ANALYSIS OF IMAGE ENHANCEMENT TECHNIQUES USING MATLAB
 ANALYSIS OF IMAGE ENHANCEMENT TECHNIQUES USING MATLAB Abstract Ms. Jyoti kumari Asst. Professor, Department of Computer Science, Acharya Institute of Graduate Studies, jyothikumari@acharya.ac.in This study
Using Signal Express to Automate Analog Electronics Experiments
 Session 3247 Using Signal Express to Automate Analog Electronics Experiments B.D. Brannaka, J. R. Porter Engineering Technology and Industrial Distribution Texas A&M University, College Station, TX 77843
EEE 309 Communication Theory
 EEE 309 Communication Theory Semester: January 2016 Dr. Md. Farhad Hossain Associate Professor Department of EEE, BUET Email: mfarhadhossain@eee.buet.ac.bd Office: ECE 331, ECE Building Part 05 Pulse Code
Introduction to DSP ECE-S352 Fall Quarter 2000 Matlab Project 1
 Objective: Introduction to DSP ECE-S352 Fall Quarter 2000 Matlab Project 1 This Matlab Project is an extension of the basic correlation theory presented in the course. It shows a practical application
Digital Image Processing
 Digital Image Processing Lecture # 5 Image Enhancement in Spatial Domain- I ALI JAVED Lecturer SOFTWARE ENGINEERING DEPARTMENT U.E.T TAXILA Email:: ali.javed@uettaxila.edu.pk Office Room #:: 7 Presentation
Fourier Theory & Practice, Part I: Theory (HP Product Note )
") Fourier Theory & Practice, Part I: Theory (HP Product Note 54600-4) By: Robert Witte Hewlett-Packard Co. Introduction: This product note provides a brief review of Fourier theory, especially the unique
Fourier Theory & Practice, Part I: Theory (HP Product Note 54600-4) By: Robert Witte Hewlett-Packard Co. Introduction: This product note provides a brief review of Fourier theory, especially the unique
Frequency Domain Representation of Signals
 Frequency Domain Representation of Signals The Discrete Fourier Transform (DFT) of a sampled time domain waveform x n x 0, x 1,..., x 1 is a set of Fourier Coefficients whose samples are 1 n0 X k X0, X
Nonuniform multi level crossing for signal reconstruction
 6 Nonuniform multi level crossing for signal reconstruction 6.1 Introduction In recent years, there has been considerable interest in level crossing algorithms for sampling continuous time signals. Driven
IMAGE ENHANCEMENT IN SPATIAL DOMAIN
 A First Course in Machine Vision IMAGE ENHANCEMENT IN SPATIAL DOMAIN By: Ehsan Khoramshahi Definitions The principal objective of enhancement is to process an image so that the result is more suitable
Coming to Grips with the Frequency Domain
 XPLANATION: FPGA 101 Coming to Grips with the Frequency Domain by Adam P. Taylor Chief Engineer e2v aptaylor@theiet.org 48 Xcell Journal Second Quarter 2015 The ability to work within the frequency domain
Version 6. User Manual OBJECT
 Version 6 User Manual OBJECT 2006 BRUKER OPTIK GmbH, Rudolf-Plank-Str. 27, D-76275 Ettlingen, www.brukeroptics.com All rights reserved. No part of this publication may be reproduced or transmitted in any
Computing for Engineers in Python
 Computing for Engineers in Python Lecture 10: Signal (Image) Processing Autumn 2011-12 Some slides incorporated from Benny Chor s course 1 Lecture 9: Highlights Sorting, searching and time complexity Preprocessing
LAB II. INTRODUCTION TO LABVIEW
 1. OBJECTIVE LAB II. INTRODUCTION TO LABVIEW In this lab, you are to gain a basic understanding of how LabView operates the lab equipment remotely. 2. OVERVIEW In the procedure of this lab, you will build
Qäf) Newnes f-s^j^s. Digital Signal Processing. A Practical Guide for Engineers and Scientists. by Steven W. Smith
 Newnes f-s^j^s. Digital Signal Processing. A Practical Guide for Engineers and Scientists. by Steven W. Smith") Digital Signal Processing A Practical Guide for Engineers and Scientists by Steven W. Smith Qäf) Newnes f-s^j^s / *" ^"P"'" of Elsevier Amsterdam Boston Heidelberg London New York Oxford Paris San Diego
Digital Signal Processing A Practical Guide for Engineers and Scientists by Steven W. Smith Qäf) Newnes f-s^j^s / *" ^"P"'" of Elsevier Amsterdam Boston Heidelberg London New York Oxford Paris San Diego
KEYWORDS Cell Segmentation, Image Segmentation, Axons, Image Processing, Adaptive Thresholding, Watershed, Matlab, Morphological
 Automated Axon Counting via Digital Image Processing Techniques in Matlab Joshua Aylsworth Department of Electrical Engineering and Computer Science, Case Western Reserve University, Cleveland, OH Email:
DIGITAL SIGNAL PROCESSING TOOLS VERSION 4.0
 (Digital Signal Processing Tools) Indian Institute of Technology Roorkee, Roorkee DIGITAL SIGNAL PROCESSING TOOLS VERSION 4.0 A Guide that will help you to perform various DSP functions, for a course in
Discrete Fourier Transform (DFT)
") Amplitude Amplitude Discrete Fourier Transform (DFT) DFT transforms the time domain signal samples to the frequency domain components. DFT Signal Spectrum Time Frequency DFT is often used to do frequency
Amplitude Amplitude Discrete Fourier Transform (DFT) DFT transforms the time domain signal samples to the frequency domain components. DFT Signal Spectrum Time Frequency DFT is often used to do frequency
NON UNIFORM BACKGROUND REMOVAL FOR PARTICLE ANALYSIS BASED ON MORPHOLOGICAL STRUCTURING ELEMENT:
 IJCE January-June 2012, Volume 4, Number 1 pp. 59 67 NON UNIFORM BACKGROUND REMOVAL FOR PARTICLE ANALYSIS BASED ON MORPHOLOGICAL STRUCTURING ELEMENT: A COMPARATIVE STUDY Prabhdeep Singh1 & A. K. Garg2
Electrical and Telecommunication Engineering Technology NEW YORK CITY COLLEGE OF TECHNOLOGY THE CITY UNIVERSITY OF NEW YORK
 NEW YORK CITY COLLEGE OF TECHNOLOGY THE CITY UNIVERSITY OF NEW YORK DEPARTMENT: Electrical and Telecommunication Engineering Technology SUBJECT CODE AND TITLE: DESCRIPTION: REQUIRED TCET 4202 Advanced
Fundamentals of Multimedia
 Fundamentals of Multimedia Lecture 2 Graphics & Image Data Representation Mahmoud El-Gayyar elgayyar@ci.suez.edu.eg Outline Black & white imags 1 bit images 8-bit gray-level images Image histogram Dithering
Supplementary Software Document for A Fully Automated Microfluidic Femtosecond Laser Axotomy Platform for Nerve Regeneration Studies in C.
 Supplementary Software Document for A Fully Automated Microfluidic Femtosecond Laser Axotomy Platform for Nerve Regeneration Studies in C. elegans Sertan Kutal Gokce, Samuel X. Guo, Navid Ghorashian, W.
PARAMETRIC ANALYSIS OF IMAGE ENHANCEMENT TECHNIQUES
 PARAMETRIC ANALYSIS OF IMAGE ENHANCEMENT TECHNIQUES Ruchika Shukla 1, Sugandha Agarwal 2 1,2 Electronics and Communication Engineering, Amity University, Lucknow (India) ABSTRACT Image processing is one
Digital Filters in 16-QAM Communication. By: Eric Palmgren Fabio Ussher Samuel Whisler Joel Yin
 Digital Filters in 16-QAM Communication By: Eric Palmgren Fabio Ussher Samuel Whisler Joel Yin Digital Filters in 16-QAM Communication By: Eric Palmgren Fabio Ussher Samuel Whisler Joel Yin Online:
Digital Image Processing Question Bank UNIT -I
 Digital Image Processing Question Bank UNIT -I 1) Describe in detail the elements of digital image processing system. & write note on Sampling and Quantization? 2) Write the Hadamard transform matrix Hn
PART I: The questions in Part I refer to the aliasing portion of the procedure as outlined in the lab manual.
 Lab. #1 Signal Processing & Spectral Analysis Name: Date: Section / Group: NOTE: To help you correctly answer many of the following questions, it may be useful to actually run the cases outlined in the
Audio Analyzer R&S UPV. Up to the limits
 44187 FIG 1 The Audio Analyzer R&S UPV shows what is possible today in audio measurements. Audio Analyzer R&S UPV The benchmark in audio analysis High-resolution digital media such as audio DVD place extremely
CHAPTER 4 LOCATING THE CENTER OF THE OPTIC DISC AND MACULA
 90 CHAPTER 4 LOCATING THE CENTER OF THE OPTIC DISC AND MACULA The objective in this chapter is to locate the centre and boundary of OD and macula in retinal images. In Diabetic Retinopathy, location of
Visual Search using Principal Component Analysis
 Visual Search using Principal Component Analysis Project Report Umesh Rajashekar EE381K - Multidimensional Digital Signal Processing FALL 2000 The University of Texas at Austin Abstract The development
IMAGE PROCESSING PAPER PRESENTATION ON IMAGE PROCESSING
 IMAGE PROCESSING PAPER PRESENTATION ON IMAGE PROCESSING PRESENTED BY S PRADEEP K SUNIL KUMAR III BTECH-II SEM, III BTECH-II SEM, C.S.E. C.S.E. pradeep585singana@gmail.com sunilkumar5b9@gmail.com CONTACT:
AC : TECHNOLOGIES TO INTRODUCE EMBEDDED DESIGN EARLY IN ENGINEERING. Shekhar Sharad, National Instruments
 AC 2007-1697: TECHNOLOGIES TO INTRODUCE EMBEDDED DESIGN EARLY IN ENGINEERING Shekhar Sharad, National Instruments American Society for Engineering Education, 2007 Technologies to Introduce Embedded Design
A Study for Choosing The Best Pixel Surveying Method by Using Pixel Decision Structures in Satellite Images
 A Study for Choosing The est Pixel Surveying Method by Using Pixel Decision Structures in Satellite Images Seyyed Emad MUSAVI and Amir AUHAMZEH Key words: pixel processing, pixel surveying, image processing,
Advanced Lab LAB 6: Signal Acquisition & Spectrum Analysis Using VirtualBench DSA Equipment: Objectives:
 Advanced Lab LAB 6: Signal Acquisition & Spectrum Analysis Using VirtualBench DSA Equipment: Pentium PC with National Instruments PCI-MIO-16E-4 data-acquisition board (12-bit resolution; software-controlled
Keywords-Image Enhancement, Image Negation, Histogram Equalization, DWT, BPHE.
 A Novel Approach to Medical & Gray Scale Image Enhancement Prof. Mr. ArjunNichal*, Prof. Mr. PradnyawantKalamkar**, Mr. AmitLokhande***, Ms. VrushaliPatil****, Ms.BhagyashriSalunkhe***** Department of
Digital Imaging Rochester Institute of Technology
 Digital Imaging 1999 Rochester Institute of Technology So Far... camera AgX film processing image AgX photographic film captures image formed by the optical elements (lens). Unfortunately, the processing
ESE 150 Lab 04: The Discrete Fourier Transform (DFT)
") LAB 04 In this lab we will do the following: 1. Use Matlab to perform the Fourier Transform on sampled data in the time domain, converting it to the frequency domain 2. Add two sinewaves together of differing
LAB 04 In this lab we will do the following: 1. Use Matlab to perform the Fourier Transform on sampled data in the time domain, converting it to the frequency domain 2. Add two sinewaves together of differing