|
|
|
- Lynne Fitzgerald
- 5 years ago
- Views:
Transcription
1
2
3
4
5

6

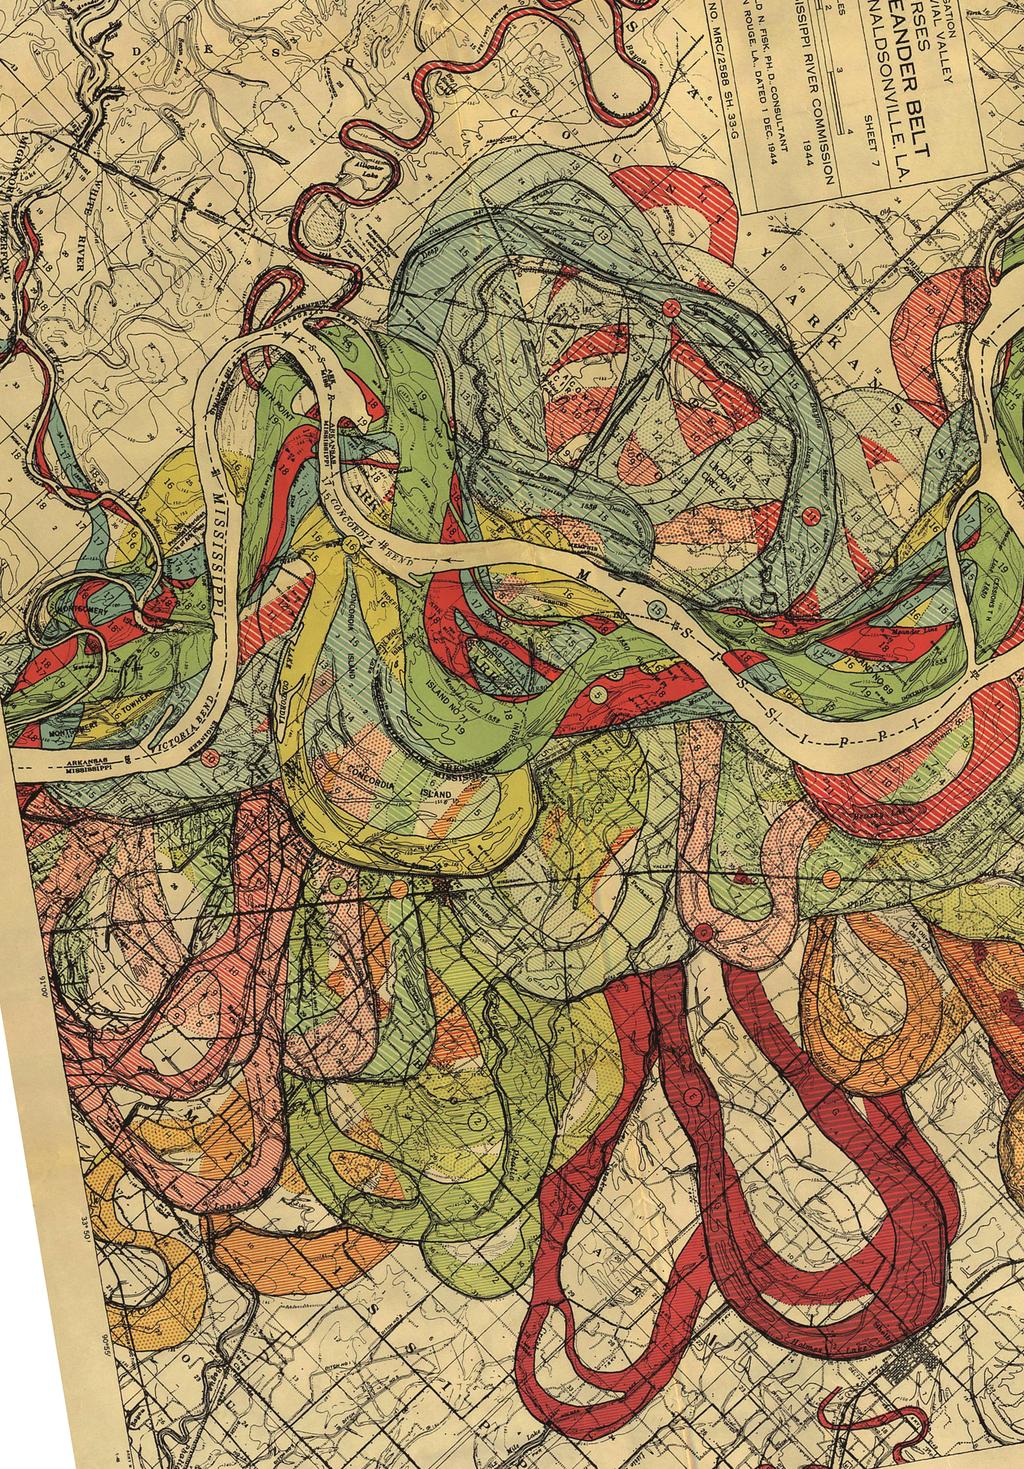
7 Thinking about Color on Maps Color has a huge impact positive or negative on the design of your map. When used well, color vastly extends the effectiveness of your map. When used poorly, it easily draws attention away from your data and your goals for the map. Tufte s idea of graphical excellence and the visual variables provide ways to think about appropriate color choices on your map. Graphical Excellence with Color Above all, do no harm is the adage of Edward Tufte in Envisioning Information. Tufte s color Tufteisms, in part drawing from the work of cartographer Eduard Imhof, serve as a guide to excellence of color use on maps. Graphical excellence is the well-designed presentation of interesting data a matter of substance, of statistics, and of design. Use color with an awareness that adjacent colors perceptually modify each other. Use strong color for important data in small areas against a muted background. Use color redundancy to reduce perceptual color shifts and ambiguity. Use color to distinguish and differentiate features on your map. Use muted color for less important or background data. Use color to distinguish order in quantitative data. Use color to mimic the color of phenomena. Use muted color over large adjacent areas. Use color to engage your map s viewers. Use color palettes found in nature. Ancient Courses, Mississippi River Meander Belt, Cape Girardeau, Missouri, to Donaldsonville, Louisiana, Sheet 7 Sheet 7 of the Ancient Courses of the Mississippi River map series was published in Harold Fisk s Geological Investigation of the Alluvial Valley of the Lower Mississippi River (1944). This spectacular map, expressing engaging data with graphical excellence, reveals changes in the course of the Mississippi River over thousands of years. The map maker differentiates 27 stages of the river. Color (and texture) are used to effectively reveal the tangled knot that is the lower Mississippi. It would be impossible to communicate this complex data without the use of color. 230

8 The choice of colors along with the interesting data engage viewers, making the subject of fluvial geomorphology seem quite fascinating. Data of natural phenomena mapped with natural color palettes are true to the phenomena, visually engaging, and reveal the complexity of the phenomena. The range of earthy, warm hues used on the map evoke the phenomena of ancient river courses. The muted tan background color allows the historical river beds to stand out as the most vital part of this map. Color (as well as texture) is chosen to help distinguish and differentiate the 27 historical river courses. The challenge is in the sheer number of categories and their complex spatial patterns. Because the riverbed data are chronological, color value could have been used to distinguish order. Instead, the choice was to distinguish qualitative differences, as with the use of color on geologic maps. 231
9 Thinking about Color on Maps Visual Variables and Color Particular color visual variables suggest particular characteristics of your data. Color hue suggests qualitative differences, color value ordered, quantitative differences. These guidelines apply to point, line, and area map symbols. qualitative colors (value) Favorite Hotdog Condiment Plurality Opinion, Oregon, 2009 qualitative colors (hue) Favorite Hotdog Condiment Plurality Opinion, Oregon, 2009 Mapping Qualitative Data Ketchup Mustard Relish This value series suggests an order in the data that does not exist Ketchup Mustard Relish Hues suggest no order and reflect actual condiment color binary colors (value) Jacko Is Dead? Plurality Opinion, Oregon, 2009 binary colors (hue) Jacko Is Dead? Plurality Opinion, Oregon, 2009 Mapping Binary Data Yes No This pair of values suggests that Yes opinions are more important than No Yes No Two hues suggest both opinions are important. But are they? 232
10 ordered colors (hue) Fallen, Can Get Up per 1000 population, Oregon, 2009 ordered colors (value) Fallen, Can Get Up per 1000 population, Oregon, 2009 Mapping Ordered Data 78 to 109 This hue series 53 to 68 masks the order in the data 25 to 47 2 to to 109 This value series 53 to 68 reveals the order in the data 25 to 47 2 to 20 Mapping Diverging Ordered Data ordered colors (value) Interested in Worm Rooping Percent Change, Oregon, % to 58% 1% to 25% 0 to -99% 100% to 499% 500% to 1000% This value series does reveal the ordered data, but... ordered colors (value) Interested in Worm Rooping Percent Change, Oregon, % to 58% A diverging value 1% to 25% series reveals the diverging data but 0 to -99% may be confusing. 100% to 499% 500% to 1000% 233
11 Seeing Color on Maps A diversity of factors, some of which the map maker can control, shape how colors on maps are seen. Attention paid to the light source under which a map is viewed, the surface the map is displayed on, and the basics of human color perception help guide the effective choice of colors when making maps. Light Source The colors on a map vary as the light source varies. The same colors will look different when viewing a map Under daylight, incandescent, or fluorescent lighting As the intensity of the light varies On a computer monitor, which emits light thus the colors will be brighter and more saturated than on paper maps When selecting colors for a map, consider the conditions under which your map will be viewed. Low-intensity lighting: use more intense, saturated colors High-intensity lighting: use less intense, less saturated colors Computer monitor: use less intense, less saturated colors Look critically at your map under lighting conditions similar to those of your map s audience, and adjust the colors to suit Look at the colors below. Then move to a darker room and look at the colors again. They change. Choose colors for maps that work under appropriate lighting conditions. Map Surface The colors on a map vary as the surface the map is displayed on varies. The same colors will look different when viewing a map On glossy versus matte-surfaced paper On paper versus projected versus on a computer monitor When selecting colors for a map, consider the effect of the map surface. Glossy paper will make colors more intense and vibrant Matte paper will make colors less intense and dulled Projectors, depending on the intensity of the bulb, may reproduce colors much more or less intense than you expect Computer monitors will make colors intense and vibrant, as the color on computer monitors is emitted rather than reflected (as is the case with paper) Look critically at your map on the medium the map will be presented on, and adjust the colors if necessary 234
12 Color Dimensions Our eyes are sensitive to blue, green, and red wavelengths of energy with overlap so we can sense the entire spectrum (red, orange, yellow, green, blue, indigo, violet). One way to think about how people perceive colors is in terms of three dimensions of color perception: hue, value (lightness), and intensity (saturation, chroma). Hue Hue is the name for our human experience of particular electromagnetic energy wavelengths. Hues are qualitatively different, thus good for showing qualitative data. Purple Yellow Orange Blue Green Red Value Value is the perceived lightness or darkness of a hue. Values are quantitatively different, thus good for showing quantitative data. Dark Darkish Medium Lightish Light Intensity Intensity describes the purity of a hue. Intensity is subtle and good for showing binary (yes, no), qualitative, and quantitative data. Green Green Green Green Green 235
13 Creating Color on Maps The specification and production of colors are often very different from the way in which we see them. Color specification systems are schemes that organize and help produce different colors. There are many different color specification systems, and map makers will encounter many of them. Three major categories of color specification systems are important: predefined color systems, perceptual color systems, and process color systems. Predefined Color Predefined color specification systems are like paint chips from the paint store. Thousands of predefined colors are specified by names or codes. Predefined colors ( spot colors) are used by some commercial printers and are commonly used when mapping data with set color conventions (such as on geology maps). Perceptual Color Perceptual color specification systems, such as Munsell, are based on human perceptual abilities. Perceptual tests have produced a set of colors that the average person can differentiate. Thus, no two colors in the Munsell system look exactly alike. The Munsell system consists of a series of color samples, each a single hue with varying value and intensity. color A1002C color A1015C color A1030C color A2002D color A2015D color A2030D color A3002E color A3015E Value Intensity Hue: Red Predefined colors will be converted to another color system when printing on a computer printer or when using a commercial printer who uses process color. Pantone is a common predefined color system used in mapping. The Munsell system is excellent for selecting appropriate colors for your map, but it will be converted to another system in order to print. Munsell colors are used as the basis of the ColorBrewer site (colorbrewer.org) created by Cindy Brewer and Mark Harrower. The site converts Munsell colors into other color specification systems so you can easily use the colors in most mapping software. 236
14 Process Color: Printing Process color specification systems use three or four colors to create all other colors. Printed colors typically use the subtractive primaries and rely on reflected light. When you combine cyan (C), magenta (M), and yellow (Y), you produce black all light is absorbed (subtracted) from your vision. Thus cyan, magenta, and yellow are the subtractive primaries. Process Color: Monitors Computer monitors also use three colors to create all other colors. Monitor colors typically create color with the additive primaries and rely on emitted light. Because the light is emitted, the colors are more intense. When you combine red (R), green (G), and blue (B), they add up to pure white. Thus red, green, and blue are the additive primaries. Black is added as a fourth color (K, thus CMYK) to avoid the muddy dark brown that is the result of combining cyan, magenta, and yellow. Subtractive primaries are often used by commercial printers and are common on inkjet computer printers. Different amounts of CMY and K produce thousands of other colors. The CMYK color system should be used for most commercially printed maps. The hexidecimal color specifications used in HTML (hypertext markup language) are RGB. The first two digits are red, second two digits green, and third two digits blue. 00 is no color and FF is maximum color. The RGB color system should be used for maps printed with computer printers. RGB will have to be converted into CMYK or predefined color if you plan to print with a commercial printer. 237
15 Complicating Color on Maps The use of color on maps is complex: colors interact with surrounding colors, there are perceptual differences among map viewers, and color has symbolic connotations. Color Interactions The appearance of any color on a map depends on surrounding colors. This optical illusion, called simultaneous contrast, makes the left gray dot (below) look slightly darker than the right gray dot (for most people). Different colors can also look the same, depending on their background. Color subtraction makes the two small squares below look similar. Yet, they are not. If the background of a map has varying colors, check that symbols that are supposed to be the same color look the same everywhere on the map. Carefully consider the visual difference between different colors on your map. If you intend for your map to distinguish specific data from other data, use colors that have a high visual difference. Less visual difference is useful if your goal is to suggest less difference between data. Perceptual Differences The appearance of color on a map varies, depending on the particular eye-brain system looking at it. Older map viewers Benefit from more saturated colors Have particular difficulty in differentiating shades of blue Benefit from increasing the type size a bit Younger map viewers Like brighter, saturated colors but not too saturated Dislike dull, gray, or mixed colors like brown Perform tasks well with maps that use saturated and unsaturated colors Understand quantitative, ordered data shown with color value by age 7 or 8 Color-blind viewers typically see red and green as the same. In the U.S., 3% of females and 8% of males are color-blind. If reds and greens show important differences on your map, a significant number of viewers will not see these differences Consider using reds and blues or greens and blues instead Check internet resources for selecting colorblind safe colors 238
16 for older viewers for older viewers 58+ mph 58+ mph 74+ mph 74+ mph Hurricane Charley s Assault on the Elderly 2004; Percent 65 and older 11.4% 0.025% 58+ mph Hurricane Charley s Assault on the Elderly 2004; Total 65 and older 270, mph for color-blind viewers for color-blind viewers 58+ mph 58+ mph 74+ mph 74+ mph Hurricane Charley s Assault on the Elderly 2004; Percent 65 and older 58+ mph Hurricane Charley s Assault on the Elderly 2004; Percent 65 and older 58+ mph 11.4% 0.025% 11.4% 0.025% 239
17 Complicating Color on Maps Symbolic Color Connotations Color has symbolic connotations. Such connotations subtly shape viewer reactions and should be guided by your goals for your map. Generic Western cultural color connotations include: Blue: water, cool, positive numbers, serenity, purity, depth Green: vegetation, lowlands, forests, youth, spring, nature, peace Red: warm, important, negative numbers, action, anger, danger, power, warning Yellow/tan: dry, lack of vegetation, intermediate elevation, heat Orange: harvest, fall, abundance, fire, attention, action, warning Brown: landforms (mountains, hills), contours, earthy, dirty, warm Purple: dignity, royalty, sorrow, despair, richness, elegant White: purity, clean, faith, illness, life, clarity, absence, light Black: mystery, strength, heaviness, death, nighttime, presence Gray: quiet, reserved, sophisticated, controlled, light, bland, dull Cultural Color Connotations The symbolic connotations of different colors varies from culture to culture, further complicating the use of color on maps. Check for cultural color connotations if you are mapping for a global audience. Blue: safe cross-cultural color, because it is the color of the sky, which stands over all peoples Green: fertility and paganism in Europe, sacred for Muslims, mourning and unhappiness in Asia Red: Bolsheviks, communists, and other politically left organizations, purity in India Yellow/tan: peaceful resistance movement associated with Carazon Aquino in Philippines Orange: pro-western activists in Ukraine, Protestants in Ireland, sacred Hindu color Brown: mourning in India, Nazis in West, ceremonial for Australian Aboriginals Purple: death and crucifixion in Europe, mysticism, prostitution in the Middle East White: unhappiness in India, mourning in China, royalists and traditionalists in Western Black: fascists, anarchists, and other extremists in Western world, death, mourning in West Gray: corporate culture in the West (also blue), dead and dull in Feng Shui color conventions color conventions 240


18 Emotion, Experience, and Color on Maps Color used as mere decoration on maps is an agnostic sin. With a critical eye cast upon the conventions of traditional maps, Margaret Pearce and Michael Hermann designed and produced a narrative map of the travels and experiences of Samuel de Champlain in Canada. Their goal, to design a map expressing the emotions, voices, and multiple experiences of Champlain, his men, and indigenous peoples: interesting data and complex ideas presented with clarity and intelligence. Graphical excellence with color. Color and Experience Different voices and experiences lead to different maps of the same place, issue, or phenomenon, or you can embed them in one map. Pearce and Hermann use color hue (right) to map the multiple voices and experiences in the Champlain narrative. Champlain in blue, indigenous people in green, and the voice of the map maker, from a future time and place, in gray. Color and Emotion Color is emotive: angry red, calm green, depressed gray, happy yellow. Pearce and Hermann use color hue to express shifting emotions from panel to panel on the Champlain map. Below, Champlain learns of an assassination plot against him, and the colors differentiate the different voices and shifting emotions of Champlain and the assassins. 241
19 If we don t want to see the map of Central America covered in a sea of red, eventually lapping at our own borders, we must act now. Ronald Reagan (1986) Fozzie Bear: Kermit, where are we? Kermit the Frog: [looking at a map] Well, let s see. We re just traveling down this little black line here, and uh, just crossed that little red line over here. Fozzie Bear: [takes his eyes off the road to focus on the map] Look, why don t we just take that little blue line, huh? Kermit the Frog: We can t take that. That s a river. Fozzie Bear: Oh. I knew that. Kermit the Frog: Yeah, sure. The Muppet Movie (1976) I do not advance that the face of our country would change if the maps which Philadelphia sends forth all over the Union were more decently colored, but certainly it would indicate that the Graces were more frequently at home on the banks of our lovely rivers, if the engravers were able to sell their maps less boisterously painted and not as they are now, each county of each state in flaming red, bright yellow, or a flagrant orange dye, arrayed like the cover produced by the united efforts of a quilting match. When I once complained of this barbarous offensive coloring of maps, the geographer assured me that he would not sell them unless bedaubed in this way; for, said he, the greatest number of the large maps are not sold for any purpose of utility, but to ornament the walls of barrooms. My agents write continually to me to color high. This reason was given me by one of the first geographers of the United States, who has himself a perfectly correct idea of the tasteful coloring of maps. Francis Lieber, On Hipponomastics: A Letter to Pierce M. Butler, Southern Literary Messenger, 3:5 (1837). Thanks to Penny Richards for this quote. 242
20 More... Cindy Brewer s research on color for maps has been integrated into the very useful colorbrewer.org website. It is a great way to select effective color for maps. A great article on natural color maps is Tom Patterson and Nathaniel Vaughn Kelso s Hal Shelton Revisited: Designing and Producing Natural-Color Maps with Satellite Land Cover Data, available with a bunch of other cool stuff at the shadedrelief.com website. Color Oracle is a very useful free software application that simulates three types of color blindness on your computer screen (colororacle.cartography.ch). Edward Tufte engages color in all of his books, including a whole chapter on Color and Information in Envisioning Information (Graphics Press, 1990). For some solid background on the history and theory of color: John Gage, Color and Culture: Practice and Meaning from Antiquity to Abstraction (University of California Press, 1999) and Color and Meaning: Art, Science, and Symbolism (University of California Press, 2000); and Charles A. Riley II, Color Codes: Modern Theories of Color in Philosophy, Painting and Architecture, Literature, Music, and Psychology (University Press of New England, 1995). Sources: The State College night map was redrawn from the original created in the Deasy GeoGraphics Lab (now the Gould Center) at Penn State. The Ancient Courses, Mississippi River Meander Belt maps are available in digital form from the Lower and Middle Mississippi Valley Engineering Geology Mapping Program (lmvmapping.erdc.usace.army.mil). The idea for the hurricane maps came from a map published in the News & Observer (Raleigh-Durham, NC) on August 19, Excerpts of Pearce and Hermann s map They Would Not Take Me There: People, Places and Stories from Champlain s Travels in Canada, are used by permission. See Margaret Pearce and Michael Hermann, Mapping Champlain s Travels: Restorative Techniques for Historical Cartography Cartographica 45:1, pp The map is available from the Canadian-American Center at the University of Maine ( 243

21
COLOR Cartographic Design & Principles Winter 2016
 COLOR Cartographic Design & Principles Winter 2016 Edward Tufte s Color Tufteisms Graphical excellence is the well-designed presentation of interesting data a matter of substance, of statistics, and of
EnvSci 360 Computer and Analytical Cartography
 EnvSci 360 Computer and Analytical Cartography Lecture 6 Mapping with Color Why Use Color? It is one of the available visual variables you can mix with other graphic elements to improve communication Color
Geography 360 Principles of Cartography. April 24, 2006
 Geography 360 Principles of Cartography April 24, 2006 Outlines 1. Principles of color Color as physical phenomenon Color as physiological phenomenon 2. How is color specified? (color model) Hardware-oriented
CColor Theory in Design
 CColor Theory in Design The Color Wheel The Color Wheel A color circle, based on red, yellow and blue, is traditional in the field of art. Sir Isaac Newton developed the first circular diagram of colors
GRAPHICS TECHNOLOGY II
 GRAPHICS TECHNOLOGY II COLORS ARE PART OF OUR LIFE From the clothes we wear, to the things around us, the food we eat, the things we use- everything. Colors are said to activate the right brain for emotions.
Color Theory: Defining Brown
 Color Theory: Defining Brown Defining Colors Colors can be defined in many different ways. Computer users are often familiar with colors defined as percentages or amounts of red, green, and blue (RGB).
check it out online at
 check it out online at www.belyea.com/svc/all_about_color.pdf Who am I? I got the blues Experience and Emotions through color PASSION JOY Depression HARMONY CREATIVITY PEACE MOURNING It s a bird, it s
COLOR AS A DESIGN ELEMENT
 COLOR COLOR AS A DESIGN ELEMENT Color is one of the most important elements of design. It can evoke action and emotion. It can attract or detract attention. I. COLOR SETS COLOR HARMONY Color Harmony occurs
Color theory Quick guide for graphic artists
 Quick guide for graphic artists We can talk about color using two kinds of terminology: Color generation systems. Color harmony system. Graphic artists and photographers certainly have to understand color
Objective Explain design concepts used to create digital graphics.
 Objective 102.01 Explain design concepts used to create digital graphics. PART 1: ELEMENTS OF DESIGN o Color o Line o Shape o Texture o Watch this video on Fundamentals of Design. 2 COLOR o Helps identify
Chapter Objectives. Color Management. Color Management. Chapter Objectives 1/27/12. Beyond Design
 1/27/12 Copyright 2009 Fairchild Books All rights reserved. No part of this presentation covered by the copyright hereon may be reproduced or used in any form or by any means graphic, electronic, or mechanical,
Adapted from the Slides by Dr. Mike Bailey at Oregon State University
 Colors in Visualization Adapted from the Slides by Dr. Mike Bailey at Oregon State University The often scant benefits derived from coloring data indicate that even putting a good color in a good place
color basics theory & application Fall 2013 Ahmed Ansari Communication Design Fundamentals
 color basics theory & application Fall 2013 Ahmed Ansari Communication Design Fundamentals Presentation 7 Tom Fraser + Adam Banks Designer's Color Manual Johannes Itten The Art of Color Ellen Lupton &
Line. The path created by a point moving through space. i n. Horizontal Line. Thin Line. Thick Line
 Line The path created by a point moving through space. V er Horizontal Line Diagonal Line Zig-Zag Line Wavy Line t i c a l L i n e Spiral Line Thin Line Thick Line Line can help create the illusion of
Art 177 :: Creative Photography. Color & Color Theory
 Art 177 :: Creative Photography Color & Color Theory Color I never met a color I didn t like. Dale Chihuly Color [electromagnetic spectrum] The electromagnetic spectrum is made up of all forms of electromagnetic
Color, Vision, & Perception. Outline
 Color, Vision, & Perception CS 160, Fall 97 Professor James Landay September 24, 1997 9/24/97 1 Outline Administrivia Review Human visual system Color perception Color deficiency Guidelines for design
The Elements of Art: Photography Edition. Directions: Copy the notes in red. The notes in blue are art terms for the back of your handout.
 The Elements of Art: Photography Edition Directions: Copy the notes in red. The notes in blue are art terms for the back of your handout. The elements of art a set of 7 techniques which describe the characteristics
COLOR PLANNING FOR INTERIORS JOSHIMA V.M., UON.
 COLOR PLANNING FOR INTERIORS JOSHIMA V.M., UON. COLOR CONCEPTS & SYSTEMS 1. Additive mixing 2. Subtractive mixing 3. Munsell color system 4. Pantone System 5. Artist s circle 6. Traditional color schemes
Colors in Images & Video
 LECTURE 8 Colors in Images & Video CS 5513 Multimedia Systems Spring 2009 Imran Ihsan Principal Design Consultant OPUSVII www.opuseven.com Faculty of Engineering & Applied Sciences 1. Light and Spectra
Properties of Color. Value: Tint: Shade: Tone: Intensity:
 Seeing Color Color and light are inseparable, without light there would be no color When light passes through a prism a spectrum of colors becomes visible Defining Color Hue The name of a color, such
Colour + Perception. CMPT 467/767 Visualization Torsten Möller. Pfister/Möller
 Colour + Perception CMPT 467/767 Visualization Torsten Möller Recommended Reading http://www.stonesc.com/ 2 Where / What 3 Based on slide from Mazur Contours & Texture C. Ware, Visual Thinking for Design
ONE K CREATIVE. tools for social impact storytelling: color
 tools for social impact storytelling: color THe basics of color application EACH COLOR EVOKES A DIFFERENT EMOTION IN HUMANS; MAKE SURE YOU ARE AWARE OF THE EMOTIONAL RESPONSES TO COLOR, AS WELL AS WHEN
Comp/Phys/Apsc 715. Example Videos. Administrative 1/23/2014. Lecture 5: Trichromacy, Color Spaces, Properties of Color
 Comp/Phys/Apsc 715 Lecture 5: Trichromacy, Color Spaces, Properties of Color 1 Example Videos Segmentation and visualization of neurons Astro Visualization (the Millennium Run) Dragonfly Flight Analysis
Color and Color Model. Chap. 12 Intro. to Computer Graphics, Spring 2009, Y. G. Shin
 Color and Color Model Chap. 12 Intro. to Computer Graphics, Spring 2009, Y. G. Shin Color Interpretation of color is a psychophysiology problem We could not fully understand the mechanism Physical characteristics
THE SCIENCE OF COLOUR
 THE SCIENCE OF COLOUR Colour can be described as a light wavelength coming from a light source striking the surface of an object which in turns reflects the incoming light from were it is received by the
THE MEANING OF COLOR VISUAL COMMUNICATION III 3D DESIGN PRINCIPLES
 COLOR THE MEANING OF COLOR Color in design is very subjective. What evokes one reaction in one person may evoke a very different reaction in someone else. Sometimes this is due to personal preference,
a color companion for designers of any skill level
 a color companion for designers of any skill level A Shanty Studios Publication 2017 CONTENTS Introduction....4 Color....6 Models...8 Light....10 Temperature....12 Gamuts....14 Red....16 Orange....18 Yellow....20
Figure 1: Energy Distributions for light
 Lecture 4: Colour The physical description of colour Colour vision is a very complicated biological and psychological phenomenon. It can be described in many different ways, including by physics, by subjective
CUT the wheel vertically IN HALF: WARM (right) AND COOL COLORS (left)
 AND COOL COLORS (left)") COLOR CHEAT SHEET! Simons Arts123 The following information has been collected from a number of websites. See: http://www.youtube.com/watch?v=059-0wrjpau Karen Kavet http://www.color-wheel-pro.com/color-schemes.html
COLOR CHEAT SHEET! Simons Arts123 The following information has been collected from a number of websites. See: http://www.youtube.com/watch?v=059-0wrjpau Karen Kavet http://www.color-wheel-pro.com/color-schemes.html
skip chap. 8 for now Chap. 9 Color (continued) Lecture 19 Tuesday, October 26
 Lecture 19 Tuesday, October 26") skip chap. 8 for now Chap. 9 Color (continued) Lecture 19 Tuesday, October 26 Next time: Chapter 10, start reading. Nov. 2: exam review Nov. 4: exam II There are computer problems with clicker registration.
skip chap. 8 for now Chap. 9 Color (continued) Lecture 19 Tuesday, October 26 Next time: Chapter 10, start reading. Nov. 2: exam review Nov. 4: exam II There are computer problems with clicker registration.
The Color Wheel is a visual representation of color theory. It is the color spectrum wrapped onto a circle.
 The Color Wheel is a visual representation of color theory. It is the color spectrum wrapped onto a circle. It creates an orderly progression of color that helps us understand color balance and harmony.
H10: Description of Colour
 page 1 of 7 H10: Description of Colour Appearance of objects and materials Appearance attributes can be split into primary and secondary parts, as shown in Table 1. Table 1: The attributes of the appearance
EECS490: Digital Image Processing. Lecture #12
 Lecture #12 Image Correlation (example) Color basics (Chapter 6) The Chromaticity Diagram Color Images RGB Color Cube Color spaces Pseudocolor Multispectral Imaging White Light A prism splits white light
SISTA 230. Color Theory
 SISTA 230 Color Theory CSS Colors CSS color:red; CSS background-color:blue; 17 valid color keywords CSS Color Keywords aqua black blue fuchsia gray green lime maroon navy olive orange purple red silver
Objec&ve % Explain design concepts used to create digital graphics.
 Objec&ve 102.01 15% Explain design concepts used to create digital graphics. Part 1: Elements of Design q Color q Line q Shape q Texture Color q Helps iden&fy objects in a design. q Creates visual flow
Chapter 4. Incorporating Color Techniques
 Chapter 4 Incorporating Color Techniques Color Modes Photoshop displays and prints images using specific color modes A mode is the amount of color data that can be stored in a given file format 2 Color
the messenger of experience! form! and color! product design!
 the messenger of experience! form! and color! 2.744 product design! the messenger of experience! color! 2.744 product design! but first! a mini quiz!! list 4 steps/levels in a systematic form-giving process!
Using Color in Scientific Visualization
 Using Color in Scientific Visualization Mike Bailey The often scant benefits derived from coloring data indicate that even putting a good color in a good place is a complex matter. Indeed, so difficult
Objec&ve % Explain design concepts used to create digital graphics.
 Objec&ve 102.01 15% Explain design concepts used to create digital graphics. Part 1: Elements of Design q Color q Line q Shape q Texture Color q Helps iden&fy objects in a design. q Creates visual flow
Introduction to Color Theory
 Systems & Biomedical Engineering Department SBE 306B: Computer Systems III (Computer Graphics) Dr. Ayman Eldeib Spring 2018 Introduction to With colors you can set a mood, attract attention, or make a
Color is a property of light.
 Color Theory I Color is a property of light. -Objects have no color of their own, they just reflect a particular wavelength from the color spectrum. (For example a blue object absorbs all of the wavelengths,
Light and Colour. Light as part of the EM spectrum. Light as part of the EM spectrum
 Light and Colour Prof. Grega Bizjak, PhD Laboratory of Lighting and Photometry Faculty of Electrical Engineering University of Ljubljana Light as part of the EM spectrum Visible light can be seen as part
excite the cones in the same way.
 Humans have 3 kinds of cones Color vision Edward H. Adelson 9.35 Trichromacy To specify a light s spectrum requires an infinite set of numbers. Each cone gives a single number (univariance) when stimulated
LECTURE 07 COLORS IN IMAGES & VIDEO
 MULTIMEDIA TECHNOLOGIES LECTURE 07 COLORS IN IMAGES & VIDEO IMRAN IHSAN ASSISTANT PROFESSOR LIGHT AND SPECTRA Visible light is an electromagnetic wave in the 400nm 700 nm range. The eye is basically similar
UBT128X Colour theory
 UBT128X Colour theory Unit reference number: L/507/5481 Level: 3 Guided Learning (GL) hours: 25 Overview This unit is about exploring the concepts and theories of colour. Learners will develop the knowledge
Notes on colour mixing
 INFORMATION SHEET These notes, with the diagrams in colour, can be found on the internet at: http://www.andrewnewland.com/homepage/teaching Notes on colour mixing Andrew Newland T E A C H I N G A R T &
Hue is what makes a color identifiable and different from any other color, e.g. orange, red-orange, red.
 Hue Hue is what makes a color identifiable and different from any other color, e.g. orange, red-orange, red. Hues are determined (and can be measured) by a color's wavelength. There are millions of hues
Basics of Colors in Graphics Denbigh Starkey
 Basics of Colors in Graphics Denbigh Starkey 1. Visible Spectrum 2 2. Additive vs. subtractive color systems, RGB vs. CMY. 3 3. RGB and CMY Color Cubes 4 4. CMYK (Cyan-Magenta-Yellow-Black 6 5. Converting
Additive Color Synthesis
 Color Systems Defining Colors for Digital Image Processing Various models exist that attempt to describe color numerically. An ideal model should be able to record all theoretically visible colors in the
Our Color Vision is Limited
 CHAPTER Our Color Vision is Limited 5 Human color perception has both strengths and limitations. Many of those strengths and limitations are relevant to user interface design: l Our vision is optimized
Value. Value-It is the lightness or darkness of an object, regardless of color. Value is relative to the background color and other items on the page.
 Value Value-It is the lightness or darkness of an object, regardless of color. Value is relative to the background color and other items on the page. Value is created by a light source that shines on an
Colour. Cunliffe & Elliott, Chapter 8 Chapman & Chapman, Digital Multimedia, Chapter 5. Autumn 2016 University of Stirling
 CSCU9N5: Multimedia and HCI 1 Colour What is colour? Human-centric view of colour Computer-centric view of colour Colour models Monitor production of colour Accurate colour reproduction Cunliffe & Elliott,
Computer Graphics Si Lu Fall /27/2016
 Computer Graphics Si Lu Fall 2017 09/27/2016 Announcement Class mailing list https://groups.google.com/d/forum/cs447-fall-2016 2 Demo Time The Making of Hallelujah with Lytro Immerge https://vimeo.com/213266879
DESIGNING FLOWER BEDS with
 DESIGNING FLOWER BEDS with Good flower bed designs incorporate many different features Relative surface feel or look On plants, texture comes from Leaves Twigs Bark Texture also comes from Rocks Pavement
CSE 332/564: Visualization. Fundamentals of Color. Perception of Light Intensity. Computer Science Department Stony Brook University
 Perception of Light Intensity CSE 332/564: Visualization Fundamentals of Color Klaus Mueller Computer Science Department Stony Brook University How Many Intensity Levels Do We Need? Dynamic Intensity Range
CS 565 Computer Vision. Nazar Khan PUCIT Lecture 4: Colour
 CS 565 Computer Vision Nazar Khan PUCIT Lecture 4: Colour Topics to be covered Motivation for Studying Colour Physical Background Biological Background Technical Colour Spaces Motivation Colour science
color & dye chemisty Explore in a scientific way! Learn how and why we see color, and how dye chemically reacts with fabric!
 for ages 12-17 color & dye chemisty Explore in a scientific way! Learn how and why we see color, and how dye chemically reacts with fabric! objectives and materials what is color? types of color how reactive
Terms. Color Hue. Spot color Flood Value Density RGB. Pantone Duotone Hexachrome CMYK Gamut. Toyo/Trumatch
 COLOR! Management A system of: hardware, software & procedures that are calibrated to best insure color accuracy and repeatability throughout the production process Terms Sensation caused by light as it
In order to manage and correct color photos, you need to understand a few
 In This Chapter 1 Understanding Color Getting the essentials of managing color Speaking the language of color Mixing three hues into millions of colors Choosing the right color mode for your image Switching
Choose Paint Colors and Schemes
 Choose Paint Colors and Schemes When you re decorating your home, choosing the right paint colors is the most important decision you ll make. As fun as choosing colors can be, this part of the planning
Applying Colour & Style. Christopher Wesson London Borough of Redbridge
 Applying Colour & Style Christopher Wesson London Borough of Redbridge The components of colour Generally, the colours on our maps are made up of combinations of Red Green Blue from light sources such
Color Reproduction. Chapter 6
 Chapter 6 Color Reproduction Take a digital camera and click a picture of a scene. This is the color reproduction of the original scene. The success of a color reproduction lies in how close the reproduced
Image Processing for Mechatronics Engineering For senior undergraduate students Academic Year 2017/2018, Winter Semester
 Image Processing for Mechatronics Engineering For senior undergraduate students Academic Year 2017/2018, Winter Semester Lecture 8: Color Image Processing 04.11.2017 Dr. Mohammed Abdel-Megeed Salem Media
Multimedia Systems Color Space Mahdi Amiri March 2012 Sharif University of Technology
 Course Presentation Multimedia Systems Color Space Mahdi Amiri March 2012 Sharif University of Technology Physics of Color Light Light or visible light is the portion of electromagnetic radiation that
10.2 Color and Vision
 10.2 Color and Vision The energy of light explains how different colors are physically different. But it doesn't explain how we see colors. How does the human eye see color? The answer explains why computers
Image and video processing (EBU723U) Colour Images. Dr. Yi-Zhe Song
 Colour Images. Dr. Yi-Zhe Song") Image and video processing () Colour Images Dr. Yi-Zhe Song yizhe.song@qmul.ac.uk Today s agenda Colour spaces Colour images PGM/PPM images Today s agenda Colour spaces Colour images PGM/PPM images History
Image and video processing () Colour Images Dr. Yi-Zhe Song yizhe.song@qmul.ac.uk Today s agenda Colour spaces Colour images PGM/PPM images Today s agenda Colour spaces Colour images PGM/PPM images History
Colour. Why/How do we perceive colours? Electromagnetic Spectrum (1: visible is very small part 2: not all colours are present in the rainbow!
 Colour What is colour? Human-centric view of colour Computer-centric view of colour Colour models Monitor production of colour Accurate colour reproduction Colour Lecture (2 lectures)! Richardson, Chapter
The basic tenets of DESIGN can be grouped into three categories: The Practice, The Principles, The Elements
 Vocabulary The basic tenets of DESIGN can be grouped into three categories: The Practice, The Principles, The Elements 1. The Practice: Concept + Composition are ingredients that a designer uses to communicate
Color. Chapter 6. (colour) Digital Multimedia, 2nd edition
 Digital Multimedia, 2nd edition") Color (colour) Chapter 6 Digital Multimedia, 2nd edition What is color? Color is how our eyes perceive different forms of energy. Energy moves in the form of waves. What is a wave? Think of a fat guy (Dr.
Color (colour) Chapter 6 Digital Multimedia, 2nd edition What is color? Color is how our eyes perceive different forms of energy. Energy moves in the form of waves. What is a wave? Think of a fat guy (Dr.
CIE tri-stimulus experiment. Color Value Functions. CIE 1931 Standard. Color. Diagram. Color light intensity for visual color match
 CIE tri-stimulus experiment diffuse reflecting screen diffuse reflecting screen 770 769 768 test light 382 381 380 observer test light 445 535 630 445 535 630 observer light intensity for visual color
LIGHT & COLOR. Thoughts on Color
 LIGHT & COLOR www.physics.ohio-state.edu/~gilmore/images/collection/misc/prism.gif Ball State Architecture ENVIRONMENTAL SYSTEMS 1 Grondzik 1 Thoughts on Color I fly on the breeze of my mind and I pour
Colors in Scientific Visualization. Mike Bailey Oregon State University
 Colors in Scientific Visualization Mike Bailey Oregon State University The often scant benefits derived from coloring data indicate that even putting a good color in a good place is a complex matter. Indeed,
Lecture Color Image Processing. by Shahid Farid
 Lecture Color Image Processing by Shahid Farid What is color? Why colors? How we see objects? Photometry, Radiometry and Colorimetry Color measurement Chromaticity diagram Shahid Farid, PUCIT 2 Color or
Designing Flower Beds with Colors
 Utah State University DigitalCommons@USU All Archived Publications Archived USU Extension Publications 1-1-2005 Designing Flower Beds with Colors Larry A. Sagers Follow this and additional works at: http://digitalcommons.usu.edu/extension_histall
Colour. Electromagnetic Spectrum (1: visible is very small part 2: not all colours are present in the rainbow!) Colour Lecture!
 Colour Lecture!") Colour Lecture! ITNP80: Multimedia 1 Colour What is colour? Human-centric view of colour Computer-centric view of colour Colour models Monitor production of colour Accurate colour reproduction Richardson,
Colour Lecture! ITNP80: Multimedia 1 Colour What is colour? Human-centric view of colour Computer-centric view of colour Colour models Monitor production of colour Accurate colour reproduction Richardson,
COLOR and the human response to light
 COLOR and the human response to light Contents Introduction: The nature of light The physiology of human vision Color Spaces: Linear Artistic View Standard Distances between colors Color in the TV 2 How
Lecture 2: An Introduction to Colour Models
 Lecture 2: An Introduction to Colour Models An important issue in visual media, and multimedia, is colour. Just as there are a multitude of file formats for computer graphics, there are a range of Colour
Reading. Foley, Computer graphics, Chapter 13. Optional. Color. Brian Wandell. Foundations of Vision. Sinauer Associates, Sunderland, MA 1995.
 Reading Foley, Computer graphics, Chapter 13. Color Optional Brian Wandell. Foundations of Vision. Sinauer Associates, Sunderland, MA 1995. Gerald S. Wasserman. Color Vision: An Historical ntroduction.
What influences colour and what does colour influence?
 1 What influences colour and what does colour influence? COLOUR has associations of feelings eg.red: Anger, Passion, power, love etc Green: Freshness, re-birth, life, growth Blue: Tranquility, sadness,
Communicating Color. Courtesy of: X-Rite Inc Street SE Grand Rapids MI (616)
") Communicating Color Courtesy of: X-Rite Inc 4300 44 Street SE Grand Rapids MI (616) 803-2000 What is Color? Color Perception What influences the perception of color? 1. light source 2. object being viewed
Communicating Color Courtesy of: X-Rite Inc 4300 44 Street SE Grand Rapids MI (616) 803-2000 What is Color? Color Perception What influences the perception of color? 1. light source 2. object being viewed
COLOR! You will need to take notes!
 COLOR! You will need to take notes! What is Color? How do we see it? As illustrated in the diagram below, light goes from the source (the sun) to the object (the apple), and finally to the detector (the
Understanding Color Theory Excerpt from Fundamental Photoshop by Adele Droblas Greenberg and Seth Greenberg
 Understanding Color Theory Excerpt from Fundamental Photoshop by Adele Droblas Greenberg and Seth Greenberg Color evokes a mood; it creates contrast and enhances the beauty in an image. It can make a dull
CS 544 Human Abilities
 CS 544 Human Abilities Color Perception and Guidelines for Design Preattentive Processing Acknowledgement: Some of the material in these lectures is based on material prepared for similar courses by Saul
Wright Field Scale Modelers. Color Mixing: Everything you thought you knew about color is wrong.
 Wright Field Scale Modelers Color Mixing: Everything you thought you knew about color is wrong. Sources http://www.huevaluechroma.com/ Written by a color scientist, Dr. Briggs. It is a bit technical. Principles
Test 1: Example #2. Paul Avery PHY 3400 Feb. 15, Note: * indicates the correct answer.
 Test 1: Example #2 Paul Avery PHY 3400 Feb. 15, 1999 Note: * indicates the correct answer. 1. A red shirt illuminated with yellow light will appear (a) orange (b) green (c) blue (d) yellow * (e) red 2.
COLOR. and the human response to light
 COLOR and the human response to light Contents Introduction: The nature of light The physiology of human vision Color Spaces: Linear Artistic View Standard Distances between colors Color in the TV 2 Amazing
Colour Theory Basics. Your guide to understanding colour in our industry
 Colour heory Basics Your guide to understanding colour in our industry Colour heory F.indd 1 Contents Additive Colours... 2 Subtractive Colours... 3 RGB and CMYK... 4 10219 C 10297 C 10327C Pantone PMS
Color Perception and Applications. Penny Rheingans University of Maryland Baltimore County. Overview
 Color Perception and Applications SIGGRAPH 99 Course: Fundamental Issues of Visual Perception for Effective Image Generation Penny Rheingans University of Maryland Baltimore County Overview Characteristics
Visual Communication by Colours in Human Computer Interface
 Buletinul Ştiinţific al Universităţii Politehnica Timişoara Seria Limbi moderne Scientific Bulletin of the Politehnica University of Timişoara Transactions on Modern Languages Vol. 14, No. 1, 2015 Visual
Digital Image Processing COSC 6380/4393. Lecture 20 Oct 25 th, 2018 Pranav Mantini
 Digital Image Processing COSC 6380/4393 Lecture 20 Oct 25 th, 2018 Pranav Mantini What is color? Color is a psychological property of our visual experiences when we look at objects and lights, not a physical
The Principles of Chromatics
 The Principles of Chromatics 03/20/07 2 Light Electromagnetic radiation, that produces a sight perception when being hit directly in the eye The wavelength of visible light is 400-700 nm 1 03/20/07 3 Visible
Colour, Vision & Perception
 Colour, Vision & Perception Colour is a matter of Physics (colour) Physiology (vision) Psychology (perception) Colour is a matter of Physics (colour) Physiology (vision) Psychology (perception) Isaac Newton
Design Elements: Understanding Color
 Design Elements: Understanding Color Chris A. Paschke, CPF, GCF, CMG Lecture Sponsored by Specialty Matboard West Coast Art & Frame Expo, Las Vegas 2018 Color is the most emotional and expressive element
Lecture 3: Grey and Color Image Processing
 I22: Digital Image processing Lecture 3: Grey and Color Image Processing Prof. YingLi Tian Sept. 13, 217 Department of Electrical Engineering The City College of New York The City University of New York
To discuss. Color Science Color Models in image. Computer Graphics 2
 Color To discuss Color Science Color Models in image Computer Graphics 2 Color Science Light & Spectra Light is an electromagnetic wave It s color is characterized by its wavelength Laser consists of single
Avoid These Mistakes When Combining Colors in PowerPoint (Dec 10) by Robert Lane
 by Robert Lane") Avoid These Mistakes When Combining Colors in PowerPoint (Dec 10) by Robert Lane Newer versions of PowerPoint, especially PowerPoint 2010, have marvelous tools for helping even the artistically challenged
Avoid These Mistakes When Combining Colors in PowerPoint (Dec 10) by Robert Lane Newer versions of PowerPoint, especially PowerPoint 2010, have marvelous tools for helping even the artistically challenged
Fig Color spectrum seen by passing white light through a prism.
 1. Explain about color fundamentals. Color of an object is determined by the nature of the light reflected from it. When a beam of sunlight passes through a glass prism, the emerging beam of light is not
Colors in Visualization. By Mike Bailey Oregon State University
 Colors in Visualization By Mike Bailey Oregon State University The often scant benefits derived from coloring data indicate that even putting a good color in a good place is a complex matter. Indeed, so
USE OF COLOR IN REMOTE SENSING
 1 USE OF COLOR IN REMOTE SENSING (David Sandwell, Copyright, 2004) Display of large data sets - Most remote sensing systems create arrays of numbers representing an area on the surface of the Earth. The
Color Theory. Additive Color
 Color Theory A primary color is a color that cannot be made from a combination of any other colors. A secondary color is a color created from a combination of two primary colors. Tertiary color is a combination