operating manual iliad for Windows & Mac OS X software application rc81
|
|
|
- Leona McDaniel
- 5 years ago
- Views:
Transcription

1 operating manual iliad software application rc81 for Windows & Mac OS X
2 Contents 1. About Admesy Iliad software application General introduction Legal notice Installation Starting Iliad Introduction Function and device tree Select and configure device Select modules Measurement example screen Function tree Functions Hera, Rhea, Cronus, Asteria Other functions Device tree Modules Introduction Chromaticity Datalogging Flicker Flicker value Intensity chart Intensity value Optics and units Temperature Sample spectrums Spectrum PAR values Timer Start-up settings Steropes light source control Calibration Spectrometer calibration User spectrum calibration Spectrometer matrix calibration XYZ sensor calibration Colorimeter calibration Light meter calibration Firmware update Introduction Firmware update example (Asteria) Flicker measurement example (Asteria) Delay function Settings (Il)luminance measurement example (Asteria) Settings Reflective measurement example (Hera) Transmissive measurement example (Hera) Pass/fail module
3 3
4 1. About 1.1. Admesy Iliad software application The material in this manual is subject to change. No rights can be derived from the content of this manual. The content of this manual is valid for Iliad version higher or equal than for Windows and Mac OS X. This manual shows examples in Windows. Iliad for Mac OS X has the same layout and menu structure, steps and settings can be changed similar to the Windows version General introduction The Admesy Iliad application is a generic application for almost all Admesy devices. Currently supported devices: Rhea series Hera series Cronus series MSE series Hyperion series Vates series Asteria series Steropes series 1.3. Legal notice The Iliad application is only to be used with Admesy Instruments. No parts may be copied and used in other applications. 4


5 2. Installation The Admesy Iliad software application is distributed via the Admesy website and available for both Windows and OSX. as a ZIP file or provided with your measurement device on USB stick. After unpacking the ZIP file, a readme file guides you through the setup of the VISA drivers and Iliad software. IMPORTANT: Before installation, it is necessary to install the NI-VISA Runtime Engine. Recent versions of Iliad have been tested with NI-VISA 5.4. Your computer may prompt you to reboot your system after the installation. Please save all your documents and close all other applications before starting the installation

6 4 5 6

7 3. Starting Iliad 3.1. Introduction Iliad supports connecting multiple devices at one time. Devices can be added or removed at any time. When starting the software, the user interface will appear different depending on which kind of instrument has been attached. When one or more devices are connected over USB the software shows devices on the left of the screen. 7
8 3.2. Function and device tree On the left two separate areas can be seen, one is a tree device with a function selection, and we call this the function tree. Here you can choose which basic function the device should perform. These functions describe the measure capability of a device. For example; if you have plugged in a spectrometer you can choose measure spectrum or sample spectrum. If you have an Asteria you can choose the sample intensity function with which you can measure flicker. The lower part is the device selection area where you can change settings: This is called the device tree. Here you can change settings of the device like averaging, integration time, autorange, etc. When you select a device it automatically displays all its settings. 8
9 Select and configure device In order to start you measurement you need to select a device in the device tree and you need to select a function. We already select a basic function by default for the first function: The Cronus spectrometer for example, has a default function of measuring spectrum. See example on the left. Other functions such as Sample intensity can be added. In total, up to three functions can be carried out per device at a time.
10 3.4. Select modules Next step is to get the measurement results on the screen. you can do this by selecting modules and choose the appropriate module you want to display on the screen. The appropriate graph pops up and the only thing left is to push the single run button or the continuous-run button. An example screenshot of a measurement example with a Hera-01 is shown on the next page. When starting measurements, please carry out one single measurement to determine if all settings are correct before using the continuous-run mode. Continuous run button Single run button 10

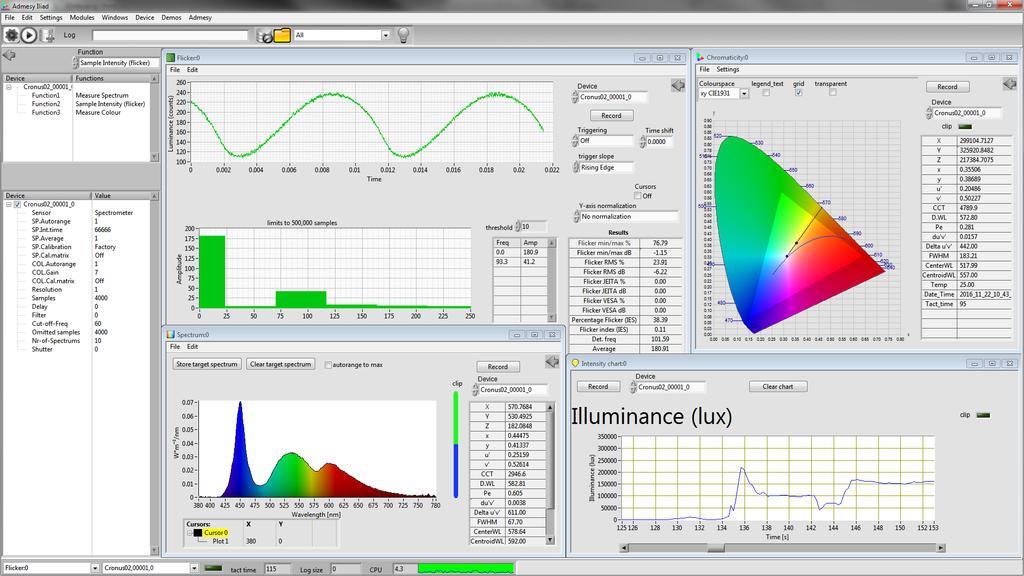
11 3.5. Measurement example screen 11

12 3.6. Function tree A function describes the measurement capability of a device and depends on the device. The function tree allows a maximum of three functions at a time. When the application is running, the measurements are carried out in the sequence of the functions. First function 1, then function 2 and at last function 3. Be aware that not all functions can be used together. First select on a function in the function tree (Function1 / Function2 / Function3) as shown on the top left figure. Then select a function right above the function tree. Depending on the device capabilities you can select different capabilities. The example on the left shows the functions of a Cronus, combined spectrometer and colorimeter. The functions which you can choose from are: Disabled: no function is used Measure intensity: intensity value is measured Measure colour: colour and intensity are measured Measure spectrum: spectral data is obtained Measure reflection: reflection of samples can be measured (in Y, XYZ or spectral depending on device) Measure transmission: transmission of samples can be measured (in Y, XYZ or spectral depending on device) Sample intensity (flicker/response): high speed intensity values are measured and send back as multiple samples with a time stamp - only for colorimeters and light meters Sample colour (flicker/response): high speed XYZ values are measured and send back as multiple samples with a time stamp (colorimeters only) Sample spectrums: spectrums are measured and send back as multiple spectrums with a time stamp 12
13 3.7. Functions Hera, Rhea, Cronus, Asteria The table below shows an overview of the function capabilities of the Hera and Rhea spectrometer series, Cronus spectro-colorimeter and Asteria light meter. Function Hera Rhea Cronus Asteria Measure intensity 3.8. Other functions Iliad operates by selecting the measurement function and shows the Modules that can be used to display the measured data afterwards. Additionally, Iliad contains some demo programs, mostly for display measurement. Measure colour Measure spectrum Measure reflection Measure transmission Sample intensity (flicker) Sample intensity (response) Sample colour (flicker) Sample colour (response) Sample spectrums Note: The Asteria series can only measure reflection and transmission with a spectral response that matches the luminosity function V(λ) and for that reason cannot provide any colour information. 13
14 Device tree In the device tree shown at the bottom of the picture on the left, you can change the settings of the device like for example autoranging, integration time, averaging, etc. A precise description of the settings can be found in the operating manual of the device. The example on the left shows a Cronus spectro-colorimeter.

15 4. Modules 4.1. Introduction Iliad contains numerous modules which can be selected depending on the connected device(s). The next subchapters will explain all Iliad modules. The screenshot examples show a Cronus, currently the only Admesy measurement device which runs all modules. When connecting other measurement devices, some modules will not be available. Please be aware that the right functions have to be enabled to access modules. For example using only the measure spectrum function of the Cronus series spectro-colorimeter will not enable the flicker measurement modules. 15


16 4.2. Chromaticity The Chromaticity module displays light and colour coordinates. In combination with the colour pass/fail module, the chromaticity module can be used to qualify samples within specific ranges of x and y. For more information, please see the x,y pass/fail measurement example Datalogging With the datalogging function you can display a datalogging table which can be saved. 16


17 4.4. Flicker With the flicker module you can display an optical signal over time from which flicker values are calculated. Multiple samples are taken over time to measure flicker Flicker value The flicker value shows the calculated flicker value and frequency. On the right top corner, you can select the different flicker measurement methods supported in Iliad. For logging these type of flicker measurement methods in the datalogging module, select the desired methods via Settings, Calculation settings The Omitted samples feature has been added from RC69 onwards. In order to enable Omitted samples feature, the filter in the device tree must be enabled (set to 1). 17
, illuminance (cosine corrector). 4.7.")

18 4.6. Intensity chart The intensity chart module allows to make Intensity related measurements over time. Depending on the optical configuration of the device, the device measures luminance (lens), illuminance (cosine corrector) Intensity value The Intensity value module shows different photometric intensity values: luminance (cd/m²), illuminance (lux) or luminous intensity (cd). The displayed unit depends on the optical system of the device and/or chosen units. Lens systems can only display luminance values. Devices equipped with cosine corrector can display illuminance (lux) and luminous intensity values (cd). By right clicking on the graph, data can be exported to excel or saved as a picture. 18
 value can be calculated by means of the illuminance (lux) value and distance between light source and detector: cd = lux (d²) Where d is the distance between light source")
19 The Iliad application is capable of measuring luminous intensity (candela) of light sources directly. The luminous intensity (cd) value can be calculated by means of the illuminance (lux) value and distance between light source and detector: cd = lux (d²) Where d is the distance between light source and optics of the measurement device. Note that luminous intensity values can only be calculated correctly when using a device equipped with cosine corrector or integrating sphere calibrated in irradiance mode. To measure luminous intensity, go to Settings, Calculation settings and select Photometric. Under Photometric, Luminous intensity and Illuminance can be chosen as shown on the right. If necessary, you may need to select Cosine if Iliad does not recognize the optical configuration by itself (e.g. when using fiber connected devices). Under Source distance you can enter the value of the distance between light source and measurement device. The distance unit is in meters and can be adjusted whenever necessary in the Intensity value module as shown below. 19
20 4.8. Optics and units Especially for devices equipped with fiber connectors which can be connected to a wide range of optical systems, it is important to ensure the right optical configuration to display the corresponding units. Please ensure the right optical configuration for this type of applications. The tables below show an overview of photometric and radiometric units and required optical configurations. Photometric Lens Cosine corrector Integrating sphere Luminance. Illuminance * Luminous intensity Luminous flux *. Radiometric Lens Cosine corrector Integrating sphere Radiance. Irradiance * Radiant intensity Radiant flux *. Note*: Spectrometers connected to integrating spheres can measure illuminance + irradiance and radiant + luminous intensity if calibrated in irradiance mode. 20

21 4.9. Temperature Iliad allows to measure the current internal temperature of the device. To measure the temperature, go to Settings, Calculation settings and select Sensor temp. Please note that this setting measures the internal temperature at a specific spot. For the Rhea series spectrometer, the sensor temp provides also the current internal temperature. The value shown does not relate to the cooled CCD sensor temperature. 21


22 4.10. Sample spectrums With the sample spectrums you can display multiple shots of spectral data over time and allows determination of changes of the spectrum over time. The table on the left bottom allows recording data Spectrum A single shot of a spectral measurement is displayed. The column shown on the right shows colour values derived from the spectral measurement. This module is also used for transmissive and reflective measurements. 22
23 4.12. PAR values When measuring the spectrum, additional parameters can be measured directly. This includes for example CCT, CRI but also PAR (photosynthetically active radiation) values of light sources. PAR is calculated both in PAR PPFD (μmol m -2 s -1 ) as well as PAR Lux (W/m²). The latter already indicates the PAR values can only be calculated correctly when using a spectrometer with cosine corrector. Please ensure the right optical configuration for this type of applications. PAR calculation can be done over two ranges: nm or nm. For nm PAR calculation, a Hera 02 or 04 are the only suitable devices. To enable measuring the PAR values, go to Settings, Calculation settings and select the PAR values. If necessary, select the nm range. Default range is nm. PAR values are listed in the right column when measuring a spectrum, make sure to have the spectrum module opened. 23

24 4.13. Timer The timer module allows repeated measurement control. This allows and controls datalogging with specific intervals. The minimum interval time depends on the device and application. For more information, please take a look at the operating manual of the device. You can select the parameters you want to log via Settings, Calculation settings. Please be aware that the calculation of multiple parameters may result in long processing times. 24


25 5. Start-up settings Under device in the top bar you can find the start-up settings, here you can find all kind of parameters. You can also set the settings of the autorange. 25
 Steropes.")

26 6. Steropes light source control Admesy Steropes series light sources can be controlled from the Iliad software directly. Under start-up settings in the top bar, the control panel can be opened for both LED and Halogen (HDX) Steropes. Depending on the type of Steropes (LED or Halogen), the control panel will display the parameters which can be adjusted for each type. Please note that the Steropes LED series need an external 9V power supply to operate at full brightness. Over USB, Steropes LED versions can only provide up to half its maximum brightness due to power restrictions on USB ports. 26
27 7. Calibration Under Device you can find Calibration, here you can perform custom calibration of you device. In the next subchapters we point out custom calibration for Admesy colorimeters, spectrometers and light meters. Depending on the selected device, Iliad supports the following calibration types: Spectral calibration of spectrometer Matrix calibration of colorimeter and spectrometer Whenever you calibrate a spectrometer by matrix, remember this will not change the spectrum but only the output of XYZ, Yxy etc. The spectrum can only be changed by performing a spectral calibration using a NIST traceable light source. This usually requires the use of an integrating sphere and stable power supply to drive the NIST traceable light source correctly. Admesy added the feature to calibrate on XYZ level so that end user can easily calibrate their spectrometer on XYZ colour space instead of spectrum level. This has a huge advantage for factory use to make all instruments perform the same and thus optimize the inter-instrument agreement. 27
. Depending on the type of spectrometer, the calibration module may show 2 (Hera) or 3 tabs (Cronus).")
28 7.1. Spectrometer calibration The calibration for spectrometers, like for example the Hera and Cronus series can be adjusted by selecting the connected device under Device, Calibration. A screen will appear which shows the Calibration Utility (as shown on the right). Depending on the type of spectrometer, the calibration module may show 2 (Hera) or 3 tabs (Cronus). These tabs are explained on the next pages. The Cronus and Hera are usually shipped including a NIST traceable calibration. Due to this, the Cronus and Hera can be user calibrated in two ways: By means of a calibration light source By using the Admesy factory calibration multiplied by a matrix, a very common way to calibrate colorimeters The second method using a matrix can be used when a sample with known Yxy (or XYZ) values is available. In such cases it is not necessary to go through the normal, rather complex and expensive calibration procedure using NIST traceable light sources. Using the matrix allows to obtain luminance and colour values. NOTE: The matrix and values changed in the matrix do not influence the spectrum nor the absolute (spectral) calibration of the spectrometer. It only adjusts the XYZ values that have been calculated using the spectral data. 28
29 User spectrum calibration The first tab is for spectrum calibration using a calibration lamp. Corresponding lamp data should be read from file first. The path must be set correctly and the file should be read. An example can be found in C:\Program Files (x86)\iliad\calibration The range indicator is equal to the earlier discussed clip indicator in the main software panel. This is useful to obtain a good S/N for the calibration. Make sure the signal is between If it is not, adjust the integration time. After the spectrum has been measured correctly, the data can be stored inside the instrument by clicking the Write button. After opening the data, the integration time and averaging should be set. The lamp and spectrometer should be set up correctly and click Calibrate button afterwards to measure the lamp s spectrum. The user calibration can be chosen in the main software screen via the Calibration control. 29


30 Spectrometer matrix calibration The sample reference data should be entered in the reference values fields. All fields must be filled or less number of points should be selected. Through this tab it is possible to use the Admesy spectrum calibration and add a user defined matrix to that. This will calibrate the XYZ output data. It is recommended to set autorange on. When measuring the reference sample, the point control should be set to the correct sample number. After that the Measure button can be clicked. The number of points can be used to either measure multiple reference samples or in case of display measurement to set it to 3 in order to measure red, green and blue. 30
31 Once all measurements are finished, the Calculate matrix button should be clicked and a matrix will be calculated. After this, the new calibration matrix can be written to the instrument. The calibration matrix can be chosen in the main software screen by the SP.Cal.matrix item. 31

32 XYZ sensor calibration Once the Cronus is positioned on the sample, click the Measure Spectrometer button, followed by the Measure Colorimeter button. NOTE: This part is only applicable to the Cronus series spectrocolorimeter. The colorimeter sensor in the Cronus can be calibrated using the spectrometer part of the Cronus. Alternatively reference values can be entered manually, thus not using the spectrometer part of Cronus. Alike the previous calibration example, you need to set the Number of points and the point for measurement. The advantage of using the colorimeter is mainly speed. For example, low luminance measurements could be done by the colorimeter to save time. Once all points have been measured, select the user matrix number that you want to write into, for example User matrix 1. All settings must be checked carefully so that the spectrometer measures correctly and the colorimeter measures correctly. It is again recommended to use SP autorange and Col autorange to get good S/N ratios during calibration. 32
33 Click the Calculate matrix button. Now the matrix can be written to the instrument by setting a name for it and clicking the Write XYZ matrices button. The written matrix can be selected in the main software screen by the COL.Cal.matrix item. The value user1 refers to matrix number 1. 33
. In order to calibrate the colorimeter for a specific sample, it is necessary to start with accurate reference values.")
34 7.2. Colorimeter calibration The calibration for colorimeters, like for example the MSE series can be adjusted by selecting the connected device under Device, Calibration. A screen will appear which shows the Calibration Utility (as shown on the right). In order to calibrate the colorimeter for a specific sample, it is necessary to start with accurate reference values. These references can be obtained from a spectrometer by measuring the sample or can be supplied already with the sample. The use of spectrometers is recommended as samples may degrade over time. Note: It is recommended to turn Auto-range on during the calibration process. 34


35 The reference values have to be filled into the Reference system values table. The RGB Calculation mode is recommended for display measurements. In case difficulties are experienced with the display, other choices may be tested. Once the reference values are filled into the Reference system values, the colorimeter can be calibrated. This can be done by clicking the measurement buttons, below the Admesy value fields. Results are displayed in the Admesy values table. It is recommended to measure multiple times to verify measurement stability. In case the measurement is not stable enough, the averaging setting or the integration time setting may have to be increased. 35
, there are two calibration options.")


36 After all values are measured, click the Calculate button to calculate the calibration matrix. In case a sample does produce only one colour (LED, backlight, lamps for example), there are two calibration options. Linear By using multiple samples and fill them into the RGB fields. The calibration matrix is shown afterwards and can be programmed into the colorimeter. Note that the a user matrix number must be set before programming (the example below shows user matrix number 1). When choosing linear calibration, only one reference value is necessary. The calibration value will in that case only show the white value. When measuring white and calculating the matrix, only the diagonal is filled with data. After programming is finished, click OK in the following dialog. After finishing the calibration, it is recommended to verify the calibration. 36
37 The calibration utility offers a choice to input either Yxy or XYZ values. This is selected by the colour space control. The Calculation mode offers other calibration modes like RGBW, RGBWG RGBGCMY. These are only rarely used, but may be required to measure special samples. Note that all values should be filled in and no fields should be left to zero. In case very dark samples are measured, it may be necessary to measure dark before carrying out the calibration measurements. 37
. This calibration factor is in fact a multiplication factor of the raw intensity measurement.")
38 7.3. Light meter calibration When using or implementing the Asteria in a measurement setup, the raw measured value can be adjusted to other measurement devices, if necessary. This can be done by adjusting the calibration factor (CF). This calibration factor is in fact a multiplication factor of the raw intensity measurement. For example, a reference system measures 300cd/m² and Asteria with CF=OFF measures 280cd/m², then the calibration factor becomes: 300 / 280 = Admesy Iliad software supports this type of calibration of the Asteria but the calibration factor can also be manually written to the Asteria s CF factors (see above EEPROM commands). The calibration factor can be adjusted by selecting the Asteria under Device, Calibration. 38
39 8. Firmware update 8.1. Introduction Under the device menu you can find the firmware upgrade tool to check for the latest firmware for your Admesy measurement device. NOTE: If you have never performed an update to a device please do not forget to check the checkbox Install bootloader driver. This is only necessary during the first update of the firmware. Afterwards Windows stores the device s bootloader driver. Consider that every device has a unique bootloader (e.g. the Hera s bootloader is different from the Asteria s bootloader). The drivers are typically located in: C:\Program Files (x86)\iliad\bootloader_drivers When using the drivers on Windows8, it may be necessary to disable driver signature enforcement. 39


40 8.2. Firmware update example (Asteria) As example, this subchapter shows the firmware update procedure for an Asteria light meter. When the Asteria is connected and the Firmware update screen is opened the checkbox Install bootloader driver should be checked. Click Upgrade Firmware afterwards. Latest firmware is available on the Admesy website: Browse to the firmware file on your computer and click Program device. Wait until the upgrade has finished and close the firmware tool afterwards. Iliad will automatically re-open the instrument. After upgrading, the message Programming successful appears. 40
41 9. Flicker measurement example (Asteria) When using the high speed intensity measurement function of the Asteria light meter, flicker measurements can be carried out. The Asteria acts like an optical oscilloscope in this function. Besides flicker, the Asteria allows luminance or illuminance measurements. The lens system Asteria is developed for luminance measurements (cd/m²), the cosine corrector version measures illuminance (lux) and luminous intensity (cd). The picture on the left shows the functions of the Asteria to be set. Change this to Sample Intensity (flicker). After this step, the flicker module from Modules can be selected (see picture below). After selecting the Flicker module, the screen as shown on the next page appears showing all relevant flicker values. 41


42 Selectable sample rate When using the Asteria, the sample rate can be changed according to the measurement needs. The sample rate determines in combination with the number of samples the total measurement time. For example when measuring samples at a sample rate of 46642Hz, the measurement will take 1s to be completed. The same number of samples measured at the maximum sample speed of Hz will take 0.25s. 42

43 Edit to clear FFT LOG Sample rate When clicking the Record button, the table at the bottom will show the results according to the JEITA method per frequency, starting from 2 Hz up to 65 Hz. Lower frequencies than 2 Hz cannot be determined as the measurement time equals 1 second. By adjusting the delay, the measurement time can be increased, offering the possibility to measure low frequencies. See the example on the next page. The table can be cleared under Edit, Clear FFT log or Clear last FFT log. 43
44 9.1. Delay function The delay function offers the possibility of oversampling: giving the average of an initial sample and X number of next samples. Where X is the Delay value. Below we will give some additional explanation and examples the Delay function. As graphic example, we show two examples where 10 samples are shown. The initial sample ( i ) is shown as an orange block. The Delay samples ( d ) are shown blue. On the next two pages, examples are given of what the Delay function does in practice. Exceptions are the older Admesy devices, which do not have an oversampling functionality. The delay value determines the number of samples to be skipped. For example when set delay at 9, the first sample is measured, the next following 9 are skipped. This means that every 10 th sample is taken. All other samples are not taken into account. Example 1: Delay 0. The Asteria has a sample rate of samples per second (typical for the device). When the delay is set to 0, there is no next value to average with the initial sample. The next sample is directly measured, resulting in samples taken directly after another. With this (fixed) sample rate, the measurement takes exactly 1 second. i i i i i i i i i i Sample nr. Example 2: Delay 2. If the delay is set to 2, the device takes the average of the initial value and the next 2 samples. This means the initial value is averaged with every 2 nd and 3 rd sample. The 4 th sample is averaged with the 5 th and 6 th and so on. Thus, if we measure again samples with Delay 2, three samples are taken to make one value, the measurement time will be three times the initial measurement time: 3 seconds. i d d i d d i d d i Sample nr. 44

45 Number of samples The example illustrated above shows an Asteria which has a typical maximum sample rate of samples per second. In this case minus 4000 omitted samples are measured which equals 36000/ samples per second = 0,2144s. 45
46 The example above shows a similar measurement which is carried out with a delay of 9. This means the initial value is averaged with the next 9. The average of 10 samples is taken to make 1 average. In case of samples, the total measurement time is ten times the measurement time of the example on the previous page. 46
47 9.2. Settings Settings which are valid for flicker are the following: Auto-range Gain Nr of samples Delay Filter Cut-off freq Col.Cal.matrix The flicker measurement circuit (trans-impedance amplifier) has three resistor stages for large dynamic range. When using auto-range the gain is defined automatically. Care should be taken that no clipping of the signal occurs. We always recommend to start with auto-range. In most cases this is more than sufficient. With the nr. of samples and delay you can control the measurement time and the amount of data you get back as explained in the previous sub chapter. With the filter and cut-off frequency you can add a filter function over the measured data. Original data and filtered data can be saved. With the col.cal.matrix you can choose the factory calibration factor. In the case of the Asteria, it is matched on three types of light sources. Lens system (luminance) Factory 1 calibrated on a led backlight LCD Factory 2 calibrated on a CCFL LCD Factory 3 calibrated on a halogen light source Factory 4 10 not calibrated, for future use and OEM User 1 10 calibration space for user Cosine corrector system (illuminance & luminous intensity) Factory 1 calibrated on a halogen light source Factory 2 calibrated on a white LED light source Factory 3 calibrated on a fluorescent light source Factory 4 10 not calibrated, for future use and OEM User 1 10 calibration space for user 47

48 Export and save data A time diagram and the FFT is shown. The values on the Y-axis represent the luminance or illuminance (value depending on the Asteria s optical system). 48

49 10. (Il)luminance measurement example (Asteria) When using the measure intensity function of the Asteria luminance (cd/m²) or illuminance (lux) measurements can be taken. The main difference is that the luminance / illuminance measurements are done with an integrating amplifier circuit. This makes it possible for very low level luminance measurements at a quit fast rate. The picture below shows the required settings. Afterwards, you can select the module Intensity value from Modules and the following screen will appear (see next page). 49
.")
50 Luminance or illuminance values will be shown (depending on the Asteria s optical system). 50
51 10.1. Settings Settings which are valid for intensity are the following: Auto-range Gain Integration time Col.Cal.matrix The flicker measurement circuit (integrating amplifier) has three capacitor stages for very large dynamic range. When using auto-range the gain is defined automatically. We always recommend to start with auto-range in this mode. Paramaters of the auto-range for this mode can be set under Device, Startup settings. With integration time you can set the measurement time. In case you run the system on autorange, it is not necessary to change this value as it is ignored by Iliad. With the col.cal.matrix you can choose the factory calibration factor. In case of the Asteria it is matched on three types of light sources. Lens system (luminance) Factory 1 calibrated on a led backlight LCD Factory 2 calibrated on a CCFL LCD Factory 3 calibrated on a halogen light source Factory 4 10 not calibrated, for future use and OEM User 1 10 calibration space for user Cosine corrector system (illuminance & luminous intensity) Factory 1 calibrated on a halogen light source Factory 2 calibrated on a white LED light source Factory 3 calibrated on a fluorescent light source Factory 4 10 not calibrated, for future use and OEM User 1 10 calibration space for user 51
, stabilized light source like for example Admesy s Steropes series and accessories such as the reflective probes.")
52 11. Reflective measurement example (Hera) Reflective measurements can be carried out using a combination of a measurement device (e.g. Hera spectrometer), stabilized light source like for example Admesy s Steropes series and accessories such as the reflective probes. By selecting the Measure Reflection function under Function1, the appropriate settings are selected (see next page). For more information about reflective measurements, please take a look at our special application page and application note: 52

53 First, select the Measure Reflection functionality under Function 1. 53
 in the upper")
54 Then, select Spectrum from the Modules. Place the reference white tile under the measurement spot and click the yellow light bulb (as marked orange in the screenshot above) in the upper bar and click record. A reference measurement is done and the screen with similar spectrum as above appears. 54

55 The software is now ready for reflective measurements. In some cases, it is advisable to repeat the reference measurements on a regular basis. 55
56 12. Transmissive measurement example (Hera) Transmissive measurements can be carried out using a combination of a measurement device (e.g. Hera spectrometer) and stabilized light source like for example Admesy s Steropes series. For more information about transmissive measurements, please take a look at our special application page and application note: 56
57 First, select the Measure Transmission functionality under Function 1. 57
58 Then, select Spectrum from the Modules. Click the yellow light bulb (as marked orange in the screenshot above) in the upper bar and click record. A reference measurement is done and the screen with similar spectrum as above appears. 58
59 The software is now ready for transmissive measurements. In some cases, it is advisable to repeat the reference measurements on a regular basis. 59
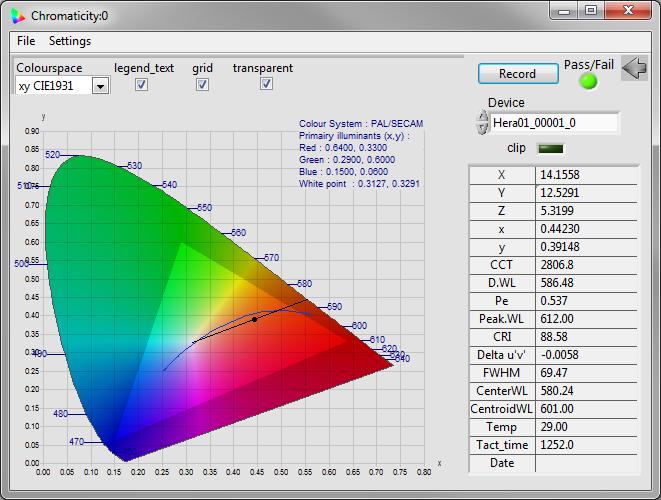
60 13. Pass/fail module Iliad has a built-in pass/fail module to determine whether measured parameters (e.g. x,y colour coordinates) are within a specific range. This allows straightforward and direct pass/fail assessment. For a parameter a minimum and maximum value can be set depending on the measurement needs. The example below shows a Hera-01 spectrometer used for x,y pass/fail assessment. In order to use the pass/fail function in Iliad, go to Settings, Calculation settings. Select all necessary parameters to measure, ensure x,y is checked in order to proceed this pass/fail module functionality for colour check (see image below) and click ok. 60


61 Go to Settings, Limit settings. Next, select Chromaticity, Spectrum or Pass/fail under Modules to start the pass/fail assessment for x,y. In case the Chromaticity or Spectrum module is selected, the normal chromaticity or spectrum will be shown respectively. Additionally a pass/fail indicator will appear in the module. The Pass/fail module only shows pass or fail based on the limits. Select x, fill in the Lower limit and press enter. Again for Upper limit and press enter. Repeat the steps for setting the lower and upper limits for y. Pass/fail measurements can be carried out continuously, or a single measurement, depending on the measurement needs. The following screens appear as shown on the next page. As example, one pass and one fail example are shown in the chromaticity module. 61
62 62
63 Admesy B.V. Sleestraat CA Ittervoort The Netherlands T +31 (0) F +31 (0) info@admesy.com The material in this document is subject to change. No rights can be derived from the content of this document. All rights reserved. No part of this document may be reproduced, stored in a database or retrieval system, or published in any form or way, electronically, mechanically, by print, photo print, microfilm or any other means without prior written permission from the publisher. Version /
specification light bulb cronus bhaskar spectrometer & colorimeter for light bulb measurements
 specification light bulb cronus bhaskar spectrometer & colorimeter for light bulb measurements Contents 1 Cronus Bhaskar: 100% light bulb inspection... 3 2 Highlights... 3 3 Application areas... 4 4 Optical
specification display & lighting hera spectrometer
 specification display & lighting hera spectrometer Contents 1 Hera: cost effective spectrometer... 3 2 Highlights... 3 3 Speed & ease of use... 4 1 General specification Hera... 4 2 Hera series specifications...
specification display applications hera spectrometer
 specification display applications hera spectrometer Contents 1 Hera: cost effective spectrometer for display measurements... 3 2 Highlights... 3 3 Speed & ease of use... 4 4 General specification Hera
specification cylon colorimeter
 specification cylon colorimeter Contents 1 Cylon: innovative ring of light... 3 2 Highlights... 4 3 Cylon general specifications... 4 4 Cylon colorimeter spectral sensitivity... 5 5 Cylon colorimeter specifications...
Spectroradiometer specbos 1201
 Spectroradiometer specbos 1201 specbos 1201 is a precise and compact VIS spectroradiometer. It can be used in laboratory as well as production environment to measure the following quantities: Luminance,
Broadbandradiometer specbos 1211
 Broadbandradiometer specbos 1211 specbos 1211 is a broadband and fast spectroradiometer which can be used in laboratory as well as production environment to measure the following quantities: Luminance,
Technical Notes. Integrating Sphere Measurement Part II: Calibration. Introduction. Calibration
 Technical Notes Integrating Sphere Measurement Part II: Calibration This Technical Note is Part II in a three part series examining the proper maintenance and use of integrating sphere light measurement
Miniaturized Spectroradiometer
 Miniaturized Spectroradiometer Thomas Morgenstern, Gudrun Bornhoeft, Steffen Goerlich JETI Technische Instrumente GmbH, Jena, Germany Abstract This paper describes the basics of spectroradiometric instruments
LED Lighting Flux and Color Measurement System (LFC)
") LED Lighting Flux and Color Measurement System (LFC) Fast, accurate and complete System for research and production LFC System is a high cost efficiency light measurement system. The system is designed
LED Lighting Flux and Color Measurement System (LFC) Fast, accurate and complete System for research and production LFC System is a high cost efficiency light measurement system. The system is designed
ISS-30-VA. Product tags: Integrating Sphere Source. https://www.gigahertz-optik.de/en-us/product/iss-30-va. Gigahertz-Optik GmbH 1/5
 ISS-30-VA https://www.gigahertz-optik.de/en-us/product/iss-30-va Product tags: Integrating Sphere Source Gigahertz-Optik GmbH 1/5 Description standards for spectral radiance Spectroradiometers and other
MK350 Portable Spectrometer
 Test and Read Visible Spectrum in 3 seconds MK350 helps building up your own LIGHT STYLE in lighting industry. MK350 The UPRtek MK350 Spectrometer is the first truly compact, lightweight illuminance spectroradiometer
Chameleon Spectroradiometer
 Chameleon Spectroradiometer SPEED / STABILITY / ACCURACY The Chameleon Series is designed to measure the absolute spectral of power, of the light under test. Adding optical probes and absolute calibration
Instruction manual for Ocean Optics USB4000 and QE65 Pro spectroradiometers
 Aalto University School of Electrical Engineering Metrology Research Institute Hans Baumgartner Instruction manual for Version 1.0 24/11/2016 Page 2 (9) 1. Table of contents 1. Table of contents... 2 2.
Measuring colour in a world of light
 Measuring colour in a world of light 1 Contents 1 Measuring colour in a world of light 5 2 The power of light 7 2.1 What is light? 7 2.2 Measuring light 9 2.3 Optical configurations 10 2.3.1 Integrating
BTS256-PAR. Product tags: VIS, Spectral Data, PAR, Waterproof, General lighting. https://www.gigahertz-optik.de/en-us/product/bts256-par
 BTS256-PAR https://www.gigahertz-optik.de/en-us/product/bts256-par Product tags: VIS, Spectral Data, PAR, Waterproof, General lighting Gigahertz-Optik GmbH 1/8 Description Measurement and examination of
Sample Report. IES LM Test Report. LED Lamp 001. Test results reported for: Orb Optronix report: LEDC WG. Original issue date:
 IES LM 79 08 Test Report Test results reported for: report: Original issue date: LED Lamp 001 LEDC001 010 WG 1 January 2012 Prepared for: Testing performed by: LED ABC, Inc. Memorial Highway 1003 7th Ave.
LI-193 Spherical Quantum Sensor
 LI-193 Spherical Quantum Sensor The LI-193 Spherical Quantum Sensor measures PAR in air or underwater from all directions at depths up to 350 meters. This sensor is useful for studies of phytoplankton,
CHAPTER1: QUICK START...3 CAMERA INSTALLATION... 3 SOFTWARE AND DRIVER INSTALLATION... 3 START TCAPTURE...4 TCAPTURE PARAMETER SETTINGS... 5 CHAPTER2:
 Image acquisition, managing and processing software TCapture Instruction Manual Key to the Instruction Manual TC is shortened name used for TCapture. Help Refer to [Help] >> [About TCapture] menu for software
Photometry and Light Measurement
 Photometry and Light Measurement Adrian Waltho, Analytik Ltd adrian.waltho@analytik.co.uk What is Light? What is Light? What is Light? Ultraviolet Light UV-C 180-280 nm UV-B 280-315 nm UV-A 315-400 nm
NFMS THEORY LIGHT AND COLOR MEASUREMENTS AND THE CCD-BASED GONIOPHOTOMETER. Presented by: January, 2015 S E E T H E D I F F E R E N C E
 NFMS THEORY LIGHT AND COLOR MEASUREMENTS AND THE CCD-BASED GONIOPHOTOMETER Presented by: January, 2015 1 NFMS THEORY AND OVERVIEW Contents Light and Color Theory Light, Spectral Power Distributions, and
BTS256-E WiFi - mobile light meter for photopic and scotopic illuminance, EVE factor, luminous color, color rendering index and luminous spectrum.
 Page 1 BTS256-E WiFi - mobile light meter for photopic and scotopic illuminance, EVE factor, luminous color, color rendering index and luminous spectrum. The BTS256-E WiFi is a high-quality light meter
The Art of Light Measurement. Avantes BV Apeldoorn, The Netherlands
 The Art of Light Measurement Avantes BV Apeldoorn, The Netherlands Who am I? Ger Loop Product Manager Avantes BV Oude Apeldoornseweg 28 7333 NS APELDOORN The Netherlands Phone: (+31) 313 670170 Fax: (+31)
GXCapture 8.1 Instruction Manual
 GT Vision image acquisition, managing and processing software GXCapture 8.1 Instruction Manual Contents of the Instruction Manual GXC is the shortened name used for GXCapture Square brackets are used to
LIMES 2000 Release Notes
 Page 1 of 8 These release notes are describing changes in LIMES 2000 since version 16.0607.806. A number of topics with regard to measurements of automotive lighting devices are covered, the latter mainly
Unprecedented Resolution and Accuracy For Camera & Image Sensor Calibration
 SpectralLED RS-7-1-VIS Benchtop Uniform Light Source For the ultimate in resolution and accuracy, the SpectralLED Tunable VIS source incorporates 35 discrete wavelengths for synthesis of commercially available
Designing the VEML6040 RGBW Color Sensor Into Applications
 VISHAY SEMICONDUCTORS www.vishay.com Optical Sensors By Reinhard Schaar The VEML6040 is an advanced RGB / ambient light sensor with an I 2 C protocol interface and designed with CMOS technology. VEML6040
Product tags: VIS, Spectral Data, Color Temperature, CRI, Waterproof, WiFi, Luminous Color, LED, Photometry, General lighting
 BTS256-EF https://www.gigahertz-optik.de/en-us/product/bts256-ef Product tags: VIS, Spectral Data, Color Temperature, CRI, Waterproof, WiFi, Luminous Color, LED, Photometry, General lighting Gigahertz-Optik
Color Measurement with the LSS-100P
 Color Measurement with the LSS-100P Color is complicated. This paper provides a brief overview of color perception and measurement. XYZ and the Eye We can model the color perception of the eye as three
PHOTO RESEARCH, INC. PR-730 / PR-735 and PR-740 / PR-745 SpectraScan
 PHOTO RESEARCH, INC. PR-730 / PR-735 and PR-740 / PR-745 SpectraScan 0.000005 fl 0.0001 fl Polarization Error - Under 0.20% Introduction We have taken our decades of experience and built it into the ultimate
BTS2048-UV. Product tags: UV, Spectral Data, LED Binning, Industrial Applications, LED. https://www.gigahertz-optik.de/en-us/product/bts2048-uv
 BTS2048-UV https://www.gigahertz-optik.de/en-us/product/bts2048-uv Product tags: UV, Spectral Data, LED Binning, Industrial Applications, LED Gigahertz-Optik GmbH 1/8 Description UV CCD spectroradiometer
Model S471-LED Optometer
 Model S471-LED Optometer For over 40 years UDT Instruments, a Gamma Scientific company, has been trusted by the world s leading organizations to provide accurate light measurement systems. UDT Instruments
LumaSpec 800S User Manual
 LumaSpec 800S User Manual Worldwide distribution VERSION 09112014 Prior Scientific, Ltd Cambridge, UK Prior Scientific, Inc Rockland, MA. USA Prior Scientific, GmbH Jena, Germany Prior Scientific KK Tokyo,
LI-192 Underwater Quantum Sensor
 LI-192 Underwater Quantum Sensor The LI-192 Underwater Quantum Sensor measures PAR from all angles in one hemisphere. The LI-192 works in air or underwater at depths up to 560 meters. The measurements
The Standard for over 40 Years
 Light Measurement The Standard for over 40 Years Introduction LI-COR radiation sensors measure the flux of radiant energy the energy that drives plant growth, warms the earth, and lights our world. The
Color Insight: Color Optimization
 Color Insight: Color Optimization Rev March 2016 Document Outline 1. Function of the optimization process 2. Color Insight terminology 3. Color matching preset creation 4. Optimization process overview
JETI Specbos Instruments
 Spectral measuring instruments for various applications JETI Specbos Instruments The new Specbos family offers compact, spectrometric instruments, designed to measure the color coordinates, spectral characteristics
Product tags: VIS, Spectral Data, Color Temperature, CRI, Bilirubin, PAR, Scotopic, Luminous Color, Photometry, General lighting
 MSC15 http://www.gigahertz-optik.de/en-us/product/msc15 Product tags: VIS, Spectral Data, Color Temperature, CRI, Bilirubin, PAR, Scotopic, Luminous Color, Photometry, General lighting Gigahertz-Optik
Mach 5 100,000 PPS Energy Meter Operating Instructions
 Mach 5 100,000 PPS Energy Meter Operating Instructions Rev AF 3/18/2010 Page 1 of 45 Contents Introduction... 3 Installing the Software... 4 Power Source... 6 Probe Connection... 6 Indicator LED s... 6
LED Tester BTS256-LED
 1 LED Tester BTS256-LED The BTS256-LED tester is one of the most compact light measurement devices with integrated integrating sphere for high accuracy measurement of luminous flux, spectral and color
Optika ISview. Image acquisition and processing software. Instruction Manual
 Optika ISview Image acquisition and processing software Instruction Manual Key to the Instruction Manual IS is shortened name used for OptikaISview Square brackets are used to indicate items such as menu
BTS2048-BS. Product tags: VIS, Spectral Data, Industrial Applications, Laser.
 BTS2048-BS http://www.gigahertz-optik.de/en-us/product/bts2048-bs Product tags: VIS, Spectral Data, Industrial Applications, Laser Gigahertz-Optik GmbH 1/6 Description BTS2048-BS CCD spectroradiometer
BTS256-EF. Product tags: VIS, Spectral Measurement, Waterproof, WiFi. Gigahertz-Optik GmbH 1/7
 BTS256-EF http://www.gigahertz-optik.de/en-us/product/bts256-ef Product tags: VIS, Spectral Measurement, Waterproof, WiFi Gigahertz-Optik GmbH 1/7 Description Traditional lux meters are increasingly being
We bring quality to light. MAS 40 Mini-Array Spectrometer
 MAS 40 Mini-Array Spectrometer Features at a glance Cost-effective and robust CCD spectrometer technology Standard USB interface Compatible with all Instrument Systems measuring adapters Different models
WP640 Imaging Colorimeter. Backlit Graphics Panel Analysis
 Westboro Photonics 1505 Carling Ave, Suite 301 Ottawa, ON K1V 3L7 Wphotonics.com WP640 Imaging Colorimeter Backlit Graphics Panel Analysis Issued: May 5, 2014 Table of Contents 1.0 WP600 SERIES IMAGING
Solid State Luminance Standards
 Solid State Luminance Standards Color and luminance correction of: - Imaging colorimeters - Luminance meters - Imaging spectrometers Compact and Robust for Production Environments Correct for instrument
Orb Optronix, Inc th Ave Kirkland, WA Device Ref #: P30LN-L540-C27-B25 tel: fax: lm x 0.
 Total Integrated Radiant Flux Total Integrated Luminous Flux Luminous Efficacy Peak Wavelength Dominant Wavelength Color Purity CCT CRI Ra Peak Candela Irradiance (W/m 2 *nm) Figure 3 Spectral Illuminance
Detailed Scientific Barrier Filter Discussion
 Detailed Scientific Barrier Filter Discussion Copyright 2017 Lynn Miner INTRODUCTION In this paper, we will discuss the differences in various barrier filters from a number of manufacturers. The purpose
GL spectis 1.0 Touch The world s first smart spectrometer.
 TM Touch the technology GL spectis 1.0 Touch The world s first smart spectrometer. Enter the world of smart spectrometers GL Optic offers a complete line of measuring instruments using the latest smart
SensorTrace BASIC 3.0 user manual
 SensorTrace BASIC 3.0 user manual 3 Se n s o rtr a c e BASIC 3.0 Us e r Ma n u a l Copyright 2010 Unisense A/S Version October 2010 SensorTrace basic 3.0 User manual Unisense A/S TABLE OF CONTENTS Congratulations
Gentec-EO USA. T-RAD-USB Users Manual. T-Rad-USB Operating Instructions /15/2010 Page 1 of 24
 Gentec-EO USA T-RAD-USB Users Manual Gentec-EO USA 5825 Jean Road Center Lake Oswego, Oregon, 97035 503-697-1870 voice 503-697-0633 fax 121-201795 11/15/2010 Page 1 of 24 System Overview Welcome to the
iq-led Software V2.1
 iq-led Software V2.1 User Manual 31. January 2018 Image Engineering GmbH & Co. KG Im Gleisdreieck 5 50169 Kerpen-Horrem Germany T +49 2273 99991-0 F +49 2273 99991-10 www.image-engineering.com CONTENT
UCE-DSO210 DIGITAL OSCILLOSCOPE USER MANUAL. FATIH GENÇ UCORE ELECTRONICS REV1
 UCE-DSO210 DIGITAL OSCILLOSCOPE USER MANUAL FATIH GENÇ UCORE ELECTRONICS www.ucore-electronics.com 2017 - REV1 Contents 1. Introduction... 2 2. Turn on or turn off... 3 3. Oscilloscope Mode... 3 3.1. Display
Orb Optronix, Inc th Ave Kirkland, WA Device Ref #: P30LN-L600-C30-B25 tel: fax: lm x 0.
 Total Integrated Radiant Flux Total Integrated Luminous Flux Luminous Efficacy Peak Wavelength Dominant Wavelength Color Purity CCT CRI Ra Peak Candela Irradiance (W/m 2 *nm) Figure 3 Spectral Illuminance
CS-2000/2000A. Spectroradiometer NEW
 Spectroradiometer NEW CS-000/000A The world's top-level capability spectroradiometers make further advances with addition of second model to lineup. World's top level capability to detect extremely low
UCE-DSO212 DIGITAL OSCILLOSCOPE USER MANUAL. UCORE ELECTRONICS
 UCE-DSO212 DIGITAL OSCILLOSCOPE USER MANUAL UCORE ELECTRONICS www.ucore-electronics.com 2017 Contents 1. Introduction... 2 2. Turn on or turn off... 3 3. Oscilloscope Mode... 4 3.1. Display Description...
Technological Advances in General Lighting. New Lightmeter for Solid State Lighting. State-of-the-Art LED Illuminance Meter
 1 BTS256-E Preliminary Datasheet Technological Advances in General Lighting The latest trends in general lighting involve replacing traditional light sources with SSL Solid State Lighting for energy savings,
AL-100 Spectroradiometer
 March 28, 2016 Version 1.0 Apacer Technology Inc. 1F, No.32, Zhongcheng Rd., Tucheng Dist., New Taipei City, Taiwan, R.O.C Tel: +886-2-2267-8000 Fax: +886-2-2267-2261 www.apacer.com Revision History Revision
LI-1500 Light Sensor Logger
 LI-1500 Light Sensor Logger The LI-1500 Light Sensor Logger provides a direct digital readout and data logging from up to three LI-COR sensors at the same time. Log manually or set up one-time, daily,
Orb Optronix, Inc th Ave Kirkland, WA Device Ref #: P20-L360-C27-B25 tel: fax: lm x 0.
 Total Integrated Radiant Flux Total Integrated Luminous Flux Luminous Efficacy Peak Wavelength Dominant Wavelength Color Purity CCT CRI Ra Peak Candela Irradiance (W/m 2 *nm) Figure 3 Spectral Illuminance
LEDView LIGHTING CABINET. User Manual
 LIGHTING CABINET User Manual Add: Room 3-410, 18 th Huashan Road, Xinbei District, Changzhou, Jiangsu, China, 213022 Tel: +86 (0519) 85289860 Fax:+86 (0519) 85289870 Email: binyu.wang@thouslite.com Web:
LED Tester BTS256-LED
 1 LED Tester BTS256-LED The BTS256-LED tester is one of the most compact light measurement devices with integrated integrating sphere for high accuracy measurement of luminous flux, spectral and color
Calibrating BRAVIA with CalMAN
 1 Calibrating BRAVIA with CalMAN MASTER Series is CalMAN Ready Calibrating BRAVIA has never been so easy. Our new MASTER Series is now CalMAN Ready with the workflow specifically made available for calibrating
Exercise 2-2. Four-Wire Transmitter (Optional) EXERCISE OBJECTIVE DISCUSSION OUTLINE. Ultrasonic level transmitter DISCUSSION
 EXERCISE OBJECTIVE DISCUSSION OUTLINE. Ultrasonic level transmitter DISCUSSION") Exercise 2-2 Four-Wire Transmitter (Optional) EXERCISE OBJECTIVE Become familiar with HART point-to-point connection of a four-wire transmitter. DISCUSSION OUTLINE The Discussion of this exercise covers
Exercise 2-2 Four-Wire Transmitter (Optional) EXERCISE OBJECTIVE Become familiar with HART point-to-point connection of a four-wire transmitter. DISCUSSION OUTLINE The Discussion of this exercise covers
Instruction Manual ABM HART Gateway Software. Instruction Manual Revision A.1
 Instruction Manual ABM HART Gateway Software Instruction Manual Revision A.1 Table of Contents Section 1: Getting Started... 3 1.1 Setup Procedure... 3 1.2 Quick Setup Guide for Ultrasonic Sensors... 11
LP RAD 03 LP PAR 03 LP UVA 03 LP UVB 03 LP PHOT 03S
 LP PHOT 0 LP RAD 0 LP PAR 0 LP UVA 0 LP UVB 0 : Typical sensitivity: 0.5.5 mv/(klux) Spectral range: V(λ) Calibration uncertainty: < % f (agreement with the standard curve V(λ)):
Instruction manual for T3DS software. Tool for THz Time-Domain Spectroscopy. Release 4.0
 Instruction manual for T3DS software Release 4.0 Table of contents 0. Setup... 3 1. Start-up... 5 2. Input parameters and delay line control... 6 3. Slow scan measurement... 8 4. Fast scan measurement...
Veterinary Digital X-Ray System Quick Start Guide
 1 Veterinary Digital X-Ray System Quick Start Guide 2 SOPIX² X-Ray Sensors Quick Start Guide ***PERFORM THIS STEP BEFORE PLUGGING IN THE SENSOR*** Step 1 Load the CD: If you have already plugged in the
LP PHOT LP RAD 03 LP PAR 03 LP UVA 03 LP UVB 03 LP PHOT 03S. Light
 LP PHOT 0 LP RAD 0 LP PAR 0 LP UVA 0 LP UVB 0 LP PHOT 0S : λ) f (agreement with the standard curve V(λ f (Cosine response)
Spectroradiometer CS-2000/2000A. The world's top-level capability spectroradiometers make further advances with addition of second model to lineup.
 Spectroradiometer CS-000/000A The world's top-level capability spectroradiometers make further advances with addition of second model to lineup. 15 World's top level capability to detect extremely low
BTS2048-VL-CP-ILED-B-IS-1.0-HL
 BTS2048-VL-CP-ILED-B-IS-1.0-HL https://www.gigahertz-optik.de/en-us/product/bts2048-vl-cp-iled-b-is-1.0-hl Product tags: VIS, NIR, Spectral Data, LED Binning, CIE 127, ILED-B, LED Gigahertz-Optik GmbH
UM1380/ UM2380 UM1390/ UM2390 Datasheet
 UM1380/ UM2380 UM1390/ UM2390 Datasheet Description UM1380/ UM2380/ UM1390/ UM2390 spectro-module is a new OtO optical platform with 50% footprint down size compared to UM1280/UM2280 series. Besides the
SCD-0017 Firegrab Documentation
 SCD-0017 Firegrab Documentation Release XI Tordivel AS January 04, 2017 Contents 1 User Guide 3 2 Fire-I Camera Properties 9 3 Raw Color Mode 13 4 Examples 15 5 Release notes 17 i ii SCD-0017 Firegrab
HD HD HD AND HD PHOTO-RADIOMETERS LG-2
 HD 22. HD 22.2 INSTRUMENT TECHNICAL CHARACTERISTICS Instrument Dimensions (Length x Width x Height) 85x9x4mm Weight 47g (complete with batteries) Materials Display ABS, rubber 2x4½ digits plus symbols
Spectroradiometer CS-2000/2000A. The world's top-level capability spectroradiometers make further advances with addition of second model to lineup.
 Spectroradiometer /000A The world's top-level capability spectroradiometers make further advances with addition of second model to lineup. World's top level capability to detect extremely low luminance
Radiometry vs. Photometry. Radiometric and photometric units
 Radiometry vs. Photometry Radiometry -- the measurement and specification of the power (energy) of a source of electromagnetic radiation.! total energy or numbers of quanta Photometry -- the measurement
EDUCATION EXPERIMENT. Determining Color Difference (Delta E) Introduction
 Introduction") EDUCATION EXPERIMENT Determining Color Difference (Delta E) Introduction www.oceanoptics.com info@oceanoptics.com Color matching and color consistency have become important quality control parameters in
EDUCATION EXPERIMENT Determining Color Difference (Delta E) Introduction www.oceanoptics.com info@oceanoptics.com Color matching and color consistency have become important quality control parameters in
TEK-TROL HART GATEWAY SOFTWARE. Operating Instruction Manual.
 TEK-TROL HART GATEWAY SOFTWARE Operating Instruction Manual www.tek-trol.com Table of Contents 1 Getting Started... 2 1.1 Setup Procedure... 2 1.2 Quick Setup Guide for Radar Sensors... 10 2 Level device
20W TL 324 smd LED Warm White by Simplify-It
 20W TL 324 smd LED Warm White by Simplify-It Page 1 of 17 Summary measurement data parameter meas. result remark Color temperature 3378 K Warm white, still on the cool side of warm white. Luminous intensity
Color Matching Beginning with the Basics. EIZO's Guide to enjoyment. a further. of digital. I see. photography
 Color Matching Beginning with the Basics EIZO's Guide to enjoyment a further of digital I see. photography Uses for digital photos As the use of digital cameras spreads, there are many more ways to enjoy
Reports. Eye-One. Evaluation of Gretag Macbeth. Brent Cavanaugh - Updated by Paul Huhtala Updated NOVEMBER 2005
 Brent Cavanaugh - Updated by Paul Huhtala Updated NOVEMBER 2005 Evaluation of Gretag Macbeth Eye-One In 2002, I first reviewed the Gretag Macbeth (GMB) Eye-One Pro with Eye-One Match. Since then, the Eye-One
MicroLab 500-series Getting Started
 MicroLab 500-series Getting Started 2 Contents CHAPTER 1: Getting Started Connecting the Hardware....6 Installing the USB driver......6 Installing the Software.....8 Starting a new Experiment...8 CHAPTER
INNOVATIVE CAMERA CHARACTERIZATION BASED ON LED LIGHT SOURCE
 Image Engineering imagequalitytools INNOVATIVE CAMERA CHARACTERIZATION BASED ON LED LIGHT SOURCE Image Engineering Relative Power ILLUMINATION DEVICES imagequalitytools The most flexible LED-based light
SPECTRO Series SPECTRO-3-FIO-UV-SL. Design. SPECTRO-3 Series True Color Sensors. Product name: Accessories: (p. 8-11)
") SPECTRO Series SPECTRO-3-FIO-UV-SL - Big working range: typ. 1 mm... 500 mm (depends on the fiber optics used and attachment optics) - Various UV fiber optics (reflected light operation) and attachment
SPECTRO Series SPECTRO-3-FIO-UV-SL - Big working range: typ. 1 mm... 500 mm (depends on the fiber optics used and attachment optics) - Various UV fiber optics (reflected light operation) and attachment
12/02/2017. From light to colour spaces. Electromagnetic spectrum. Colour. Correlated colour temperature. Black body radiation.
 From light to colour spaces Light and colour Advanced Graphics Rafal Mantiuk Computer Laboratory, University of Cambridge 1 2 Electromagnetic spectrum Visible light Electromagnetic waves of wavelength
Start Here. Installing your Microtek ScanMaker 9800XL Plus PC:
 Start Here Installing your Microtek ScanMaker 98XL Plus Step : Unpack Contents. Optional package items depend on the scanner configuration that you purchased. Unpack your scanner package and check for
Featuring new judgment and ranking functionality LED OPTICAL METER TM6101. < Primary measurement application >
 LED OPTICAL METER TM6101 < Measurement image > TM 6101 consists of main unit + sensor unit + PC application software. (PC is not included) < Primary measurement application > White LED/LED lighting devices
Luminous Flux (lumens) System LM-ISP-XXXX
 System LM-ISP-XXXX") Company Profile Taiwan Optimum Optoelectrics Co., Ltd. is Taiwan's the first of photometric and colorimetric measurement equipments and professional supplier of calibration services in Taiwan. In particular,
Company Profile Taiwan Optimum Optoelectrics Co., Ltd. is Taiwan's the first of photometric and colorimetric measurement equipments and professional supplier of calibration services in Taiwan. In particular,
Multispectral. imaging device. ADVANCED LIGHT ANALYSIS by. Most accurate homogeneity MeasureMent of spectral radiance. UMasterMS1 & UMasterMS2
 Multispectral imaging device Most accurate homogeneity MeasureMent of spectral radiance UMasterMS1 & UMasterMS2 ADVANCED LIGHT ANALYSIS by UMaster Ms Multispectral Imaging Device UMaster MS Description
Minolta Scanner Plugin
 Minolta Scanner Plugin For a list of Minolta digitizers and Geomagic software products with which this plugin is compatible, see Release Notes for Geomagic Minolta Plugin 7.6.0.3. Copyright 2005, Raindrop
Handbook Ref No. IH001/Issue D File Ref: PR203-v5D.doc
 Handbook Ref No. IH001/Issue D File Ref: PR203-v5D.doc 1. Introduction 2. Specification 3. Operation 4. Spectral Irradiance Measurements 5. Cosine Angular Response 6. Calibration Description 7. Care and
EULAMBIA ADVANCED TECHNOLOGIES LTD. User Manual EAT-EOM-CTL-2. Alexandros Fragkos
 EULAMBIA ADVANCED TECHNOLOGIES LTD User Manual Alexandros Fragkos (alexandros.fragkos@eulambia.com) 11/28/2016 28/11/2016 User Manual User Manual 28/11/2016 Electro-Optic Modulator Bias Control Unit v2.0
LED T5 30cm Warm White by BS Ledlight
 LED T5 30cm Warm White by BS Ledlight Page 1 of 18 Summary measurement data parameter meas. result remark Color temperature 3670 K On the cool side of warm white. Luminous intensity I v 36 Cd Measured
RGB Laser Meter TM6102, RGB Laser Luminance Meter TM6103, Optical Power Meter TM6104
 1 RGB Laser Meter TM6102, RGB Laser Luminance Meter TM6103, Optical Power Meter TM6104 Abstract The TM6102, TM6103, and TM6104 accurately measure the optical characteristics of laser displays (characteristics
Experiment P55: Light Intensity vs. Position (Light Sensor, Motion Sensor)
") PASCO scientific Vol. 2 Physics Lab Manual: P55-1 Experiment P55: (Light Sensor, Motion Sensor) Concept Time SW Interface Macintosh file Windows file illuminance 30 m 500/700 P55 Light vs. Position P55_LTVM.SWS
PASCO scientific Vol. 2 Physics Lab Manual: P55-1 Experiment P55: (Light Sensor, Motion Sensor) Concept Time SW Interface Macintosh file Windows file illuminance 30 m 500/700 P55 Light vs. Position P55_LTVM.SWS
SL 200 instrument can process the energy intensity emitted by the solar radiation in a precise place of the earth.
 Solarimeter SL 200 Table of contents 1 Introduction...4 2 General information...4 2.1 Measured units...4 2.2 Use...4 3 Operating principle...5 3.1 Keyboard presentation...5 3.2 Instrument offers 3 groups
IESNA LM-79: Measurement and Test Report for Halco Lighting Technologies ATL 2940-A PACIFIC DRIVE. Dec 08, 2014
 IESNA LM-79: 2008 Measurement and Test Report for Halco Lighting Technologies ATL 2940-A PACIFIC DRIVE Dec 08, 2014 Product Name: LED Model No: 82031 Test Engineer: David Zhang Report No.: BTR66.181.14.0039.06
HP Advanced Profiling Solution Quick Start Guide
 HP Advanced Profiling Solution Quick Start Guide Welcome to the! You have just successfully installed HP APS on your computer and clicked on the Quick Start Guide button in your HP APS Control Center.
Diogen Lighting,Inc 14 Inverness Drive East,Ste.E-128 Englewood, CO T8L W BEST Test Service Shenzhen Co., Ltd.
 IESNA LM-79: 2008 Measurement and Test Report for 14 Inverness Drive East,Ste.E-128 Englewood, CO 80112 Jun 15, 2011 Product Name: T8 Tube Model No: T8L1200-18W-02-120-32 Test Engineer: David Zhang Report
VCNL4000 Demo Kit. IR Anode. IR Cathode. IR Cathode SDA SCL
 VISHAY SEMICONDUCTORS Optoelectronics Application Note INTRODUCTION The VCNL4000 is a proximity sensor with an integrated ambient light sensor. It is the industry s first optical sensor to combine an infrared
Technical Note How to Compensate Lateral Chromatic Aberration
 Lateral Chromatic Aberration Compensation Function: In JAI color line scan cameras (3CCD/4CCD/3CMOS/4CMOS), sensors and prisms are precisely fabricated. On the other hand, the lens mounts of the cameras