TRI COLOR IMAGING 1 INTRODUCTION 1.1 USING FILTERS
|
|
|
- Mervin Blair
- 5 years ago
- Views:
Transcription
1 TRI COLOR IMAGING From: Imaging the Universe A Laboratory Manual for Introductory Astronomy, R. Mutel et. al. PROJECT LEVEL: Introductory PROJECT GOALS: The student will learn how to use an image processing program to combine filtered monochrome images in order to make a true color image. Topics discussed are synchrotron radiation, chromatic filters (C,R,B,V), and spectral line emission IMAGE DIRECTORY/LIST: proj 05_Tri_Color: chapel [rgb].jpg, crab [rgb].fts, m27 [rgb].fts 1 INTRODUCTION This laboratory exercise demonstrates how color images are produced not only in astronomical imaging, but in everyday applications such as television. You will use filtered MONOCHROME CCD images of the CRAB NEBULA (M1), the DUMBBELL NEBULA (M27), and a building on campus to make true color images from greyscale filtered images. 1.1 USING FILTERS To most people, color images are the most interesting to look at, but at the low light levels prevalent to most visual astronomy, images seem to be grayscale because the light levels are not high enough to stimulate the cones in the human eye. The cones are responsible for color vision, while the rods are responsible for monochromatic, but are sensitive to lower light levels. Varying wavelengths of light will stimulate the cones in different combinations to produce the color vision we are used to. CCD cameras do not have the same limitations that the human eye has, however, and are able to see colored light at levels that a human cannot. However, the images taken, even without a FILTER, contain only shades of gray. How can astronomers produce such stunning astronomical images as appear in magazines and other journals? Filters exist that can be put in between the camera and the telescope that enable images to be taken that will only allow light of a certain range of colors through. These filters range from the infrared to the ultraviolet, although the visually colored filters are the most important for making color images. The filters most used for color processing are the red, blue, and visual (green) filters while the clear filter image is used for more advanced image processing. These filters are used because they correspond exactly to the cones that process color in the human eye. A fine example of combining R, G, 1
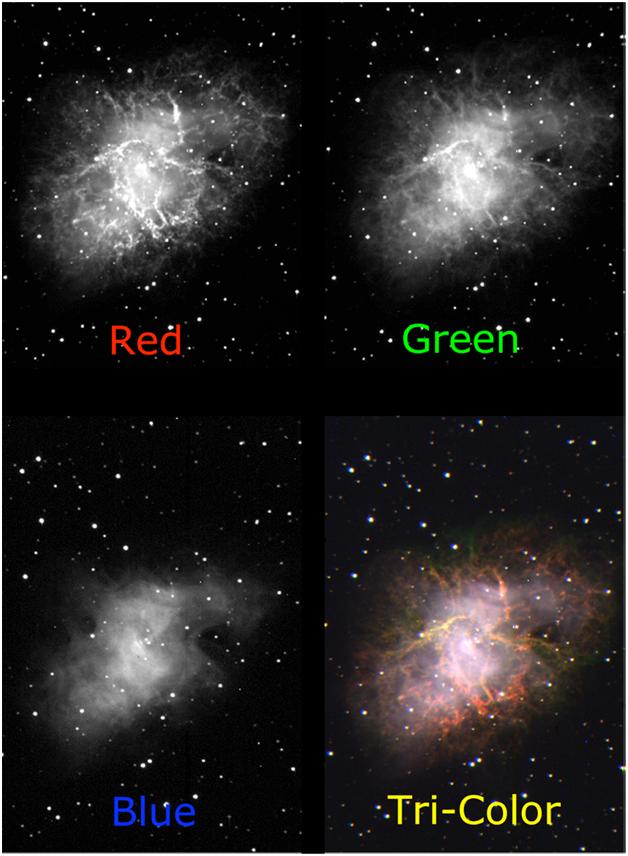
2 and B filtered images to produce a true color picture of an astronomical object (the Crab supernova remnant discussed below) is shown in the figure on page 5. This sort of processing is used by most people every day, without even knowing it. It is known as RGB PROCESSING. Every television set reproduces an image using signals sent with data using red (R), green (G), and blue (B) filters, and translates it into a working image on your screen. Color cameras also process images like this, reading what color levels are present in what you are imaging and translating it onto the film or CCD. A more advanced form of processing is known as LRGB, where the L stands for luminance. This is a better processing method in that it can correct for the brightness of objects that can be lost when images are taken through the colored filters. 2 CREATING TRUE COLOR IMAGES 1.2 THE DANFORTH CHAPEL Run MaxIm. Open the tricolor directory and load the chapel images chapel.jpg, chapel r.jpg, chapelb.jpg, and chapel g.jpg. These images were taken across Hubbard Park from the Danforth Chapel near the IMU on campus in June Look at the unfiltered image first (chapel.jpg). This is a color image of the building. This is what you would see if you looked at the building under most conditions (with some variation due to time of day, etc.) We will try to reproduce this image using the filtered images of the building. Move the three filtered image windows so that you can see all three at once as best you can. Note how the different filters highlight different areas of each image, even though the images are not obviously different other than apparent amount of detail shown. Note the differences you see in the images (e.g. the blue sky is quite dark in the R image). QUESTION 1: Describe the differences in the three filtered images. Where is the R filter image brightest? Where is the G filter brightest? Where is the B filter brightest? Is this what you expect? You can use these separate red, green, and blue images to make a true color image. Select one of the filtered images, and click on Color and then Combine Color from the menu at the top. A new 2
3 window will open displaying a list of 3 or 4 images, a preview box, and a ratio box. Above the image list is a selection called Conversion Type. Make sure RGB is selected from these selections. On the image list, make sure the correct images correspond to the correct colors (chapel r to red, etc.). Set the ratios to 1:1:1 for now, and hit the preview button. In the small window you will see a preview of the image that will be produced after combining the colors. Even though the preview does not quite look like the original (unfiltered) image, click OK. Note how the image is similar to the original, but there are some differences. Discard the image you just produced and repeat the above step. QUESTION 2: Make another color image with the three chapel images, but this time change your mixing ratios. How does this affect the resulting image? QUESTION 3: What mixing ratio gives you the best match to the original image? (Hint: a ratio of 1:2:3 is the same as a ratio of 2:4:6. If you are trying to change the overall brightness and contrast of the image, try using the Screen Stretch tool.) How close did you come? Note that you will not be able to reproduce the original image exactly. Describe any differences between your image and the original in the space provided. R G B 3
4 1.3 THE CRAB SUPERNOVA REMNANT (M1) Open the images crab r.fts, crab g.fts, and crab b.fts. These images were taken of the Crab supernova remnant (Messier catalog number 1, M1) using red, green, and blue filters. You may get a warning about negative pixel values, but do not worry about this, it does not affect the image. Move the image windows so that all three images are visible at the same time. You will need to adjust the image in order to bring out the maximum amount of detail. This is known as adjusting the histogram. Using the Screen Stretch window, move the red and green arrows underneath the graph to adjust the background (or black) with the red arrow and the brightness (white) with the green. Adjust each of the three images in this fashion. Notice that the images are obviously different from each other. The red image shows a fair amount of filamentary structure produced by hydrogen gas glowing most intensely at nm (the red Balmer Hα line). This is an emission line that we already have observed in the lab. The more diffuse emission seen in the blue image results from electrons spiraling around magnetic field lines at very high speeds, and is called synchrotron radiation. The green (visible) image contains both synchrotron radiation and the Balmer Hβ line. QUESTION 4: What type of object would you find at the center of the Crab nebula? Can you observe this type of object with an optical telescope? If not, what type of telescope might you use to observe this object? You can use the separate red, green, and blue images to make a true color image, as we have done with the chapel images. Select Color and Combine Color again. Make sure that the image names are in the correct places in the window that opens up. Use the ratios and preview again to examine your image. You should see a beautiful image of the Crab with the red hydrogen filaments extending slightly beyond the hazy white blue glow of the synchrotron radiation nebula. If you do not see this, adjust the ratios until you are close. Use the series of images on the next page as a reference. 4
5 5
6 QUESTION 5: What mixing ratio gives you the best match to the original image? How close did you come? Describe any differences between your image and the original in the space provided. R G B Since the Crab Nebula is believed to be the remnant from a supernova recorded by Chinese astronomers in 1054 A.D., we can use its present size and the present year to determine the expansion speed of the nebula. To do this, measure the average radius of the Crab Nebula in pixels. The pixels in the image have an angular size of 1.2 arcseconds. Convert the radius to arcseconds, and then to a.u. and km using the small angle formula. The nebula is about 2000 pc away. (You might need to consult the instructions for the Image Analysis Lab for some help with this.) QUESTION 6: Estimate the radius of the Crab Nebula. Calculate the radius in pixels using the distance formula. Take at least 2 more measurements of radius, choosing different locations along the nebula edge. Use your three measurements to find the average radius of M1 in pixels. Center Coordinate Edge Coordinate Radius Measurement 1 Measurement 2 Measurement 3 Average (pixels) 6
7 QUESTION 7: Convert the average radius in pixels to a linear distance using the Scale Factor of the M1 image and the given distance. Express your answer in kilometers. Assuming that the remnant s expansion speed has been constant since the explosion (since there is no accelerating force acting on it), calculate the expansion speed of the material in km/s by dividing the radius of the nebula in km by the age in seconds. M1 radius (pc) M1 radius (km) Age of M1 (years) Age of M1 (s) Expansion Speed (km/s) 1.4 M27 (THE DUMBBELL NEBULA) The Dumbbell Nebula is a famous example of a planetary nebula. These beautiful objects result from a dying star which is expelling large amounts of gas. The nebula is caused by glowing gas that surrounds the core of a highly evolved star. The gas is glowing because the star is emitting intense ultraviolet radiation, exciting the atoms in the gas to glow. The greenish center of the nebula is radiation primarily from oxygen and nitrogen, while the red glow near the outer boundary is due to hydrogen (Hα line). Open the images m27 c.fts, m27 g.fts, m27 g.fts, m27 r.fts. QUESTION 8: What type of object is expected to be at the center of a planetary nebula like M27? Can you detect this type of object using an optical telescope? How else might you detect this type of object? 7
8 In addition to the RGB images, you now have a clear filter image of the planetary nebula. We will now be combining images in a somewhat more advanced way, using LRGB COMBINATION. What the clear filter image will do is add brightness which can be lost in the other images to the color image. Start the color combination in the same fashion that we have been doing so far. Start with the standard RGB image processing that we have been doing, and form your image. Leave this image open, but move it to the side if necessary. Now, click on one of the filtered images and repeat the above step. Instead of selecting RGB in the color combine window, you now need to select LRGB from the Conversion Types. This will open up one more position in your image selection list, but this selection will be blank. Click on the arrow on the box labeled Luminance, and select the m27 c image for your luminance. There is no ratio for luminance like there is for each color, but there is a weight, a value representing how strongly it will affect the combined image. Try 100% at first, but vary with the weight for best results. QUESTION 9: What differences are visible between the RGB and LRGB images? QUESTION 10: What mixing ratio gives you the best match to the original image? Compare your color image of M27 with the web image at Describe any differences between your image and the original in the space provided. R G B 8
Tri-Color Imaging. Summary. Background and Theory TRI-COLOR IMAGING 36
 TRI-COLOR IMAGING 36 Tri-Color Imaging Level: Introductory Learning Goals: The student will learn how to use an image processing program to combine filtered monochrome images in order to make a true-color
Name Partner(s) Date Grade Category Max Points Points Received Tricolor Imaging 1. Introduction Background and Theory FILTER
 Date Grade Category Max Points Points Received Tricolor Imaging 1. Introduction Background and Theory FILTER") 29:50 Astronomy Lab #8 Stars, Galaxies, and the Universe Name Partner(s) Date Grade Category Max Points Points Received On Time 5 Printed Copy 5 Lab Work 90 Total 100 Tricolor Imaging 1. Introduction This
29:50 Astronomy Lab #8 Stars, Galaxies, and the Universe Name Partner(s) Date Grade Category Max Points Points Received On Time 5 Printed Copy 5 Lab Work 90 Total 100 Tricolor Imaging 1. Introduction This
APPENDIX D: ANALYZING ASTRONOMICAL IMAGES WITH MAXIM DL
 APPENDIX D: ANALYZING ASTRONOMICAL IMAGES WITH MAXIM DL Written by T.Jaeger INTRODUCTION Early astronomers relied on handmade sketches to record their observations (see Galileo s sketches of Jupiter s
INTRODUCTION TO CCD IMAGING
 ASTR 1030 Astronomy Lab 85 Intro to CCD Imaging INTRODUCTION TO CCD IMAGING SYNOPSIS: In this lab we will learn about some of the advantages of CCD cameras for use in astronomy and how to process an image.
Spectral Transmission Measurements on various Astronomical Filters.
 Spectral Transmission Measurements on various Astronomical Filters. Andreas Bartels - June 2008 Thanks to my friend Olivier, who provided the Spectrometer, I was able to do some spectral transmission measurements
LAB 11 Color and Light
 Cabrillo College Name LAB 11 Color and Light Bring colored pencils or crayons to lab if you already have some. What to learn and explore In the previous lab, we discovered that some sounds are simple,
ASTRO 1050 MicroObservatory RGB Image (if cloudy)
") ASTRO 1050 MicroObservatory RGB Image (if cloudy) ABSTRACT For this assignment, you will be using the MicroObservatory Robotic Telescope Network, run by the Harvard-Smithsonian Center for Astrophysics
ASTRO 1050 MicroObservatory RGB Image (if cloudy) ABSTRACT For this assignment, you will be using the MicroObservatory Robotic Telescope Network, run by the Harvard-Smithsonian Center for Astrophysics
OPTOLONG L Pro pollution filter testing
 OPTOLONG L Pro pollution filter testing The Chinese filter manufacturer OPTOLONG based in Kunming city in the southern province of Yunnan contacted me to test their light pollution premium filter, the
Adobe Photoshop. Levels
 How to correct color Once you ve opened an image in Photoshop, you may want to adjust color quality or light levels, convert it to black and white, or correct color or lens distortions. This can improve
Introduction to Astronomy Images and the DS9 Image Viewer
 Introduction to Astronomy Images and the DS9 Image Viewer George J. Bendo School of Physics and Astronomy The University of Manchester Version: 11 March 218 Contents Introduction to Astronomy Images 3
General Workflow for Processing L, Ha, R, G, and B Components in ImagesPlus
 General Workflow for Processing L, Ha, R, G, and B Components in ImagesPlus This general workflow can be used with component images from a DSLR, one shot color CCD, or monochrome CCD with minor adjustment
Understanding Color Theory Excerpt from Fundamental Photoshop by Adele Droblas Greenberg and Seth Greenberg
 Understanding Color Theory Excerpt from Fundamental Photoshop by Adele Droblas Greenberg and Seth Greenberg Color evokes a mood; it creates contrast and enhances the beauty in an image. It can make a dull
The Science Seeing of process Digital Media. The Science of Digital Media Introduction
 The Human Science eye of and Digital Displays Media Human Visual System Eye Perception of colour types terminology Human Visual System Eye Brains Camera and HVS HVS and displays Introduction 2 The Science
Assignment 1 Examining the Solar Spectrum with a diffraction grating
 Module 1 Assignments 1 & 2 Before we begin, note that some of the activities require posting answers and results on the Blog. In the document below, the Blog assignments are written in green for ease of
Black and White Photoshop Conversion Techniques
 Black and White Photoshop Conversion Techniques Andrew Gibson on Jan 27th 2011 Final Product What You'll Be Creating A quick glance through any photography or fashion magazine, or at the photos on social
CFW-8 Color Filter Wheel
 CFW-8 Color Filter Wheel For the ST-4X, ST-5, ST-6, ST-7, ST-8, ST-9 & ST-10 SBIG - Santa Barbara Instrument Group Copyright Notice This manual is copyrighted by Santa Barbara Instrument Group (SBIG).
What does the universe look like in color?
 EXPLORATION 3: ASTRO-PHOTOGRAPHER! What does the universe look like in color? The challenge Y ou have been asked by an astronomy magazine to write a short article about some part of the universe that interests
Version 2 Image Clarification Tool for Avid Editing Systems. Part of the dtective suite of forensic video analysis tools from Ocean Systems
 By Version 2 Image Clarification Tool for Avid Editing Systems Part of the dtective suite of forensic video analysis tools from Ocean Systems User Guide www.oceansystems.com www.dtectivesystem.com Page
PHYSICS. Chapter 35 Lecture FOR SCIENTISTS AND ENGINEERS A STRATEGIC APPROACH 4/E RANDALL D. KNIGHT
 PHYSICS FOR SCIENTISTS AND ENGINEERS A STRATEGIC APPROACH 4/E Chapter 35 Lecture RANDALL D. KNIGHT Chapter 35 Optical Instruments IN THIS CHAPTER, you will learn about some common optical instruments and
INSTITUTIONEN FÖR SYSTEMTEKNIK LULEÅ TEKNISKA UNIVERSITET
 INSTITUTIONEN FÖR SYSTEMTEKNIK LULEÅ TEKNISKA UNIVERSITET Some color images on this slide Last Lecture 2D filtering frequency domain The magnitude of the 2D DFT gives the amplitudes of the sinusoids and
Prelab Questions Read the section of your lab titled Background: Neutron Stars and Pulsars and answer the following questions.
 Lab 10: CLEA Radio Astronomy of Pulsars Prelab Questions Read the section of your lab titled Background: Neutron Stars and Pulsars and answer the following questions. 1. Why are neutron stars so difficult
Astronomy and Image Processing. Many thanks to Professor Kate Whitaker in the physics department for her help
 Astronomy and Image Processing Many thanks to Professor Kate Whitaker in the physics department for her help What is an image? An image is an array, or a matrix, of square pixels (picture elements) arranged
Planetary Nebulae. Planetary Nebulae 1
 Planetary Nebulae A planetary nebula is a kind of emission nebula consisting of an expanding, glowing shell of ionized gas ejected from old red giant stars late in their lives. The term "planetary nebula"
LIGHT AND LIGHTING FUNDAMENTALS. Prepared by Engr. John Paul Timola
 LIGHT AND LIGHTING FUNDAMENTALS Prepared by Engr. John Paul Timola LIGHT a form of radiant energy from natural sources and artificial sources. travels in the form of an electromagnetic wave, so it has
ToupSky Cameras Quick-guide
 ToupSky Cameras Quick-guide ToupSky is a capture and processing software offered by Touptek, the original manufacturer of the Toupcamera series. These are video cameras that offer live image capture for
Making Pretty Pictures from Scientific Data. by David Ault
 Making Pretty Pictures from Scientific Data by David Ault Many Sources Available Sloan Digital Sky Survey (SDSS) http://data.sdss3.org/fields Hubble Legacy Archive (HLA) http://hla.stsci.edu/hlaview.html
Some Aspects of Light Pollution in the Near Infrared
 Some Aspects of Light Pollution in the Near Infrared Željko Andreić 1 and Doroteja Andreić 2 1 Faculty of Mining, Geology and Petroleum Eng., University of Zagreb, Pierottijeva 6, 10 000 Zagreb, Croatia,
A guide to SalsaJ. This guide gives step-by-step instructions on how to use SalsaJ to carry out basic data analysis on astronomical data files.
 A guide to SalsaJ SalsaJ is free, student-friendly software developed originally for the European Hands- On Universe (EU-HOU) project. It is designed to be easy to install and use. It allows students to
Photoshop Elements 3 Brightness and Contrast
 Photoshop Elements 3 Brightness and Contrast Exposure When you shoot a picture the lighting is not always ideal, so pictures sometimes may be underor overexposed. A well-exposed image will have a good
Enhancement of Multispectral Images and Vegetation Indices
 Enhancement of Multispectral Images and Vegetation Indices ERDAS Imagine 2016 Description: We will use ERDAS Imagine with multispectral images to learn how an image can be enhanced for better interpretation.
G1 THE NATURE OF EM WAVES AND LIGHT SOURCES
 G1 THE NATURE OF EM WAVES AND LIGHT SOURCES G2 OPTICAL INSTRUMENTS HW/Study Packet Required: READ Tsokos, pp 598-620 SL/HL Supplemental: Hamper, pp 411-450 DO Questions p 605 #1,3 pp 621-623 #6,8,15,18,19,24,26
Human Retina. Sharp Spot: Fovea Blind Spot: Optic Nerve
 I am Watching YOU!! Human Retina Sharp Spot: Fovea Blind Spot: Optic Nerve Human Vision Optical Antennae: Rods & Cones Rods: Intensity Cones: Color Energy of Light 6 10 ev 10 ev 4 1 2eV 40eV KeV MeV Energy
Master digital black and white conversion with our Photoshop plug-in. Black & White Studio plug-in - Tutorial
 Master digital black and white conversion with our Photoshop plug-in This Photoshop plug-in turns Photoshop into a digital darkroom for black and white. Use the light sensitivity of films (Tri-X, etc)
2. Pixels and Colors. Introduction to Pixels. Chapter 2. Investigation Pixels and Digital Images
 2. Pixels and Colors Introduction to Pixels The term pixel is a truncation of the phrase picture element which is exactly what a pixel is. A pixel is the smallest block of color in a digital picture. The
The human visual system
 The human visual system Vision and hearing are the two most important means by which humans perceive the outside world. 1 Low-level vision Light is the electromagnetic radiation that stimulates our visual
SBIG ASTRONOMICAL INSTRUMENTS
 SBIG ASTRONOMICAL INSTRUMENTS SANTA BARBARA INSTRUMENT GROUP 147-A Castilian Drive Santa Barbara, CA 93117 Phone (805) 571-SBIG (571-7244) FAX (805) 571-1147 e-mail:sbig@sbig.com home page:www.sbig.com
Color Management User Guide
 Color Management User Guide Edition July 2001 Phase One A/S Roskildevej 39 DK-2000 Frederiksberg Denmark Tel +45 36 46 01 11 Fax +45 36 46 02 22 Phase One U.S. 24 Woodbine Ave Northport, New York 11768
Master digital black and white conversion with our Photoshop plug-in. Black & White Studio plug-in - Tutorial
 Master digital black and white conversion with our Photoshop plug-in This Photoshop plug-in turns Photoshop into a digital darkroom for black and white. Use the light sensitivity of films (Tri-X, etc)
An Introduction to Histograms in Photography
 An Introduction to Histograms in Photography Histograms are a graphical representation of all the pixels that make up an image, and are plotted by 'Luminance' or brightness. Every pixel, regardless of
UNIVERSITY COLLEGE LONDON Department of Physics and Astronomy. An Introduction to Image Processing
 UNIVERSITY COLLEGE LONDON Department of Physics and Astronomy UCL Observatory PHAS2130 2015 16.2 An Introduction to Image Processing 1 Introduction Students will have submitted imaging requests to the
When you shoot a picture the lighting is not always ideal, so pictures sometimes may be underor overexposed.
 GIMP Brightness and Contrast Exposure When you shoot a picture the lighting is not always ideal, so pictures sometimes may be underor overexposed. A well-exposed image will have a good spread of tones
Exercise 4-1 Image Exploration
 Exercise 4-1 Image Exploration With this exercise, we begin an extensive exploration of remotely sensed imagery and image processing techniques. Because remotely sensed imagery is a common source of data
10.2 Color and Vision
 10.2 Color and Vision The energy of light explains how different colors are physically different. But it doesn't explain how we see colors. How does the human eye see color? The answer explains why computers
PHY385H1F Introductory Optics. Practicals Session 7 Studying for Test 2
 PHY385H1F Introductory Optics Practicals Session 7 Studying for Test 2 Entrance Pupil & Exit Pupil A Cooke-triplet consists of three thin lenses in succession, and is often used in cameras. It was patented
Colorimetry and Color Modeling
 Color Matching Experiments 1 Colorimetry and Color Modeling Colorimetry is the science of measuring color. Color modeling, for the purposes of this Field Guide, is defined as the mathematical constructs
Introduction to Radio Astronomy
 Introduction to Radio Astronomy The Visible Sky, Sagittarius Region 2 The Radio Sky 3 4 Optical and Radio can be done from the ground! 5 Outline The Discovery of Radio Waves Maxwell, Hertz and Marconi
Digital Image Processing
 Digital Image Processing 6. Color Image Processing Computer Engineering, Sejong University Category of Color Processing Algorithm Full-color processing Using Full color sensor, it can obtain the image
Unit 2: Smiley Basics Student Guide. Derek Dennis
 Unit 2: Smiley Basics Student Guide Derek Dennis KENAN FELLOWS PROJECT 2010 Smiley Basics Student Guide 2010 Edition Student: Teacher: Class Period: Unit 2: Smiley Basics Student Guide 1 Table of Contents
CHAPTER1: QUICK START...3 CAMERA INSTALLATION... 3 SOFTWARE AND DRIVER INSTALLATION... 3 START TCAPTURE...4 TCAPTURE PARAMETER SETTINGS... 5 CHAPTER2:
 Image acquisition, managing and processing software TCapture Instruction Manual Key to the Instruction Manual TC is shortened name used for TCapture. Help Refer to [Help] >> [About TCapture] menu for software
COLOR and the human response to light
 COLOR and the human response to light Contents Introduction: The nature of light The physiology of human vision Color Spaces: Linear Artistic View Standard Distances between colors Color in the TV 2 How
Digital Image Processing
 Digital Image Processing Lecture # 3 Digital Image Fundamentals ALI JAVED Lecturer SOFTWARE ENGINEERING DEPARTMENT U.E.T TAXILA Email:: ali.javed@uettaxila.edu.pk Office Room #:: 7 Presentation Outline
Create A Starry Night Sky In Photoshop
 Create A Starry Night Sky In Photoshop Written by Steve Patterson. In this Photoshop effects tutorial, we ll learn how to easily add a star-filled sky to a night time photo. I ll be using Photoshop CS5
ECEN 4606, UNDERGRADUATE OPTICS LAB
 ECEN 4606, UNDERGRADUATE OPTICS LAB Lab 2: Imaging 1 the Telescope Original Version: Prof. McLeod SUMMARY: In this lab you will become familiar with the use of one or more lenses to create images of distant
Viewing Landsat TM images with Adobe Photoshop
 Viewing Landsat TM images with Adobe Photoshop Reformatting images into GeoTIFF format Of the several formats in which Landsat TM data are available, only a few formats (primarily TIFF or GeoTIFF) can
ImagesPlus Basic Interface Operation
 ImagesPlus Basic Interface Operation The basic interface operation menu options are located on the File, View, Open Images, Open Operators, and Help main menus. File Menu New The New command creates a
Index of Command Functions
 Index of Command Functions version 2.3 Command description [keyboard shortcut]:description including special instructions. Keyboard short for a Windows PC: the Control key AND the shortcut key. For a MacIntosh:
Using the D810A DSLR for Deep Space and Nebulae Astrophotography
 JANUARY 10, 2018 ADVANCED Using the D810A DSLR for Deep Space and Nebulae Astrophotography Featuring JOHANNES SCHEDLER, TOSHIO USHIYAMA & TAKAYUKI YOSHIDA Johannes Schedler Eta Carina Nebula Nebula Telescope:
Experiment 10. Color. Observe the transmission properties of the three additive primary color filters and the three subtractive primary color filters.
 Experiment 10 Color 10.1 Objectives Observe the transmission properties of the three additive primary color filters and the three subtractive primary color filters. Observe and interpret the color sensations
PHY385H1F Introductory Optics Term Test 2 November 6, 2012 Duration: 50 minutes. NAME: Student Number:.
 PHY385H1F Introductory Optics Term Test 2 November 6, 2012 Duration: 50 minutes NAME: Student Number:. Aids allowed: A pocket calculator with no communication ability. One 8.5x11 aid sheet, written on
Correction Techniques
 10 Advanced Color Correction Techniques Learning Objectives After completing this chapter, you will be able to: Explain how a computer monitor displays color. Describe how color is created in the printing
Understand brightness, intensity, eye characteristics, and gamma correction, halftone technology, Understand general usage of color
 Understand brightness, intensity, eye characteristics, and gamma correction, halftone technology, Understand general usage of color 1 ACHROMATIC LIGHT (Grayscale) Quantity of light physics sense of energy
[4] (b) Fig. 6.1 shows a loudspeaker fixed near the end of a tube of length 0.6 m. tube m 0.4 m 0.6 m. Fig. 6.
![[4] (b) Fig. 6.1 shows a loudspeaker fixed near the end of a tube of length 0.6 m. tube m 0.4 m 0.6 m. Fig. 6.](/thumbs/82/84801740.jpg "[4] (b) Fig. 6.1 shows a loudspeaker fixed near the end of a tube of length 0.6 m. tube m 0.4 m 0.6 m. Fig. 6.") 1 (a) Describe, in terms of vibrations, the difference between a longitudinal and a transverse wave. Give one example of each wave.................... [4] (b) Fig. 6.1 shows a loudspeaker fixed near the
1 (a) Describe, in terms of vibrations, the difference between a longitudinal and a transverse wave. Give one example of each wave.................... [4] (b) Fig. 6.1 shows a loudspeaker fixed near the
Black (and White) Magic
 Magic") Black (and White) Magic Close your eyes, take a deep breath, and imagine a future where you no longer shoot both color and black and white images. Instead, you capture only color. Then, following the shoot,
Black (and White) Magic Close your eyes, take a deep breath, and imagine a future where you no longer shoot both color and black and white images. Instead, you capture only color. Then, following the shoot,
Measuring Methods of Blue-light Reduced Visual Display Terminal. China NC
 Measuring Methods of Blue-light Reduced Visual Display Terminal China NC 2017.04 Content 1 Background Blue-light hazard 2 The necessity of blue-light reduced Visual Display Terminal standards 3 Blue-light
Chapter 16 Light Waves and Color
 Chapter 16 Light Waves and Color Lecture PowerPoint Copyright The McGraw-Hill Companies, Inc. Permission required for reproduction or display. What causes color? What causes reflection? What causes color?
COLOR. and the human response to light
 COLOR and the human response to light Contents Introduction: The nature of light The physiology of human vision Color Spaces: Linear Artistic View Standard Distances between colors Color in the TV 2 Amazing
Assignment: Light, Cameras, and Image Formation
 Assignment: Light, Cameras, and Image Formation Erik G. Learned-Miller February 11, 2014 1 Problem 1. Linearity. (10 points) Alice has a chandelier with 5 light bulbs sockets. Currently, she has 5 100-watt
the eye Light is electromagnetic radiation. The different wavelengths of the (to humans) visible part of the spectra make up the colors.
 visible part of the spectra make up the colors.") Computer Assisted Image Analysis TF 3p and MN1 5p Color Image Processing Lecture 14 GW 6 (suggested problem 6.25) How does the human eye perceive color? How can color be described using mathematics? Different
Computer Assisted Image Analysis TF 3p and MN1 5p Color Image Processing Lecture 14 GW 6 (suggested problem 6.25) How does the human eye perceive color? How can color be described using mathematics? Different
Using QuickBird Imagery in ESRI Software Products
 Using QuickBird Imagery in ESRI Software Products TABLE OF CONTENTS 1. Introduction...2 Purpose Scope Image Stretching Color Guns 2. Imagery Usage Instructions...4 ArcView 3.x...4 ArcGIS...7 i Using QuickBird
PixInsight Workflow. Revision 1.2 March 2017
 Revision 1.2 March 2017 Contents 1... 1 1.1 Calibration Workflow... 2 1.2 Create Master Calibration Frames... 3 1.2.1 Create Master Dark & Bias... 3 1.2.2 Create Master Flat... 5 1.3 Calibration... 8
Module All You Ever Need to Know About The Displace Filter
 Module 02-05 All You Ever Need to Know About The Displace Filter 02-05 All You Ever Need to Know About The Displace Filter [00:00:00] In this video, we're going to talk about the Displace Filter in Photoshop.
Picture Style Editor Ver Instruction Manual
 ENGLISH Picture Style File Creating Software Picture Style Editor Ver. 1.18 Instruction Manual Content of this Instruction Manual PSE stands for Picture Style Editor. In this manual, the windows used in
Colour. Why/How do we perceive colours? Electromagnetic Spectrum (1: visible is very small part 2: not all colours are present in the rainbow!
 Colour What is colour? Human-centric view of colour Computer-centric view of colour Colour models Monitor production of colour Accurate colour reproduction Colour Lecture (2 lectures)! Richardson, Chapter
Lab 1: Introduction to MODIS data and the Hydra visualization tool 21 September 2011
 WMO RA Regional Training Course on Satellite Applications for Meteorology Cieko, Bogor Indonesia 19-27 September 2011 Kathleen Strabala University of Wisconsin-Madison, USA kathy.strabala@ssec.wisc.edu
Mod. 2 p. 1. Prof. Dr. Christoph Kleinn Institut für Waldinventur und Waldwachstum Arbeitsbereich Fernerkundung und Waldinventur
 Histograms of gray values for TM bands 1-7 for the example image - Band 4 and 5 show more differentiation than the others (contrast=the ratio of brightest to darkest areas of a landscape). - Judging from
Photoshop Techniques Digital Enhancement
 Photoshop Techniques Digital Enhancement A tremendous range of enhancement techniques are available to anyone shooting astrophotographs if they have access to a computer and can digitize their images.
These aren t just cameras
 Roger Easley 2016 These aren t just cameras These are computers. Your camera is a specialized computer Creates files of data Has memory Has a screen display Has menus of options for you to navigate Your
Exploring the Earth with Remote Sensing: Tucson
 Exploring the Earth with Remote Sensing: Tucson Project ASTRO Chile March 2006 1. Introduction In this laboratory you will explore Tucson and its surroundings with remote sensing. Remote sensing is the
Feasibility and Design for the Simplex Electronic Telescope. Brian Dodson
 Feasibility and Design for the Simplex Electronic Telescope Brian Dodson Charge: A feasibility check and design hints are wanted for the proposed Simplex Electronic Telescope (SET). The telescope is based
Image optimization guide
 Image Optimization guide for Image Submittal Images can play a crucial role in the successful execution of a book project by enhancing the text and giving the reader insight into your story. Although your
LECTURE 07 COLORS IN IMAGES & VIDEO
 MULTIMEDIA TECHNOLOGIES LECTURE 07 COLORS IN IMAGES & VIDEO IMRAN IHSAN ASSISTANT PROFESSOR LIGHT AND SPECTRA Visible light is an electromagnetic wave in the 400nm 700 nm range. The eye is basically similar
Translating the Actual into a Digital Photographic Language Working in Grayscale
 Translating the Actual into a Digital Photographic Language Working in Grayscale Overview Photographs are informed by considered and intentional choices. These choices are suggested by a need or desire
Practical work no. 3: Confocal Live Cell Microscopy
 Practical work no. 3: Confocal Live Cell Microscopy Course Instructor: Mikko Liljeström (MIU) 1 Background Confocal microscopy: The main idea behind confocality is that it suppresses the signal outside
Image Enhancement (from Chapter 13) (V6)
 (V6)") Image Enhancement (from Chapter 13) (V6) Astronomical images often span a wide range of brightness, while important features contained in them span a very narrow range of brightness. Alternatively, interesting
Image Enhancement (from Chapter 13) (V6) Astronomical images often span a wide range of brightness, while important features contained in them span a very narrow range of brightness. Alternatively, interesting
excite the cones in the same way.
 Humans have 3 kinds of cones Color vision Edward H. Adelson 9.35 Trichromacy To specify a light s spectrum requires an infinite set of numbers. Each cone gives a single number (univariance) when stimulated
PHYSICAL SCIENCE. Investigating. Critical-Thinking Activities
 Investigating PHYSICAL SCIENCE Critical-Thinking Activities Differentiated Activities Higher-Order Thinking-Skill Activities Interdisciplinary Activities Written by Jim McAlpine, Betty Weincek, Sue Jeweler,
Work environment. Retina anatomy. A human eyeball is like a simple camera! The way of vision signal. Directional sensitivity. Lighting.
 Eye anatomy Work environment Lighting 1 2 A human eyeball is like a simple camera! Sclera: outer walls, hard like a light-tight box. Cornea and crystalline lens (eyelens): the two lens system. Retina:
Comparing Sound and Light. Light and Color. More complicated light. Seeing colors. Rods and cones
 Light and Color Eye perceives EM radiation of different wavelengths as different colors. Sensitive only to the range 4nm - 7 nm This is a narrow piece of the entire electromagnetic spectrum. Comparing
Digital Image Processing
 Digital Image Processing IMAGE PERCEPTION & ILLUSION Hamid R. Rabiee Fall 2015 Outline 2 What is color? Image perception Color matching Color gamut Color balancing Illusions What is Color? 3 Visual perceptual
Introduction. The Spectral Basis for Color
 Introduction Color is an extremely important part of most visualizations. Choosing good colors for your visualizations involves understanding their properties and the perceptual characteristics of human
Capturing Light in man and machine. Some figures from Steve Seitz, Steve Palmer, Paul Debevec, and Gonzalez et al.
 Capturing Light in man and machine Some figures from Steve Seitz, Steve Palmer, Paul Debevec, and Gonzalez et al. 15-463: Computational Photography Alexei Efros, CMU, Fall 2005 Image Formation Digital
Color vision and representation
 Color vision and representation S M L 0.0 0.44 0.52 Mark Rzchowski Physics Department 1 Eye perceives different wavelengths as different colors. Sensitive only to 400nm - 700 nm range Narrow piece of the
Color Reproduction. Chapter 6
 Chapter 6 Color Reproduction Take a digital camera and click a picture of a scene. This is the color reproduction of the original scene. The success of a color reproduction lies in how close the reproduced
Preparing Images For Print
 Preparing Images For Print The aim of this tutorial is to offer various methods in preparing your photographs for printing. Sometimes the processing a printer does is not as good as Adobe Photoshop, so
Colour. Electromagnetic Spectrum (1: visible is very small part 2: not all colours are present in the rainbow!) Colour Lecture!
 Colour Lecture!") Colour Lecture! ITNP80: Multimedia 1 Colour What is colour? Human-centric view of colour Computer-centric view of colour Colour models Monitor production of colour Accurate colour reproduction Richardson,
Colour Lecture! ITNP80: Multimedia 1 Colour What is colour? Human-centric view of colour Computer-centric view of colour Colour models Monitor production of colour Accurate colour reproduction Richardson,
Future Electronics EZ-Color Seminar. Autumn Colour Technology
 Polymer Optics Ltd. 6 Kiln Ride, Wokingham Berks, RG40 3JL, England Tel/Fax:+44 (0)1189 893341 www.polymer-optics.co.uk Future Electronics EZ-Color Seminar Autumn 2007 Colour Technology Mike Hanney Technical
Lecture 8. Color Image Processing
 Lecture 8. Color Image Processing EL512 Image Processing Dr. Zhu Liu zliu@research.att.com Note: Part of the materials in the slides are from Gonzalez s Digital Image Processing and Onur s lecture slides
Mastery. Chapter Content. What is light? CHAPTER 11 LESSON 1 C A
 Chapter Content Mastery What is light? LESSON 1 Directions: Use the letters on the diagram to identify the parts of the wave listed below. Write the correct letters on the line provided. 1. amplitude 2.
Ph 3455 The Photoelectric Effect
 Ph 3455 The Photoelectric Effect Required background reading Tipler, Llewellyn, section 3-3 Prelab Questions 1. In this experiment you will be using a mercury lamp as the source of photons. At the yellow
Period 3 Solutions: Electromagnetic Waves Radiant Energy II
 Period 3 Solutions: Electromagnetic Waves Radiant Energy II 3.1 Applications of the Quantum Model of Radiant Energy 1) Photon Absorption and Emission 12/29/04 The diagrams below illustrate an atomic nucleus