WFC3 SMOV Program 11433: IR Internal Flat Field Observations
|
|
|
- Alice George
- 5 years ago
- Views:
Transcription
 for Program")
1 Instrument Science Report WFC WFC3 SMOV Program 11433: IR Internal Flat Field Observations B. Hilbert 27 October 2009 ABSTRACT We have analyzed the internal flat field behavior of the WFC3/IR channel using data obtained during the Servicing Mission Observatory Verification (SMOV) for Program The detector was illuminated to a high signal level through each filter using the Tungsten 2 lamp. Comparison of the resulting flat field images to those collected during ground testing reveals similar illumination patterns, and an increase in the Tungsten lamp flux of 6-10%. Signal rates show that the lamp s irradiance was constant to within 0.5% during these observations. These data show that the on-orbit internal flats can be used to update the calibration flat field images. Roughly 30% of the observations associated with this proposal were contaminated by a light leak while HST was pointed at the Earth. There is currently no strategy aimed at mitigating the effects of this light leak. Introduction Testing of the cooled WFC3/IR detector began in mid-june 2009, after installation of WFC3 in HST during the May 2009 servicing mission. Program 11433, IR Internal Flat Field Observations executed between July 12 and 21, All data were obtained with in full-frame mode with MEB2 as usual, using Science Mission Specifications (SMSs), i.e. no real time commanding. The temperature of the IR detector was C (145.1 K) and constant to within 0.2 o C throughout the observations. All data were obtained at the 1
2 nominal 2.5 e - /ADU setting. Gain values used for subsequent data reduction were derived from SMOV data taken as part of the IR Functional Test (proposal 11420). Details are given in Hilbert and McCullough (2009b). Gain values for the four quadrants (following the usual convention of quadrant 1 in the upper left, with quad numbers increasing in the counter-clockwise direction) are 2.33, 2.28, 2.45, and 2.47 e - /ADU. Data Each of the 50 Visits in this proposal collected flat field data through one or more filters. The program as a whole acquired data through all 15 IR filters. Tungsten lamp #2 was used as the illumination source for all ramps. The exposure time for each filter was set to allow each pixel to collect a total of 60,000 65,000 e -. Table 4 in Appendix 1 lists all the files obtained for this program. All data were reduced using CALWF3 version Basic data reduction steps included reference pixel subtraction, zeroth read subtraction, cosmic ray rejection, and non-linearity correction. We made one change to the default behavior of CALWF3 when processing these data: we set the UNITCORR keyword to PERFORM rather than the default value of OMIT, which is normally used to process dark current ramps.. This causes the output *flt.fits files to be in units of ADU/sec and have values that are normalized to the appropriate exposure time for each pixel. If UNITCORR is set to OMIT the *flt.fits files are output in units of ADU and each pixel contains the signal value of the final unrejected read. This leads to an image where each pixel s exposure time is different, which is not useful for analysis purposes. Tables 5 and 6 in Appendix 1 list the reference files used by CALWF3 for its processing steps. As with the IR dark current data (Hilbert and McCullough, 2009a), some of the images were affected by a light leak in the IR channel. The details of the light leak are discussed below. Affected files are identified in Table 4, and were not used for this analysis. Other files, not predicted to contain a light leak, had a non-nominal appearance suggestive of an extraneous light source. These files are also identified in Table 4 and were excluded from further analysis. SMOV internal flats appear qualitatively identical to ground flats, as can be seen in Figures 1 and 2. An uncontaminated on-orbit flat field image is shown in Figure 1, and comparable ground flat field image shown in Figure 2. The average brightness is higher in the on-orbit flat compared to that from the ground. This effect is discussed below. Figures 3 and 4 show the same flat field images with a histogram equalization stretch. Again, the flat fields appear qualitatively very similar. There is however a small change in the illumination pattern between the two. This change is most visible in the upper right quadrant, where the size of the black region in the corner was smaller during ground testing than in SMOV. This slight (~20-pixel) leftward shift in the illumination pattern is due to an update of the IR corrector position made after launch. Ratios of SMOV to TV3 2

3 flat field images, shown in the Analysis section below, highlight the changes in the illumination around the edges of the detector. Figure 1: F140W flat field. Figure is a linear stretch from 700 to 2100 e-/sec. Note the familiar features of the wagon wheel in the lower right corner, as well as the death star along the bottom edge. Figure 2: F140W flat field image taken during TV3 testing. The stretch is identical to that in the figure at left. Note that various features in the flat are identical between ground testing and SMOV, but that the flat taken during SMOV is brighter overall. This is due to an on-orbit brightening of the tungsten lamp, discussed below. Figure 3: Histogram equalization stretch of the SMOV flat field image shown above. Figure 4: Histogram equalization stretch of the TV3 flat field shown above. Note the slight shift of the illumination pattern to the left when compared to the image at left. The shift is most noticeable in the upper right corner, where the black region above is smaller than in the SMOV figure at left. 3


4 Analysis Light Leak Figures 5 and 6 show examples of the light leak in IR flat fields through the F105W and F139M filters. These images are both ratios of a single light leak-contaminated flat field to a median uncontaminated flat field, in order to accentuate the appearance of the extra light. Images such as these indicate that the light leak contributes an extra 1% - 4% above the nominal Tungsten lamp flux in the affected areas. The morphology of the light leak was filter-dependent. See Appendix 2 for a gallery of light leak images through all filters. Figure 5: Ratio image showing light leak through the F105W filter. Figure 6: Ratio image showing light leak through the F139M filter. The source of the light leak in these data appears to be similar to that identified in the dark current data from proposals and (Hilbert and McCullough, 2009a, 2009b). When HST is pointed at the day side of the Earth, a significant number of photons find their way to the IR detector. The light leak onto the dark current images was stopped by placing the channel select mechanism (CSM) in the UVIS position, thereby directing any extraneous light toward the UVIS detector. However, when IR internal flats are taken, the CSM is already close to the UVIS position. This is because the diffuser paddle, which directs the Tungsten lamp light onto the IR detector, is located on the same mechanism as the CSM and must be in the IR beam to direct tungsten lamp 4

5 illumination onto the IR detector. See Figure 7 for a drawing of the relative positions of the CSM, diffuser paddle, and IR detector. Figure 7: Schematic optical layout of WFC3 from its Instrument Handbook. By placing the channel select mechanism very close to the UVIS position, the diffuser paddle enters the IR channel light path and redirects the illumination from the Tungsten lamp onto the IR detector. As with the IR dark current data, we used our knowledge of HST s orientation at the beginning of each exposure to predict whether that observation was potentially contaminated by a light leak due to pointing at the day side of the Earth. See Figure 6 in Hilbert and McCullough (2009b) for an example of the bright Earth plot used to predict the HST s orientation over the course of an exposure. While light leaks were present in almost all of the images predicted by the bright Earth plots, we also found other images with non-nominal appearances. These images are identified in Table 4. According to the bright Earth plots, HST was not pointed at the day side of the Earth for these exposures. However, when compared to uncontaminated files, these images displayed abnormally bright or dark areas on the detector. The source of the light leak remains unidentified. Figures 8 and 9 show two examples. These contaminated images were also ignored in subsequent analyses. Figure 8 shows an F140W flat field with an unexpected appearance. The upper left and right corners of the detector appear darker than expected and the wagon wheel in the lower right corner shows an extended, darker area around a brighter area. The white streak on the left side of the detector is persistence from an earlier observation. Figure 9 shows an even stranger flat field image ratio. In this case, using the F127M filter, we see a dark area extending from the upper left corner across most of the top half 5


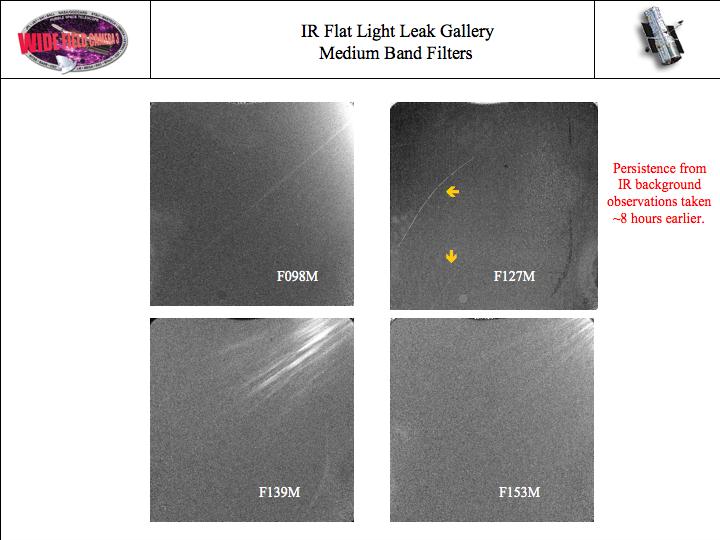
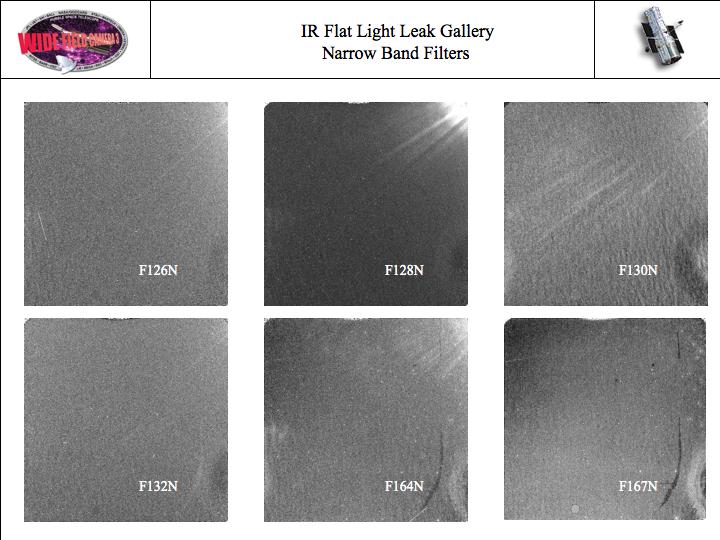
6 of the detector, while the bottom edge of the detector appears brighter than normal. The wagon wheel in this case appears as a bright area extending around a darker core, opposite to that in the F140W image. Also, the dark vertical streak on the right side of the detector is very prominent. For both images, HST was supposedly over twilight or the night side of the Earth and pointed away from the Earth, suggesting that contamination from a light leak should not occur. Light leak or non-nominal appearance suggestive of light leak affected roughly 30% of the ramps in this proposal. At the moment, there is no mitigation strategy for future observations, neither through scheduling nor a mechanical fix such as that used to fix the IR dark current light leak (Hilbert and McCullough 2009a). Figure 8: Ratio image of an F140W flat field to the mean F140W flat field. This image was taken while HST was above an area of the Earth in twilight and pointed away from Earth. The image is a histogram equalization stretch between 0.9 (black) and 1.1 (white). Note the slight darkening of the upper left and upper right. The white streak on the left is a persistence image from a previous observation. The wagon wheel also extends far out into quadrant 3. Figure 9: Ratio image of a single F127M flat field to the mean F127M flat field. This image was taken while HST was above the night side of the Earth, and pointed away from the Earth. The image is a histogram equalization stretch between 0.9 (black) and 1.1 (white). Note the opposite appearance of the wagon wheel (lower right corner) in this image compared to that in the figure at left, as well as the much deeper darkening of the upper half of the detector. Other features not usually visible in ratio images are also apparent. 6
.")
7 Bias Level Our first analysis task was to monitor the bias level of all ramps, in order to search for any patterns. We obtained a measure of the bias level of each ramp by calculating the sigma-clipped mean in the reference pixels of the zeroth read of each ramp. This was done prior to any CALWF3 processing (i.e. on raw ramps). Since we were working only with reference pixels, which are not light sensitive and should not be affected by light leak, we used all 215 ramps for this analysis. Figure 10 shows a plot of this mean bias level in quadrant 1 for all ramps. Visits are plotted in alternating blue and red points, for clarity. The mean bias level in quadrant 1 changes by roughly 25 electrons over the course of the observations. Figure 11 shows the mean bias level over four different Visits. Similar to what was seen in the dark current analysis (Hilbert and McCullough, 2009b), there is a repeating trend of bias level decreasing over the course of each Visit. We also see that the bias variation is repeatable. Visits 1 and 15 in Figure 11 (blue) were separated by 27 hours, and contain an identical sequence of six ramps. The exposure times for these six ramps, in order, are 43, 53, 903, 43 and 203 seconds. In Figure 11 we see the largest decrease in bias level after the third ramp, with its 903-second exposure time. Visits 8 and 22 (red), separated by 64 hours, are also identical to one another, and contain the same six ramps as Visits 1 and 15, but in a different order. Once again, the largest decrease in mean bias level comes after the third ramp, which also has an exposure time of 903 seconds. Figure 10: Mean bias level for all ramps. Visits are plotted in alternating colors for clarity. Figure 11: Mean signal in the zeroth read reference pixels of quadrant 1 for four Visits. In terms of the filters and sample sequences used Visits 1 and 15 were identical to one another. Visits 8 and 22 were also identical to one another. Note the similar pattern in bias level within the identical pairs of Visits. 7
8 Investigating this trend further, we produced the plot shown in Figure 12. This shows the mean bias level in each ramp, plotted against the exposure time of the immediately preceding ramp. There is the suggestion of a downward trend, shown by the red, best-fit line produced with the IDL Astronomy Library s robust_linefit.pro. This plot, along with those in Figures 10 and 11, suggests that the exposure time and sample sequence used for a particular ramp can affect the bias level in the following exposure. Generally, shorter exposure times will lead to higher bias levels. As the same number of detector readouts is packed into a shorter exposure time, the FPA or the detector electronics heat up, which causes an increase in the mean bias level of the detector. The reason that the bias level is high at the beginning of each Visit is because the IR detector is in auto-flush mode prior to the start of the first exposure. This continually removes accumulating charge from the detector, and is a similar operation to reading out the detector, except that the signal is not saved. This action heats the electronics, resulting in a higher bias level. Conversely, during a 903-second ramp, the detector electronics have time to cool, resulting in a lower bias level at the beginning of the next exposure. A similar effect has been observed in NICMOS data, to the point that bias levels in NICMOS data can be used to calculate the detector temperatures (Pirzkal, 2009). Further investigation may reveal that a similar analysis can be used to calculate the temperature of the WFC3-IR detector. Figure 12: Mean bias level versus exposure time of the immediately preceding ramp. The hint of a trend suggests that heating of the FPA or electronics associated with reading out the array increases the bias level of the detector. Unlike NICMOS, the WFC3 IR detector has reference pixels which track the bias level in each read of the detector. Using these reference pixels, CALWF3 corrects each 8
9 read of the WFC3 IR detector for the changing bias level. This implies that while the varying bias level presented above is an interesting detector effect, it should not affect science observations as long as reference pixel subtraction is performed, and will in fact be invisible to users unless the raw files are examined. Signal Rate After identifying the non-nominal flat field images noted in Table 4, our next task was to create a mean flat field for each filter. Using the processed uncontaminated data, we calculated the sigma-clipped mean value on a pixel-by-pixel basis in order to create the mean flat field images. Table 1 lists the sigma-clipped mean signal rate in each mean flat field. In order to compare these signal rates to those measured on the ground we calculated the ratio of the SMOV median flat field to that from TV3 for each filter. We then created a histogram of the ratio for all pixels and fit a Gaussian to the distribution in order to locate the peak ratio value. The peak values are shown in the right-most column of Table 1 and indicate 6% - 10% higher signal rates in SMOV than during TV3. This implies an on-orbit brightening of the Tungsten 2 lamp relative to the ground, in agreement with results from UVIS flat field data (Baggett et al, 2009). Filter Mean Signal Ratio to TV3 (e - /sec/pixel) F098M F105W F110W F125W F126N F127M F128N F130N F132N F139M F140W F153M F160W F164N F167N Table 1: Robust mean signal levels from mean uncontaminated flat field image in each filter, along with a comparison of this mean level to that measured in TV3. 9
10 Given the change in lamp brightness between the time of ground testing and SMOV, we also searched for variations in the lamp brightness over shorter timescales. For each filter, we calculated the 3-sigma clipped mean signal rate in each of the individual flt files used to create the mean flat fields. Figures 13 and 14 show the mean measured signal rate in all flt files for F105W and F139M. The black dashed line shows the mean signal level. The scatter in these plots is typical of that for all filters. Figure 13: Variation in lamp brightness from the mean for all F105W observations. Figure 14: Variation in lamp brightness from the mean for all F139M observations. From the calculated mean signal in individual flats, we see no overall trend in lamp light with time. In all but one image of the 215-image dataset, the variation in measured signal rate is less than 1% of the mean rate. Table 2 lists the standard deviation of the signal variations in each filter, along with the maximum signal variation above and below the mean, in units of percentage of the mean signal. For example, from Figure 13, we see that the maximum deviations from the mean signal are about 0.4% above the mean, and 0.5% below the mean. The standard deviation of all signal levels shown in Figure 13 is 0.3%. As can be seen in Table 2, in general and especially in the wide band filters, the larger deviations from the mean signal levels were negative, i.e. less illumination than the mean. Sigma-clipped mean signal rates for each file were calculated using all science pixels on the detector. This implies a formal uncertainty on the mean values of ~0.001% from Poisson noise and read noise. Therefore, the variations shown in Table 2 should represent true changes in the tungsten lamp output. These values show that the lamp output flux was constant to within 1% for the duration of these observations. Photometric uncertainties in the IR channel will therefore be dominated by other sources. 10
11 Filter Sigma clipped stdev (%) Max Variation Below Mean(%) Max Variation Above Mean(%) F098M F105W F110W F125W F126N F127M F128N F130N F132N F139M F140W F153M F160W F164N F167N Table 2: Variations in lamp brightness relative to the mean signal level for all filters. The second column shows the sigma-clipped standard deviation of the lamp brightness relative to the mean signal rate. The third and fourth columns list the most extreme variation in lamp brightness below and above the mean rate, respectively. These values are also presented relative to the mean signal level of the lamp for each filter s observations. Comparison to TV3 Internal Flats As seen in Table 1, the mean illumination level from the tungsten lamp increased between TV3 and SMOV. Beyond this change, we also wished to search for any other changes in illumination characteristics. Figures 15 and 16 show ratio images of mean SMOV to TV3 internal flat fields for F098M and F153M respectively. Visible features in these ratio images include dark upper and lower right corners, and bright upper and lower left corners. These are due to the change in the IR corrector position, as discussed in the Data section above. This change shifted the illumination pattern from the tungsten lamp to the left on the detector by ~20 pixels, as evidenced by the dark corners on the right side of the ratio image, and the bright corners on the left. The small collection of dark pixels in the center of the top edge of the ratio images contains unstable, low-qe and dead pixels. Small changes in the illumination level between TV3 and SMOV therefore result in large fractional changes in measured signal, causing these pixels to appear dark in the ratio images. 11
. Ignoring the large brightness differences in the corners, the mottling in the image represents fluctuations in the ratio of between 1% and 2% (~1.06 to ~1.08).")
12 Figure 15: Ratio of F098M, Visit 11 image to mean TV3 F098M flat. Range is to (black to white). Figure 16: Ratio of F153M, Visit 15 image to mean TV3 F153M flat. Range is to (black to white). Ignoring the large brightness differences in the corners, the mottling in the image represents fluctuations in the ratio of between 1% and 2% (~1.06 to ~1.08). Figure 17: Histogram of the ratio image shown in Figure 15. Figure 18: Histogram of the ratio image shown in Figure
13 Figures 17 and 18 show histograms of the ratio images presented in Figures 14 and 15, respectively. The peak values of the histograms correspond to the values shown in Table 1. The general shape of the histograms was the same for all filters. Table 3 lists the range of values observed in the ratio of SMOV flats to the mean internal flat fields collected in TV3 testing. Min and Max values are the ratio values where the histogram (such as that shown in Figure 17) falls to 1% of the maximum level. Filter Min Mean Max F098M F105W F110W F125W F126N F127M F128N F130N F132N F139M F140W F153M F160W F164N F167N Table 3: Ratio values of SMOV internal flat fields versus the mean internal flat fields in TV3. Min and max values are the ratio values where the histogram falls to 1% of its maximum height. Bad Pixels With the detector well illuminated by the tungsten lamp, we looked for dead pixels. For this, we used the mean flat field images created for all filters. We searched all 15 mean flat fields, and marked as dead only those pixels with a signal rate less than or equal to 0 e-/sec in every flat field. From this search, we found 49 dead pixels on the IR detector. Repeating the search on a subset of internal flat fields from TV3 revealed the same 49 pixels as dead. Conclusions The IR Channel in WFC3 during SMOV performs essentially as it did during TV3. The internal flat field illumination pattern is very close to that observed in ground testing, with the exception that the tungsten lamp has increased in brightness by 6-10%, depending on the filter used in the observation. The dead pixel population also appears stable. Despite the observing efficiency decrease due to light leak, IR channel internal 13
14 flat field observations are suitable for generating delta flat field calibration files, should it be found that the calibration flat field images derived from ground testing are in need of modification. As was seen in SMOV dark current data, the bias level of the IR channel changes depending on observation history. However, the reference pixels successfully remove bias level variations. Unresolved Issues The IR channel does exhibit a light leak when taking flat field images and pointed at the day side of the Earth. During Cycle 17, the CSM will be placed in the UVIS position when taking darks, but currently, there is no mitigation strategy for light leaks contaminating flat fields. Future WFC3 calibration programs that collect internal flat field data should expect to have up to 30% of their flat fields contaminated by the light leak. References Baggett, S., E. Sabbi, P. McCullough, WFC3 SMOV Program 11422: UVIS SOFA and Lamp Checks. WFC3 ISR Nov Hilbert, B. and P. McCullough, 2009a. WFC3 SMOV Program 11447: IR Channel Dark Current, Readnoise and Background Signal. WFC3 ISR Nov Hilbert, B., and P. McCullough, 2009b WFC3 SMOV Program 11420: IR Channel Functional Tests. WFC3 ISR Nov Pirzkal, N., NICMOS ISR : CalTempFromBias: Implementation and Testing. NICMOS ISR Nov
15 Appendix 1 Visit Filename Filter Sample Sequence / Exposure Light Leak # Reads Time (sec) 1 iaak01agq F110W RAPID / iaak01ahq F125W SPARS10 / iaak01aiq F130N SPARS100 / Not Predicted 1 iaak01akq F110W RAPID / iaak01alq F153M SPARS50 / iaak01amq F153M SPARS50 / iaak02giq F140W RAPID / iaak02gjq F125W SPARS10 / iaak02gkq F130N SPARS100 / iaak02gmq F140W RAPID / iaak02gnq F139M SPARS50 / iaak02goq F139M SPARS50 / iaak03idq F160W SPARS10 / iaak03ieq F160W SPARS10 / iaak03ifq F128N SPARS100 / iaak03ihq F127M SPARS50 / iaak03iiq F127M SPARS50 / iaak04i6q F105W SPARS10 / iaak04i7q F105W SPARS10 / iaak04i8q F128N SPARS100 / Predicted 4 iaak04iaq F098M SPARS50 / iaak04ibq F098M SPARS50 / Predicted 5 iaak05ikq F125W SPARS10 / iaak05ilq F105W SPARS10 / iaak05imq F160W SPARS10 / iaak05inq F126N SPARS100 / iaak05iqq F140W RAPID / iaak05irq F110W RAPID / iaak06izq F139M SPARS50 / iaak06j0q F132N SPARS100 / iaak06j1q F127M SPARS50 / iaak07j9q F167N SPARS100 / iaak07jaq F164N SPARS100 / iaak08jeq F125W SPARS10 / iaak08jfq F110W RAPID / iaak08jgq F130N SPARS100 / Not Predicted 8 iaak08jiq F153M SPARS50 / iaak08jjq F110W RAPID / Predicted 15
16 8 iaak08jkq F153M SPARS50 / Predicted 9 iaak09joq F125W SPARS10 / iaak09jpq F140W RAPID / iaak09jqq F130N SPARS100 / iaak09jsq F139M SPARS50 / iaak09jtq F140W RAPID / iaak09juq F139M SPARS50 / iaak10kgq F127M SPARS50 / iaak10khq F160W SPARS10 / iaak10kiq F128N SPARS100 / Predicted 10 iaak10kkq F127M SPARS50 / iaak10klq F160W SPARS10 / iaak11kvq F105W SPARS10 / iaak11kwq F098M SPARS50 / iaak11kxq F128N SPARS100 / iaak11kzq F105W SPARS10 / iaak11l0q F098M SPARS50 / iaak12lxq F105W SPARS10 / Predicted 12 iaak12lyq F110W RAPID / Predicted 12 iaak12lzq F126N SPARS100 / Predicted 12 iaak12m2q F140W RAPID / iaak12m3q F160W SPARS10 / iaak12m4q F125W SPARS10 / iaak13jyq F127M SPARS50 / iaak13jzq F132N SPARS100 / iaak13k0q F139M SPARS50 / Predicted 14 iaak14lmq F164N SPARS100 / iaak14lnq F167N SPARS100 / iaak15mgq F110W RAPID / iaak15mhq F125W SPARS10 / iaak15miq F130N SPARS100 / Predicted 15 iaak15mkq F110W RAPID / Predicted 15 iaak15mlq F153M SPARS50 / Predicted 15 iaak15mmq F153M SPARS50 / Predicted 16 iaak16n1q F140W RAPID / iaak16n2q F125W SPARS10 / iaak16n3q F130N SPARS100 / Predicted 16 iaak16n5q F140W RAPID / Predicted 16 iaak16n6q F139M SPARS50 / Predicted 16 iaak16n7q F139M SPARS50 / Predicted 17 iaak17ngq F160W SPARS10 / iaak17nhq F160W SPARS10 / iaak17niq F128N SPARS100 / iaak17nkq F127M SPARS50 / iaak17nlq F127M SPARS50 / iaak18nrq F105W SPARS10 / Predicted 18 iaak18nsq F105W SPARS10 / Predicted 16
17 18 iaak18ntq F128N SPARS100 / Predicted 18 iaak18nvq F098M SPARS50 / Predicted 18 iaak18nwq F098M SPARS50 / iaak19h0q F125W SPARS10 / Not Predicted 19 iaak19h3q F126N SPARS100 / Predicted 19 iaak19h6q F140W RAPID / iaak19h7q F110W RAPID / Predicted 20 iaak20t9q F139M SPARS50 / iaak20taq F132N SPARS100 / iaak20tbq F127M SPARS50 / Predicted 21 iaak21dqq F167N SPARS100 / Predicted 21 iaak21drq F164N SPARS100 / Predicted 22 iaak22ehq F125W SPARS10 / Not Predicted 22 iaak22eiq F110W RAPID / iaak22ejq F130N SPARS100 / iaak22elq F153M SPARS50 / iaak22emq F110W RAPID / iaak22enq F153M SPARS50 / iaak23evq F125W SPARS10 / Predicted 23 iaak23ewq F140W RAPID / iaak23exq F130N SPARS100 / iaak23ezq F139M SPARS50 / iaak23f0q F140W RAPID / iaak23f1q F139M SPARS50 / iaak24g5q F127M SPARS50 / iaak24g6q F160W SPARS10 / iaak24g7q F128N SPARS100 / iaak24g9q F127M SPARS50 / iaak24gaq F160W SPARS10 / iaak25f4q F105W SPARS10 / iaak25f5q F098M SPARS50 / iaak25f6q F128N SPARS100 / iaak25f8q F105W SPARS10 / iaak25f9q F098M SPARS50 / iaak26ffq F105W SPARS10 / iaak26fgq F110W RAPID / iaak26fhq F126N SPARS100 / iaak26fkq F140W RAPID / iaak26flq F160W SPARS10 / iaak26fmq F125W SPARS10 / iaak27fpq F127M SPARS50 / Not Predicted 27 iaak27fqq F132N SPARS100 / iaak27frq F139M SPARS50 / iaak28fyq F164N SPARS100 / iaak28fzq F167N SPARS100 / iaak29o4q F153M SPARS50 / Not Predicted 29 iaak29oaq F110W RAPID /
18 29 iaak29obq F125W SPARS10 / iaak30hgq F139M SPARS50 / iaak30hhq F139M SPARS50 / iaak30hjq F140W RAPID / iaak30hkq F130N SPARS100 / Predicted 30 iaak30hmq F125W SPARS10 / iaak30hnq F140W RAPID / iaak31omq F127M SPARS50 / iaak31onq F127M SPARS50 / iaak31ooq F128N SPARS100 / iaak31oqq F160W SPARS10 / iaak31orq F160W SPARS10 / iaak32otq F098M SPARS50 / iaak32ouq F098M SPARS50 / iaak32ovq F128N SPARS100 / Predicted 32 iaak32oxq F105W SPARS10 / Predicted 32 iaak32oyq F105W SPARS10 / Predicted 33 iaak33p0q F140W RAPID / iaak33p1q F105W SPARS10 / iaak33p2q F126N SPARS100 / iaak33p5q F160W SPARS10 / iaak33p6q F110W RAPID / iaak33p7q F125W SPARS10 / iaak34niq F139M SPARS50 / Not Predicted 34 iaak34njq F132N SPARS100 / iaak34nkq F127M SPARS50 / iaak35pdq F167N SPARS100 / iaak35peq F164N SPARS100 / iaak36pgq F140W RAPID / iaak36phq F105W SPARS10 / iaak36piq F126N SPARS100 / Predicted 36 iaak36plq F160W SPARS10 / Predicted 36 iaak36pmq F110W RAPID / Predicted 36 iaak36pnq F125W SPARS10 / Predicted 37 iaak37p9q F127M SPARS50 / Not Predicted 37 iaak37paq F139M SPARS50 / Predicted 37 iaak37pbq F132N SPARS100 / Predicted 38 iaak38ptq F167N SPARS100 / iaak38puq F164N SPARS100 / iaak39q0q F105W SPARS10 / iaak39q1q F125W SPARS10 / iaak39q2q F160W SPARS10 / iaak39q3q F126N SPARS100 / iaak39q6q F140W RAPID / iaak39q7q F110W RAPID / iaak40qaq F127M SPARS50 / Not Predicted 40 iaak40qbq F139M SPARS50 /
19 40 iaak40qcq F132N SPARS100 / iaak41qjq F164N SPARS100 / Predicted 41 iaak41qkq F167N SPARS100 / Predicted 42 iaak42ucq F140W RAPID / Not Predicted 42 iaak42udq F105W SPARS10 / iaak42ueq F126N SPARS100 / Predicted 42 iaak42uhq F160W SPARS10 / Predicted 42 iaak42uiq F110W RAPID / Predicted 42 iaak42ujq F125W SPARS10 / Predicted 43 iaak43qmq F127M SPARS50 / iaak43qnq F139M SPARS50 / iaak43qoq F132N SPARS100 / iaak44v6q F167N SPARS100 / iaak44v7q F164N SPARS100 / iaak45veq F105W SPARS10 / iaak45vfq F125W SPARS10 / iaak45vgq F160W SPARS10 / iaak45vhq F126N SPARS100 / iaak45vkq F140W RAPID / iaak45vlq F110W RAPID / Predicted 46 iaak46tsq F127M SPARS50 / Not Predicted 46 iaak46ttq F139M SPARS50 / iaak46tuq F132N SPARS100 / iaak47vnq F164N SPARS100 / iaak47voq F167N SPARS100 / iaak48vuq F140W RAPID / iaak48vvq F105W SPARS10 / iaak48vwq F126N SPARS100 / iaak48vzq F160W SPARS10 / iaak48w0q F110W RAPID / iaak48w1q F125W SPARS10 / iaak49hvq F127M SPARS50 / Not Predicted 49 iaak49hwq F139M SPARS50 / iaak49hxq F132N SPARS100 / Not Predicted 50 iaak50l5q F167N SPARS100 / Predicted 50 iaak50l6q F164N SPARS100 / Predicted Table 4: Data table for flat fields. Files labeled as Predicted in the right-most column were contaminated by a light leak that was predicted based on HST s orientation. Files labeled with Not Predicted were also contaminated by light leak despite information on HST s orientation suggesting that they would be uncontaminated. Both Predicted and Not Predicted light leak files were excluded from data analyses. 19
20 Tables 5 and 6 list the reference files used by CALWF3 to process the data collected in proposal number Table 5: Reference files used for all ramps collected in this proposal. Darkfile names are listed in the table below, as we have a different dark current calibration file for each sample sequence. Files listed in both of these tables can be downloaded from the HST archive. File Filename Purpose BPIXTAB t291659ni_bpx.fits Bad pixel table CCDTAB t2c16200i_ccd.fits Detector calibration parameters OSCNTAB q911321mi_osc.fits Detector overscan table CRREJTAB t3j1659ki_crr.fits Cosmic ray rejection parameters DARKFILE See Table 6 Dark current correction ramp NLINFILE sbi18555i_lin.fits Non-linearity correction coefficients GRAPHTAB t m_tmg.fits HST graph table COMPTAB t6i1714pm_tmc.fits HST components table Sample Sequence RAPID SPARS10 SPARS50 SPARS100 Dark File for CALWF3 t i_drk.fits t611932di_drk.fits t611932ji_drk.fits t611932bi_drk.fits Table 6: Dark current correction ramps used by CALWF3 for processing the internal flat field ramps. 20

21 Appendix 2 Light leak morphologies through each IR filter. 21
22 22
WFC3/IR Bad Pixel Table: Update Using Cycle 17 Data
 Instrument Science Report WFC3 2010-13 WFC3/IR Bad Pixel Table: Update Using Cycle 17 Data B. Hilbert and H. Bushouse August 26, 2010 ABSTRACT Using data collected during Servicing Mission Observatory
WFC3/IR Cycle 19 Bad Pixel Table Update
 Instrument Science Report WFC3 2012-10 WFC3/IR Cycle 19 Bad Pixel Table Update B. Hilbert June 08, 2012 ABSTRACT Using data from Cycles 17, 18, and 19, we have updated the IR channel bad pixel table for
WFC3/IR Channel Behavior: Dark Current, Bad Pixels, and Count Non-Linearity
 The 2010 STScI Calibration Workshop Space Telescope Science Institute, 2010 Susana Deustua and Cristina Oliveira, eds. WFC3/IR Channel Behavior: Dark Current, Bad Pixels, and Count Non-Linearity Bryan
WFC3 TV3 Testing: IR Channel Nonlinearity Correction
 Instrument Science Report WFC3 2008-39 WFC3 TV3 Testing: IR Channel Nonlinearity Correction B. Hilbert 2 June 2009 ABSTRACT Using data taken during WFC3's Thermal Vacuum 3 (TV3) testing campaign, we have
WFC3 SMOV Program 11427: UVIS Channel Shutter Shading
 Instrument Science Report WFC3 2009-25 WFC3 SMOV Program 11427: UVIS Channel Shutter Shading B. Hilbert June 23, 2010 ABSTRACT A series of internal flat field images and standard star observations were
WFC3 SMOV Proposal 11422/ 11529: UVIS SOFA and Lamp Checks
 WFC3 SMOV Proposal 11422/ 11529: UVIS SOFA and Lamp Checks S.Baggett, E.Sabbi, and P.McCullough November 12, 2009 ABSTRACT This report summarizes the results obtained from the SMOV SOFA (Selectable Optical
Interpixel Capacitance in the IR Channel: Measurements Made On Orbit
 Interpixel Capacitance in the IR Channel: Measurements Made On Orbit B. Hilbert and P. McCullough April 21, 2011 ABSTRACT Using high signal-to-noise pixels in dark current observations, the magnitude of
WFC3 TV2 Testing: UVIS Shutter Stability and Accuracy
 Instrument Science Report WFC3 2007-17 WFC3 TV2 Testing: UVIS Shutter Stability and Accuracy B. Hilbert 15 August 2007 ABSTRACT Images taken during WFC3's Thermal Vacuum 2 (TV2) testing have been used
Anomalies and Artifacts of the WFC3 UVIS and IR Detectors: An Overview
 The 2010 STScI Calibration Workshop Space Telescope Science Institute, 2010 Susana Deustua and Cristina Oliveira, eds. Anomalies and Artifacts of the WFC3 UVIS and IR Detectors: An Overview M. J. Dulude,
Overview of the WFC3 Cycle 17 Detector Monitoring Campaign
 Instrument Science Report WFC3 2009-07 Overview of the WFC3 Cycle 17 Detector Monitoring Campaign Michael H. Wong, Sylvia M. Baggett, Susana Deustua, Tiffany Borders, André Martel, Bryan Hilbert, Jason
WFC3 UVIS Ground P-flats
 Instrument Science Report WFC3 2008-046 WFC3 UVIS Ground P-flats E. Sabbi, M. Dulude, A.R. Martel, S. Baggett, H. Bushouse June 12, 2009 ABSTRACT The Wide Field Camera 3 (WFC3) has two channels, one designed
Temperature Dependent Dark Reference Files: Linear Dark and Amplifier Glow Components
 Instrument Science Report NICMOS 2009-002 Temperature Dependent Dark Reference Files: Linear Dark and Amplifier Glow Components Tomas Dahlen, Elizabeth Barker, Eddie Bergeron, Denise Smith July 01, 2009
Use of the Shutter Blade Side A for UVIS Short Exposures
 Instrument Science Report WFC3 2014-009 Use of the Shutter Blade Side A for UVIS Short Exposures Kailash Sahu, Sylvia Baggett, J. MacKenty May 07, 2014 ABSTRACT WFC3 UVIS uses a shutter blade with two
SPACE TELESCOPE SCIENCE INSTITUTE Operated for NASA by AURA
 SPACE TELESCOPE SCIENCE INSTITUTE Operated for NASA by AURA Instrument Science Report WFC3 2010-08 WFC3 Pixel Area Maps J. S. Kalirai, C. Cox, L. Dressel, A. Fruchter, W. Hack, V. Kozhurina-Platais, and
WFC3 TV2 Testing: UVIS Filtered Throughput
 WFC3 TV2 Testing: UVIS Filtered Throughput Thomas M. Brown Oct 25, 2007 ABSTRACT During the most recent WFC3 thermal vacuum (TV) testing campaign, several tests were executed to measure the UVIS channel
WFC3 Post-Flash Calibration
 Instrument Science Report WFC3 2013-12 WFC3 Post-Flash Calibration J. Biretta and S. Baggett June 27, 2013 ABSTRACT We review the Phase II implementation of the WFC3/UVIS post-flash capability, as well
WFC3 Thermal Vacuum Testing: UVIS Science Performance Monitor
 WFC3 Thermal Vacuum Testing: UVIS Science Performance Monitor H. Bushouse and O. Lupie May 24, 2005 ABSTRACT During WFC3 thermal-vacuum testing in September and October 2004, the UVIS28 test procedure,
A Test of non-standard Gain Settings for the NICMOS Detectors
 Instrument Science Report NICMOS 23-6 A Test of non-standard Gain Settings for the NICMOS Detectors Chun Xu & Torsten Böker 2 May, 23 ABSTRACT We report on the results of a test program to explore the
WFC3 Thermal Vacuum Testing: UVIS Broadband Flat Fields
 WFC3 Thermal Vacuum Testing: UVIS Broadband Flat Fields H. Bushouse June 1, 2005 ABSTRACT During WFC3 thermal-vacuum testing in September and October 2004, a subset of the UVIS20 test procedure, UVIS Flat
Flux Calibration Monitoring: WFC3/IR G102 and G141 Grisms
 Instrument Science Report WFC3 2014-01 Flux Calibration Monitoring: WFC3/IR and Grisms Janice C. Lee, Norbert Pirzkal, Bryan Hilbert January 24, 2014 ABSTRACT As part of the regular WFC3 flux calibration
Master sky images for the WFC3 G102 and G141 grisms
 Master sky images for the WFC3 G102 and G141 grisms M. Kümmel, H. Kuntschner, J. R. Walsh, H. Bushouse January 4, 2011 ABSTRACT We have constructed master sky images for the WFC3 near-infrared G102 and
Determination of the STIS CCD Gain
 Instrument Science Report STIS 2016-01(v1) Determination of the STIS CCD Gain Allyssa Riley 1, TalaWanda Monroe 1, Sean Lockwood 1 1 Space Telescope Science Institute, Baltimore, MD 29 September 2016 ABSTRACT
WFC3 Post-Observation Systems
 WFC3 Training Session 3 WFC3 Post-Observation Systems Howard Bushouse 1 Overview WFC3 OPUS pipeline and calibration largely based on existing ACS and NICMOS procedures Our WFC3 mantra: just like ACS Very
The 0.84 m Telescope OAN/SPM - BC, Mexico
 The 0.84 m Telescope OAN/SPM - BC, Mexico Readout error CCD zero-level (bias) ramping CCD bias frame banding Shutter failure Significant dark current Image malting Focus frame taken during twilight IR
WFC3/UVIS TV3 Post-flash Results
 Technical Instrument Report WFC3 2012-01 WFC3/UVIS TV3 Post-flash Results S. Baggett and T. Wheeler March 29, 2012 Abstract Given recent interest in potentially reviving the WFC3 post-flash capability,
High Contrast Imaging using WFC3/IR
 SPACE TELESCOPE SCIENCE INSTITUTE Operated for NASA by AURA WFC3 Instrument Science Report 2011-07 High Contrast Imaging using WFC3/IR A. Rajan, R. Soummer, J.B. Hagan, R.L. Gilliland, L. Pueyo February
No Evidence Found for WFC3/UVIS QE Overshoot
 1 SPACE TELESCOPE SCIENCE INSTITUTE Operated for NASA by AURA Instrument Science Report WFC3 2014-13 No Evidence Found for WFC3/UVIS QE Overshoot M. Bourque, S. Baggett, & L. Dressel May 29, 2014 ABSTRACT
CCD reductions techniques
 CCD reductions techniques Origin of noise Noise: whatever phenomena that increase the uncertainty or error of a signal Origin of noises: 1. Poisson fluctuation in counting photons (shot noise) 2. Pixel-pixel
UVIS 2.0: Chip-Dependent Flats
 Instrument Science Report WFC3 2016-04 UVIS 2.0: Chip-Dependent Flats J. Mack, T. Dahlen, E. Sabbi, & A. S. Bowers March 08, 2016 ABSTRACT An improved set of flat fields was delivered to the HST archive
WFC3 TV3 Testing: UVIS-1 Crosstalk
 WFC3 TV3 Testing: UVIS-1 Crosstalk S.Baggett May 6, 2009 ABSTRA This report summarizes the behavior of the crosstalk in the Wide Field Camera 3 UVIS-1 flight detector based on thermal-vacuum data taken
Assessing ACS/WFC Sky Backgrounds
 Instrument Science Report ACS 2012-04 Assessing ACS/WFC Sky Backgrounds Josh Sokol, Jay Anderson, Linda Smith July 31, 2012 ABSTRACT This report compares the on-orbit sky background levels present in Cycle
STIS CCD Saturation Effects
 SPACE TELESCOPE SCIENCE INSTITUTE Operated for NASA by AURA Instrument Science Report STIS 2015-06 (v1) STIS CCD Saturation Effects Charles R. Proffitt 1 1 Space Telescope Science Institute, Baltimore,
New Bad Pixel Mask Reference Files for the Post-NCS Era
 Instrument Science Report NICMOS 2009-001 New Bad Pixel Mask Reference Files for the Post-NCS Era Elizabeth A. Barker and Tomas Dahlen June 08, 2009 ABSTRACT The last determined bad pixel masks for the
FLAT FIELDS FOR FILTER WHEEL OFFSET POSITIONS
 FLAT FIELDS FOR FILTER WHEEL OFFSET POSITIONS R. C. Bohlin, T. Wheeler, and J. Mack October 29, 2003 ABSTRACT The ACS filter wheel movements are accurate to one motor step, which leads to errors that exceed
CCD Characteristics Lab
 CCD Characteristics Lab Observational Astronomy 6/6/07 1 Introduction In this laboratory exercise, you will be using the Hirsch Observatory s CCD camera, a Santa Barbara Instruments Group (SBIG) ST-8E.
WFC3 TV2 Testing: UVIS-2 Amp B Anomaly
 WFC3 TV2 Testing: UVIS-2 Amp B Anomaly S. Baggett, A. Waczynski Oct 19, 07 ABSTRACT Thermal-vacuum (TV) level tests using the integrated WFC3 instrument were performed at Goddard Space Flight Center (GSFC)
2017 Update on the WFC3/UVIS Stability and Contamination Monitor
 Instrument Science Report WFC3 2017-15 2017 Update on the WFC3/UVIS Stability and Contamination Monitor C. E. Shanahan, C. M. Gosmeyer, S. Baggett June 9, 2017 ABSTRACT The photometric throughput of the
Wavelength Calibration Accuracy of the First-Order CCD Modes Using the E1 Aperture
 Wavelength Calibration Accuracy of the First-Order CCD Modes Using the E1 Aperture Scott D. Friedman August 22, 2005 ABSTRACT A calibration program was carried out to determine the quality of the wavelength
Comparing Aperture Photometry Software Packages
 Comparing Aperture Photometry Software Packages V. Bajaj, H. Khandrika April 6, 2017 Abstract Multiple software packages exist to perform aperture photometry on HST data. Three of the most used softwares
STIS CCD Anneals. 1. Introduction. Instrument Science Report STIS Revision A
 Instrument Science Report STIS 98-06-Revision A STIS CCD Anneals Jeffrey J.E. Hayes, Jennifer A. Christensen, Paul Goudfrooij March 1998 ABSTRACT In this ISR we outline the comprehensive monitoring program
Summary Report for FIRE Spectrometer HgCdTe Detector Array
 Summary Report for FIRE Spectrometer HgCdTe Detector Array Craig W. McMurtry, Judith L. Pipher and William J. Forrest University of Rochester, Rochester, NY, USA ABSTRACT This is a summary report covering
FLATS: SBC INTERNAL LAMP P-FLAT
 Instrument Science Report ACS 2005-04 FLATS: SBC INTERNAL LAMP P-FLAT R. C. Bohlin & J. Mack May 2005 ABSTRACT The internal deuterium lamp was used to illuminate the SBC detector through the F125LP filter
NIRSpec Technical Note NTN / ESA-JWST-TN Authors: G. Giardino, S. Birkmann, M. Sirianni Date of Issue: 9 Nov Version: 1.
 NIRSpec Technical Note NTN-2011-005 / ESA-JWST-TN-18258 Authors: G. Giardino, S. Birkmann, M. Sirianni Date of Issue: 9 Nov. 2011 Version: 1.1 estec European Space Research and Technology Centre Keplerlaan
Padova and Asiago Observatories
 ISSN 1594-1906 Padova and Asiago Observatories The Echelle E2V CCD47-10 CCD H. Navasardyan, M. D'Alessandro, E. Giro, Technical Report n. 22 September 2004 Document available at: http://www.pd.astro.it/
New Bad Pixel Mask Reference Files for the Post-NCS Era
 The 2010 STScI Calibration Workshop Space Telescope Science Institute, 2010 Susana Deustua and Cristina Oliveira, eds. New Bad Pixel Mask Reference Files for the Post-NCS Era Elizabeth A. Barker and Tomas
What an Observational Astronomer needs to know!
 What an Observational Astronomer needs to know! IRAF:Photometry D. Hatzidimitriou Masters course on Methods of Observations and Analysis in Astronomy Basic concepts Counts how are they related to the actual
The NICMOS CALNICA and CALNICB Pipelines
 1997 HST Calibration Workshop Space Telescope Science Institute, 1997 S. Casertano, et al., eds. The NICMOS CALNICA and CALNICB Pipelines Howard Bushouse Space Telescope Science Institute, 3700 San Martin
Cross-Talk in the ACS WFC Detectors. II: Using GAIN=2 to Minimize the Effect
 Cross-Talk in the ACS WFC Detectors. II: Using GAIN=2 to Minimize the Effect Mauro Giavalisco August 10, 2004 ABSTRACT Cross talk is observed in images taken with ACS WFC between the four CCD quadrants
FLAT FIELD DETERMINATIONS USING AN ISOLATED POINT SOURCE
 Instrument Science Report ACS 2015-07 FLAT FIELD DETERMINATIONS USING AN ISOLATED POINT SOURCE R. C. Bohlin and Norman Grogin 2015 August ABSTRACT The traditional method of measuring ACS flat fields (FF)
HST Mission - Standard Operations WFPC2 Reprocessing NICMOS Reprocessing
 HST Mission - Standard Operations WFPC2 Reprocessing NICMOS Reprocessing Helmut Jenkner Space Telescope Users Committee Meeting 13 November 2008 WFPC2 Reprocessing As part of the WFPC2 decommissioning
HST and JWST Photometric Calibration. Susana Deustua Space Telescope Science Institute
 HST and JWST Photometric Calibration Susana Deustua Space Telescope Science Institute Charge On the HST (and JWST) photometric calibrators, in particular the white dwarf standards including concept for
WFC3/UVIS Sky Backgrounds
 Instrument Science Report WFC3 2012-12 v.1.1 WFC3/UVIS Sky Backgrounds Sylvia Baggett & Jay Anderson June 28, 2012 ABSTRACT This report summarizes the on-orbit background levels present in WFC3/UVIS full-frame
WFC3 SMOV Programs 11436/8: UVIS On-orbit PSF Evaluation
 Instrument Science Report WFC3 2009-38 WFC3 SMOV Programs 11436/8: UVIS On-orbit PSF Evaluation G. F. Hartig 10 November 2009 ABSTRACT We have assessed the image quality of the WFC3 UVIS channel on orbit,
Observing*Checklist:*A3ernoon*
 Ay#122a:# Intro#to#Observing/Image#Processing# (Many&slides&today& c/o&m.&bolte)& Observing*Checklist:*A3ernoon* Set*up*instrument*(verify*and*set*filters,*gra@ngs,*etc.)* Set*up*detector*(format,*gain,*binning)*
WFPC2 Status and Plans
 WFPC2 Status and Plans John Biretta STUC Meeting 12 April 2007 WFPC2 Status Launched Dec. 1993 ~15 yrs old by end of Cycle 16 Continues to operate well Liens on performance: - CTE from radiation damage
CHAPTER 6 Exposure Time Calculations
 CHAPTER 6 Exposure Time Calculations In This Chapter... Overview / 75 Calculating NICMOS Imaging Sensitivities / 78 WWW Access to Imaging Tools / 83 Examples / 84 In this chapter we provide NICMOS-specific
This release contains deep Y-band images of the UDS field and the extracted source catalogue.
 ESO Phase 3 Data Release Description Data Collection HUGS_UDS_Y Release Number 1 Data Provider Adriano Fontana Date 22.09.2014 Abstract HUGS (an acronym for Hawk-I UDS and GOODS Survey) is a ultra deep
New Exposure Time Calculator for NICMOS (imaging): Features, Testing and Recommendations
: Features, Testing and Recommendations") Instrument Science Report NICMOS 2004-002 New Exposure Time Calculator for NICMOS (imaging): Features, Testing and Recommendations S.Arribas, D. McLean, I. Busko, and M. Sosey February 26, 2004 ABSTRACT
Instrument Science Report NICMOS 2004-002 New Exposure Time Calculator for NICMOS (imaging): Features, Testing and Recommendations S.Arribas, D. McLean, I. Busko, and M. Sosey February 26, 2004 ABSTRACT
Temperature Reductions to Mitigate the WF4 Anomaly
 Instrument Science Report WFPC2 2007-01 Temperature Reductions to Mitigate the WF4 Anomaly V. Dixon, J. Biretta, S. Gonzaga, and M. McMaster April 18, 2007 ABSTRACT The WF4 anomaly is characterized by
Processing ACA Monitor Window Data
 Processing ACA Monitor Window Data CIAO 3.4 Science Threads Processing ACA Monitor Window Data 1 Table of Contents Processing ACA Monitor Window Data CIAO 3.4 Background Information Get Started Obtaining
Properties of a Detector
 Properties of a Detector Quantum Efficiency fraction of photons detected wavelength and spatially dependent Dynamic Range difference between lowest and highest measurable flux Linearity detection rate
Sink Pixels and CTE in the WFC3/UVIS Detector
 Instrument Science Report WFC3 2014-19 Sink Pixels and CTE in the WFC3/UVIS Detector Jay Anderson and Sylvia Baggett June 13, 2014 ABSTRACT Post-flashed calibration products have highlighted a previously
Limits on Reciprocity Failure in 1.7mm cut-off NIR astronomical detectors
 Limits on Reciprocity Failure in 1.7mm cut-off NIR astronomical detectors Wolfgang Lorenzon T. Biesiadzinski, R. Newman, M. Schubnell, G. Tarle, C. Weaverdyck Detectors for Astronomy, ESO Garching, 12-16
INTRODUCTION TO CCD IMAGING
 ASTR 1030 Astronomy Lab 85 Intro to CCD Imaging INTRODUCTION TO CCD IMAGING SYNOPSIS: In this lab we will learn about some of the advantages of CCD cameras for use in astronomy and how to process an image.
Persistence Characterisation of Teledyne H2RG detectors
 Persistence Characterisation of Teledyne H2RG detectors Simon Tulloch European Southern Observatory, Karl Schwarzschild Strasse 2, Garching, 85748, Germany. Abstract. Image persistence is a major problem
Wide Field Camera 3: Design, Status, and Calibration Plans
 2002 HST Calibration Workshop Space Telescope Science Institute, 2002 S. Arribas, A. Koekemoer, and B. Whitmore, eds. Wide Field Camera 3: Design, Status, and Calibration Plans John W. MacKenty Space Telescope
A repository of precision flatfields for high resolution MDI continuum data
 Solar Physics DOI: 10.7/ - - - - A repository of precision flatfields for high resolution MDI continuum data H.E. Potts 1 D.A. Diver 1 c Springer Abstract We describe an archive of high-precision MDI flat
Camera Test Protocol. Introduction TABLE OF CONTENTS. Camera Test Protocol Technical Note Technical Note
 Technical Note CMOS, EMCCD AND CCD CAMERAS FOR LIFE SCIENCES Camera Test Protocol Introduction The detector is one of the most important components of any microscope system. Accurate detector readings
ARRAY CONTROLLER REQUIREMENTS
 ARRAY CONTROLLER REQUIREMENTS TABLE OF CONTENTS 1 INTRODUCTION...3 1.1 QUANTUM EFFICIENCY (QE)...3 1.2 READ NOISE...3 1.3 DARK CURRENT...3 1.4 BIAS STABILITY...3 1.5 RESIDUAL IMAGE AND PERSISTENCE...4
Image Processing Tutorial Basic Concepts
 Image Processing Tutorial Basic Concepts CCDWare Publishing http://www.ccdware.com 2005 CCDWare Publishing Table of Contents Introduction... 3 Starting CCDStack... 4 Creating Calibration Frames... 5 Create
Astronomy 341 Fall 2012 Observational Astronomy Haverford College. CCD Terminology
 CCD Terminology Read noise An unavoidable pixel-to-pixel fluctuation in the number of electrons per pixel that occurs during chip readout. Typical values for read noise are ~ 10 or fewer electrons per
TIRCAM2 (TIFR Near Infrared Imaging Camera - 3.6m Devasthal Optical Telescope (DOT)
") TIRCAM2 (TIFR Near Infrared Imaging Camera - II) @ 3.6m Devasthal Optical Telescope (DOT) (ver 4.0 June 2017) TIRCAM2 (TIFR Near Infrared Imaging Camera - II) is a closed cycle cooled imager that has been
TIRCAM2 (TIFR Near Infrared Imaging Camera - II) @ 3.6m Devasthal Optical Telescope (DOT) (ver 4.0 June 2017) TIRCAM2 (TIFR Near Infrared Imaging Camera - II) is a closed cycle cooled imager that has been
Cerro Tololo Inter-American Observatory. CHIRON manual. A. Tokovinin Version 2. May 25, 2011 (manual.pdf)
") Cerro Tololo Inter-American Observatory CHIRON manual A. Tokovinin Version 2. May 25, 2011 (manual.pdf) 1 1 Overview Calibration lamps Quartz, Th Ar Fiber Prism Starlight GAM mirror Fiber Viewer FEM Guider
Cerro Tololo Inter-American Observatory CHIRON manual A. Tokovinin Version 2. May 25, 2011 (manual.pdf) 1 1 Overview Calibration lamps Quartz, Th Ar Fiber Prism Starlight GAM mirror Fiber Viewer FEM Guider
Post-Flash Calibration Darks for the Advanced Camera for Surveys Wide Field Channel (ACS/WFC)
") Instrument Science Report ACS 2015-03 Post-Flash Calibration Darks for the Advanced Camera for Surveys Wide Field Channel (ACS/WFC) S. Ogaz, J. Anderson & D. Golimowski June, 23 2015 Abstract We present
Instrument Science Report ACS 2015-03 Post-Flash Calibration Darks for the Advanced Camera for Surveys Wide Field Channel (ACS/WFC) S. Ogaz, J. Anderson & D. Golimowski June, 23 2015 Abstract We present
Pixel Response Effects on CCD Camera Gain Calibration
 1 of 7 1/21/2014 3:03 PM HO M E P R O D UC T S B R IE F S T E C H NO T E S S UP P O RT P UR C HA S E NE W S W E B T O O L S INF O C O NTA C T Pixel Response Effects on CCD Camera Gain Calibration Copyright
WEBCAMS UNDER THE SPOTLIGHT
 WEBCAMS UNDER THE SPOTLIGHT MEASURING THE KEY PERFORMANCE CHARACTERISTICS OF A WEBCAM BASED IMAGER Robin Leadbeater Q-2006 If a camera is going to be used for scientific measurements, it is important to
PACS. Optimum detector bias settings for Ge:Ga detectors, Time constant: bias change spectrometer IMT 509
 Test Analysis Report FM-ILT/IST Page 1 Optimum detector bias settings for Ge:Ga detectors, Time constant: bias change spectrometer IMT 509 J. Schreiber 1, U. Klaas 1, H. Dannerbauer 1, M. Nielbock 1, J.
CCD User s Guide SBIG ST7E CCD camera and Macintosh ibook control computer with Meade flip mirror assembly mounted on LX200
 Massachusetts Institute of Technology Department of Earth, Atmospheric, and Planetary Sciences Handout 8 /week of 2002 March 18 12.409 Hands-On Astronomy, Spring 2002 CCD User s Guide SBIG ST7E CCD camera
GO Added Near-IR Fringe Flats (Rev. A)
") Instrument Science Report STIS 97-15 GO Added Near-IR Fringe Flats (Rev. A) S. Baum, Harry Ferguson, J. R. Walsh, P. Goudfrooij, R. Downes, and H. Lanning December 1, 1997 (Revised November 12, 1998) ABSTRACT
Instrument Science Report STIS 97-15 GO Added Near-IR Fringe Flats (Rev. A) S. Baum, Harry Ferguson, J. R. Walsh, P. Goudfrooij, R. Downes, and H. Lanning December 1, 1997 (Revised November 12, 1998) ABSTRACT
Photometry of the variable stars using CCD detectors
 Contrib. Astron. Obs. Skalnaté Pleso 35, 35 44, (2005) Photometry of the variable stars using CCD detectors I. Photometric reduction. Š. Parimucha 1, M. Vaňko 2 1 Institute of Physics, Faculty of Natural
a simple optical imager
 Imagers and Imaging a simple optical imager Here s one on our 61-Inch Telescope Here s one on our 61-Inch Telescope filter wheel in here dewar preamplifier However, to get a large field we cannot afford
WFC Zeropoints at -80C
 WFC Zeropoints at -80C J. Mack, R. L. Gilliland, J. Anderson, & M. Sirianni May 2, 2007 ABSTRACT Following the recovery of ACS with the side-2 electronics in July 2006, the temperature of the WFC detector
First Results from Contamination Monitoring with the WFC3 UVIS G280 Grism
 WFC3 Instrument Science Report 211-18 First Results from Contamination Monitoring with the WFC3 UVIS G28 Grism B. Rothberg, N. Pirzkal, S. Baggett November 2, 211 ABSTRACT The presence of contaminants
Stellar Photometry: I. Measuring. Ast 401/Phy 580 Fall 2014
 What s Left (Today): Introduction to Photometry Nov 10 Photometry I/Spectra I Nov 12 Spectra II Nov 17 Guest lecture on IR by Trilling Nov 19 Radio lecture by Hunter Nov 24 Canceled Nov 26 Thanksgiving
On-orbit properties of the NICMOS detectors on HST
 On-orbit properties of the NICMOS detectors on HST C. J. Skinner a, L. E. Bergeron b, A. B. Schultz c, J. W. MacKenty b, A. Storrs b, W. Freudling d, D. Axon a, H. Bushouse b, D. Calzetti b, L. Colina
Spectral Analysis of the LUND/DMI Earthshine Telescope and Filters
 Spectral Analysis of the LUND/DMI Earthshine Telescope and Filters 12 August 2011-08-12 Ahmad Darudi & Rodrigo Badínez A1 1. Spectral Analysis of the telescope and Filters This section reports the characterization
Charged-Coupled Devices
 Charged-Coupled Devices Charged-Coupled Devices Useful texts: Handbook of CCD Astronomy Steve Howell- Chapters 2, 3, 4.4 Measuring the Universe George Rieke - 3.1-3.3, 3.6 CCDs CCDs were invented in 1969
WFC3/UVIS Updated 2017 Chip- Dependent Inverse Sensitivity Values
 Instrument Science Report WFC3 2017-14 WFC3/UVIS Updated 2017 Chip- Dependent Inverse Sensitivity Values S.E. Deustua, J. Mack, V. Bajaj, H. Khandrika June 12, 2017 ABSTRACT We present chip-dependent inverse
[90.03] Status of the HST Wide Field Camera 3
![[90.03] Status of the HST Wide Field Camera 3](/thumbs/72/67447486.jpg "[90.03] Status of the HST Wide Field Camera 3") [90.03] Status of the HST Wide Field Camera 3 J.W. MacKenty (STScI), R.A. Kimble (NASA/GSFC), WFC3 Team The Wide Field Camera 3 is under construction for a planned deployment in the Hubble Space Telescope
[90.03] Status of the HST Wide Field Camera 3 J.W. MacKenty (STScI), R.A. Kimble (NASA/GSFC), WFC3 Team The Wide Field Camera 3 is under construction for a planned deployment in the Hubble Space Telescope
ISIS A beginner s guide
 ISIS A beginner s guide Conceived of and written by Christian Buil, ISIS is a powerful astronomical spectral processing application that can appear daunting to first time users. While designed as a comprehensive
ObsAstro Documentation
 ObsAstro Documentation Release 0.1 Matthew Craig, Juan Cabanela & Linda Winkler February 18, 2014 Contents i ii Contents: Contents 1 2 Contents CHAPTER 1 Basic image statistics Contents: 1.1 Before you
The Noise about Noise
 The Noise about Noise I have found that few topics in astrophotography cause as much confusion as noise and proper exposure. In this column I will attempt to present some of the theory that goes into determining
Flux Calibration of the ACS CCD Cameras III. Sensitivity Changes over Time
 SPACE TELESCOPE SCIENCE INSTITUTE Operated for NASA by AURA Instrument Science Report ACS 2011-03 Flux Calibration of the ACS CCD Cameras III. Sensitivity Changes over Time Ralph C. Bohlin, Jennifer Mack,
ObsAstro Documentation
 ObsAstro Documentation Release 0.1 Matthew Craig, Juan Cabanela & Linda Winkler February 18, 2014 Contents 1 Basic image statistics 3 1.1 Before you begin.............................................
COS Near-UV Flat Fields and High S/N Determination from SMOV Data
 COS Instrument Science Report 2010-03(v1) COS Near-UV Flat Fields and High S/N Determination from SMOV Data Thomas B. Ake 1, Eric B. Burgh 2, and Steven V. Penton 2 1 Space Telescope Science Institute,
Charged Coupled Device (CCD) S.Vidhya
 S.Vidhya") Charged Coupled Device (CCD) S.Vidhya 02.04.2016 Sensor Physical phenomenon Sensor Measurement Output A sensor is a device that measures a physical quantity and converts it into a signal which can be read
Charged Coupled Device (CCD) S.Vidhya 02.04.2016 Sensor Physical phenomenon Sensor Measurement Output A sensor is a device that measures a physical quantity and converts it into a signal which can be read
Global Erratum for Kepler Q0-Q17 & K2 C0-C5 Short-Cadence Data
 Global Erratum for Kepler Q0-Q17 & K2 C0-C5 Short-Cadence Data KSCI-19080-002 23 March 2016 NASA Ames Research Center Moffett Field, CA 94035 Prepared by: Date Douglas Caldwell, Instrument Scientist Prepared
LSST All-Sky IR Camera Cloud Monitoring Test Results
 LSST All-Sky IR Camera Cloud Monitoring Test Results Jacques Sebag a, John Andrew a, Dimitri Klebe b, Ronald D. Blatherwick c a National Optical Astronomical Observatory, 950 N Cherry, Tucson AZ 85719
ACS/WFC: Differential CTE corrections for Photometry and Astrometry from non-drizzled images
 SPACE TELESCOPE SCIENCE INSTITUTE Operated for NASA by AURA Instrument Science Report ACS 2007-04 ACS/WFC: Differential CTE corrections for Photometry and Astrometry from non-drizzled images Vera Kozhurina-Platais,
Selecting the NIR detectors for Euclid
 National Aeronautics and Space Administration Jet Propulsion Laboratory California Institute of Technology Selecting the NIR detectors for Euclid Stefanie Wachter Michael Seiffert On behalf of the Euclid